Plasmon energy losses in shear bands of metallic glass
Abstract
Shear bands resulting from plastic deformation in cold-rolled Al88Y7Fe5 metallic glass were observed to display alternating density changes along their propagation direction. Electron-energy loss spectroscopy (EELS) was used to investigate the volume plasmon energy losses in and around shear bands. Energy shifts of the peak centre and changes in the peak width (FWHM) reflecting the damping were precisely determined within an accuracy of a few meV using an open source python module (Hyperspy) to fit the shapes of the plasmon and zero-loss peaks with Lorentzian functions. The maximum bulk plasmon energy shifts were calculated for the bright and dark shear band segments relative to the matrix to be about 38 and 14 meV, respectively. The damping was observed to be larger for the denser regions. The analysis presented here suggests that the changes in the plasmons are caused by two contributions: (i) Variable damping in the shear band segments due to changes in the medium-range order (MRO). This affects the static structure factor , which, in turn, leads to either reduced or increased damping according to the Ziman-Baym formula. (ii) The ionic density and the effective electron mass appearing in the zero-momentum plasmon frequency formula are coupled and give rise to small variations in the plasmon energy. The model predicts plasmon energy shifts in the order of meV.
keywords:
metallic glass; electron energy loss spectroscopy; deformation; shear band; volume plasmon1 Introduction
Crystalline materials possess the ability to deform at constant volume along slip planes since the periodicity of the lattice provides identical atomic positions for the sheared material to lock in to. However, in the absence of a lattice, as for example in metallic glasses, this possibility does not exist. As a consequence, the mismatch between sheared zones (shear bands) and surrounding matrix needs to be accommodated by extra volume [1, 2, 3, 4, 5, 6, 7, 8]. Different experimental techniques have provided evidence that the extra volume is present in shear bands [9, 10, 11, 12, 13]. The sheared zones are thus softer than the surrounding matrix enabling the material to flow along them. Therefore, shear bands are associated with structural changes like local dilatation, implying a volume change and thus a change in density. An important issue is hence the local quantification of free volume inside shear bands. Recently, the local density within shear bands of different metallic glasses has been determined relative to the adjacent matrix using high angle dark field scanning transmission electron microscopy (HAADF-STEM) [14, 15, 16, 17, 18]. These experiments showed an alternation of higher and lower density regions along the propagation direction of the shear bands although on average shear bands were less dense than the surrounding matrix. The density changes along shear bands in Al88Y7Fe5 correlated with small deflections along the propagation direction, compositional changes and structural changes in the medium-range order (MRO) [14, 15, 16, 17, 18, 19, 20]. The observation of shear band regions which were denser than the surrounding matrix was initially somewhat unexpected since macroscopic measurements reported dilation only [5, 10, 21].
In this paper we focus on the changes in plasmon energy losses in a shear band of cold-rolled Al88Y7Fe5 metallic glass. The plasmon energy shifts for both higher and lower density shear band segments were calculated relative to the surrounding matrix and found to be about 38 and 14 meV, respectively. The bulk plasmon energy shifts in the shear band are discussed on the basis of inelastic electron-phonon scattering. According to the Ziman-Baym theory, the different local MRO in the shear band segments will affect the first peak of the static structure factor differently and hence affect the damping of the plasmon excitation differently. Moreover, the ionic density and effective electron mass appearing in the plasmon frequency formula at zero-momentum are coupled. This gives rise to small variations in the plasmon energy between the shear band segments and the matrix.
2 Experimental
metallic glass is a marginal glass former. Melt-spun ribbons were produced by rapid quenching from the melt. Details can be found in reference [22]. The amorphous state of the material was confirmed by x-ray diffraction (XRD) and selected area electron diffraction (SAED) prior to deformation. The ribbon material was deformed by cold-rolling yielding a thickness reduction of about . TEM specimens were prepared by twinjet electro-polishing using HNO3:CH3OH in a ratio 1:2 at C applying voltages of about . Microstructural characterization was performed in an FEI S/TEM (Themis3 300) equipped with a high-brightness field-emission gun (X-FEG), quadruple energy-dispersive x-ray detectors (Super-X), HAADF detector (Fischione model 3000) and post-column electron energy loss spectrometer (Gatan Quantum 966 ERS imaging filter (GIF)) and operated at kV with an energy resolution of eV. Drift-corrected spectrum imaging [23] was performed acquiring HAADF-STEM and EELS signals over an area of nm nm using a pixel size of nm nm , a probe current of pA, a dwell-time of ms and a dispersion of eV. The - and - semi-angles were and mrad, respectively. For the EDX elemental mapping a beam current of 4 nA with a total acquisition time of s was used. Plasmon signatures of sheared regions of Al88Y7Fe5 metallic glass were analyzed using automated routines based on an open source python module (Hyperspy) [24] to fit the peak shapes of the zero-loss peak (ZLP) and the plasmon peak with Lorentzian functions [25] in order to determine their centre and width (FWHM) for each data point (pixel) of the spectrum image. The complete code and its description can be found in reference [26].
3 Results
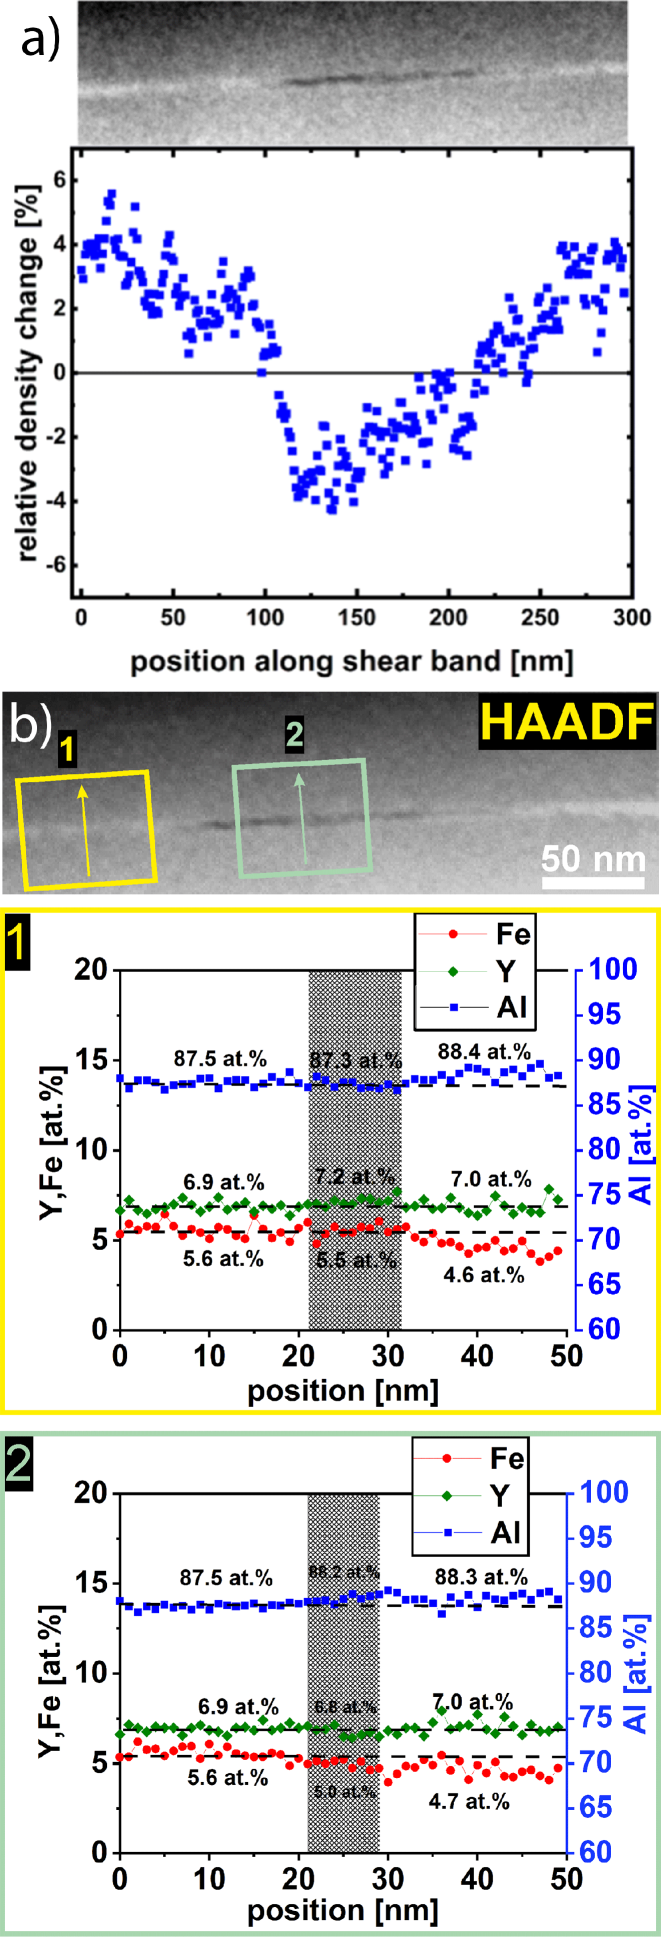
In this study a representative part of a shear band (SB) in Al88Y7Fe5 metallic glass was investigated by analytical TEM. The composition was analyzed by EDX using the newest generation of quadrupole detectors providing improved statistics for quantification [27]. Fig. 1a depicts a SB that exhibits a contrast change from bright to dark to bright. Slight deflections between the SB segments are correlated with the contrast variations [14, 15].
The contrast changes were quantified as density changes using the intensities of the HAADF-STEM signals as described in detail in references [14, 15, 16, 18]. The average density change for the bright SB segments is about and for the dark SB segment. The positive sign means densification and the negative sign dilation relative to the adjacent amorphous matrix. The regions used for the EDX chemical analysis are indicated by boxes in the HAADF image of Fig. 1b. In order to enhance the statistics of the elemental profiles the data was summed along the lines in the spectrum image parallel to the shear bands. The results of the compositional analysis for the different regions are shown in Fig. 1b and are also listed in Tab. 1. Both elemental profiles show a slight increase in Al and a decrease in Fe in the matrix on the right-hand side relative to the matrix on the left-hand side. Moreover, there is also a small compositional difference between the two SB segments. The bright SB segment is slightly depleted in Al and enriched in Fe and Y compared to the dark SB segment. However, the average atomic number Z does not vary largely (). Former investigations using fluctuation electron microscopy (FEM), a microscopical technique that is sensitive to MRO, revealed different degrees of nanoscale order. High structural order in terms of MRO was observed for the dark SB segments in while the bright SB segments showed even less structural ordering than the surrounding matrix. [14, 15].
The mean free path (MFP) was calculated for the nominal composition to be () nm according to Malis et al. [28] and () nm using the approach from Iakoubovskii et al. [29]. The values for the different local environments are summarized in Tab. 1.
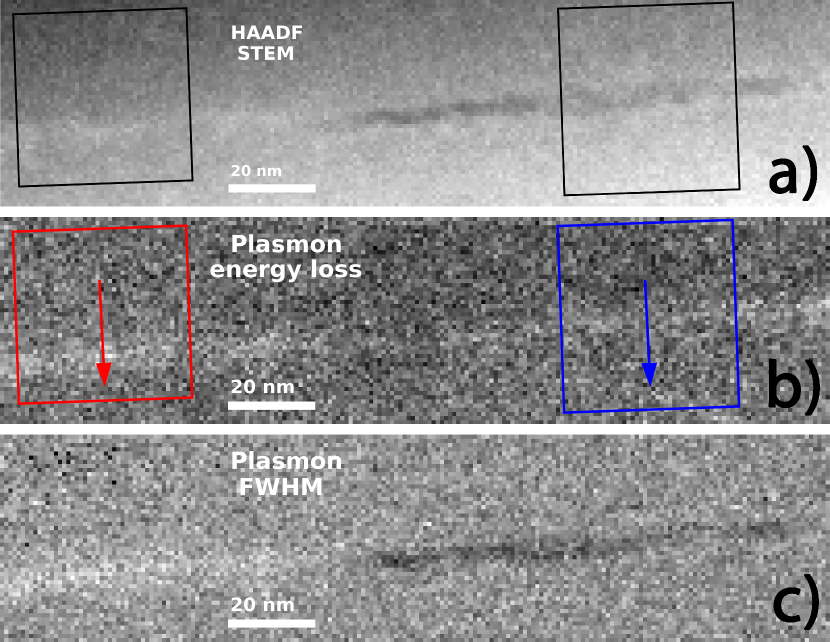
The volume plasmons in and around the SB were investigated by electron-energy loss (EEL) spectrum imaging. Fig. 2a displays the HAADF signal from the spectrum image showing the location of the SB. From the Lorentzian functions fitted to the plasmon and zero-loss peaks of the individual EEL spectra, the peak centres Emax, and widths (FWHM), , were determined. The map of the plasmon peak energy Emax (Fig. 2b) shows a noticeable energy shift relative to the matrix for both SB segments. The map of the plasmon peak width is shown in Fig. 2c. Relative to the matrix, the plasmon peak is broader for the bright (denser) SB segment and narrower for the dark (less dense) SB segment.
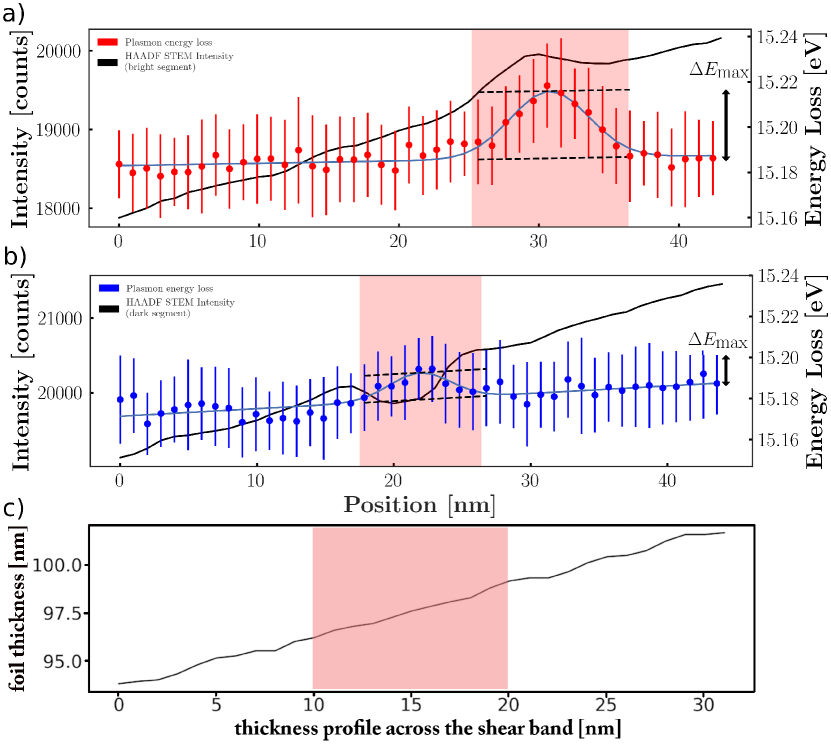
The results of the quantification extracted from the boxed regions in Fig. 2b are displayed in Fig. 3a and Fig. 3b together with the profile of the HAADF signal showing the SB position. Although the plasmon peak energy Emax is somewhat variable in the matrix, it clearly shifts in the SB segments reaching a maximum value for Emax of () eV for the bright SB segment and () eV for the dark SB segment. A summary of the results obtained from peak fitting are tabulated in Tab. 2.
A foil thickness profile drawn (top to bottom) across the investigated SB is displayed in Fig. 3c. The slope of the thickness profile corresponds approximately to the slope observed in the HAADF signal (black line in Fig. 3a and Fig. 3b). Thus, it confirms the absence of preferential etching at the SB during sample preparation (electro-polishing).
| Profile 1 in Fig. 1b | matrix (left) | bright segment | matrix (right) | ||
|---|---|---|---|---|---|
| Al [at.%] | 87.5 | 87.3 | 88.4 | ||
| Fe [at.%] | 5.6 | 5.5 | 4.6 | ||
| Y [at.%] | 6.9 | 7.2 | 7.0 | ||
| Average atomic number Z | 15.52 | 15.59 | 15.42 | ||
| Molar mass [g/mol] | 32.87 | 33.03 | 32.64 | ||
|
130.8 | 130.7 | 131.1 | ||
|
162.1 | 160.8 | 162.4 |
| Profile 2 in Fig. 1b | matrix (left) | dark segment | matrix (right) | ||
|---|---|---|---|---|---|
| Al [at.%] | 87.5 | 88.2 | 88.3 | ||
| Fe [at.%] | 5.6 | 5.0 | 4.7 | ||
| Y [at.%] | 6.9 | 6.8 | 7.0 | ||
| average atomic number Z | 15.52 | 15.42 | 15.42 | ||
| Molar mass [g/mol] | 32.87 | 32.64 | 32.64 | ||
|
130.8 | 131.1 | 131 | ||
|
162.1 | 163.8 | 162.4 |
| [eV] | [eV] | [eV] | [meV] | |||
|---|---|---|---|---|---|---|
| bright SB segment | ||||||
|
- | |||||
| dark SB segment | ||||||
|
- |
| [eV] | [eV] | [eV] | [meV] | |||
|---|---|---|---|---|---|---|
| bright SB segment | ||||||
|
- | |||||
| dark SB segment | ||||||
|
- |
4 Discussion
In the following section the experimental results are discussed.
4.1 Effect of the background and plural scattering on the plasmon energy shift
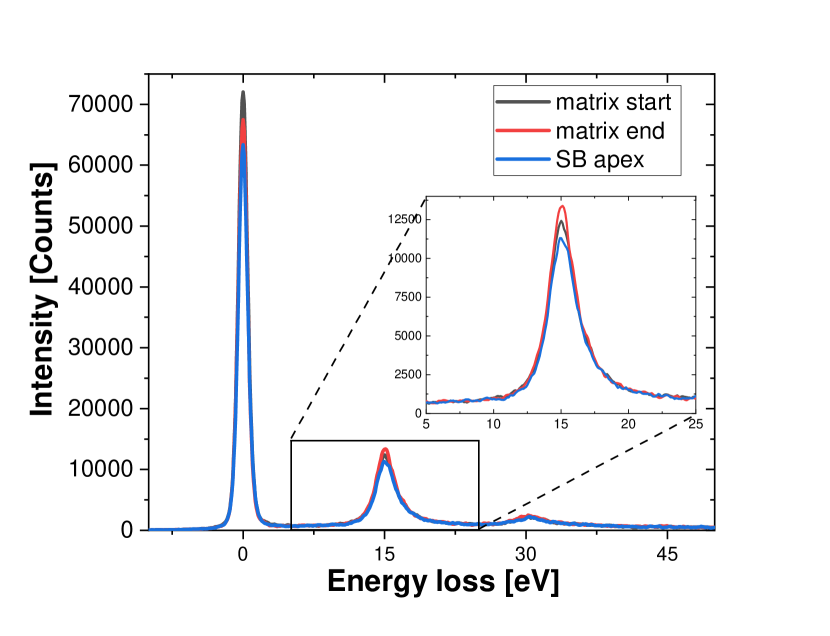
To discuss the influence of the background and the degree of plural scattering on the energy shifts and the peak broadening, three representative spectra (raw data) are depicted in Fig. 4 which are taken from different positions of the linescan shown in Fig. 3a. A small second plasmon peak can be noticed in all spectra indicating the presence of plural scattering due to the foil thickness, which ranges from 92 - 102 nm (see Fig. 3c) or 0.7 - 0.8 mean free path. While a visual inspection of Fig. 4 shows no apparent change in the background, an indiscernible effect may arise from subtle changes in the second plasmon peak. To evaluate this contribution, plural scattering was removed using the Fourier-log deconvolution technique [30, 31, 32]. Subsequently, all values were recalculated using deconvoluted spectra and the results are given in Tab. 3. A comparison of the data in Tabs. 2 and 3 shows that, while there are small changes in the values as a result of deconvolution, the trends for the peak shifts and widths remain the same. From this we conclude that in our case the influence of background and plural scattering are minor relative to the total error and thus justifies the use of unprocessed low-loss data, which are preferred for practical reasons.
4.2 Compositional contributions
While there are small changes in the composition of the matrix and the SB regions (Fig. 1b), there is no apparent correlation with the shifts in the plasmon peak energy (Figs. 3a and b). According to the experimental work of Hibbert et al. [33], the variation of the plasmon energy loss with composition in Al-rich Al-Mg solid solutions showed that an addition of 1 at.% Mg as impurity caused a decrease in the plasmon energy loss of about -50 meV. Considering the additions of Fe and Y in the first instance to have similar effects to the plasmon energy loss of Al as Mg, a compositional difference of 1 at.% Al between the bright and dark SB segments (see Tab. 1) should then result in a similar energy shift of about - 50 meV. However, in our case the bright SB segment in Fig. 1b, which has less Al, shows an increased energy shift of about 24 meV. Thus, the compositional changes are insufficient to explain the observed plasmon energy shift in the SB segments.
4.3 Theoretical analysis of plasmon resonance enhancement in shear bands
The plasmon resonance peak may be modeled as a Lorentzian function centered at the plasmon energy loss eV and with FWHM in the order of eV (see Tab. 2), where denotes the damping coefficient of the plasmon excitation. The observed values are close to typical values for crystalline Al, i.e. eV [34]. However, it is worth noting that crystalline Al shows a peak shift of about eV upon melting into a liquid [35].
By definition, the electrons that contribute to the volume plasmon peak are free or nearly-free electrons. We underline the fact that in our material, which is to a great extent Al, the nearly-free electron model is expected to work fairly well, unlike the case in alloys where transition metals are dominant. Taking the formula for the bulk plasmon energy loss, , where is the reduced Planck constant, is the electron density, and are the electron charge and mass, and is the vacuum permittivity, the shifts of the plasmon energy losses in the SB cannot be explained simply in terms of a uniform nearly-free electron concentration over the entire sample. Thus, although the electrons are treated as delocalized in the nearly-free electron model, there are differences in concentration of the nearly-free electrons in different parts of the sample. These differences reflect the underlying differences of ionic density and the individual damping characteristics of the different regions. Thus, the measured plasmon energy loss in our material is not given by , because this simple estimate holds only in the absence of damping (hence, it works only for perfect defect-free crystalline metals at low temperature). In a metallic glass at room temperature, damping is of course a very important contribution to the maximum, , occurring. According to theory [36, 34], the maximum occurs at an energy approximately proportional to the inverse of the imaginary part of the dielectric function, given by [34]
and reaches a maximum value of at an energy loss
| (1) |
which is close to , in the case of small damping. In a real system, the measured plasmon energy loss is , not and the two values coincide only for ideal perfect crystals at low temperature. The undamped plasmon frequency is related to the undamped plasmon energy loss via . The damping coefficient depends on the local scattering events between conduction electrons and ion-cores and hence the local microstructure. Therefore, may vary spatially because in some portions of the material scattering events are more frequent than in other parts of the material (cf. Fig. 2c). In general, there are several contributions to damping besides ion scattering: important effects are Landau damping, inter-band transitions [37] and electron-phonon scattering. It should be mentioned that damping of collective excitations in amorphous solids may be strongly non-local: as recently reported, long-range (power-law) stress correlations in amorphous solids cause logarithmic decay of phonon damping with the wave vector [38]. However, for Al-rich materials the Fermi energy lies well below the band top so that single-particle excitations are very unlikely, and damping can be assumed to be caused predominantly by electron-ion and electron-phonon scattering. Hence, the damping coefficient may be estimated from its definition in terms of the relaxation time (mean time between scattering collisions with ions), . The relaxation time is related to the resistivity via .
The resistivity of metallic glasses is described by the Ziman theory [35, 38], which was originally developed for liquid metals but works also for certain glasses. The famous Ziman formula for the resistivity of amorphous metals reads
| (2) |
which gives the damping coefficient as [36]:
| (3) |
where denotes the wave vector (here defined as the reciprocal of the radial distance measured from one ion taken as the centre of a spherical frame and not to be confused with the wave vector of the incident electron beam), is the Fermi wave vector, and is the number density of ions in the material. Furthermore, is the static structure factor of the metallic glass (i.e. the spatial Fourier transform of the radial distribution function ), which again is a local quantity that significantly differs for the bright and dark SB segments, since the local atomic structure (topological order) is different for the two segments [15]. Finally, is the average Thomas-Fermi-screened electron-ion pseudopotential form factor for elastic scattering at the Fermi surface [38]. The Ziman formula accounts for elastic electron-ion scattering only, and thus is typically valid at temperatures well below the Debye temperature. Since the Debye temperature for is K [39], the Ziman formula should be replaced by the Baym formula [38]. Thus in Eq. 3 needs to be replaced by a frequency integral over the dynamic structure factor times a factor . Using the Vineyard approximation , where denotes the self-part of the atomic dynamics, the dynamic structure factor can be extracted from the frequency integral, and upon performing the frequency integral, the damping coefficient becomes
| (4) |
where is a function of only. As a first approximation, the integral is dominated by , especially for the low- region. Alternatively, one can manipulate the Baym formula after Meisel and Cote [40] for metallic glass and arrive at the same simplification.
Regarding the integration limit above, it is important to note that for some metallic glasses the Nagel-Tauc rule [41] for metallic glass stability and formability stipulates that , where denotes the wave vector of the first peak in the structure factor. However, for pure Al it is known that , where is the minimum after the first peak in , as is the case for all three-valent metals [38]. Since our system is very rich in Al, it is likely that the value of , which satisfies , lies somewhere between and .
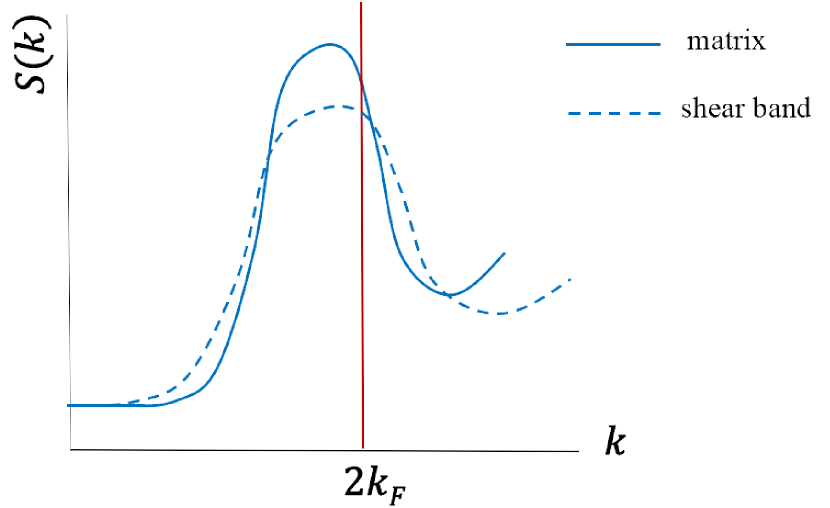
Since the pseudopotential is approximately given by the Fourier transform of the Thomas-Fermi screened Coulomb attraction, the function is relatively shallow within the range of integration. Hence, the integral is dominated by the first peak in the static structure factor , i.e. by the fraction of short and medium-range order in the atomic coordination (Fig. 5).
4.4 Dependence of the damping coefficient on the local microstructure
The dependence of the damping coefficient on the local free volume is clearly the same as the volume- (or equivalently, density-) dependence of the resistivity. The effect of dilation on resistivity has been studied extensively by Ziman and Faber on the basis of Eq. 2. In particular, Faber [35] has provided the following expression for the volume-dependence of the resistivity:
| (5) |
where is a dimensionless parameter. Eq. 5 is attractive because it clearly singles out the three main contributions to the change of resistivity upon dilation: i) the effect of expanding the Fermi sphere, encoded in ; ii) the change in short and medium-range order encoded in the derivative ; iii) the effect on the pseudopotential of any change in the screening properties of the conduction electron gas. Faber [35] concluded from his analysis that the second term in Eq. 5 is the one which usually dominates the overall dependence of resistivity on dilation. Assuming that the position and the width of the first peak of scale with , Faber concluded that .
In the absence of a more quantitative theory, we resort to the following argument based on the consideration of the microstructure in the SB. In the Ziman-Baym formula is related to the pair-correlation function or radial distribution function, RDF in isotropic systems, giving the averaged probability of finding any atom at a distance r from the atom at the centre of the frame.
We now apply the Ziman-Baym theory to estimate the change in the plasmon energy loss in the SB with respect to the matrix due to damping. We know from the plasmon peak fitting of the EELS data that the FWHM in the matrix adjacent to the bright SB segment is eV, whereas in the matrix adjacent to the dark SB segment it is eV. For the SB segments we obtain eV and eV, for bright and dark, respectively. The damping of the excitation is reduced in the dark SB segment due to higher structural order in terms of MRO (small crystal-like Al-rich clusters embedded in amorphous material) resulting in a broader and lowered first peak of [14, 15], which in turn results in a reduced resistivity (hence a lower damping of the plasmon), because the lower peak in gives a smaller value for the integral in Eq. 4. For the bright SB segment the damping is higher than in the matrix because there is even less ‘structure’ in terms of MRO and hence less dispersion with the result that the first peak of is higher.
4.5 Model estimate of plasmon energy shift in the shear bands
Now, the energy of the plasmon loss is given by Eq. 1 as
| (6) |
and for the relative shift in each segment we have then
| (7) |
where denotes the bulk plasmon energy loss in the complete absence of damping or at momentum transfer .
Using the measured values of in the various regions together with the measured values of the plasmon energy loss , one can infer the values of undamped plasmon energy in the SB segments and compare those values to the value measured in the matrix . These values are then related to the ionic density and the effective electron mass in the various regions via . Neglecting the variation of electron effective mass in the first instance, we arrive at the following enhancement for the bright (densified) SB segment: , and for the dark (dilated) SB segment we get: .
This result can be explained as follows. The electron effective mass in metallic glasses is controlled by electron-phonon coupling via [35]: , where the mass-enhancement factor (electron-phonon coupling parameter) is given through the Eliashberg function, valid also for metallic glasses [42], . Here, is the electron-phonon matrix element and is the vibrational density of states (VDOS). The above formula for the mass-enhancement factor can be expressed in terms of an integral over the dynamical structure factor times the matrix element via the Eliashberg theory. Meisel and Cote [43] and independently Jaeckle and Froboese [44] using a slightly different derivation, have shown that in metallic glasses , where denotes the mean-free path of the electron in the ionic environment. The prefactors in this relation are density-independent constants, hence they do not change from region to region, whereas the mean free path is roughly inversely proportional to the local ionic density in the region. The mean free path was calculated for the different regions according to Malis et al. [28] and found to be around () nm. Using the model (Kramers-Kronig sum rule) of Iakoubovskii et al. [29] we find a mean free path of () nm. While the absolute values of the mean free path differ to a great deal depending on the used model [28, 29], the values calculated within one model do not vary significantly in space (Tab. 1). Thus, assuming the mean free path to be constant, we get
| (8) |
Moreover, since in metallic glasses the mass-enhancement parameter is large (), it is clear that in the second radical of Eq. 8 almost cancels the effect of the first radical. Accordingly, the plasmon energy shift for the dark SB segment is mostly related to a reduced damping. In fact, the increased MRO in the dark SB segment gives rise to a reduced first peak of and thus leads to reduced damping because of the smaller contribution of the lowered peak of to the integral in Eq. 2. Somewhat different is the case of the bright SB segment, where the coupling of effects is comparatively more effective and leaves a slightly larger enhancement for the value of with respect to the matrix due to the ionic density.
In essence, we have two contributions that are responsible for the plasmon energy shifts; that is, (i) damping due to electron-phonon scattering and (ii) the ionic density. The increase in damping for the denser (bright) SB segment and the decrease in the dilated (dark) one with respect to the matrix is related to the level of structural order present in the different regions [14, 15, 18, 45, 46]. This also fits to recent findings observed in granular media where sound damping is determined by the interplay between elastic heterogeneities and inelastic interactions [47]. The second contribution is related to the efficacy of the coupling between the ionic density and the effective electron mass appearing in the plasmon frequency formula at zero-momentum , which is less effective in the dark SB segment than in the bright one.
5 Conclusions
Shifts and widths of plasmon energy losses were experimentally determined from a sheared zone (shear band and its immediate environment) of a metallic glass using automated routines based on an open source python module (Hyperspy) to fit the peak shapes of the zero-loss peak and the plasmon peaks [26]. These signals are characteristic fingerprints and therefore suitable to visualize deformation features in amorphous materials such as shear bands. The model presented here suggests two reasons for the the plasmon energy shifts. First, variable plasmon damping in the shear band segments caused by differences in the medium-range order present. This affects the first peak of the static structure factor , which leads to either lowered or increased damping according to the Ziman-Baym resistivity formula. The second reason is that the ionic density and the effective electron mass appearing in the zero-momentum plasmon frequency formula are coupled and give rise to small variations in the plasmon energy between the shear band and the matrix. The model predicts plasmon energy shifts in the order of meV [48].
6 Acknowledgments
We gratefully acknowledge financial support from the Deutsche Forschungsgemeinschaft (WI 1899/29-1; project number 325408982). We thank Dr. P. Schlossmacher (Thermo Fisher Scientific, FEI Deutschland GmbH) for enabling the measurements at the Nanoport in Eindhoven during a demonstration of a Themis3 300 microscope. A.Z. gratefully acknowledges financial support from the US Army Research Office through contract no. W911NF-19-2-0055. Fruitful discussions with Drs. Vitalij Hieronymus-Schmidt and Sven Hilke are acknowledged.
References
- [1] F. Spaepen, A microscopic mechanism for steady state inhomogeneous flow in metallic glasses, Acta Metallurgica 25 (4) (1977) 407–415.
- [2] A. Argon, Plastic deformation in metallic glasses, Acta Metallurgica 27 (1) (1979) 47–58.
- [3] P. Donovan, W. Stobbs, The structure of shear bands in metallic glasses, Acta Metallurgica 29 (8) (1981) 1419–1436.
- [4] M. Heggen, F. Spaepen, M. Feuerbacher, Creation and annihilation of free volume during homogeneous flow of a metallic glass, Journal of Applied Physics 97 (3) (2005) 033506.
- [5] D. Klaumünzer, A. Lazarev, R. Maaß, F. Dalla Torre, A. Vinogradov, J. F. Löffler, Probing shear-band initiation in metallic glasses, Physical Review Letters 107 (18) (2011) 185502.
- [6] J. Pan, Q. Chen, L. Liu, Y. Li, Softening and dilatation in a single shear band, Acta Materialia 59 (13) (2011) 5146–5158.
- [7] A. L. Greer, Y. Q. Cheng, E. Ma, Shear bands in metallic glasses, Materials Science and Engineering: R: Reports 74 (4) (2013) 71–132.
- [8] E. Ma, Tuning order in disorder, Nature materials 14 (6) (2015) 547.
- [9] J. Li, F. Spaepen, T. C. Hufnagel, Nanometre-scale defects in shear bands in a metallic glass, Philosophical Magazine A 82 (13) (2002) 2623–2630.
- [10] W. Lechner, W. Puff, G. Wilde, R. Würschum, Vacancy-type defects in amorphous and nanocrystalline al alloys: Variation with preparation route and processing, Scripta Materialia 62 (7) (2010) 439–442.
- [11] J. Bokeloh, S. V. Divinski, G. Reglitz, G. Wilde, Tracer measurements of atomic diffusion inside shear bands of a bulk metallic glass, Physical Review Letters 107 (23) (2011) 235503.
- [12] J. Bünz, T. Brink, K. Tsuchiya, F. Meng, G. Wilde, K. Albe, Low temperature heat capacity of a severely deformed metallic glass, Physical Review Letters 112 (13) (2014) 135501.
- [13] Y. P. Mitrofanov, M. Peterlechner, S. Divinski, G. Wilde, Impact of plastic deformation and shear band formation on the boson heat capacity peak of a bulk metallic glass, Physical Review Letters 112 (13) (2014) 135901.
- [14] H. Rösner, M. Peterlechner, C. Kübel, V. Schmidt, G. Wilde, Density changes in shear bands of a metallic glass determined by correlative analytical transmission electron microscopy, Ultramicroscopy 142 (2014) 1–9.
- [15] V. Schmidt, H. Rösner, M. Peterlechner, G. Wilde, P. M. Voyles, Quantitative measurement of density in a shear band of metallic glass monitored along its propagation direction, Physical Review Letters 115 (3) (2015) 035501.
- [16] V. Hieronymus-Schmidt, H. Rösner, G. Wilde, A. Zaccone, Shear banding in metallic glasses described by alignments of eshelby quadrupoles, Physical Review B 95 (13) (2017) 134111.
- [17] C. Liu, V. Roddatis, P. Kenesei, R. Maaß, Shear-band thickness and shear-band cavities in a zr-based metallic glass, Acta Materialia 140 (2017) 206–216.
- [18] S. Hilke, H. Rösner, D. Geissler, A. Gebert, M. Peterlechner, G. Wilde, The influence of deformation on the medium-range order of a zr-based bulk metallic glass characterized by variable resolution fluctuation electron microscopy, Acta Materialia 171 (2019) 275–281.
- [19] S. Balachandran, J. Orava, M. Köhler, A. J. Breen, I. Kaban, D. Raabe, M. Herbig, Elemental re-distribution inside shear bands revealed by correlative atom-probe tomography and electron microscopy in a deformed metallic glass, Scripta Materialia 168 (2019) 14–18.
- [20] C. Liu, Z. Cai, X. Xia, V. Roddatis, R. Yuan, J.-M. Zuo, R. Maaß, Shear-band structure and chemistry in a zr-based metallic glass probed with nano-beam x-ray fluorescence and transmission electron microscopy, Scripta Materialia 169 (2019) 23–27.
- [21] H. Shao, Y. Xu, B. Shi, C. Yu, H. Hahn, H. Gleiter, J. Li, High density of shear bands and enhanced free volume induced in zr70cu20ni10 metallic glass by high-energy ball milling, Journal of Alloys and Compounds 548 (2013) 77–81.
- [22] J. Bokeloh, N. Boucharat, H. Rösner, G. Wilde, Primary crystallization in al-rich metallic glasses at unusually low temperatures, Acta Materialia 58 (11) (2010) 3919–3926.
- [23] J. Hunt, D. B. Williams, Electron energy-loss spectrum-imaging, Ultramicroscopy 38 (1) (1991) 47–73.
- [24] F. de la Peña, E. Prestat, V. Tonaas Fauske, P. Burdet, P. Jokubauskas, M. Nord, T. Ostasevicius, K. E. MacArthur, M. Sarahan, D. N. Johnstone, et al., hyperspy/hyperspy: Hyperspy v1. 5.2, zndo (2019).
- [25] D. McComb, A. Howie, Characterisation of zeolite catalysts using electron energy loss spectroscopy, Ultramicroscopy 34 (1-2) (1990) 84–92.
- [26] https://github.com/mgrove-wwu/EELS-LL-image-fitting M. Grove (2019).
- [27] P. Schlossmacher, D. O. Klenov, B. Freitag, S. von Harrach, A. Steinbach, Nanoscale chemical compositional analysis with an innovative s/tem-edx system, Microscopy and Analysis 5 (2010).
- [28] T. Malis, S. Cheng, R. Egerton, Eels log-ratio technique for specimen-thickness measurement in the tem, Journal of Electron Microscopy Technique 8 (2) (1988) 193–200.
- [29] K. Iakoubovskii, K. Mitsuishi, Y. Nakayama, K. Furuya, Thickness measurements with electron energy loss spectroscopy, Microscopy Research and Technique 71 (8) (2008) 626–631.
- [30] D. Johnson, J. H. Spence, Determination of the single-scattering probability distribution from plural-scattering data, Journal of Physics D: Applied Physics 7 (6) (1974) 771.
- [31] R. Egerton, B. Williams, T. Sparrow, Fourier deconvolution of electron energy-loss spectra, Proceedings of the Royal Society of London. A. Mathematical and Physical Sciences 398 (1815) (1985) 395–404.
- [32] R. Egerton, P. Crozier, The use of fourier techniques in electron energy-loss spectroscopy, Scanning Microscopy, Supplement 2 (1988) 245–254.
- [33] G. Hibbert, J. Edington, D. Williams, P. Doig, The variation of plasma energy loss with composition in dilute aluminium-magnesium solid solutions, Philosophical Magazine 26 (6) (1972) 1491–1494.
- [34] R. F. Egerton, Electron energy-loss spectroscopy in the electron microscope, Springer Science & Business Media, 2011.
- [35] T. E. Faber, Introduction to the theory of liquid metals, Cambridge University Press, 2010.
- [36] H. Nikjoo, S. Uehara, D. Emfietzoglou, Interaction of radiation with matter, CRC press, 2012.
- [37] S. Gelin, H. Tanaka, A. Lemaître, Anomalous phonon scattering and elastic correlations in amorphous solids, Nature Materials 15 (11) (2016) 1177–1181.
- [38] N. H. March, M. P. Tosi, et al., Coulomb liquids, Academic Press, 1984.
- [39] M. Gerlitz, Excess heat capacity contributions of marginally glass forming metallic glasses (2018).
- [40] L. Meisel, P. Cote, Structure factors in amorphous and disordered harmonic debye solids, Physical Review B 16 (6) (1977) 2978.
- [41] S. Nagel, J. Tauc, Nearly-free-electron approach to the theory of metallic glass alloys, Physical Review Letters 35 (6) (1975) 380.
- [42] M. Baggioli, C. Setty, A. Zaccone, Effective theory of superconductivity in strongly coupled amorphous materials, Phys. Rev. B 101 (21) (2020) 214502.
- [43] L. Meisel, P. Cote, Eliashberg function in amorphous metals, Physical Review B 23 (11) (1981) 5834.
- [44] J. Jackle, K. Frobose, The electron-phonon coupling constant of amorphous metals, Journal of Physics F: Metal Physics 10 (3) (1980) 471.
- [45] S. Hilke, H. Rösner, G. Wilde, The role of minor alloying in the plasticity of bulk metallic glasses, Scripta Materialia 188 (2020) 50–53.
- [46] F. A. Davani, S. Hilke, H. Rösner, D. Geissler, A. Gebert, G. Wilde, Correlation between the ductility and medium-range order of bulk metallic glasses, J. of Appl. Phys. 128 (1) (2020) 015103.
- [47] K. Saitoh, H. Mizuno, Sound damping in frictionless granular materials: The interplay between configurational disorder and inelasticity, arXiv preprint arXiv:2008.09760 (2020).
- [48] E. W. Huang, K. Limtragool, C. Setty, A. A. Husain, M. Mitrano, P. Abbamonte, P. W. Phillips, Extracting correlation effects from momentum-resolved electron energy loss spectroscopy (m-eels): Synergistic origin of the dispersion kink in bi2.1sr1.9cacu2o8+x, arXiv preprint arXiv:2010.02947 (2020).