sec name=Section , Name=Section , names=Sections , Names=Sections \newrefapp name=Appendix , Name=Appendix \newrefeq name=Eq. , Name=Eq. , names=Eqs. , Names=Eqs. \newreffig name=Figure , Name=Figure , names=Figures , Names=Figures \newreftable name=Table , Name=Table , names=Tables , Names=Tables \newrefdef name=Definition , Name=Definition , names=Definitions , Names=Definitions \newrefassu name=Assumption , Name=Assumption , names=Assumptions , Names=Assumptions , \newrefcond name=Condition , Name=Condition , names=Conditions , Names=Conditions \newrefprop name=Proposition , Name=Proposition , names=Propositions , Names=Propositions \newreflem name=Lemma , Name=Lemma \newrefex name=Example , Name=Example , names=Examples , Names=Examples \newrefcor name=Corollary , Name=Corollary , names=Corollaries , Names=Corollaries \newrefthm name=Theorem , Name=Theorem \newrefproof name=Proof , Name=Proof \newrefconj name=Conjecture , Name=Conjecture \newrefalgr name=Algorithm , Name=Algorithm , names=Algorithms , Names=Algorithms ,
An Automatic Finite-Sample Robustness Metric: When Can Dropping a Little Data Make a Big Difference?
Abstract
Study samples often differ from the target populations of inference and policy decisions in non-random ways. Researchers typically believe that such departures from random sampling — due to changes in the population over time and space, or difficulties in sampling truly randomly — are small, and their corresponding impact on the inference should be small as well. We might therefore be concerned if the conclusions of our studies are excessively sensitive to a very small proportion of our sample data. We propose a method to assess the sensitivity of applied econometric conclusions to the removal of a small fraction of the sample. Manually checking the influence of all possible small subsets is computationally infeasible, so we use an approximation to find the most influential subset. Our metric, the “Approximate Maximum Influence Perturbation,” is based on the classical influence function, and is automatically computable for common methods including (but not limited to) OLS, IV, MLE, GMM, and variational Bayes. We provide finite-sample error bounds on approximation performance. At minimal extra cost, we provide an exact finite-sample lower bound on sensitivity. We find that sensitivity is driven by a signal-to-noise ratio in the inference problem, is not reflected in standard errors, does not disappear asymptotically, and is not due to misspecification. While some empirical applications are robust, results of several influential economics papers can be overturned by removing less than 1% of the sample.
1 Introduction
introduction Ideally, policymakers will use economics research to inform decisions that affect people’s livelihoods, health, and well-being. Yet study samples may differ from the target populations of these decisions in non-random ways, perhaps because of practical challenges in obtaining truly random samples, or because populations generally differ across time and place. When these deviations from the ideal random sampling exercise are small, one might think that the empirical conclusions would still hold in the populations affected by policy. It therefore seems prudent to ask whether a small percentage of a study’s sample—or a handful of data points—has been instrumental in determining its findings. In this paper we provide a finite-sample, automatically-computable metric of how dropping a small amount of data can change empirical conclusions. We show that certain empirical results from high-profile studies in economics can be reversed by removing less than 1% of the sample even when standard errors are small, and we investigate why.
There are several reasons to care about whether empirical conclusions are substantially influenced by small percentages of the finite sample. In practice, even if we can sample from the population of direct interest, small percentages of the data are missing; either surveyors and implementers cannot find these individuals, or they refuse to answer our questions, or their answers get lost or garbled during data processing. As this missingness cannot safely be assumed random, researchers might care whether their substantive conclusions could conceivably be overturned by a missing handful of data points. Similarly, consumers of research who are concerned about potentially non-random errors in sample construction at any stage of the analysis might be interested in this metric as a measure of the exposure of a study’s conclusions to this concern. Conclusions that are highly influenced by a small handful of data points are more exposed to adverse events or errors during data analysis, including p-hacking, even if these errors are unintentional.
Even if researchers could construct a perfectly random sample from a given study population, the target population for our policy decisions is almost always different from the study population, if only because the world may change in the time between the research and the decision. For this reason, social scientists often aspire to uncover generalizable or “externally valid” truths about the world and to make policy recommendations that would apply more broadly than to a single study population.
In this paper, we propose to directly measure the extent to which a small fraction of a data sample has influenced the central claims or conclusions of a study. For a particular fraction (e.g., ), we propose to find the set of no more than of all the observations that effects the greatest change in an estimator when those observations are removed from the sample, and to report this change. For example, suppose we were to find a statistically-significant average increase in household consumption after implementing some economic policy intervention. Further suppose that, by dropping 0.1% of the sample (often fewer than 10 data points), we instead find a statistically-significant average decrease in consumption. Then it would be challenging to argue that there is strong evidence that this intervention would yield consumption increases in even slightly different populations.
To quantify this sensitivity, one could consider every possible fraction of the data, and re-run the original analysis on all of these data subsets. But this direct implementation is computationally prohibitive.222Indeed, young2019consistency finds it computationally prohibitive to re-run their analysis when leaving out every possible subset of two data points. To illustrate, consider an analysis that takes 1 second to run; checking removal of every 4 data points from a data set of size 400 would take over 33 years. See \secrefMIP for more detail. We propose a fast approximation that works for common estimators—including Generalized Methods of Moments (GMM), Ordinary Least Squares (OLS), Instrumental Variables (IV), Maximum Likelihood Estimators (MLE), Variational Bayes (VB), and all minimizers of smooth empirical loss (\secrefAMIP). Computation of the approximation is fast, automatable, and easy to use, and we provide an R package on GitHub called “zaminfluence.”333https://github.com/rgiordan/zaminfluence. The name stands for “Z-estimator approximate maximum influence.”
Our approximation is based on the classical “influence function,” which has been used many times in the literature to assess sensitivity to dropping one or a small number of datapoints (a discussion of related work can be found in \secrefrelated_work below). However, prior work focused on outlier detection and visual diagnostics and considered small numbers of removed datapoints. In contrast, we relate the effect of ablating a non-vanishing proportion of datapoints to classical inference, with an interest in generalizing to unseen populations rather than detection of gross outliers, and analyze the accuracy of the empirical influence function as an approximation to leaving out a fixed proportion of data.
Specifically, we show that our approximation performs well using a combination of theoretical analyses, simulation studies, and applied examples. We demonstrate theoretically that the approximation error is low when the percentage of the sample removed is small (\secrefaccuracy). Moreover, for the cost of a single additional data analysis, we can provide an exact lower bound on the worst-case change in an analysis upon removing of the data (\secrefexact_lower_bound). We check that our metric detects combinations of data points that reverse empirical conclusions when removed from real-life datasets (\secrefexamples). For example, in the Oregon Medicaid study (finkelstein2012oregon), we can identify a subset containing less than 1% of the original data that controls the sign of the effects of Medicaid on certain health outcomes. In the Mexico microcredit study (angelucci2015microcredit), we find a single observation, out of 16,500, that controls the sign of the ATE on household profit.
We investigate the source of this sensitivity when it arises, and we show that it is not captured in conventional standard errors. We find that a result’s exposure to the influence of a small fraction of the sample need not reflect a model misspecification problem nor the presence of gross outliers. Sensitivity according to our metric can arise, even if the model is exactly correct and the data set arbitrarily large, if there is a low signal-to-noise ratio: that is, if the strength of the claim (signal) is small relative to a quantity that consistently estimates the standard deviation of the limiting distribution of root- times the quantity of interest (\secrefwhy). For example, in OLS this “noise” is large when we have a high ratio of residual variance to regressor variance (\secrefinfluence_function_ols). This noise can be large even when standard errors are small, because it does not disappear as grows. This result highlights the distinction between performing classical inference within a hypothetical perfect random resampling experiment, and attempting to generalize beyond the data to the world in which very small changes to the population are occurring over space and time.
We examine several applications from empirical economics papers and find that the sensitivity captured by our metric varies considerably across analyses in practice. In many cases, the sign and significance of certain estimated treatment effects can be reversed by dropping less than 1% of the sample, even when the t-statistics are very large and inference is very precise; see, e.g., the Oregon Medicaid RCT (finkelstein2012oregon) in \secrefexample_medicaid. In \secrefexample_transfers, we examine the Progresa Cash Transfers RCT (angelucci2009indirect) and show that trimming outliers in the outcome data does not necessarily reduce sensitivity. In \secrefexample_microcredit_linear we examine a simple two-parameter linear regression on seven Microcredit RCTs (meager2020aggregating) and, in \secrefexample_microcredit_hierarchical, we examine a Bayesian hierarchical analysis of the same data; these final two analyses show that neither very simple nor relatively complex Bayesian models are immune to sensitivity to dropping small fractions of the data. However, not all analyses we examine are non-robust. Certain results across the applications we examine are robust up to 5% and even 10% removal.
We recommend that researchers use our metric to complement standard errors and other robustness checks. Our goal is not to supplant other sensitivity analyses, but to provide an additional tool to be incorporated into a broader ecosystem of systematic stability analysis in data science (yu:2013:stability). For example, since our approximation is fundamentally local due to the Taylor expansion, practitioners may also consider global sensitivity checks such as those proposed by leamer1984global; leamer1985sensitivity; sobol2001global; saltelli2004global, or the conventional breakdown frontiers approach of he1990tail; masten2020inference. Our method is also not a substitute for tailored robustness checks designed by researchers to investigate specific concerns about sensitivity of results to certain structures or assumptions. Applied researchers will always know more than econometricians about which specific threats to their empirical strategies are most worth investigating in order to solidify our trust in the results of any given analysis. And practitioners may well benefit from robustifying their analysis (mostellertukeydata; hansen2008robustness; chen2011sensitivity) even if they pass our check. Our metric is also complementary to classical gross error robustness (which we take to include outlier detection and breakdown point analyses) (belsley:1980:regression; hampel1986robustbook). In particular, gross error sensitivity is designed to detect and accommodate arbitrary adversarial perturbations to the population distribution. We discuss similarities and differences between our work and other robustness measures in detail in \secrefrelated_work.
We do not recommend researchers discard results that are not robust to removal of a small, highly-influential subset of data. While in certain cases such sensitivity may be concerning for specific, contextually-determined reasons, there is as yet no basis for doing so in general, as we have shown that such sensitivity can arise even if the conventional inference is valid in the strictest sense. However, we do suggest that researchers adjust their interpretation of results which are sensitive to dropping a small fraction of the data as being less generally applicable to somewhat differing populations, and less robust to minor corruptions of their random sampling assumption. Much as one would interpret statistically insignificant results as a failure to detect an effect rather than positively detecting the absence of an effect, sensitive results may indicate a failure to detect a transportable effect, but not necessarily a failure of classical inference in itself. We do not yet recommend any specific alterations to common inferential procedures based on our metric, but we believe this direction is promising for future research.
2 A proposed measure of sensitivity to dropping small data subsets
metric \seclabelMIP
Suppose we observe data points . For instance, in a regression problem, the -th data point might consist of covariates and response(s) , with . Consider a parameter of interest. Typically we estimate via some function of our data. The central claim of an empirical economics paper is typically focused on some attribute of , such as the sign or significance of a particular effect or quantity. A frequentist analyst might be worried if removing some small fraction of the data were to
-
•
Change the sign of an effect.
-
•
Change the significance of an effect.
-
•
Generate a significant result of the opposite sign.
To capture these concerns, we define the following quantities:
Definition 1.
metrics Let the Maximum Influence Perturbation be the largest possible change induced in the quantity of interest by dropping no more than 100% of the data.
We will often be interested in the set that achieves the Maximum Influence Perturbation, so we call it the Most Influential Set.
And we will be interested in the minimum data proportion required to achieve a change of some size in the quantity of interest, so we call that the Perturbation-Inducing Proportion. We report NA if no such exists.
In general, to compute the Maximum Influence Perturbation for some , we would need to enumerate every data subset that drops no more than 100% of the original data. And, for each such subset, we would need to re-run our entire data analysis. If is the greatest integer smaller than 100, then the number of such subsets is larger than . For and , . So computing the Maximum Influence Perturbation in even this simple case requires re-running our data analysis over 1 billion times. If each data analysis took 1 second, computing the Maximum Influence Perturbation would take over 33 years to compute. Indeed, the Maximum Influence Perturbation, Most Influential Set, and Perturbation-Inducing Proportion may all be computationally prohibitive even for relatively small analyses.
To address this computational issue, we propose to instead use a (fast) approximation to the Maximum Influence Perturbation, Most Influential Set, and Perturbation-Inducing Proportion. We will see, for the cost of one additional data analysis, our approximation can provide a lower bound on the exact Maximum Influence Perturbation. More generally we provide theory and experiments to support the quality of our approximation. We provide open-source code444https://github.com/rgiordano/zaminfluence and show that our approximation is fully automatable in practice (\secrefAMIP).
We articulate our approximation in \secreftaylor_series,AMIP below. First, in \secreftaylor_series to follow we derive a Taylor series approximation to the act of leaving out datapoints. Though this approximation is based on a well-known first-order Taylor series approximation to the act of leaving out datapoints, known as the empirical influence function (hampel1974influence; hampel1986robustbook), we will assume no familiarity with this work, deferring discussion of related literature to \secrefinfluence_function,related_work. We then define our approximation to data dropping in \secrefAMIP, using the observation that the finding the Maximum Influence Perturbation and its related quantities is trivial for the Taylor series approximation. We then conclude this section with some simple, concrete examples of our approximation in \secreffunction_examples,linear_regression.
2.1 A Taylor series approximation to dropping data
taylor_series We begin by a deriving a Taylor series approximation to the act of dropping data. Though this approximation is well-known as the empirical influence function (see \secrefinfluence_function below for more details), we will derive the approximation assuming no prior knowledge other than ordinary multivariate calculus.
To form a Taylor series, we will naturally require certain aspects of our estimator to be differentiable. We now summarize common assumptions under which the Taylor expansion exists, and note that many common analyses satisfy these assumptions—including, but not limited to, typical settings for OLS, IV, GMM, MLE, and variational Bayes. Below, in \secrefaccuracy, we will state stricter sufficient conditions that guarantee not only the existence but also the finite-sample accuracy of our approximation.
Assumption 1.
is a Z-estimator; that is, is the solution to the following estimating equation,555Sometimes (LABEL:estimating_equation_no_weights) is associated with “M-estimators” that optimize a smooth objective function, since such M-estimators typically take the form of a Z-estimator which set the gradeint of the objective function to zero. However, some Z-estimators, such as exactly identified IV regression or GMM, do not optimize any particular empirical objective function, so the notion of Z-estimator is in fact more general than that of an M-estimator. where is a twice continuously differentiable function and is the column vector of zeros.
| (1) |
Assumption 2.
, which we interpret as a function that takes the full parameter and returns the quantity of interest from , is continuously differentiable.666Below, we will allow for additional dependence in on data weights.
For instance, the function that picks out the -th effect from the vector , , satisfies this assumption.
To form a Taylor series approximation to the act of leaving out datapoints, we introduce a vector of data weights, , where is the weight for the -th data point. We recover the original data set by giving every data point a weight of 1: . We can denote a subset of the original data as follows: start with ; then, if the data point indexed by is left out, set . We can collect weightings corresponding to all data subsets that drop no more than 100% of the original data as follows:
| (2) |
Our approximation will be to form a Taylor expansion of our quantity of interest as a function of the weights, rather than recalculate for each data subset (i.e., for each reweighting).
To that end, we first reformulate our setup, now with the weights ; note that we recover the original problem (for the full data) above by setting in what follows. Let be our parameter estimate at the weighted data set described by . Namely, is the solution to the weighted estimating equation
| (3) |
We allow that the quantity of interest may depend on not only via the estimator , so we optionally write with . Whenever we write as a function of a single argument, we will implicitly mean . We require that be continuously differentiable in both its arguments. For instance, we can use to pick out the -th component of . Or, to consider questions of statistical significance, we may choose , where is an estimate of the standard error depending smoothly on and ; this example is our motivation for allowing the more general dependence in .
With this notation in hand, we can restate our original goal of computing the Most Influential Set as solving
| (4) |
Here we focus on positive changes in since negative changes can be found by reversing the sign of and using instead. In particular, the zero indices of correspond to the Most Influential Set: . And is the Maximum Influence Perturbation. The Perturbation Inducing Proportion is the smallest that induces a change of at least size : .
2.2 A tractable approximation
AMIP Our approximation to the Maximum Influence Perturbation and its related quantities, the Most Influential Set and Perturbation Inducing Proportion, centers on a first-order Taylor expansion in around . Let , the quantity of interest at the original dataset. Then:
| (5) |
We can in turn approximate the Most Influential Set as follows. Let denote the order statistics of , i.e., the sorted from most negative to most positive. Let denote the indicator function taking value when the argument is false and when true. Then
| (6) |
To compute (analogous to the that determines the exact Most Influential Set), we compute for each . Then we choose to have entries equal to zero at the indices where is most negative (and to have entries equal to one elsewhere). Analogous to the Perturbation Inducing Proportion, we can find the minimum data proportion required to achieve a change of some size : i.e., such that . In particular, we iteratively remove the most negative (and the index ) until the change is achieved; if the number of removed points is , the proportion we report is . Recall that finding the exact Maximum Influence Perturbation, Most Influential Set, and Perturbation-Inducing Proportion required running a data analysis more than times. By contrast, our approximation requires running just the single original data analysis, additional fast calculations to compute each , and finally a sort on the values.
We define our approximate quantities, as detailed immediately above, as follows.
Definition 2.
approx_metrics The Approximate Most Influential Set is the set of at most 100% data indices that, when left out, induce the biggest approximate change ; i.e., it is the set of data indices left out by : .
The Approximate Maximum Influence Perturbation (AMIP) is the approximate change observed at : .
The Approximate Perturbation Inducing Proportion is the smallest needed to cause the approximate change to be greater than . That is, . We report NA if no can effect this change.
Below, we will sometimes emphasize that the AMIP is a sensitivity and refer to it as the AMIP sensitivity. We will say that an analysis is AMIP-non-robust if, for a particular of interest, the AMIP is large enough to change the substantive conclusions of the analysis. Conversely, if the AMIP is not large enough, we say an analysis is AMIP-robust. And we generically use the AMIP acronym to describe our methodology even when calculating the Approximate Most Influential Set or Approximate Perturbation Inducing Proportion.
2.2.1 An exact lower bound on the Maximum Influence Perturbation
exact_lower_bound
For any problem where performing estimation a second time is not prohibitively costly, we can re-run our analysis without the data points in the Approximate Most Influential Set and thereby provide a lower bound on the exact Maximum Influence Perturbation.
Formally, let be the weight vector for the exact Most Influential Set, and let be the weight vector for the Approximate Most Influential Set . We run the estimation procedure an extra time to recover . Then, by definition,
Since is a lower bound for , we can use the Approximate Most Influential Set to conclusively demonstrate non-robustness. Of course, this lower bound holds for any weight vector and will be most useful if the Approximate Maximum Influence Perturbation is close to the exact Maximum Influence Perturbation. In \secrefaccuracy below, we establish the accuracy of the approximation for small under mild regularity conditions.
2.2.2 Computing the influence scores
To finish describing our approximation, it remains to detail how to compute from (LABEL:taylor_approx). We will refer to the quantity as the influence score of data point for at since, as we discuss in \secrefinfluence_function below, it is the empirical influence function evaluated at the datapoint . To compute the influence score, we first apply the chain rule:
| (7) |
The derivatives of can be calculated using automatic differentiation software (baydin2017automatic; tensorflow:2015:whitepaper; jax:2018:github; pytorch:2019:lots). And once we have from running the original data analysis, we can evaluate these derivatives at : e.g., .
The term requires slightly more work since is defined implicitly. We follow standard arguments from the statistics and mathematics literatures (krantz2012implicit; hampel1974influence) to show how to calculate it below.
Start by considering the more general setting where is the solution to the equation . We assume is continuously differentiable with full-rank Jacobian matrix; then the derivative exists by the implicit function theorem (krantz2012implicit, Theorem 3.3.1). We can thus use the chain rule and solve for ; in what follows, is the matrix of zeros.
| (8) | ||||
| (9) |
where we can take the inverse by our full-rank assumption.
We apply the general setting above to our special case with to find
| (10) |
which can again be computed with automatic differentiation software.
2.3 Example functions of interest
function_examples We end this section with some concrete examples of quantities of interest. Recall from the start of \secrefMIP that we are often interested in whether we can change the sign or significance of an estimator, or generate a significant result of the opposite sign. Recall that with only one argument is a function of , and with two arguments is a function of both and the weights .
To form our motivating examples, suppose for the remainder of this section we are interested in the -th component of , where is positive and statistically significant. That is, let be an estimator of the variance of the limiting distribution of , and let be the lower end of our confidence interval. So we assume and . Moreover, we will write to emphasize that standard errors are typically given as functions of and the weights . For example, standard errors based on the observed Fisher information matrix will, in general, depend on the weights both explicitly and through .
To make change sign, we can take
| (Change sign) | (11) |
We use instead of since we have defined as a function that we are trying to increase (cf. (LABEL:mis_weight) and the discussion after). Increasing , for in (LABEL:function_change_sign), by an amount is equivalent to changing sign from positive to negative.
To make statistically non-significant, we wish to take the lower bound of the confidence interval to . To that end, we can take
| (Change significance) | (12) |
As in the previous case, we choose (LABEL:function_change_significance) with a leading negative sign because we are trying to increase (cf. (LABEL:mis_weight)). Increasing , for in (LABEL:function_change_significance), by an amount is equivalent to becoming statistically insignificant.
Similarly, to change to a significant result of the opposite sign, we can take
| (Significant sign reversal) |
and , for if the upper end of the confidence interval is negative, then the estimator must be negative and statistically significant.
In each case above, the quantity represents how far we must move in order to reverse our conclusions. In this sense, is a measure of the amount of “signal” in the original dataset. As we will discuss in \secrefwhy below, the signal is one of the three key quantities that determine AMIP robustness.
2.4 A real-world OLS regression example
linear_regression
Before continuing, we illustrate our method with an example. Economists often analyze causal relationships using linear regressions estimated via ordinary least squares (OLS), but a researcher rarely believes the conditional mean dependence is truly linear. Rather, researchers use linear regression since it allows transparent and straightforward estimation of an average treatment effect or local average treatment effect. Researchers often invoke the law of large numbers to justify the focus on the sample mean, and invoke the central limit theorem to justify the use of Gaussian confidence intervals when the sample is large. We now discuss an example from recent economics literature showing how, in practice, the omission of a very small number of data points can have outsize influence on regression parameters in the finite sample even when the full sample is large. We will study AMIP sensitivity for OLS further using simulation and theory in \secrefinfluence_function_ols below.
Consider as an example the set of seven randomized controlled trials of expanding access to microcredit discussed by meager2019understanding. For illustrative purposes we single out the study with the largest sample size: angelucci2015microcredit. This study has approximately 16,500 households. A full treatment of all seven studies is in \secrefexample_microcredit_linear, example_microcredit_hierarchical along with tables and figures of the results discussed below.
We consider the headline results on household business profit regressed on an intercept and a binary variable indicating whether a household was allocated to the treatment group or to the control group. Let denote the profit measured for household in site , and let denote their treatment status. We estimate the following model via OLS with the regression formula . In the notation of \secreftaylor_series, we have , with , and .
We confirm the main findings of the study in estimating a non-significant average treatment effect (ATE) of -4.55 USD PPP per 2 weeks, with a standard error of 5.88. We are interested in whether we can change the sign of from negative to positive, so we take . We compute for each data point in the sample, which takes only a fraction of a second in R using our Zaminfluence package.
Examining , we find that one household has ; removing that single household should flip the sign if the approximation is accurate. We manually remove the data point and re-run the regression, and indeed find that the ATE is now 0.4 with a standard error of 3.19. Moreover, by removing 15 households we can generate an ATE of 7.03 with a standard error of 2.55: a significant result of the opposite sign.
How is it possible for the absence of a single household to flip the sign of an estimate that was ostensibly based on all the information from a sample of 16,500? It may be tempting to suspect the use of sample means, which are known to be non-robust to gross errors, or to speculate that such excess sensitivity is simply symptomatic of ordinary sampling noise which is captured adequately by standard errors. In \secrefwhy to follow, we show that such intuition is not correct. On the contrary, AMIP robustness is in fact fundamentally different than both standard errors and classical robustness to gross errors.
3 Underlying theory and interpretation
why We now establish the determinants and accuracy of AMIP robustness. We begin by deriving the key quantities of AMIP robustness in the simple case of correctly specified univariate OLS regression (\secrefinfluence_function_ols). For this simple case, we show with theory and simulations that AMIP robustness is not necessarily driven by misspecification, that AMIP non-robustness does not vanish asymptotically, and that AMIP robustness is distinct from standard errors. Next, we formally extend these conclusions to general Z-estimators in \secrefinfluence_function. Finally, in \secrefaccuracy, we establish conditions under which the approximation is provably uniformly accurate for small , both in finite sample and asymptotically.
We will see that a central equation in our understanding of AMIP robustness is its decomposition into three key quantities: the signal, noise, and shape. First, the signal is the size of change in our quantity of interest that would reverse our substantive conclusion (see \secreffunction_examples above). Large values of the signal indicate that large changes are needed to make a different decision. Second, the noise is defined by
| (13) |
We call the noise because is typically a consistent estimator of the variance of the limiting distribution of , a fact that will follow below from the relationship between AMIP robustness, robust standard error estimators, and the influence function (see \secrefamip_decomposition, paragraph 3.2.1 or, more generally, \secrefinfluence_function_for_real, paragraph 3.2.3). Third, the shape is defined as
| (14) |
where refers to the -th order statistic of the influence scores, and denotes the indicator function taking value when its argument is true and otherwise. The shape depends in a complicated way on the shape of the tail of the distribution of the influence scores, but we show that with probability one, and that converges in probability to a nonzero constant under standard assumptions (see \secrefamip_decomposition, paragraph 3.2.1). Given these three quantities, we will show in \secrefamip_decomposition, paragraph 3.2.1 that
| (15) |
We refer to the quantity as the signal-to-noise ratio. For a given , (LABEL:robustness_three_parts) suggests that it is the signal-to-noise ratio that primarily determines AMIP robustness. Additionally, this decomposition allows us to succinctly compare AMIP robustness to standard errors and gross-error robustness, as well as to analyze the large- behavior of AMIP robustness.
This section will use the following notation. Let the symbol denote convergence in probability, and denote convergence in distribution, both as . Let denote the operator norm of a matrix.
3.1 Theory and interpretation for Ordinary Least Squares
influence_function_ols We begin by focusing on the simple case of correctly-specified univariate linear regression, both to provide intuition and motivate the more general results that follow.
3.1.1 Problem setup for Ordinary Least Squares example
(a) Model. Let denote a vector of continuous mean-zero regressors, drawn IID from a distribution with finite variance . Let be a vector of IID draws from a distribution, where we will assume is known. For some unknown , let , so that the vector given is drawn from a correctly specified regression model with true coefficient .
(b) Weighted estimating equation. The OLS estimator is traditionally found by maximizing the (log) likelihood: , where does not depend on . In particular, setting the derivative of the log likelihood to zero yields the estimating equation . That is, is a Z-estimator with this choice of (see (LABEL:estimating_equation_no_weights)). Typical Z-estimators do not have closed-form solutions. But in this case, the solution to the estimating equation returns the usual OLS estimate. A similar derivation returns the solution to the weighted estimating equation given in (LABEL:estimating_equation_with_weights): .
(c) Quantity of interest. Suppose we are interested in the sign of . Without loss of generality, we assume . Then our quantity of interest is .
(d) Signal and noise. For our quantity of interest, the signal is since, if we can increase by an amount , its sign will change. To compute the noise, we compute the influence scores. Directly differentiating the explicit formula for gives, as it must, the same value for as the implicit function theorem result of (LABEL:dtheta_dw_general). Letting and , we see, either by direct differentiation or by (LABEL:dtheta_dw_general), that . For intuition about the noise , we observe its asymptotic behavior. Standard results for OLS give:
| (16) |
Note that the noise includes a contribution from both the residual and regressor variance—we describe as the “noise” because it estimates the variability of , not of the residuals (see \secrefols_what_determines, paragraph 1 below). Finally, we emphasize that, although we will be using asymptotics to provide intuition, by “noise” we will always mean the finite-sample quantity , not its asymptotic limit.
3.1.2 What determines AMIP robustness for Ordinary Least Squares?
ols_what_determines Now that we have translated OLS into our framework, we can analyze the AMIP for OLS. To that end, we use both theory and a simulation study. We outline the simulation study before describing our main conclusions. For data points, and for a range of and , we drew normal regressors and residuals . For , we set . We computed the OLS estimator .
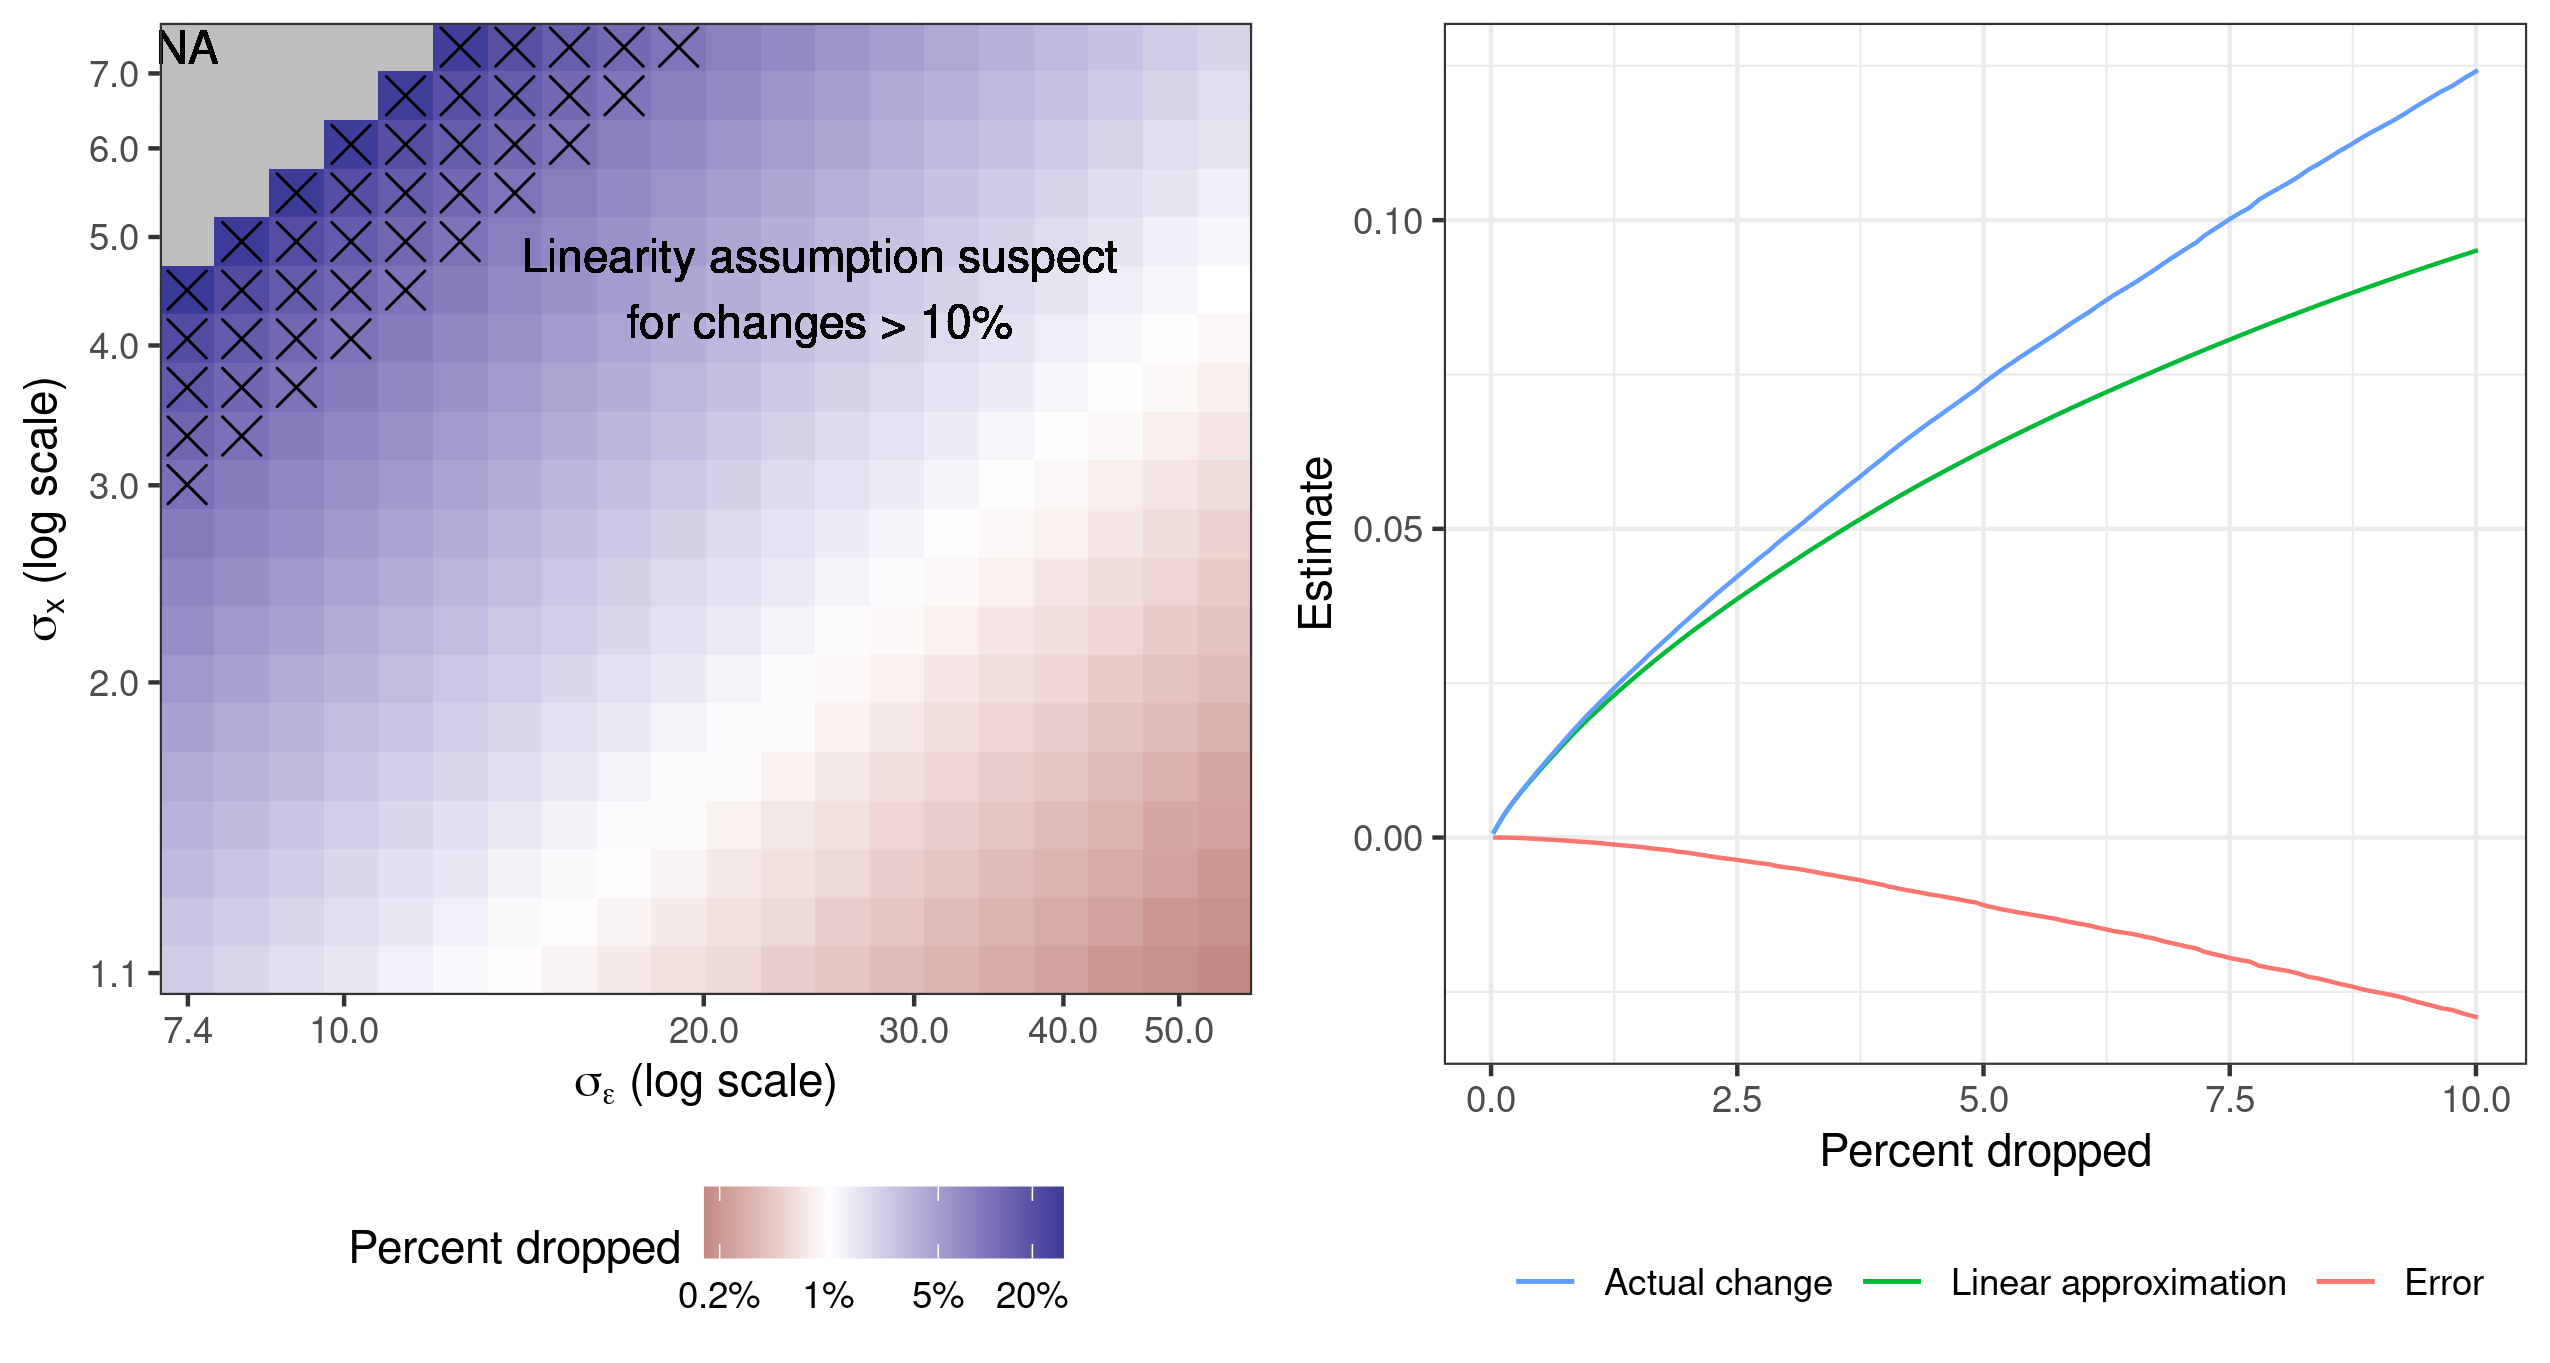
(a) Signal-to-noise ratio drives AMIP robustness. From our discussion at the start of \secrefwhy, we expect that the signal-to-noise ratio drives whether an analysis is AMIP-robust or not. In our simulation, is large and we keep fixed, so we expect that the signal does not change substantially over the simulation. Therefore, signal-to-noise is controlled by the noise. Following the asymptotic argument above, we approximate the noise as . In the left panel of \figrefsim-comb-normal, we vary and and plot the resulting Approximate Perturbation Inducing Proportion to change the sign of . As expected, we see that the simulations with the largest approximate noise are the least robust, in the sense that one can reverse the sign of by dropping a very small proportion of points.
(b) Influential data points have both a large residual and large regressor. Let denote the products , sorted from most negative to most positive, so that the sorted influence scores are . From this formula, we observe that influential datapoints have both a large residual and a large regressor (relative to the regressor variance).777 Indeed, if we had taken , then the -th influence score would have been , which is precisely the leverage score times the residual. This expression formalizes the conceptual link made by chatterjee1986influential between influence, leverage, and large values of . A typical influence score goes to zero at rate , though extreme values such as may obey a different rate. However, since and are finite with high probability, even does not diverge in this case.888The finiteness follows from the inequality , with an analogous inequality for . However, since we know is Gaussian, we actually have a stronger result in this case: grows at rate (rigollet:2015:highdimstats, Theorem 1.14).
(c) AMIP sensitivity does not vanish as . Standard results for OLS give that and . So . Consequently, the empirical distribution of converges to a non-degenerate distribution with finite variance. Let denote the -th quantile of the distribution of the random variable . Since and are independent, and about half of the will be negative, we expect about half of the influence scores to be negative. So for , with high probability at least influence scores are negative. Then, by (LABEL:w_approx_opt) and Slutsky’s theorem, we have
The right hand side of the preceding display is strictly positive for finite . So, for fixed , we expect that AMIP sensitivity does not vanish as .999As desired, though, the expectation does go to zero as since .
(d) AMIP non-robustness is not due only to misspecification. Our simulations are well specified. Yet we see from \figrefsim-comb-normal that different cases can still be robust or non-robust under various robustness cut-offs—according to their differing signal-to-noise ratios.
Asymptotically as , even in a well-specified model, we in fact expect AMIP non-robustness at any for a sufficiently small . The limiting value of the AMIP sensitivity does not depend on . Thus, as , our quantity of interest (for changing the sign of the estimator) will be AMIP non-robust with high probability if and only if . If we are interested in the sign of , and is small relative to the tail means of , then the problem will be AMIP non-robust with probability approaching one, no matter how large is—despite the fact that the model is correctly specified and there are no abnormalities in the data.
(e) Though both are scaled by the noise, standard errors are different from—and typically smaller than—AMIP sensitivity. In what may seem at first like a remarkable coincidence, the variance of the limiting distribution of (which determines AMIP sensitivity—see (LABEL:taylor_approx)) is the same as the variance of the limiting distribution of our quantity of interest (which determines classical standard errors). The two distributions are not the same—the limiting distribution of is not, in general, normal—but they have the same scale. In particular, compare the noise limit in (LABEL:ols_limit_of_noise) with the following limit, which follows by standard results for OLS.
As we discuss below in \secrefamip_decomposition, paragraph 3.2.1 and \secrefinfluence_function, paragraph 3.2.3, this equality is no coincidence, but a general (and well-known) relationship between influence scores and the limiting distributions of quantities of interest.
For large , use of standard errors will admit the hypothesis that might be whenever . Thus, for every , using standard errors always rejects for sufficiently large . By contrast, as we saw above, using the AMIP will admit a change large enough to move to whenever
Thus, we see that both the AMIP sensitivity and standard errors admit larger possible values for when the limiting value of the signal-to-noise ratio is large. But AMIP sensitivity is determined by the tail mean of the standardized influence scores, and standard errors are determined by a quantity that goes to zero as . Thus AMIP sensitivity is distinct from, and typically larger than, standard errors. The tail behavior of the unit-variance random variable is exactly the shape we introduced at the start of \secrefwhy. The shape captures the scale-independent shape of the tails of the distribution of the influence scores; see \secrefamip_decomposition, paragraph 3.2.1 below for a detailed and general analysis.
(f) Our approximation is accurate for small . The expression for depends on two terms, and , both of which are uniformly smooth functions of with high probability for sufficiently small . As a consequence of smoothness, we expect a linear approximation formed at to be accurate when is small. And when contains no more than zeros and the rest ones, we have that , so we expect a linear approximation to be accurate when is small. We make this intuition precise and general in \secrefaccuracy below.
We check the accuracy of the approximation empirically in \figrefsim-comb-normal. For the right hand plot in \figrefsim-comb-normal, we fixed and . We computed the Approximate Most Influential Set for a range of left-out proportions from to . For each , we computed the linear approximation, re-ran the regression to compute the actual change, and computed the error of the linear approximation as the difference of the two. The right panel of \figrefsim-comb-normal shows how the relative error of the approximation vanishes for small , and that, qualitatively, the approximation is very good for removal proportions less than .
3.2 Theory and interpretation for general Z-estimators
influence_function
We next show that the conclusions of \secrefinfluence_function_ols hold not just for OLS but in considerable generality for Z-estimators applied to IID data. In the present section, we will establish more generally that AMIP sensitivity is not a product of misspecification, does not vanish as goes to infinity, and is distinct from standard errors. To that end, in \secrefamip_decomposition we first formally decompose the AMIP into the shape and noise terms defined at the beginning of \secrefwhy, and we establish that the shape is roughly constant across distributions. Then, in \secrefamip_robustness_breakdown, we use this decomposition to revisit our OLS conclusions about AMIP sensitivity but now more broadly. Finally, in \secrefinfluence_function_for_real, we connect the AMIP to the influence function, showing how AMIP robustness is different from gross error robustness.
3.2.1 The decomposition of the AMIP
amip_decomposition
(a) The AMIP is the noise times the shape. Let denote the order statistics of the influence scores. Recall that the Approximate Maximum Influence Perturbation is given by the negative of the sum of the largest influence scores. So we can write
| (17) |
The first equality follows from the definition of the AMIP (\defrefapprox_metrics). The second equality follows from (LABEL:w_approx_opt). The third equality follows from the definitions of noise and shape at the start of \secrefwhy.
(b) The noise is an estimator of the standard deviation of the limiting distribution of the quantity of interest (Z-estimator version). In the case of Z-estimators, we can show by direct computation that is the estimator of the variance of the limiting distribution of given by the delta method and the “sandwich” or “robust” covariance estimator (huber1967sandwich; stefanski:2002:mestimation). To see this, observe first that , as given by (LABEL:dtheta_dw), is precisely the sandwich covariance estimator for the covariance of the limiting distribution of . In turn, the sample variance of the linear approximation given in (LABEL:chain_rule_influence_score), given by , is then the delta method variance estimator for . Note that we came to the same conclusion in the special case of OLS in \secrefols_what_determines, paragraph 1 above.
It follows that we can use to form consistent credible intervals for , a fact that will be useful below when comparing AMIP robustness to standard errors. Specifically, if and , then
| (18) |
As we discuss in \secrefinfluence_function_for_real, paragraph 3.2.3 below, this relationship between asymptotic variance and the influence scores is in fact a consequence of a general relationship between influence functions and distributional limits.
(c) The shape depends primarily on , not on the model specification. More precisely, we next show that the shape satisfies the following properties. (1) With probability one, . (2) Typically, converges in probability to a nonzero constant as . (3) is largest when the influence scores of the left-out points are all equal. Conversely, heavy tails in the distribution of result in smaller values of . (4) Empirically, varies relatively little among common sampling distributions.
To prove the lower bound in (1), we observe that the indicator accounts for the fact that the adversarial weight would leave out fewer points rather than drop a point with positive . Because of this, . We show the upper bound of (1) as part of the extremization argument for (3) below.
To prove (2), notice that is a sum of positive terms, divided by . In general, then, we expect to converge to a nonzero constant for fixed as long as the distribution of converges marginally in distribution to a non-degenerate random variable. And indeed, by (LABEL:chain_rule_influence_score,_dtheta_dw), we expect such convergence from Slutsky’s theorem as long as and converge in probability to constants, since is proportional to , which itself has a non-degenerate limiting distribution.
We next show (3), that takes its largest possible value when all the influence scores take the same negative value. To that end, take to be an integer for simplicity. By the definition of ((LABEL:inflscale_def)), , and by properties of the influence function detailed below, (\secrefinfluence_function_for_real, paragraph 3.2.3). So is a tail average of scalars with zero sample mean and unit sample variance. Therefore, it is equivalent to consider scalars with and and to ask how to maximize the average .
To perform this maximization we divide datapoints into a set of dropped indices, and set of kept indices. To be precise, and . We write the sample means and variances within the sets respectively as and , with analogous expressions for and . In this notation, our goal is to extremize , the mean in the dropped set. The constraints on the distribution can then be written as , and . Given these constraints, we extremize by setting , in which case we achieve . Identifying with , and with , we see that the worst-case value of occurs when all the influence scores take the same negative value. This observation completes our argument for (3). It also follows from this argument that with probability one, a bound that is achieved in the worst-case. This observation supplies the upper bound in (1).
To establish point (4), we fix a representative , simulate a large number of IID draws from some common distributions, standardize to get , and compute the shape . We find that, across common distributions, varies relatively little. For example, for , a Normal distribution gives , a Cauchy distribution gives . As expected based on the reasoning of the previous paragraph, the heavy-tailed Cauchy distribution has a smaller shape than the Normal distribution. The worst-case distribution, for which all left-out are equal, gives as expected.
3.2.2 What determines AMIP robustness?
amip_robustness_breakdown We now use the decomposition of the AMIP into noise and shape, and the relative stability of the shape, to derive a number of general properties of AMIP robustness.
(a) Signal-to-noise ratio drives AMIP robustness. We argued above that we do not expect to vary radically from one problem to another. By contrast, the noise can, in principle, be any positive number. We conclude then, that the signal-to-noise ratio, rather than the shape, principally determines AMIP robustness.
This relationship also suggests what might be done if the analysis is deemed AMIP non-robust. Since, as we showed in \secrefamip_decomposition, paragraph 3.2.1, is thus the same quantity that enters standard error computations, analysts are typically attentive to choosing estimators with as small as possible while still guaranteeing desirable properties like consistency. Meanwhile, the signal is determined by the question being asked and the true state of nature as estimated by . In light of these observations, consider a case where is too small to ensure AMIP robustness. Then it seems necessary for the investigator to ask a different question, or investigate different data, to find an AMIP robust analysis.
(b) AMIP sensitivity does not vanish as . Both and converge to nonzero constants. So , the estimated amount by which you can change an estimator, does not go to zero, either. If the signal is less than the probability limit of , then the problem will be AMIP non-robust no matter how large grows. As we discuss below, this behavior contrasts sharply with the behavior of standard errors.
(c) AMIP non-robustness is not due only to misspecification. Consider a correctly-specified problem with no aberrant data points. As we discussed above in \secrefamip_decomposition, paragraph 3.2.1, the noise will still have some non-zero probability limit. We showed in \secrefamip_decomposition, paragraph 3.2.1 that the shape will have a non-zero probability limit. And the quantity of interest can generally be expected to have a non-zero probability limit. So by the decomposition of (LABEL:robustness_three_parts), if the user is interested in a question whose signal is small enough, their problem will be AMIP non-robust, despite correct specification.
(d) Though both are scaled by noise, standard errors are different from—and typically smaller than—AMIP sensitivity. Recall that classical standard errors based on limiting normal approximations also depend on , in that we typically report a confidence interval for of the form , where is some quantile of the normal distribution, e.g. the 0.975-th quantile . In this sense, using standard errors errors allow that may be as large as whenever . By contrast, AMIP robustness allows that may be as large as when . Since in general, these two approaches will yield different conclusions. Indeed, typically converges to a non-zero constant as , while converges to zero.
(e) Statistical non-significance is always AMIP-non-robust as . This observation follows as a corollary of the discussion above. In particular, we might conclude statistical non-significance if . To produce a statistically significant result, and so undermine the conclusion, it suffices to move by more than . Take any . As we have seen above, we can produce a change of , which is greater than whenever . Thus, for any fixed , there always exists a sufficiently large such that statistical non-significance can be undermined by dropping at most proportion of the data. By contrast, statistical significance can be robust if converges to a value sufficiently far from .
3.2.3 The influence function
influence_function_for_real
We next review the influence function, its known properties, and its particular form for Z-estimators (e.g., hampel1986robustbook, chapter 2.3). We first show the relationship between the influence scores and the empirical influence function. We use these connections to further justify the relationship between the noise and the limiting distribution of . Finally, we use these classical properties of the influence function to contrast AMIP robustness with gross error robustness and establish that outliers primarily affect AMIP robustness via the noise, rather than via the shape.
(a) Writing a statistic as a functional of the empirical distribution. Before defining the influence function, we set up some useful notation. Suppose we observe IID data, . Each point is drawn from a data distribution , where the inequality may be multi-dimensional. For a generic distribution , let represent a functional of the distribution: . One example is the sample mean; for a generic distribution , let . Then is the population mean. If we let denote the empirical distribution function , then is the sample mean.
Now consider Z-estimators. Define to be a quantity satisfying
| (19) |
See, e.g., hampel1986robustbook. If we plug in for in (LABEL:estimating_equation_F) (and multiply both sides by ), we recover the Z-estimator estimating equation from (LABEL:estimating_equation_no_weights), with solution . Similarly, let to be the distribution function putting weight at data point . Plugging in for in (LABEL:estimating_equation_F) yields the estimating equation in (LABEL:estimating_equation_with_weights), for weighted Z-estimators, with solution . Finally, we can define a new functional by applying the smooth function , which picks out our quantity of interest, to : .101010 As in ordinary calculus in Euclidean space, we can also allow for explicit dependence in by writing . Allowing this level of generality, though, is notationally burdensome and not typical in the analysis of the influence functions for Z-estimators. So we omit this dependence for simplicity.
(b) The influence function. The influence function measures the effect on a statistic of adding an infinitesimal amount of mass at point to some base or reference data distribution (reeds1976thesis; hampel1986robustbook). Let be the probability measure with an atom of size at . Then
| (20) |
The influence function is defined in terms of an ordinary univariate derivative, and can be computed (as a function of and ) using standard univariate calculus. In particular, our quantity of interest has the following influence function:
| (21) |
By comparing (LABEL:influence_function_Z_estimator) with the definition of in (LABEL:chain_rule_influence_score,_dtheta_dw), we can see that, formally,111111The factor of arises to re-write the expectation as a sum over unit-valued weights.
| (22) |
infl_is_infl is not a coincidence. To see this, note that the set of distributions that can be expressed as weighted empirical distributions ( above) is precisely the subspace of possible distribution functions concentrated on the observed data. So the derivative ((LABEL:taylor_approx)) is simply a path derivative representation of the functional derivative .
We refer to the influence function applied with as the empirical influence function (hampel1986robustbook). We conclude that the that we use to form our approximation are the values of the empirical influence function at the datapoints . For this reason, we refer to the as influence scores.
(c) The sum of the influence scores is zero. We can now use standard properties of the influence function to reason about . For instance, the fact that follows from (LABEL:influence_function_Z_estimator) and the fact that solves (LABEL:estimating_equation_no_weights).
(d) The noise is an estimator of the standard deviation of the limiting distribution of the quantity of interest (influence function version). Observe that, by our influence function development above, we can write the squared noise as follows.
| (23) |
Recall that we saw above that consistently estimates the variance of the limiting distribution of , first in the special case of OLS (\secrefols_what_determines, paragraph 1) and then for Z-estimators in general (\secrefamip_decomposition, paragraph 3.2.1). We can now see that those results are themselves special cases of the following well-known relationship between the influence function and the limiting variance of its corresponding functional:
| (24) |
where the expectation in the preceding display is taken with respect to (see, e.g., hampel1986robustbook).121212Though (LABEL:infl_normal_limit) can provide useful intuition, as it does in our case, it is often easier in any particular problem to prove asymptotic results directly rather than through the functional analysis perspective of this section, since stating precise and general conditions under which (LABEL:infl_normal_limit) holds can be challenging. See, for example, the discussion in serfling2009approximation or vaart2000asymptotic. Specifically, if we can show that , the probability limit of , is equal to , then (LABEL:infl_normal_limit) would imply , just as we showed in (LABEL:z_normal_limit) using the sandwich covariance estimator. In our case, under standard assumptions, one can show directly from (LABEL:chain_rule_influence_score,_dtheta_dw) that , almost surely in . A law of large numbers can then be applied to (LABEL:scale_is_influence_norm) giving the desired result.
(e) AMIP robustness is different from gross error robustness. Roughly speaking, an estimator is considered non-robust to gross errors if its influence function is unbounded (huber1981robust). For instance, the influence function arising from the OLS Z-estimator (\secrefinfluence_function_ols) is classically known to be non-robust to gross errors. When an influence function is unbounded, one can produce arbitrarily large changes in the quantity of interest by making arbitrarily large changes to a single datapoint. Gross-error robustness is motivated by the possibility that some small number of datapoints come from a distribution arbitrarily different from the model’s posited distribution. By contrast, to assess AMIP robustness, we do not make arbitrarily large changes to datapoints. We simply remove datapoints. And the analysis is AMIP-non-robust if a change of a particular size () can be induced, rather than an arbitrarily large change. Consequently, problems with unbounded influence functions (such as OLS in \secrefinfluence_function_ols) can be AMIP-robust if is sufficiently large. And perfectly specified problems with no outliers can be AMIP non-robust if is sufficiently small.
(f) Outliers affect AMIP robustness through the noise. Consideration of gross-error robustness encourages users to examine their data for unusual “outliers” in the data; once outliers are removed or their influence diminished, the problem is considered gross-error robust. Since outliers are heuristically associated with heavy-tailed data distributions, one might expect the effect of outliers to affect AMIP robustness through the shape variable . However, our analysis of \secrefamip_decomposition, paragraph 3.2.1 shows that gross errors actually reduce and so render an estimator more robust for a fixed . This observation does not imply that gross errors decrease AMIP sensitivity. Rather, gross errors increase AMIP sensitivity through the noise . And, as we have seen, effects on also affect the computation of standard errors.
3.3 Accuracy of the approximation
accuracy In \secrefols_what_determines, paragraph 1 we argued that our approximation was accurate in OLS for small . Now we extend that argument to the general case. In particular, we state sufficient conditions under which provides a good approximation to for small uniformly for . Our key result,