How effective are face coverings in reducing transmission of COVID-19?
Abstract
In the COVID–19 pandemic, billions are wearing face masks, in both health care settings and in public. Which type of mask we should wear in what situation, is therefore important. There are three basic types: cotton, surgical, and respirators (e.g. FFP2, N95 and similar). All are essentially air filters worn on the face. Air filtration is relatively well understood, however, we have almost no direct evidence on the relative role played by aerosol particles of differing sizes in disease transmission. But if the virus concentration is assumed independent of aerosol particle size, then most virus will be in particles . We develop a model that predicts surgical masks are effective at reducing the risk of airborne transmission because the filtering material most surgical masks use is highly effective at filtering particles with diameters . However, surgical masks are significantly less effective than masks of FFP2, N95 and similar standards, mostly due to the poor fit of surgical masks. Earlier work found that of the air bypasses a surgical mask and is not filtered. This highlights the fact that standards for surgical masks do not specify how well the mask should fit, and so are not adequate for protection against COVID-19.
I Introduction
The COVID-19 pandemic has brought critically neglected areas of infection control onto the global stage Dancer (2020). Most notably this includes the risk of airborne transmission and the strategies required to mitigate it Morawska and Cao (2020). The airborne route involves transmission of viral material through aerosols, and is the dominant transmission route for SARS-CoV-2 Prather et al. (2020a). Respiratory aerosol particles vary in diameter from Bar-On et al. (2020); Prather et al. (2020b). Given this broad size range, we can expect their potency as disease vectors and the effectiveness of interventions to be size-dependent.
Face coverings are mandated (or strongly encouraged) around the world in healthcare settings and public spaces Masks4All (2020); YouGov (2020). The current evidence suggests that they reduce airborne transmission of SARS-CoV-2 Greenhalgh et al. (2020); DELVE Initiative (2020); Howard et al. (2021). An important question concerns what kind of mask should be worn in each situation? Different levels of protection are required in healthcare settings than out in the wider community, and requirements will further depend on the particular circumstances. For example, Jones et al. Jones et al. (2020a) found that healthcare workers in critical care had lower than average infection rates, suggesting that other healthcare workers may be underprotected. There are essentially three types of face coverings: (i) fabric or cloth coverings, (ii) surgical masks, and (iii) respirators (e.g. N95/KN95/FFP2 or similar). Here we use ‘mask’ and ‘face covering’ interchangeably to refer to any of these. There are also masks designed to be resistant to oil aerosols, and to be splash resistant. We do not consider these here.
Here, we explore the aerosol size-dependent factors affecting mask effectiveness in aerosol particles in diameter.
I.1 Aerosol dynamics and transmission
Much work has focused on how far aerosols are transmitted, with a particular focus on establishing guidelines for physical distancing. Multiple studies have examined the transport of respired aerosols in still air Xie et al. (2007); Bourouiba et al. (2014); Liu et al. (2017); Bazant and Bush (2020), and other studies have explored the effect that masks have on exhalation plumes Tang et al. (2009); Dbouk and Drikakis (2020); Viola et al. (2021); Li et al. (2021). Aerosol particle size is a crucial factor affecting their distance travelled, but the focus in such studies is typically on the striking dynamical change that occurs for coarse aerosol particles with diameters in the range . With these large particles, fragmentation as they pass through masks is a particular concern Bourouiba et al. (2014); Scharfman et al. (2016); Mittal et al. (2020); Poon et al. (2020); Fischer et al. (2020); Sharma et al. (2021).
However, finer aerosol particles may be disease vectors. Fine respiratory particles arise from within the lower respiratory tract Johnson et al. (2011), where SARS-CoV-2 pathogenesis is known to occur Jin et al. (2020); Kanimozhi et al. (2021). Viral RNA has been found in aerosol particles smaller than , though finding viable virus titers seems to depend on particle size Santarpia et al. (2021). One hamster study found that the majority of virus was contained in aerosol particles smaller than Hawks et al. (2021). These fine particles have such long persistence times Vuorinen et al. (2020) that how far they travel in plumes is less important than factors such as masking and air ventilation in indoor environments, where filtration is size-dependent.
A widespread model for airborne transmission in indoor environments is the Wells-Riley equation Riley et al. (1978); Gammaitoni and Nucci (1997), which has been adapted to assess the risk of infection with SARS-CoV-2 Jimenez et al. (2020); Buonanno et al. (2020); Dai and Zhao (2020). This model considers the limit where air in a room is well-mixed, i.e. ignoring any currents or expiratory jets, while still considering such factors as air ventilation, particle deposition rates, and the rate of release of so-called infection quanta into the room. An infection quantum is a theoretical airborne dose expected to infect of susceptible people. Transmission risk in these models is highly dependent on the rate at which an infected person releases these quanta. Given the multitude of factors involved in airborne transmission, biological and otherwise, there is large uncertainty in for the new SARS-CoV-2 pathogen Buonanno et al. (2020); Dai and Zhao (2020). One novel study examined the effect that distance, ventilation and masks have on infection risk by performing CFD simulations on a realistic 3d representation of a classroom Foster and Kinzel (2021), finding reasonable overall agreement with Wells-Riley modelling despite significant deviations.
Particle size-dependence is incorporated into the Wells-Riley models (and its derivatives) through the particle deposition rates and the factor, whereas mask effectiveness has been incorporated solely as a dilution parameter as in e.g. Ref. Dai and Zhao, 2020. Masks are in effect assumed to act solely by modifying the other parameters, creating an effective ventilation rate and an effective Dai and Zhao (2020). The complex interplay between mask effectiveness and biological factors such as aerosol production and viral load, and how this varies with particle size, has not yet been incorporated into these models.
I.2 Mask standards
A mask is nothing more or less than an air filter worn on the face. Various governments have introduced minimum standards for masks. Here, we will briefly outline two European and two American standards.
For each type of face covering there are different standards. Most fabric coverings are not made to a standard. However, ASTM International recently introduced a ‘barrier face covering standard’ F3502 ASTM International (2021a). This specifies filtration in terms of a polydisperse aerosol of sodium chloride crystals with sizes around , but does not specify how well the mask must fit the face to avoid air leaking around the edges of the mask.
For surgical masks, standards typically only cover the filtration of the material the masks is made from. While for respirators, the standards cover both the filtration efficiency of the material and how well it actually performs while worn: the standards therefore specify the quality of the mask fit European Committee for Standardization (2019a); U.S. Public Health Service (1995). As an example, we can look at the European standard EN 149 — ‘Filtering Halfmasks to protect against particles’, for a filtering facepiece respirator (FFP) standard. This has three levels with increasingly stringent requirements: FFP1, 2 and 3. The FFP2 standard requires (simply speaking) European Committee for Standardization (2019a):
-
1.
The filtering material must filter out at least 94% by mass of a test aerosol.
-
2.
The average filtration of test subjects wearing the mask (while performing standard tasks) must be at least 92% of the mass of the test aerosol.
The test aerosol for European standards of filtering facepiece respirator (FFP), is specified by the European standard EN 13274-7 European Committee for Standardization (2019a). A convenient aerosol of sodium chloride crystals is used where ‘the number median of the particle size distribution is between a diameter of 60 and , with a geometric standard deviation between 2.0 and 3.0’European Committee for Standardization (2019a); Zoller et al. (2021). The fraction filtered is assessed by measuring the mass of sodium, i.e. the mass (rather than number) fraction filtered is assessed.
Note that the USA N95 standard uses light scattering from aerosol particles to measure filtration. The aerosol specification, is also slightly different U.S. Public Health Service (1995). Thus, although the USA and European methods are similar, the filtration numbers are not exactly comparable.
The European standard for surgical masks is EN 14683 — ‘ Medical face masks — Requirements and test methods’European Committee for Standardization (2019b). The only filtration requirement is that the material of the mask should filter an aerosol of particles containing the bacterium Staphylococcus aureus. The bacterial filtration efficiency (BFE) of the mask material is the fractional reduction in the number of colony forming units (CFUs) when the aerosol is passed through the material. For a Type II mask under this standard, the BFE must achieve a CFU reduction of at least 98%. The aerosol is required to have a mean diameter of European Committee for Standardization (2019b), and specifies a cascade impactor be used to measure droplet size. Note that the standard does not specify what the distribution of droplet sizes is, but it does specify that the droplets are formed immediately before the mask, allowing little time for evaporation European Committee for Standardization (2019b). So we assume the droplets do not have time to dry out. There is no test of fit to the face, so no requirement that a surgical mask fits well with few gaps for air to bypass the mask.
Another standard for masks is the F2100 standard of ASTM International ASTM International (2021b). This has similar BFE requirements to the European Type II standard but in addition uses a test aerosol of latex spheres. For example, the Level 3 standard F2100 standard requires that these particles must filter out with at least 98% efficiency. This is in addition to a BFE of at least 98%. So the requirements on the filtration properties are more stringent than for the Type II standard. However, there is still no test of fit in this standard ASTM International (2021b).
Note that standards such as FFP2 (and N95) are designed to specify a minimum protection to all dangerous aerosols, not just droplets we breathe out that may contain a virus. So for example, they may also be worn when airborne asbestos is present. While the standards for surgical masks are aimed at reducing the amount of bacteria breathed out, for a wearer in an environment such as an operating theatre, that must be kept as sterile as possible.
I.3 Focus of this work
While there is much literature on filtration, the details of how the size-dependent effectiveness of masks affect airborne transmission is less well understood. There has been a vigorous debate on the role of particle size on transmission Tellier (2009); Asadi et al. (2019); Vuorinen et al. (2020); Bourouiba (2020). But this has focused on the size-dependent dynamics of particles in the air we breathe, rather than the competing effects that aerosol particle size has on the viral dose versus the protection offered by a face covering.
Here we focus on the latter, and we aim to show the relative importance of mask fit and viral load on total protection. We quantify the most important factors in mask protection by incorporating available data from the literature into a single-unified model describing:
-
1.
How filtration depends on aerosol particle size. Section II is largely review where we outline filtration for a general audience.
-
2.
The size distribution of deposited (fine) aerosol particles in diameter, encompassing both evaporation of exhaled aerosols before inhalation and the probability that these are deposited in the respiratory tract upon inhalation.
-
3.
How the viral load in the exhaler’s respiratory fluid affects the size distribution of deposited viral aerosol particles.
-
4.
Finally, the expected overall reduction in deposited viral aerosol particles from mask interventions under the combination of these effects.
Note that we are interested in the overall protection offered to a community rather than just an individual; we therefore explore the effect of masking the exhaler (“source control”) in addition to the inhaler.
We find that the final protection offered varies significantly depending on the mask material (including the number of layers in the cloth masks), the face seal and the degree of viral shedding. The first factor has been reasonably well-explored during the pandemic Zangmeister et al. (2020); Konda et al. (2020a); Lustig et al. (2020); Hao et al. (2020), but the latter two factors have been underappreciated in our opinion. A poorly fitted mask will offer limited protection, as aerosol particles can bypass the mask materialFreitag et al. (2020); Duncan et al. (2020). Finally, we show that the amount of viable virus prevented from being inhaled by a susceptible individual depends on the size distribution of respiratory particles and the viral load of the exhaler.
II Masks are personal air filters
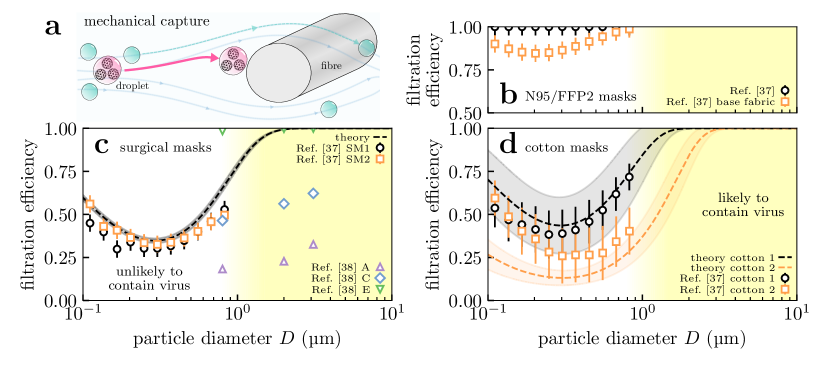
Masks are air filters, and how these work and how efficient they are at filtering out particles of differing sizes is reasonably well understood Robinson et al. (2021); Wang and Otani (2013). Coarser aerosol particles with diameter , which are more capable of containing significant viral doses (cf. section III.3), are more easily filtered; finer particles by contrast are transported around the fibre by the gas flow. We illustrate this schematically in Fig. 1(a).
We show experimental measurements for the filtering efficiency in medical-grade respirators from the literature in Fig. 1(b). Respirators are specialist materials typically composed of electret fibres; these fibres carry considerable electrostatic charge Chen et al. (1993); Kravtsov et al. (2000) which increases the efficiency in the regime. These charges diminish over time which will decrease the filtration efficiency. The results for the base fabric (squares) are for its uncharged state, and thus suggest a lower bound on the respirator’s efficiency after repeat use.
In Fig. 1(c) we have plotted both measurements of surgical mask filtering efficiency (symbols) and theoretical calculations (curves). The theoretical calculations involved following the trajectories of particles inserted into the gas flow around fibres, described elsewhere Robinson et al. (2021) and in the Supplementary Material (SM). The efficiency is plotted as a function of the particle diameter, because the particle size ultimately determines how hard or easy it is to filter out. Our model and the measurements of Refs. Zangmeister et al., 2020 agree on the same basic facts:
-
•
Filtering efficiency is essentially for particles in diameter or larger.
-
•
However, filtering efficiency is low () in the range .
These predictions make quantitative the picture we laid out in the preceding paragraph and Fig. 1(a). Both surgical and cotton masks are thus only partially effective at filtering out sub-micrometre aerosol particles. However, their efficiency rapidly increases as the size increases beyond a micrometre, so masks are generally highly effective in this regime. Note that there is considerable variation in mask quality, reflecting the many available standards. The “dental masks” A and C of Ref. Oberg and Brosseau, 2008 (shown in Fig. 1 for reference) do not pass any mask standard (not even the less stringent BFE test at ) making them of very poor quality. Conversely, most of the surgical masks tested in Refs. Oberg and Brosseau, 2008; Duncan et al., 2020 outperform the predictions of our theoretical profile and Ref. Zangmeister et al., 2020.
For reference, SARS-CoV-2 is approximately in diameter Bar-On et al. (2020), so any particle larger than this can potentially carry a virus. However, in the next section we will argue that only particles larger than are likely to contain any virus in the majority of cases; thus filtration efficiency in this regime is sufficient to significantly reduce transmission.
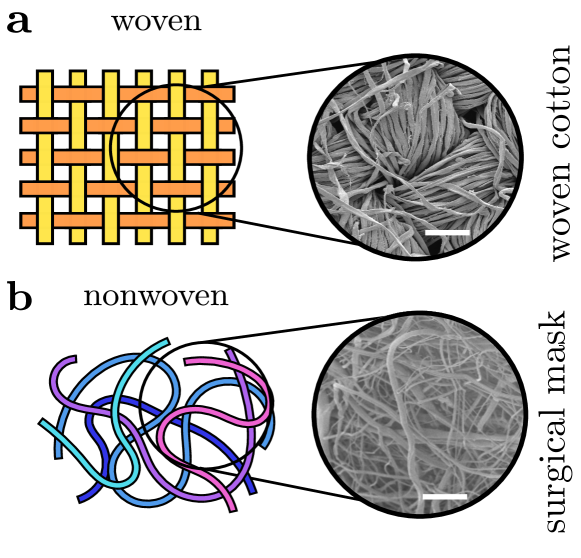
Surgical masks are meshes of fibres (cf. Fig. 2(b)), whereas cloth face coverings are typically more ordered (e.g. woven fabric in Fig. 2(a)). In Fig. 1(d) we compare measurements and model predictions for the material of two masks formed from 4 layers of plain-woven cotton fabrics Ref. Zangmeister et al., 2020. There is considerable variation, but for the best fabric the behaviour is more-or-less identical to surgical masks; this is broadly in agreement with the findings of Refs. Zangmeister et al., 2020; Konda et al., 2020a; Lustig et al., 2020; Wang, 2020 and demonstrates that reusable cloth masks can be suitable replacements for disposable surgical masks.
Returning to the mechanism, we briefly discuss the physics underlying this behaviour (more details can be found in Ref. Robinson et al., 2021). Masks are fundamentally arrays of fibres, see Fig. 2, so air must flow around and between these fibres. Particles a fraction of a micrometre in size have very little inertia and so tend to follow the air flow through the mask faithfully avoiding the fibres. However, the particle inertia varies with its mass i.e. the cube of its diameter (its volume). This means it rapidly increases with diameter. Beyond around in diameter the particles have too much inertia to follow the air as it twists in between the fibres, and so they impact onto the fibres. On microscopic lengthscales most surfaces are attractive, so colliding particles will stick and remain on the fibres Robinson et al. (2021). Because of this basic physics, the filtering efficiency of particles larger than is likely to be limited only by the leakage of air around the mask. For the intermediate range the exact behaviour will depend on the details of the material, but the rapid rise in filtration efficiency with particle size is a robust feature Robinson et al. (2021). Finally, we note that the filtration efficiency increases for capture of the smallest aerosol particles () in Fig. 1(b-c) where capture is enhanced by Brownian motion. We have not focused on this mechanism because such small particles are highly unlikely to carry significant doses of virus.
III Size distribution of fine respiratory aerosol particles involved in airborne transmission
To assess the effect of mask wearing we need to know which respiratory aerosol particles are likely to carry significant doses of virus. We thus need to know the size distribution of particles on exhalation and inhalation, and how concentrated the (viable) virus is in aerosols produced by shedding in an infected individual.
III.1 Size distribution of bioaerosol particles
We need the size distribution of particles on inhalation and exhalation. The former are obtained from the latter through knowledge of the evaporation kinetics, so we begin with exhaled particles.
Expiratory particles can be meaningfully categorised by their site of origin in the respiratory system. Larger particles are more likely to be deposited in the respiratory tract Zhang et al. (2012); Cheng (2014); Chalvatzaki et al. (2020); Guo et al. (2020), so a large aerosol particle originating deep in the respiratory tract would immediately deposit and be unlikely to escape; therefore as a rule, smaller exhaled aerosol particles emerge from lower in the respiratory tract. The majority of aerosol particles (and droplets) produced in the oral cavity vary in size from Johnson et al. (2011), whereas particles produced in the Larynx and the lower respiratory tract are seen in the range Morawska et al. (2009); Johnson et al. (2011); Asadi et al. (2019); Gregson et al. (2021). The former presumably contain the majority of virus because volume scales as the diameter cubed 111The concentration of viable virus may be lower in oral-mode droplets: in influenza it is a factor of smaller Milton et al. (2013), however even accounting for this a factor of 10 increase in diameter increases the expected number of virions by ., but the latter will be our focus for reasons laid out in the introduction.
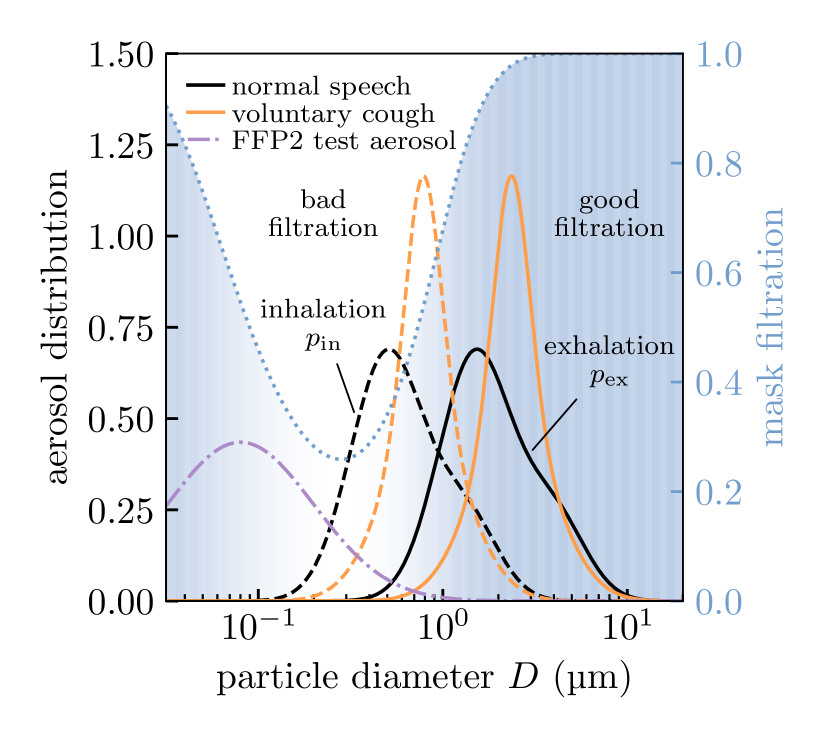
Fluid particles immediately begin to evaporate upon exhalation Xie et al. (2007); Liu et al. (2017) and aerosol particles smaller than will reach their dessicated steady states (which we will refer to as “nuclei”) in less than Nicas et al. (2005). We take parameterisations of the measured size distributions (i.e. uncorrected for evaporation) reported in Refs. Johnson et al., 2011; Gregson et al., 2021 as the unperturbed (by masking) inhaled distribution in our calculations. Their hydrated state would be around a factor of larger on exhalation, allowing for coverings to filter aerosol particles more effectively at the source Liu et al. (2017); Robinson et al. (2021). We therefore write the distribution of exhaled particle diameters as
| (1) |
We show the size distributions expected on inhalation and exhalation in Fig. 3. We see that the bigger aerosol particles on exhalation more strongly overlap with the region where surgical masks filter effectively (without mask leakage). In the same figure we also show the size distribution of FFP2 test aerosols222The FFP2 standardEuropean Committee for Standardization (2019a) specifies the test aerosol has a (number) median diameter between with a geometric standard deviation between . We therefore model the FFP2 test aerosol size distribution as a log-normal with a median of and a geometric standard deviation of 2.5., which are much finer on average. NB: we work in log-space for (in ), so these distributions are probability densities where are the infinitesimal probabilities. therefore have no units.
| Fraction removed by mask | ||
|---|---|---|
| Aerosol particles | By number | By mass |
| Normal speech (inhalation) | ||
| Normal speech (exhalation) | ||
| Voluntary cough (inhalation) | ||
| Voluntary cough (exhalation) | ||
| FFP2 test aerosol | ||
III.2 Perturbation of inhaled aerosol distribution by masks
We write as the penetration through the mask (i.e. the fraction of particles let through) on exhalation/inhalation. We account for mask leakage by setting
| (2) |
and we assume mask leakage to be independent of particle size . We obtain by subtracting the theoretical mask filtration shown in Fig. 1(c) from . Setting on inhalation or exhalation effectively removes the respective mask within this model. Mask leakage varies considerably, especially for surgical masks Duncan et al. (2020). Estimates of vary from around in Refs. Hossain et al., 2020; Grinshpun et al., 2009 to as high as in masks with artificial leaksRengasamy et al. (2014). In general we expect to be greater on exhalation than inhalation, because breathing affects the face seal, and therefore to vary with e.g. breathing pattern Grinshpun et al. (2009). For simplicity, we neglect these effects and keep as a constant. Initially we develop our model assuming , before we consider the impact of leakage later in section IV; for our current purposes it is enough to say that leakage effects are included in the definition of (2).
Accounting for masks, the inhaled size distribution becomes
| (3a) | |||
| where the total (number) fraction of inhaled particles removed by the masks is | |||
| (3b) | |||
In Table 1 we show the results for the fraction of respiratory aerosol particles removed by a perfectly fitting (i.e. ) surgical mask assuming the theoretical filtration profile of Fig. 1(c). We also show the results for an FFP2 test aerosol for reference, which involves finer particles and so underpredicts the mask efficacy if one is really only interested in the respiratory aerosols.
The official FFP2 test measures effectiveness by mass (rather than number) weighting European Committee for Standardization (2019a). Weighting by in (3) gives the aerosol mass distribution, which may be more relevant for estimating inhaled viral dose, and the fraction of aerosol particles removed by mass. Mass weighting preferences larger particles and improves the fraction removed in Table 1, though this improvement is less pronounced for the FFP2 test aerosol because these coincide with the window where masks are poor filters. An FFP2 test would fail this surgical mask which only filters by mass, even though it would filter of the fine particles exhaled during speech or coughing (with perfect face seal).
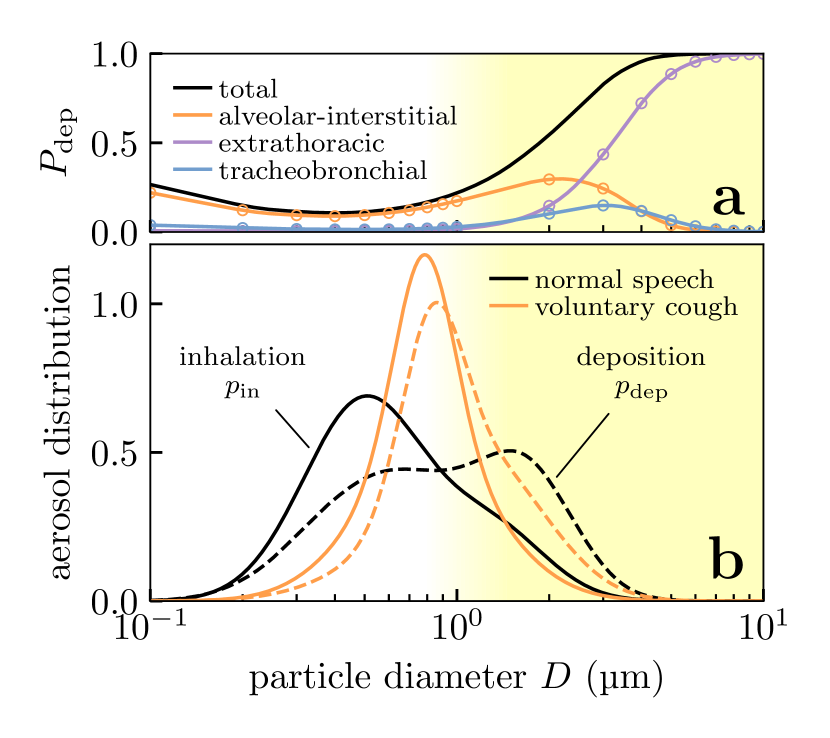
III.3 Accounting for biological factors: viral load and deposition
For an aerosol particle to be a possible disease vector it must (i) contain at least one (viable) virion, and (ii) deposit in the respiratory tract upon inhalation. We will model these two effects and show how they shift the relevant part of the inhaled size distribution to coarser aerosol particles, which has positive implications for practical mask effectiveness.
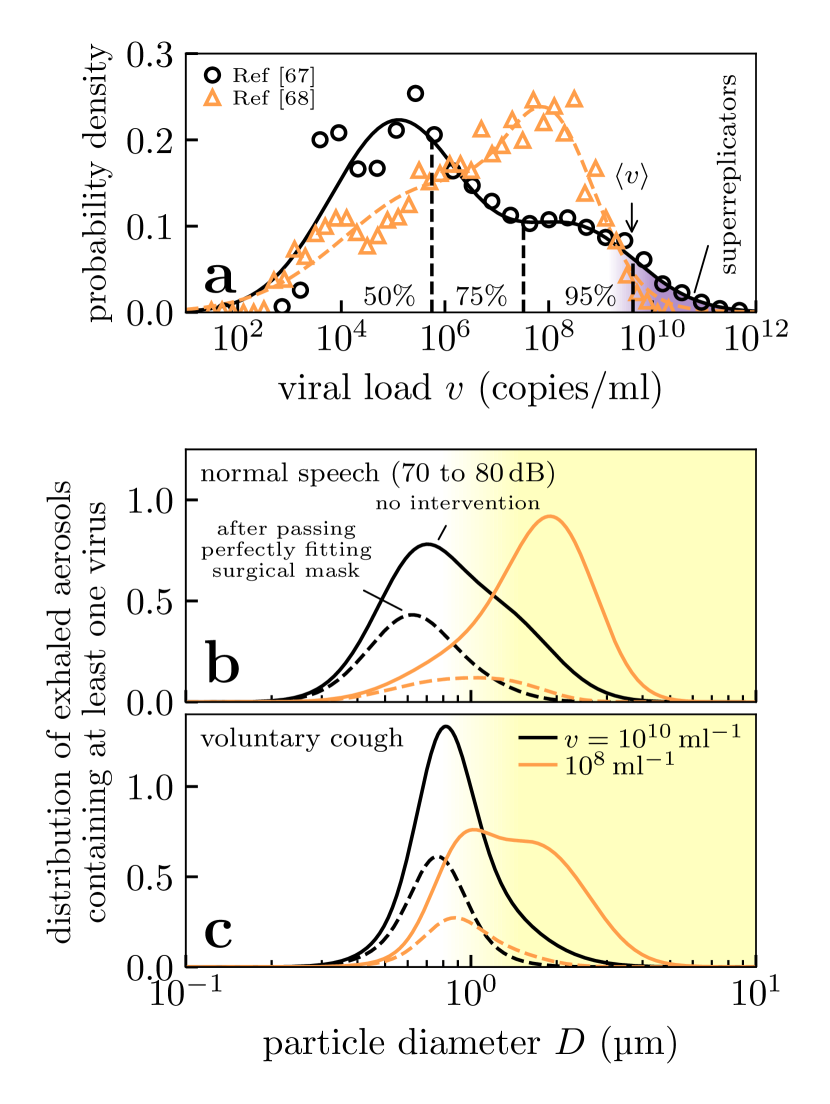
Testing for SARS-CoV-2 is primarily performed by detecting the presence of viral RNA in respiratory fluid using reverse-transcriptase polymerase chain reaction (RT-PCR). The distribution of concentrations of viral RNA, the viral load, using this technique has been reported in Refs. Jones et al., 2020b; Jacot et al., 2020 which we show in Fig. 4(a). The distribution is extremely broad, spanning around 10–12 orders of magnitude: patients in the upper tail of the distribution (the “superreplicators”) may be a factor in superspreading events. Finally, we note that there is ample time for evaporation between sample collection and testing in these studies so we assume these concentrations to refer to the dessicated states (the nuclei).
Viral load typically peaks around the onset of symptoms Zou et al. (2020) which is also the most contagious stage of disease progression Anderson et al. (2020); we thus expect viral loads from the upper half of the distributions in Fig. 4(a) to be most relevant to disease transmission. The actual number of viable virus, as measured from viral plaque assays, in aerosol vs the RT-PCR result is typically only one part in Milton et al. (2013); Fears et al. (2020). We can thus take the upper limit of (naso-oral) viral loads as instead of .
These RT-PCR studies primarily involved testing naso- and oropharyngeal samples, which are presumably diluted by saliva and other fluids. Fluids from the lower respiratory tract may be more concentrated with virus, especially when viral replication occurs there in advanced stages of the disease. Viral loads larger than may therefore be relevant to airborne transmission We will find that factoring in viral load changes mask effectiveness in a sharp step function, and so any variation in viral load through the respiratory tract is less important than where it is most concentrated. As data on viral concentration in the lower respiratory tract is lacking, we can only discuss this possibility without factoring in the difference quantitatively.
The probability that an aerosol particle contains at least one virus depends on its volume and the viral load. By combining this information we can estimate the fraction of particles at any specific size that contains the virus, and thus the variation in the relative number of particles that contain the virus across the size distribution.
The average number of virions in a particle is (assuming homogeneity) simply its volume times the viral load of the respiratory fluid. This yields
assuming spherical particles. Assuming the Poisson distribution, the probability that a particle of this size contains at least one virion is
This describes a step function in and with negligible probability for and . is only for and , and rapidly diminishes further with decreasing or . Applying Bayes’ theorem gives the size distribution of aerosol particles containing at least one virus as
| (4) |
with a proportionality constant to ensure the distribution is normalised. The quantity is the distribution of all inhaled aerosol particles (i.e. viral or otherwise) in the presence of masking i.e. (3), that we considered in section III.2. In Fig. 4(b-c) we show the resulting distributions produced in speech and coughing. For the moderately large viral load of the majority of viral aerosol particles are distributed in the micron regime . Only for extremely large viral loads of do the submicron aerosol particles begin to contain significant numbers of virus.
Our formalism focuses on the number distribution of aerosol particles, but it gives the mass distribution in the limit of small viral loads. In this limit we find
and so (4) becomes
| (5) |
i.e. we obtain a mass-weighted inhaled distribution. This is the appropriate weight function for calculating the inhaled mass (or dose), and so we can estimate the reduction in viral dose from masking as the small result in our model e.g. in (3).
As the second biological effect, we consider only those aerosol particles which would actually deposit in the respiratory tract. We show the probability of aerosol particles being deposited in the respiratory tract , using the data from Ref. Chalvatzaki et al., 2020, in Fig. 5(a). We simply take as the total probability shown in Fig. 5(a), ignoring the site of deposition; we note however that the deposition site is potentially important in determining the severity of potential infection and so the model could be extended with further information on site-dependent risk. Most of the fine aerosol particles are simply re-exhaled after inhalationChalvatzaki et al. (2020), which we can build into our model. Applying Bayes’ theorem again, we obtain the size distribution of inhaled aerosol particles that deposit in the respiratory tract as
| (6) |
with a proportionality constant to ensure the distribution is normalised. This effect shifts the size distribution to coarser aerosol particles, as shown in Fig. 5(b).
To summarise this section, there is considerable biological variation in how the virus is shed. Assuming the virus concentration depends only on the site of origin in the respiratory tract, then this concentration becomes independent of size for the fine aerosol particles. On physical grounds, we then expect the vast majority of the finest aerosol particles to be empty of virus and/or to not actually deposit in the respiratory tract. These fine particles are therefore only expected to carry concerning doses in a small minority () of infected individuals who shed orders-of-magnitude more virus than average. Similar conclusions were recently reached by Freitag et al. Freitag et al. (2020).
IV Overall mask effectiveness
To gauge overall mask effectiveness in preventing airborne transmission, we modify the (number) fraction of droplets removed (3) to focus on just those relevant to disease transmission. That is, those aerosol particles that (i) contain at least one virion and (ii) deposit in the respiratory tract of the inhaler. We presented those calculations in section III.3 and show their effects on the particle size distribution in Fig. 4 and Fig. 5.
Accounting for these effects, the aerosol particle size distribution of concern becomes
| (7a) | |||
| where the total (number) fraction of vector particles (i.e. viral aerosol particles that deposit) removed by the masks is | |||
| (7b) | |||
| and the (number) fraction of inhaled particles ignored because they do not deposit or contain virus is | |||
| (7c) | |||
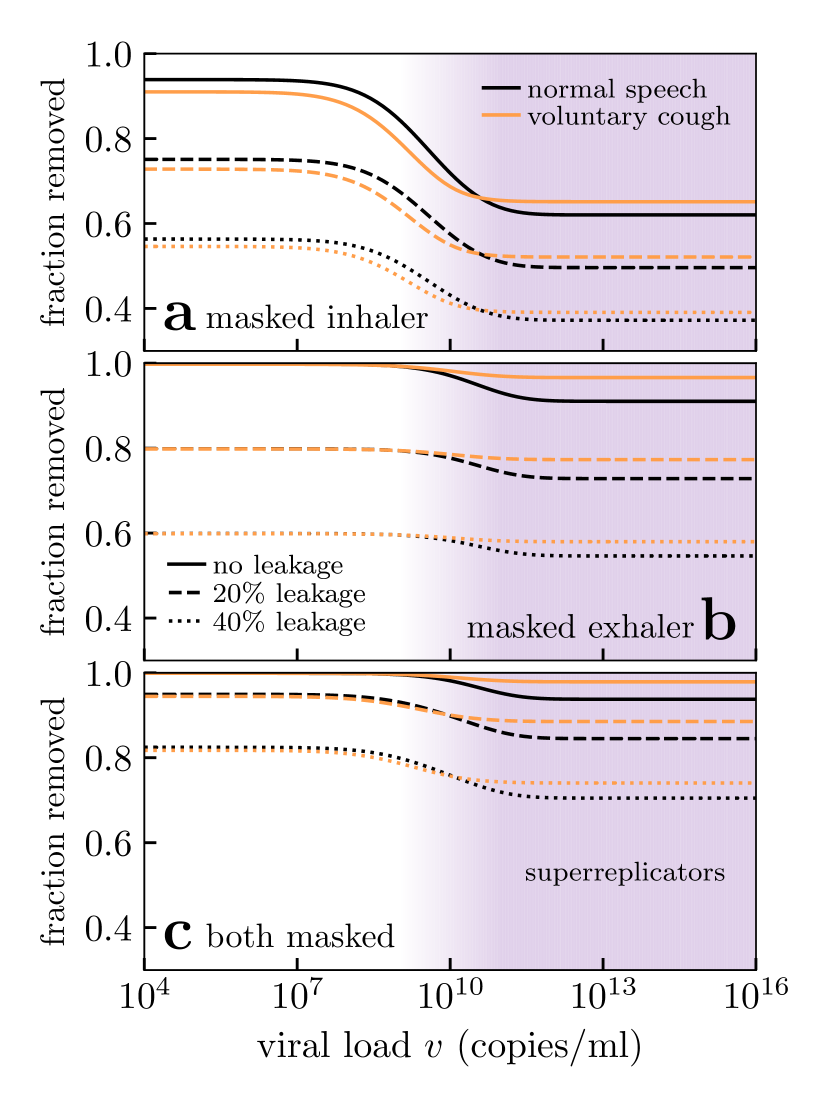
Fig. 6 shows the net result of mask effectiveness against viral load under various masking scenarios. In all scenarios the (number) fraction removed is seen to be a step function in decreasing mask effectiveness as (viable) viral loads vary over . Masks are more effective with smaller viral loads because the virus-laden aerosol particles are larger, as we saw in Fig. 4(b-c). In all cases this effect is further enhanced by the low-likelihood of deposition in the respiratory tract, accounting for which shifts the relevant size distribution to coarser aerosol particles and enhances mask effectiveness.
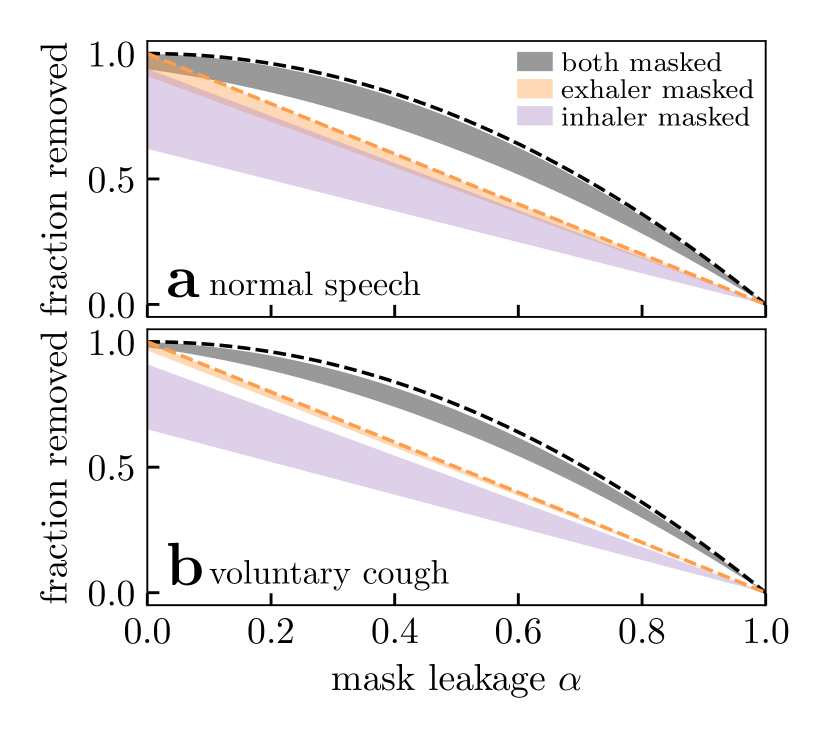
As the effect of viral loads is seen as a step function, we plot the resulting range of values (i.e. at small and large ) against mask leakage in Fig. 7. In all scenarios, masking the exhaler is better than masking the inhaler, because particles are larger on exhalation and thus easier to filter; however, masking both is optimal. Increasing mask leakage generally has a strongly negative performance effect, especially on inhalation. For mask leakage , the best possible mask performance is when one person is masked and when both are masked; these theoretical values are shown as dashed lines in Fig. 7. However, Fig. 6 and 7 show that practical mask performance may be worse after considering the interplay of filtration with biological effects, especially when only the inhaler is masked. This is because large viral loads increase the risk of transmission by submicron aerosol particles where mask filtration is poor.
While we have focused on number fraction, the low viral load limit yields the expected result for the reduction in mass fraction (see discussion around (5)). The mass fraction reduction estimates the reduction in viral dose transmitted. Masks perform best in this limit, because coarser particles carry more mass. The upper limit of the envelopes in Fig. 7 shows that in terms of viral dose reduction, masking almost performs as well as the ideal results (dashed curves) under conditions where the exhaler or both are masked. If disease transmission depends on dose alone, then the filtration profile of the surgical mask in Fig. 1(c) is essentially perfect and the only limitations are (i) individual mask leakage and (ii) population adherence to mask wearing.
V Discussion
We have seen that mask effectiveness crucially depends on the size of aerosol particles which act as disease vectors, even for fine particles in diameter. At smaller viral loads, the virus-laden aerosol particles are coarser making masks more effective; conversely, at large viral loads submicron particles can carry virus which coincides with the size regime where mask materials have their poorest filtration properties. The available data from Refs. Jones et al., 2020b; Jacot et al., 2020 indicates that such large viral loads are extremely rare in the oral-naso fluid of SARS-CoV-2 patients, which would suggest that the coarser aerosol particles are more important for disease vectors, and that masks would perform better in practice than e.g. an FFP2 test would predict. However, we are unaware of any data on viral loads in fluid taken from deeper in the respiratory tract, where it may be more concentrated, and so submicron particles remain potential transmission vectors. Considering this key unknown, we are only able to set upper and lower bounds on the (number) fraction of viral aerosol particles removed.
Taken together, our calculations suggest that mask effectiveness depends more on mask leakage than it does on the other variables. Considering effectiveness for normal speech Fig. 7(a), we find that the surgical mask of Zangmeister et al. with mask leakage would only filter of vectors (by number) when worn by both. The upper limit (corresponding to low viral loads) is already close to the best possible performance of obtainable through perfect filtration. Improving the mask material is therefore insignificant compared to the benefit of improving the fit: keeping the material the same, but reducing leakage to would yield mask performances of . In a similar vein, ensuring both inhaler and exhaler are masked will outperform any gains in mask filtration when leakage is assumed; the lower limit of at large viral loads already exceeds the theoretical best performance of a single mask of at leakage.
These findings have implications for surgical and fabric mask standards. As discussed, the FFP2 test samples the submicrometer size regime which may not always be relevant for airborne transmission and thus may be too stringent as a test. Conversely, the BFE test used for medical face masks featuring aerosol particles may be too large and also sampling the region where mask material properties are likely to be poor; this may be too relaxed as a test. Moreover, no standards for surgical and fabric masks include tests for fit, even though we have seen this to be a crucial limiting factor in their effectiveness at curbing disease transmission.
Finally, we note that our model is subject to the following limitations:
-
•
We only consider the number of aerosol particles, i.e. we are agnostic to the dose delivered or the dose-response. Our model is very conservative in this sense: weighting the size-distributions by particle volume to capture dose would increase the predicted effectiveness by selecting coarser particles which masks are better at filtering. A consequence of this modelling choice is that mask effectiveness is a step function in the viral load. Focusing instead on dose would improve the expected mask effectiveness, and in fact corresponds to the upper limit of effectiveness in our model (see discussion around (5)). Our stricter model allows for disease transmission to involve a kinetics depending on the number of virus-carrying particles received.. Even with our conservative estimate, Fig. 7 shows that the filtration profile of surgical masks in Ref. Zangmeister et al., 2020 is likely ‘good enough’ to achieve almost ideal performance in practice is suggestive that (i) mask leakage and (ii) universal masking are more important factors than material properties.
-
•
We assumed mask leakage to be independent of particle size. This would be straightforward to improve this by making dependent on in (2).
-
•
We lack data on the viral loads in the lower respiratory tract. As a consequence we can only provide upper and lower bounds on mask effectiveness.
-
•
Our mask effectiveness measures the reduction in exposure to potential disease vectors relative to when no masks are worn. As viral load increases, the absolute dose received (and thus the risk of transmission) increases even after has reached its plateau value (cf. Fig. 6).
-
•
We have not focused on coarse aerosol particles which have much shorter sedimentation times. Mask filtration is essentially perfect for these particles so other factors related to masking are more important such as the way masks deflect and remove momentum from expiratory jets Tang et al. (2009, 2011).
-
•
We have assumed a constant flow velocity of through our masks to match Ref. Zangmeister et al., 2020. This neglects changes in flow velocity during tidal breathing, which will in turn be affected by the breathing pattern (and factors such as physical activity) which has a complex effect on mask performance Grinshpun et al. (2009). For simplicity we have neglected this, but an interesting extension of our model could consider the integrated effectiveness with variable flow velocity.
VI Conclusion
We have presented a model for practical mask performance, as measured by the (number) fraction of potential disease vectors removed. Our model combines a mask’s material filtration and leakage with three biological factors: (i) the distribution of respired aerosol particles, (ii) the viral load of the exhaler and (iii) the probability of deposition in the respiratory tract of the inhaler. We found that masks do protect the wearer, but perform best as source control; in any case, masking both exhaler and inhaler is best. But not all masks are the same. A mask meeting a Personal Protective Equipment (PPE) standard such as the European FFP2 standard should filter out at least 92% of the virus. The standard specifies 92% filtration for a test aerosol that is smaller and harder to filter than the droplet sizes we expect to be most dangerous.
A surgical mask meeting the European Type II standard may be made of material which filters significantly less of the virus. For example, we predict that the material of one of the surgical masks studied by Zangmeister and coworkers Zangmeister et al. (2020), on inhalation filters 88% of the mass of speech droplets, see Table 1. The material of an FFP2 or similar mask will filter out close to 100%. But the bigger problem with surgical mask standards is that they do not specify fit, and so many surgical masks fit poorly. Grinshpun and coworkers Grinshpun et al. (2009) found that approximately 30% of the air bypassed the material of the surgical mask they tested. With this poor a fit, the filtration is only . This is enough to reduce transmission, but is inferior to an FFP2 mask. Respirators offer both superior fit and superior filtration of smaller aerosol particles, and so replacing surgical masks with FFP2, N95, or similar respirators will increase the protection of both healthcare workers and the public.
Following the emergence of more infectious variants of SARS-CoV-2, some policy makers have mandated the wearing of respirators in public spaces Deutsche Welle (2021). As a complementary approach, policy makers could pursue a strategy of improving the quality of masks worn in community settings. Practical guidance on reducing leakage would therefore be required to pursue this strategy. For example, Duncan et al. Duncan et al. (2020) found that surgical masks sealed via tie straps offered better face sealage than ear loops. The filtration properties of fabric can be poor Konda et al. (2020b); de Anda et al. (2021), but their fit can be better than that of surgical masks Duncan et al. (2020) and they can in principle be tailored to the wearer. There are no standards for fabric masks apart from the recent F3502 standard ASTM International (2021a), which does not set a standard for mask fit. Washable cloth masks have the additional advantage of being more environmentally friendly than surgical masks and respirators, which are made from plastic fibres.
Surgical mask standards like the European Type II standard (EN 14683) are not adequate for a COVID-19. There is no requirement on mask fit, and filtration performance of the material is measured at the too-large diameter of . The standard could be made fit for purpose by specifying filtration as worn, as in the FFP2 standard, and measuring filtration at particle sizes around or smaller. Alternatively, surgical mask standards could be removed entirely, leaving only FFP2 and similar standards. In either case, changing the standard could drive up the protection offerered by masks, and so reduce COVID-19 transmission.
Transmission of respiratory viruses is complex and poorly understood, so more data is needed. We need either direct data on transmission rates as a function of conditions, with and without masks, and a much better idea of the infectivity of aerosolised virus including the required dose for infection. Both of these will be challenging but both are possible. The basic physics of filtration tells us about how capture varies with aerosol particle size, and so once we have this data we can easily update our estimates of the protection offered by masks.
It now seems well established that with SARS-CoV-2 some infected people have viral loads thousands or millions of times higher than others Jones et al. (2020b); Jacot et al. (2020). Thus a reduction in dose due to mask wearing corresponds to very different absolute reductions in dose from infected people with high and low viral loads. As typically the viral load of an infectious person will not be known, other forms of interventions are warranted in addition to masking.
Acknowledgements.
The authors wish to thank Kate Oliver for helpful discussions on textiles, Patrick Warren for guidance on LB simulations, Mahesh Bandi for making us aware of his ingenious use of a candyfloss maker, and Mike Allen, Jens Eggers, and Daan Frenkel for helpful discussions. We gratefully acknowledge Daniel Bonn, Patrick Charbonneau, K. K. Cheng, Rosie Dalzell, Tanniemola Liverpool, John Russo and Hajime Tanaka for providing valuable comments on this work. We would also like to thank the two reviewers for very useful and constructive comments on the submitted manuscript. JFR, JPR and CPR wish to thank the Bristol Aerosol COVID-19 group for valuable discussions and feedback on this work. JFR would like to thank Kirsty Wynne for assistance in debugging the code used in the theoretical calculations. The authors would like to thank Judith Mantell and Jean-Charles Eloi of the Wolfson Bioimaging Facility and the Chemical Imaging Facility (EPSRC Grant “Atoms to Applications”, EP/K035746/1), respectively, for the SEM images and assistance in this work. We thank E. Chalvatzaki and M. Lazaridis for sharing their data on the probability of aerosol particle deposition in the respiratory tract.Data availability statement
The data presented as results in this study were obtained using a computer code which implements the methods outlined in the text. This code is freely available at Ref. Robinson and Sear, 2021.
References
- Dancer (2020) S. J. Dancer, Infection, Disease & Health , S2468045120300614 (2020).
- Morawska and Cao (2020) L. Morawska and J. Cao, Environ. Int. 139, 105730 (2020).
- Prather et al. (2020a) K. A. Prather, C. C. Wang, and R. T. Schooley, Science , eabc6197 (2020a).
- Bar-On et al. (2020) Y. M. Bar-On, A. Flamholz, R. Phillips, and R. Milo, eLife 9, e57309 (2020).
- Prather et al. (2020b) K. A. Prather, L. C. Marr, R. T. Schooley, M. A. McDiarmid, M. E. Wilson, and D. K. Milton, Science 370, 303.2 (2020b).
- Masks4All (2020) Masks4All, “What Countries Require Masks in Public or Recommend Masks?” https://masks4all.co/what-countries-require-masks-in-public/ (2020), accessed: 2020-01-23.
- YouGov (2020) YouGov, “Poll: Personal measures taken to avoid covid-19,” https://today.yougov.com/topics/international/articles-reports/2020/03/17/personal-measures-taken-avoid-covid-19 (2020).
- Greenhalgh et al. (2020) T. Greenhalgh, M. B. Schmid, T. Czypionka, D. Bassler, and L. Gruer, BMJ , m1435 (2020).
- DELVE Initiative (2020) DELVE Initiative, DELVE Report 1 (2020).
- Howard et al. (2021) J. Howard, A. Huang, Z. Li, Z. Tufekci, V. Zdimal, H.-M. van der Westhuizen, A. von Delft, A. Price, L. Fridman, L.-H. Tang, V. Tang, G. L. Watson, C. E. Bax, R. Shaikh, F. Questier, D. Hernandez, L. F. Chu, C. M. Ramirez, and A. W. Rimoin, Proc Natl Acad Sci USA 118, e2014564118 (2021).
- Jones et al. (2020a) C. R. Jones, F. W. Hamilton, A. Thompson, T. T. Morris, and E. Moran, Journal of Infection , S0163445320307556 (2020a).
- Xie et al. (2007) X. Xie, Y. Li, A. T. Y. Chwang, P. L. Ho, and W. H. Seto, Indoor Air 17, 211 (2007).
- Bourouiba et al. (2014) L. Bourouiba, E. Dehandschoewercker, and J. W. M. Bush, J. Fluid Mech. 745, 537 (2014).
- Liu et al. (2017) L. Liu, J. Wei, Y. Li, and A. Ooi, Indoor Air 27, 179 (2017).
- Bazant and Bush (2020) M. Z. Bazant and J. W. M. Bush, Beyond Six Feet: A Guideline to Limit Indoor Airborne Transmission of COVID-19, Preprint (Public and Global Health, 2020).
- Tang et al. (2009) J. W. Tang, T. J. Liebner, B. A. Craven, and G. S. Settles, J. R. Soc. Interface. 6 (2009), 10.1098/rsif.2009.0295.focus.
- Dbouk and Drikakis (2020) T. Dbouk and D. Drikakis, Physics of Fluids 32, 063303 (2020).
- Viola et al. (2021) I. M. Viola, B. Peterson, G. Pisetta, G. Pavar, H. Akhtar, F. Menoloascina, E. Mangano, K. E. Dunn, R. Gabl, A. Nila, E. Molinari, C. Cummins, G. Thompson, T.-Y. M. Lo, F. C. Denison, P. Digard, O. Malik, M. J. G. Dunn, C. M. McDougall, and F. V. Mehendale, IEEE Open J. Eng. Med. Biol. 2, 26 (2021), arXiv:2005.10720 .
- Li et al. (2021) H. Li, F. Y. Leong, G. Xu, C. W. Kang, K. H. Lim, B. H. Tan, and C. M. Loo, Sci Rep 11, 4617 (2021).
- Scharfman et al. (2016) B. E. Scharfman, A. H. Techet, J. W. M. Bush, and L. Bourouiba, Exp Fluids 57, 24 (2016).
- Mittal et al. (2020) R. Mittal, R. Ni, and J.-H. Seo, J. Fluid Mech. 894, F2 (2020).
- Poon et al. (2020) W. C. K. Poon, A. T. Brown, S. O. L. Direito, D. J. M. Hodgson, L. Le Nagard, A. Lips, C. E. MacPhee, D. Marenduzzo, J. R. Royer, A. F. Silva, J. H. J. Thijssen, and S. Titmuss, Soft Matter 16, 8310 (2020).
- Fischer et al. (2020) E. P. Fischer, M. C. Fischer, D. Grass, I. Henrion, W. S. Warren, and E. Westman, Sci. Adv. , eabd3083 (2020).
- Sharma et al. (2021) S. Sharma, R. Pinto, A. Saha, S. Chaudhuri, and S. Basu, Sci. Adv. 7 (2021), 10.1126/sciadv.abf0452.
- Johnson et al. (2011) G. Johnson, L. Morawska, Z. Ristovski, M. Hargreaves, K. Mengersen, C. Chao, M. Wan, Y. Li, X. Xie, D. Katoshevski, and S. Corbett, J. Aerosol Sci. 42, 839 (2011).
- Jin et al. (2020) Y. Jin, H. Yang, W. Ji, W. Wu, S. Chen, W. Zhang, and G. Duan, Viruses 12, 372 (2020).
- Kanimozhi et al. (2021) G. Kanimozhi, B. Pradhapsingh, C. Singh Pawar, H. A. Khan, S. H. Alrokayan, and N. R. Prasad, Front. Pharmacol. 12, 638334 (2021).
- Santarpia et al. (2021) J. L. Santarpia, V. L. Herrera, D. N. Rivera, S. Ratnesar-Shumate, S. P. Reid, D. N. Ackerman, P. W. Denton, J. W. S. Martens, Y. Fang, N. Conoan, M. V. Callahan, J. V. Lawler, D. M. Brett-Major, and J. J. Lowe, J Expo Sci Environ Epidemiol (2021), 10.1038/s41370-021-00376-8.
- Hawks et al. (2021) S. A. Hawks, A. J. Prussin, S. C. Kuchinsky, J. Pan, L. C. Marr, and N. K. Duggal, mBio 12, e02527 (2021).
- Vuorinen et al. (2020) V. Vuorinen, M. Aarnio, M. Alava, V. Alopaeus, N. Atanasova, M. Auvinen, N. Balasubramanian, H. Bordbar, P. Erästö, R. Grande, N. Hayward, A. Hellsten, S. Hostikka, J. Hokkanen, O. Kaario, A. Karvinen, I. Kivistö, M. Korhonen, R. Kosonen, J. Kuusela, S. Lestinen, E. Laurila, H. J. Nieminen, P. Peltonen, J. Pokki, A. Puisto, P. Råback, H. Salmenjoki, T. Sironen, and M. Österberg, Safety Science 130, 104866 (2020).
- Riley et al. (1978) E. C. Riley, G. Murphy, and R. L. Riley, Am. J. Epidemiol. 107, 421 (1978).
- Gammaitoni and Nucci (1997) L. Gammaitoni and M. C. Nucci, Emerg. Infect. Dis. 3, 335 (1997).
- Jimenez et al. (2020) J.-L. Jimenez, K. Human, and K. Simpkins, “Covid-19 airborne transmission tool available,” https://cires.colorado.edu/news/covid-19-airborne-transmission-tool-available (2020).
- Buonanno et al. (2020) G. Buonanno, L. Stabile, and L. Morawska, Environment International 141, 105794 (2020).
- Dai and Zhao (2020) H. Dai and B. Zhao, Build. Simul. (2020), 10.1007/s12273-020-0703-5.
- Foster and Kinzel (2021) A. Foster and M. Kinzel, Physics of Fluids 33, 021904 (2021).
- Zangmeister et al. (2020) C. D. Zangmeister, J. G. Radney, E. P. Vicenzi, and J. L. Weaver, ACS Nano 14, 9188 (2020).
- Oberg and Brosseau (2008) T. Oberg and L. M. Brosseau, American Journal of Infection Control 36, 276 (2008).
- Robinson et al. (2021) J. F. Robinson, I. Rios de Anda, F. J. Moore, J. P. Reid, R. P. Sear, and C. P. Royall, Physics of Fluids 33, 043112 (2021).
- ASTM International (2021a) ASTM International, Standard Specification for Performance of Materials Used in Medical Face Masks, Tech. Rep. F3502 - 21 (2021).
- European Committee for Standardization (2019a) European Committee for Standardization, Respiratory protective devices - Methods of test - Part 7: Determination of particle filter penetration, Tech. Rep. EN 13274-7:2019 (European Committee for Standardization, 2019).
- U.S. Public Health Service (1995) U.S. Public Health Service, USA Code of Federal Regulations: Part 84 - Approval of Respiratory Protection Devices, Tech. Rep. 60 FR 30336 (U.S. Public Health Service, 1995).
- Zoller et al. (2021) J. Zoller, J. Meyer, and A. Dittler, Journal of Aerosol Science 158, 105830 (2021).
- European Committee for Standardization (2019b) European Committee for Standardization, Medical face masks - Requirements and test methods, Tech. Rep. EN 14683:2019 (European Committee for Standardization, 2019).
- ASTM International (2021b) ASTM International, Standard Specification for Performance of Materials Used in Medical Face Masks, Tech. Rep. F2100 - 21 (2021).
- Tellier (2009) R. Tellier, J. R. Soc. Interface 6 (2009), 10.1098/rsif.2009.0302.focus.
- Asadi et al. (2019) S. Asadi, A. S. Wexler, C. D. Cappa, S. Barreda, N. M. Bouvier, and W. D. Ristenpart, Sci Rep 9, 2348 (2019).
- Bourouiba (2020) L. Bourouiba, JAMA (2020), 10.1001/jama.2020.4756.
- Konda et al. (2020a) A. Konda, A. Prakash, G. A. Moss, M. Schmoldt, G. D. Grant, and S. Guha, ACS Nano , acsnano.0c03252 (2020a).
- Lustig et al. (2020) S. R. Lustig, J. J. H. Biswakarma, D. Rana, S. H. Tilford, W. Hu, M. Su, and M. S. Rosenblatt, ACS Nano , acsnano.0c03972 (2020).
- Hao et al. (2020) W. Hao, A. Parasch, S. Williams, J. Li, H. Ma, J. Burken, and Y. Wang, International Journal of Hygiene and Environmental Health 229, 113582 (2020).
- Freitag et al. (2020) S. Freitag, S. G. Howell, and K. T. C. Jim, Why Simple Face Masks Are Unexpectedly Efficient in Reducing Viral Aerosol Transmissions, Preprint (Public and Global Health, 2020).
- Duncan et al. (2020) S. Duncan, P. Bodurtha, and S. Naqvi, N95 Respirators, Disposable Procedure Masks and Reusable Cloth Face Coverings: Total Inward Leakage and Filtration Efficiency of Materials against Aerosol, Preprint (Occupational and Environmental Health, 2020).
- Wang and Otani (2013) C.-s. Wang and Y. Otani, Ind. Eng. Chem. Res. 52, 5 (2013).
- Chen et al. (1993) C. C. Chen, M. Lehtimäki, and K. Willeke, Am. Ind. Hyg. Assoc. J. 54, 51 (1993).
- Kravtsov et al. (2000) A. Kravtsov, H. B. Nig, S. Zhandarov, and R. Beyreuther, Adv. Polym. Technol. 19, 5 (2000).
- Wang (2020) Y. Wang, “Filtration performance of common household materials for manufacturing homemade masks,” (2020).
- Zhang et al. (2012) Z. Zhang, C. Kleinstreuer, and S. Hyun, Journal of Aerosol Science 46, 34 (2012).
- Cheng (2014) Y. S. Cheng, AAPS PharmSciTech 15, 630 (2014).
- Chalvatzaki et al. (2020) E. Chalvatzaki, S. E. Chatoutsidou, and M. Lazaridis, Journal of Drug Delivery Science and Technology 59, 101915 (2020).
- Guo et al. (2020) Y. Guo, J. Wei, C. Ou, L. Liu, S. Sadrizadeh, T. Jin, L. Tang, Y. Zhang, and Y. Li, Aerosol Science and Technology 54, 869 (2020).
- Morawska et al. (2009) L. Morawska, G. Johnson, Z. Ristovski, M. Hargreaves, K. Mengersen, S. Corbett, C. Chao, Y. Li, and D. Katoshevski, Journal of Aerosol Science 40, 256 (2009).
- Gregson et al. (2021) F. K. A. Gregson, N. A. Watson, C. M. Orton, A. E. Haddrell, L. P. McCarthy, T. J. R. Finnie, N. Gent, G. C. Donaldson, P. L. Shah, J. D. Calder, B. R. Bzdek, D. Costello, and J. P. Reid, Aerosol Science and Technology , 1 (2021).
- Note (1) The concentration of viable virus may be lower in oral-mode droplets: in influenza it is a factor of smaller Milton et al. (2013), however even accounting for this a factor of 10 increase in diameter increases the expected number of virions by .
- Nicas et al. (2005) M. Nicas, W. W. Nazaroff, and A. Hubbard, Journal of Occupational and Environmental Hygiene 2, 143 (2005).
- Note (2) The FFP2 standardEuropean Committee for Standardization (2019a) specifies the test aerosol has a (number) median diameter between with a geometric standard deviation between . We therefore model the FFP2 test aerosol size distribution as a log-normal with a median of and a geometric standard deviation of 2.5.
- Jones et al. (2020b) T. C. Jones, B. Mühlemann, T. Veith, G. Biele, M. Zuchowski, J. Hoffmann, A. Stein, A. Edelmann, V. M. Corman, and C. Drosten, An Analysis of SARS-CoV-2 Viral Load by Patient Age, Preprint (Infectious Diseases (except HIV/AIDS), 2020).
- Jacot et al. (2020) D. Jacot, G. Greub, K. Jaton, and O. Opota, Viral Load of SARS-CoV-2 across Patients and Compared to Other Respiratory Viruses, Preprint (Infectious Diseases (except HIV/AIDS), 2020).
- Hossain et al. (2020) E. Hossain, S. Bhadra, H. Jain, S. Das, A. Bhattacharya, S. Ghosh, and D. Levine, Physics of Fluids 32, 093304 (2020).
- Grinshpun et al. (2009) S. A. Grinshpun, H. Haruta, R. M. Eninger, T. Reponen, R. T. McKay, and S.-A. Lee, J. Occup. Environ. Hyg. 6, 593 (2009).
- Rengasamy et al. (2014) S. Rengasamy, B. C. Eimer, and J. Szalajda, Journal of Occupational and Environmental Hygiene 11, 388 (2014).
- Zou et al. (2020) L. Zou, F. Ruan, M. Huang, L. Liang, H. Huang, Z. Hong, J. Yu, M. Kang, Y. Song, J. Xia, Q. Guo, T. Song, J. He, H.-L. Yen, M. Peiris, and J. Wu, N Engl J Med 382, 1177 (2020).
- Anderson et al. (2020) E. L. Anderson, P. Turnham, J. R. Griffin, and C. C. Clarke, Risk Analysis 40, 902 (2020).
- Milton et al. (2013) D. K. Milton, M. P. Fabian, B. J. Cowling, M. L. Grantham, and J. J. McDevitt, PLoS Pathog 9, e1003205 (2013).
- Fears et al. (2020) A. C. Fears, W. B. Klimstra, P. Duprex, A. Hartman, S. C. Weaver, K. S. Plante, D. Mirchandani, J. A. Plante, P. V. Aguilar, D. Fernández, A. Nalca, A. Totura, D. Dyer, B. Kearney, M. Lackemeyer, J. K. Bohannon, R. Johnson, R. F. Garry, D. S. Reed, and C. J. Roy, Emerg. Infect. Dis. 26, 2168 (2020).
- Tang et al. (2011) J. W. Tang, A. D. G. Nicolle, J. Pantelic, M. Jiang, C. Sekhr, D. K. W. Cheong, and K. W. Tham, PLoS ONE 6, e21392 (2011).
- Deutsche Welle (2021) Deutsche Welle, “Bavaria mandates FFP2 masks, all of germany may follow,” (2021), accessed: 2021-01-26.
- Konda et al. (2020b) A. Konda, A. Prakash, G. A. Moss, M. Schmoldt, G. D. Grant, and S. Guha, ACS Nano 14, 10764 (2020b).
- de Anda et al. (2021) I. R. de Anda, J. W. Wilkins, J. F. Robinson, C. P. Royall, and R. P. Sear, “Modelling the filtration efficiency of a woven fabric: The role of multiple lengthscales,” (2021), arXiv:2110.02856 [physics.flu-dyn] .
- Robinson and Sear (2021) J. F. Robinson and R. P. Sear, “maskflow: a python package to evaluate filtration properties of face masks and coverings.” https://doi.org/10.5281/zenodo.5643961 (2021).