Hadronization of correlated gluon fields
Abstract
Following an explicit example, we present the chain of steps required for an event-by-event description of hadron production in high energy hadronic and nuclear collisions. We start from incoming nuclei, described in the Color Glass Condensate effective theory, whose collision creates the gluon fields of the glasma. Individual gluons are then sampled from the gluon fields’ Husimi (smeared Wigner) distributions, and clustered using a new spacetime based algorithm. Clusters are fed into the Herwig event generator, which performs the hadronization, conserving energy and momentum. We discuss the physical implications of smearing and problems with the quasi particle picture for the studied processes. We compute spectra of charged hadrons and identified particles and their azimuthal momentum anisotropies, and address systematic uncertainties on observables, resulting from the general lack of detailed knowledge of the hadronization mechanism.
I Introduction.
Strong multi-particle correlations that are long range in rapidity have been observed in high energy collisions of protons with protons or heavy nuclei at both the Large Hadron Collider (LHC) and the Relativistic Heavy Ion Collider (RHIC) Dusling et al. (2016); Schlichting and Tribedy (2016). Comparison of experimental data with calculations employing frameworks with strong final state effects has in many cases shown good agreement Bozek (2012); Bozek and Broniowski (2013a, b, c); Bozek et al. (2013); Bzdak et al. (2013); Qin and Müller (2014); Werner et al. (2014); Kozlov et al. (2014); Schenke and Venugopalan (2014); Romatschke (2015a); Shen et al. (2017); Weller and Romatschke (2017); Mäntysaari et al. (2017); Schenke et al. (2020a), while calculations based on initial state effects, such as those within the Color Glass Condensate (CGC) effective field theory (EFT) McLerran and Venugopalan (1994a, b, c); Iancu et al. (2001a, b); Ferreiro et al. (2002); Iancu and Venugopalan (2003); Gelis et al. (2010); Kovchegov and Levin (2012); Blaizot (2017) have not been able to capture all systematic features of the data Dumitru et al. (2008); Kovner and Lublinsky (2011a); Dumitru et al. (2011); Kovner and Lublinsky (2011b); Dusling and Venugopalan (2012); Levin and Rezaeian (2011); Dusling and Venugopalan (2013a, b); Dumitru and Giannini (2015); Dumitru et al. (2015); Schenke et al. (2015); McLerran and Skokov (2016); Schenke et al. (2016); Dusling et al. (2018a, b); Mace et al. (2018, 2019); Kovner and Skokov (2018).
While the former group employs hydrodynamic calculations, where hadronization is encoded in the equation of state and thus relies on the assumption of thermal equilibrium (with only small deviations due to viscous effects), the latter group has often compared experimental data with parton level results, or employed independent fragmentation, which should only be valid at high (see e.g. Kniehl et al. (2000) for details). Apart from a study of p+p collisions Schenke et al. (2016), there has not been an event-by-event calculation in the CGC that employs a sophisticated hadronization description, and would thus allow for direct comparison to experimental data.
In this work, we introduce a new clustering algorithm, dubbed SAHARA (Spacetime Arranging HAdRonizer Application), which can take combined momentum and coordinate space distributions of partons, and generate input for existing hadronization routines, as those available in e.g. PYTHIA Sjöstrand et al. (2015) or Herwig Bahr et al. (2008); Bellm et al. (2016). While the presented framework and clustering algorithm can be applied to any type of partonic description, and in principle be connected to a large variety of hadronization schemes, we will present a specific example consisting of an IP-Glasma initial state calculation in p+Pb collisions, determination of the gluon Wigner (Husimi) distribution, clustering with SAHARA, and hadronization of individual clusters using Herwig.
We compute charged hadron transverse momentum spectra and azimuthal anisotropies and , as well as for identified particles. We further study the dependence of calculated observables on the clustering parameters and compare parton to hadron level results. Our results provide a first direct comparison of event-by-event CGC calculations with experimental data in p+Pb collisions, when no intermediate hydrodynamic stage is included.
This paper is organized as follows: In Section II we describe how initial gluon distributions are obtained from solving the Yang-Mills equations, computing the gluon Wigner distributions, and smearing and sampling the distributions. Section III introduces the clustering procedure that results in clusters of gluons that will be hadronized independently. The hadronization is done via Herwig, which is briefly described in Section IV. We present results for observables in Section V and discuss the dependence on clustering parameters. We conclude in Section VI. We finally present distributions of the invariant masses of SAHARA and Herwig clusters in Appendix A.
II Gluon Husimi distribution from the IP-Glasma
The IP-Glasma model is an event-by-event implementation of the leading order CGC framework that computes the gluon fields produced in a high energy nuclear collision and their time evolution based on solutions of the classical Yang-Mills equations Schenke et al. (2012a, b). The energy momentum tensor of these gluon fields has been used as input for event-by-event hydrodynamic calculations whose results have shown very good agreement with experimental data for a large variety of collision systems (see e.g. the recent comprehensive study in Schenke et al. (2020b)). Here, we extract the (boost invariant) gluon Wigner distribution as done previously in Greif et al. (2017). This involves evaluating equal time correlation functions in Coulomb gauge and the projection onto transverse polarization states of the free theory Berges et al. (2014)
| (1) |
which we compute at the time , after which the system becomes essentially free-streaming Schenke et al. (2015, 2012b). Here, runs over the transverse polarizations, over the colors. The time dependent transverse polarization vectors are given by , and in Coulomb gauge take the form Berges et al. (2014); Schenke et al. (2015)
| (2) | ||||
| (3) |
with and the Hankel functions of the second kind and order .
The gluon fields as a function of transverse position are given by and obtained from the IP-Glasma calculation, described e.g. in Schenke et al. (2012a, b, 2015, 2020b). The model includes fluctuations of nucleon positions and three subnucluonic hot-spots, whose distributions, along with the IP-Sat model Bartels et al. (2002); Kowalski and Teaney (2003) that provides the saturation scale for a given collision energy, rapidity, and thickness function, determine the spatial color charge density distributions in the incoming proton and nucleus. The setup is as described in Schenke et al. (2020b), including normalization fluctuations in the of each hot spot, except that some parameters are chosen differently. In particular, here we choose the infrared regulator , and the width parameter of the normalization fluctuation . Using the resulting color charge density, the McLerran-Venugopalan model McLerran and Venugopalan (1994d, e) determines the fluctuating color charges, which form the external current in the Yang-Mills equations for the incoming gluon fields Kovner et al. (1995). We then numerically solve for the gluon fields produced in the collision and evolve them with the source free Yang-Mills equations to , which corresponds to approximately a time scale of .
We stress that although the Wigner distribution (II) contains all information about single particle states, it is not positive semi-definite in all phase-space regions. Consequently, it is not a probability distribution, which is necessary for a quasi-particle interpretation. Since in proton-proton or proton-nucleus collisions the spatial variations on scales of the order of the proton size , occur on essentially the same scale as the de-Broglie wave-length of typical excitations , a quasi-particle interpretation is problematic, as there is no clear separation of scales between the length scale of gradients and the quantum mechanical size of the wave-packet of a single particle. Hence, in order to obtain a positive definite quasi-particle distribution, it is necessary to perform a coarse graining procedure before the sampling of individual gluons, which then can be clustered and hadronized.
In order to obtain a quasi-particle distribution from the Wigner distribution (II), we need to smear it over phase-space volumes of size . This leads to a single particle distribution, the so called Husimi distribution Husimi (1940), which within our boost-invariant picture reads
| (4) | |||
We use and , to achieve a reasonable compromise between spatial and momentum resolution. Since the classical Yang-Mills calculation yields results for rather than the multiplicity , the strong coupling constant can be adjusted a posteriori to produce the correct charged particle multiplicities after hadronization, resulting in for our study.
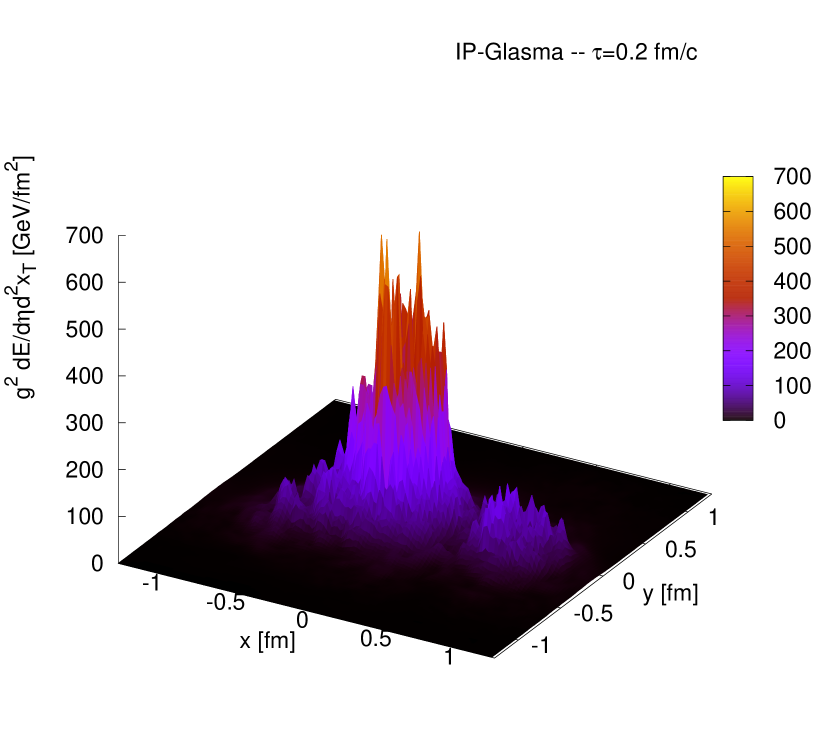
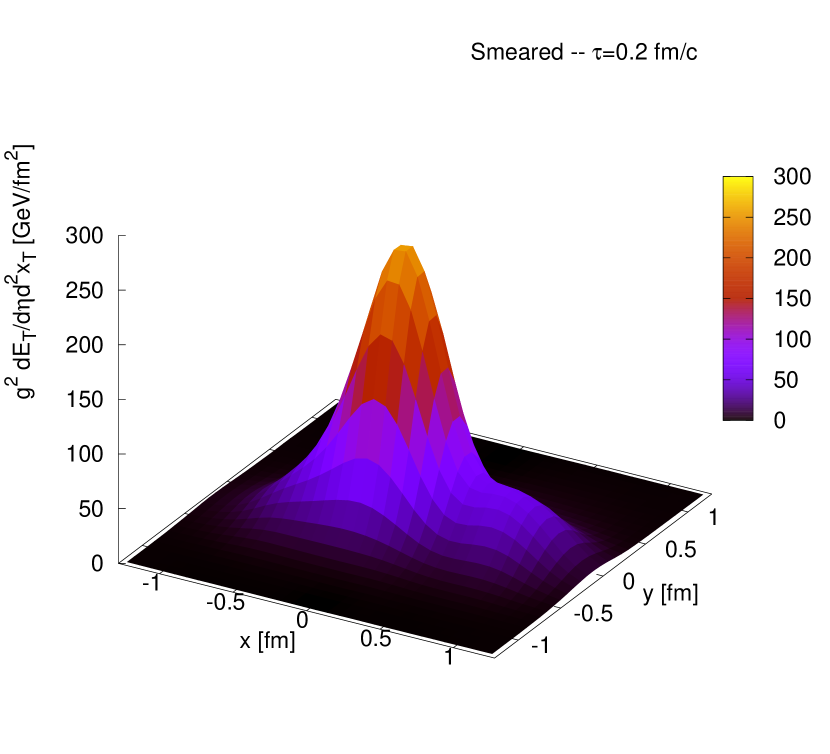
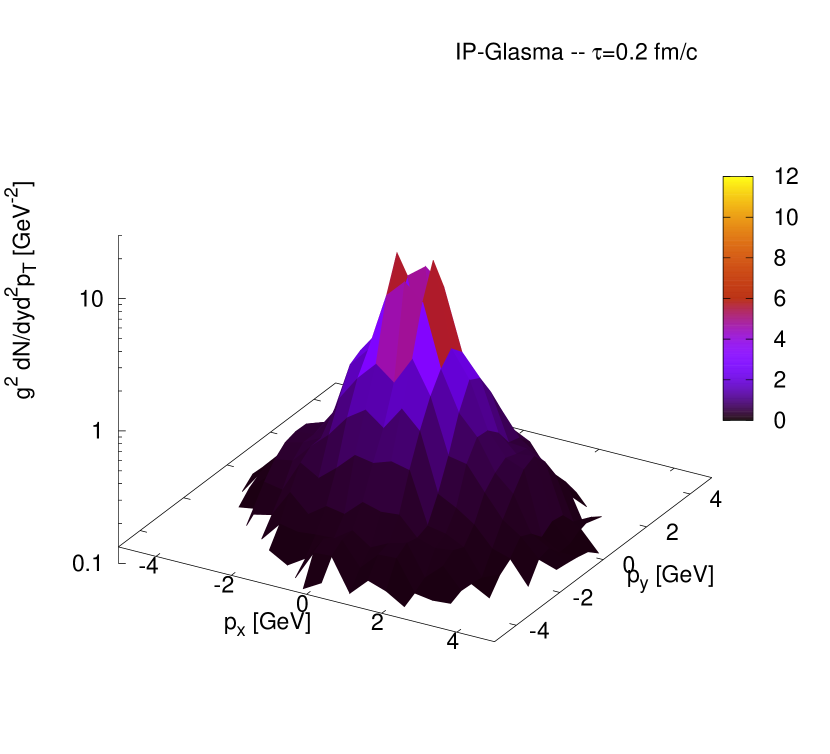
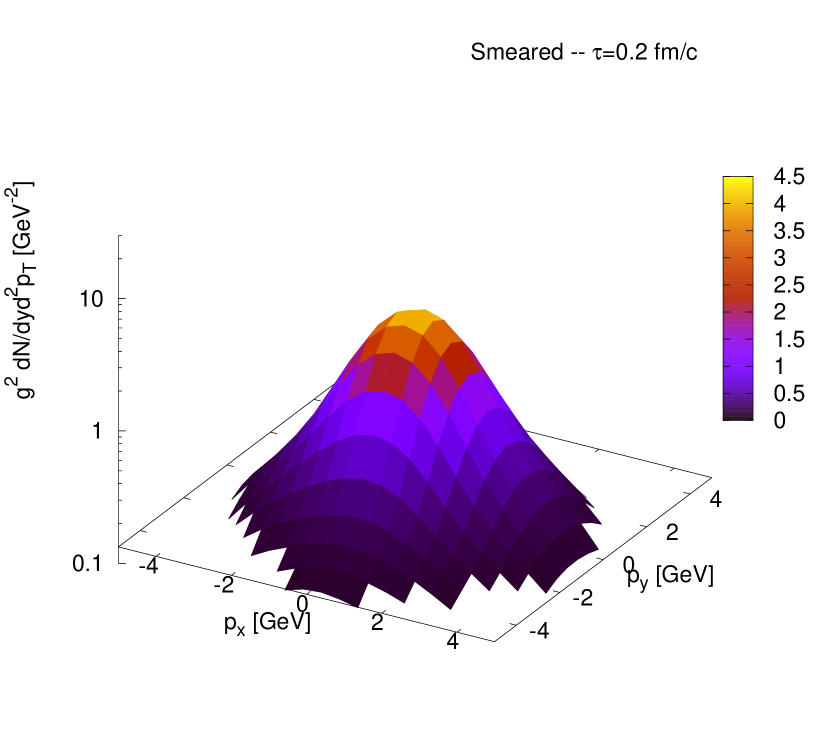
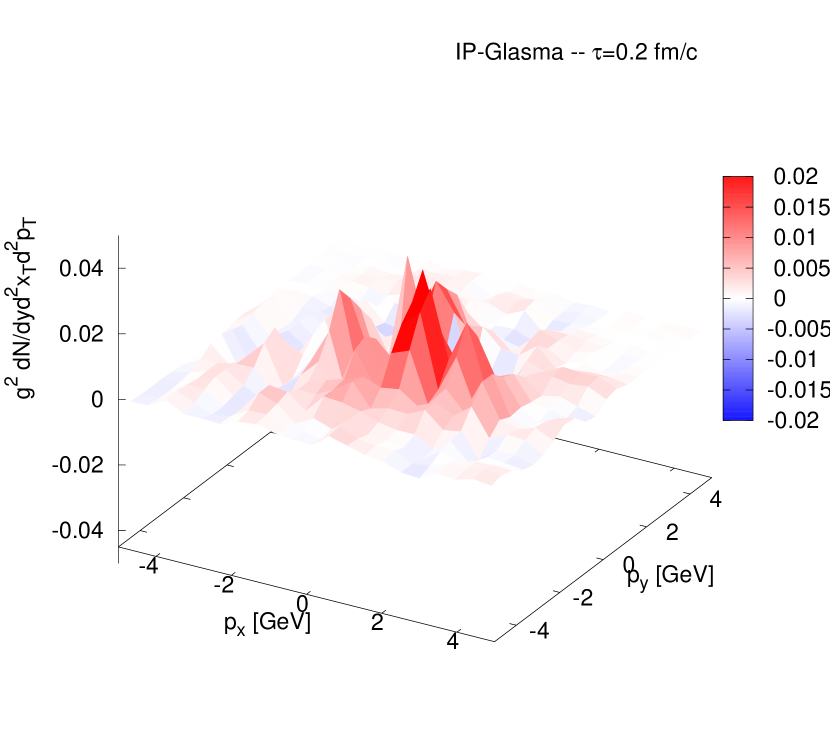
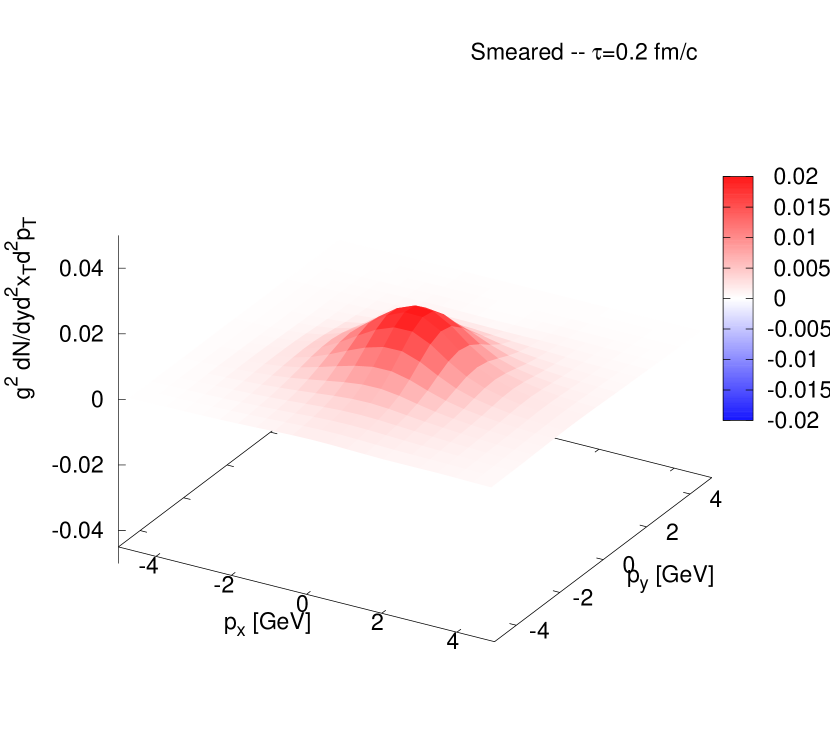
The various steps in this procedure are illustrated in Fig. 1, where in the different panels we present the spatial distribution of the energy density per unit rapidity , the momentum space distributions , as well as the Wigner and Husimi distributions. We note that for the energy density, the result before smearing is obtained from the gauge invariant operator definition, while after the smearing the local energy density is calculated from the momentum integral of the phase-space distribution in Eq. (4). Generally, one observes that the minimal uncertainty smearing has a non-negligible effect on both the spatial and momentum distributions, indicating that any theoretical description based on localized quasi-particles is definitely pushed to its limits of validity in p+Pb collisions. Nevertheless, even though fluctuations on short distance and momentum scales are completely washed out by the smearing, the structure of the event on distance scales and momentum scales remains intact.
III Clustering with SAHARA
Since the hadronization in typical high energy physics event generators requires the notion of events with individual partons, we subsequently sample a collection of
individual gluons over a spacetime rapidity range determined by , with the transverse coordinates and assigned according to the Husimi distribution for a given event in Eq. (4). Evidently, a single sampling of the event will not capture all the features of the underlying IP-Glasma event. Therefore, we sample each IP-Glasma event multiple times, and perform the subsequent hadronization procedure independently for each sample.
Starting from an individual event, characterized by the spacetime positions and four momenta (with ) of the produced gluons, we invoke SAHARA to arrange the event into color neutral clusters, which will hadronize independently of each other. Since the gluons initially produced in a (semi-) hard scattering can have undergone additional re-interactions in the final state, the clustering in SAHARA is not tied to the hard production process, but instead based on the concept of spacetime locality of the hadronization process, where gluons with a small distance of closest approach
| (5) |
in the center of mass frame of the collision are likely to hadronize together, as they have closely encountered each other over the course of the spacetime evolution of the collision. We further note that by defining the distance in Eq. (5) in terms of the (forward restricted ) distance of closest approach, any free-streaming evolution in the final state does not change the proximity measure and the cluster hadronization will be modified only if the produced gluons experience final state interactions.
Next, in order to implement the idea of a local hadronization process, we define a cluster action and perform a statistical clustering, where the probability to obtain a given cluster configuration with non-empty clusters is given by
| (6) |
with being the partition function. Specifically, for each cluster containing gluons, we define
| (7) |
where is the average distance of closest approach of gluons inside the cluster and is the number of gluons inside the cluster, such that the factor can be thought of as the average length of the color flux tube connecting individual gluons. On the other hand, the clustering parameter controls the importance of spacetime locality within each cluster, relative to the combinatorial possibilities of clustering. Evidently, to achieve color neutral clusters, each cluster needs to contain at least gluons. However, instead of requiring a minimal number of two gluons per cluster, we will treat as a free parameter and vary its value to study the effect on hadronic observables.
Statistical clustering in SAHARA is performed by a Markov Chain Monte Carlo procedure, which consists of three distinct steps, where clusters can split, merge or exchange particles to ensure ergodicity. Since the statistical clustering is based on the probabilities in Eq. (6) it is independent of the details of the algorithmic implementation and we refrain from providing an exhaustive discussion of technical details.
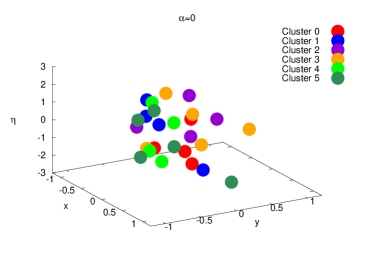
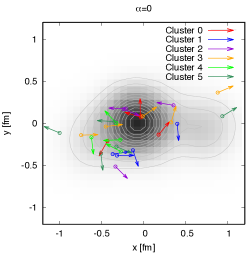
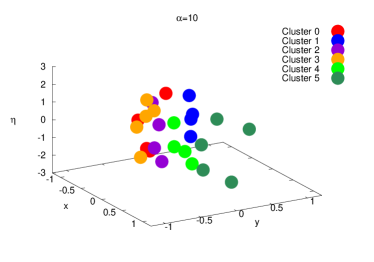
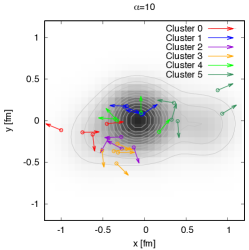
We present an example of a SAHARA cluster configuration in Fig. 2, for the same 5.02 TeV p+Pb event with (where is the average over all events) depicted in Fig. 1. Points mark the position of gluons and arrows indicate the corresponding velocities.
Different SAHARA clusters (0,…,5) are indicated by different color coding. On the left, we show the three dimensional distribution of the gluons’ spatial positions. Upper panels correspond to a purely statistical clustering (), and lower panels to clustering with preferably small distance of closest approach (). In that case, one can see that clusters extend over several units in rapidity, but are well localized in the transverse - plane. On the right hand side we show projections to the - plane overlayed with the smeared energy density distribution of the event at . The stronger localization of clusters for the case (bottom) compared to (top) is clearly visible here.
IV Hadronization with Herwig
Each individual cluster generated by SAHARA is then hadronized using Herwig 7 Bahr et al. (2008); Bellm et al. (2016). In order to do so, we need to assign color connections to the gluons in each cluster. Since we have sampled individual gluons from the single particle distribution (4), we have no information on the color flow of the event or individual clusters, and we therefore choose to perform a democratic color assignment in the spirit of maximizing the associated entropy. In practice, we need to assign two ”color values” to every gluon, which indicates its connection to one or two other gluons (we do not include quarks or anti-quarks, which would have a single color index). Note that one in principle could employ a different prescription, e.g. connecting gluons according to their invariant mass or another measure inspired by the kinematic dependence of color subamplitudes. Since the masses of the SAHARA clusters are already peaked at small values (see Appendix A) and do not constitute a genuine hard jet configuration, we do not consider any more sophisticated treatment in this context. We have also found that color reconnection in Herwig (see Gieseke et al. (2018) and references therein) within the SAHARA clusters do not affect our results and that we obtain a reasonable mass spectrum of Herwig clusters, which supports our choice. Because the total event record, i.e., the cluster to be hadronized, has to be color neutral, we begin with ”color neutral gluons”, i.e., gluons that have the same color and anti-color index. We then proceed to independently shuffle the color and anti-color values of all gluons until no color neutral gluons are left in the final event record.
For every cluster we provide Herwig with a Les Houches Alwall et al. (2007) event record that contains the parton level information, including the gluons’ color connections and four-momenta. While Herwig can in principle use coordinate-space information for its color reconnection, we here do not include this, because the SAHARA clustering already provides the necessary correlations in color space. In practice, Herwig is provided with a singlet-into-gluons type of process in the center-of-mass frame of each individual SAHARA cluster.
As some of the SAHARA clusters can still have significant masses, and no additional parton cascade is included in the simulation, we do let Herwig perform the parton showering according to the coherent branching algorithm outlined in Gieseke et al. (2003). After the gluons have been split into quark–anti-quark pairs, clusters of color connected quarks and anti-quarks are formed.111We stress that one should not confuse the clusters generated by SAHARA with the ones that Herwig itself produces within a SAHARA cluster. We discuss the invariant mass distributions of SAHARA clusters and Herwig clusters in Appendix A. Their mass spectrum is compatible with the assumptions of the cluster hadronization model Webber (1984), and mostly independent of the choice of (see Appendix A), and they undergo the usual mechanism of cluster fission and cluster decay into hadrons. Given the universality of the cluster hadronization model in dependence on the center-of-mass energy, provided that there has been a coherent branching evolution, our approach should be viable for the hadronization of gluon clusters originating from a glasma simulation.
V Results
The Herwig output consists of final particles and their momenta after showers and resonance decays. Combining results from all clusters and applying the appropriate boosts from the cluster’s center of momentum to the lab frame, we obtain an event-by-event record of the produced hadrons. We oversample a single IP-Glasma event several thousand times, meaning that we sample individual gluons and run SAHARA followed by Herwig many times, and combine all oversampled results to obtain the final particle spectra for each IP-Glasma event.
We analyze those using the publicly available toolkit by Chun Shen aft , which has been used for a variety of hybrid hydrodynamic and hadronic cascade calculations Shen et al. (2016); McDonald et al. (2017); Mäntysaari et al. (2017); Schenke et al. (2020b), and obtain transverse momentum spectra and azimuthal momentum anisotropies in different centrality classes. We will compare hadron level results to those for gluons and study the dependence on the clustering parameters and .
We begin our analysis by comparing the final charged hadron transverse momentum spectrum to the gluon spectra before and after smearing in the centrality class around twice the minimum bias multiplicity in p+Pb collisions in Fig. 3. We also compare to the hadron spectrum obtained from performing independent fragmentation of the smeared gluon spectrum using the next to leading order (NLO) Kniehl-Kramer-Potter (KKP) fragmentation functions Kniehl et al. (2000) as described in Schenke et al. (2014).
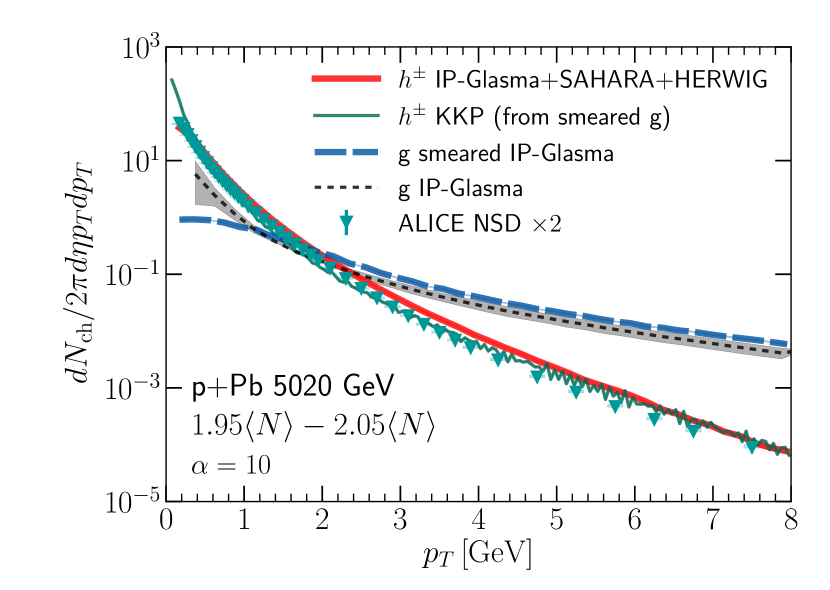
We find that for the largest studied transverse momenta, , the result from IP-Glasma+SAHARA+Herwig agrees well with the IP-Glasma+KKP result, which can be expected. For decreasing transverse momenta, differences increase, with the largest discrepancy for , where the application of fragmentation functions is indeed questionable.
In comparison to the gluon spectra we observe that the hadron spectrum is significantly steeper, as expected from earlier studies Schenke et al. (2014). We also note that the effect of smearing on the gluon spectrum is rather mild, only becoming significant for .
We finally show the experimental data for the non single diffractive (NSD) charged hadron spectrum measured by the ALICE Collaboration Acharya et al. (2018) and scaled by a factor of 2, as we show our bin. This is not a perfect comparison, as the ALICE result contains all NSD events and not just a small selection like our result, which may affect the shape of the spectrum. Nevertheless, the comparison shows rather good agreement, particularly at the lowest and highest shown, with small deviations in the range .
We note that in Fig. 3, we used the clustering parameter and minimal number of gluons per cluster . Changing to 0 resulted in a 5-10% difference in the charged hadron -spectrum and we will return to the dependence on clustering parameters below, where we discuss azimuthal anisotropies, which are more sensitive to .
Next, we will analyze the azimuthal anisotropies of produced particles, which are determined using the scalar product method Adler et al. (2002); Bilandzic et al. (2011)
| (8) |
where the anisotropic flow vectors are given by
| (9) |
and
| (10) |
The angles are the azimuthal angles of the ’th particle. The sum over runs over all final particles in either a specific bin and , after oversampling, where is pseudo-rapidity, or in the case of in a reference bin, chosen to cover and . The number of particles in the reference bin is and
| (11) |
which has self correlations removed by means of the second term in the numerator.
Note that in the case of gluons, we use the same ranges for the reference (and -) bins. For the analysis of identified particles, we constrain particles in the -bin to be of the desired species, and correlate them with all charged hadrons in the reference bin. For integrated , where is defined in analogy to , but using different rapidity intervals for and , respectively, introducing a gap to eliminate residual non-flow (which is already reduced by oversampling). The subtraction of self correlations is unnecessary in that case.
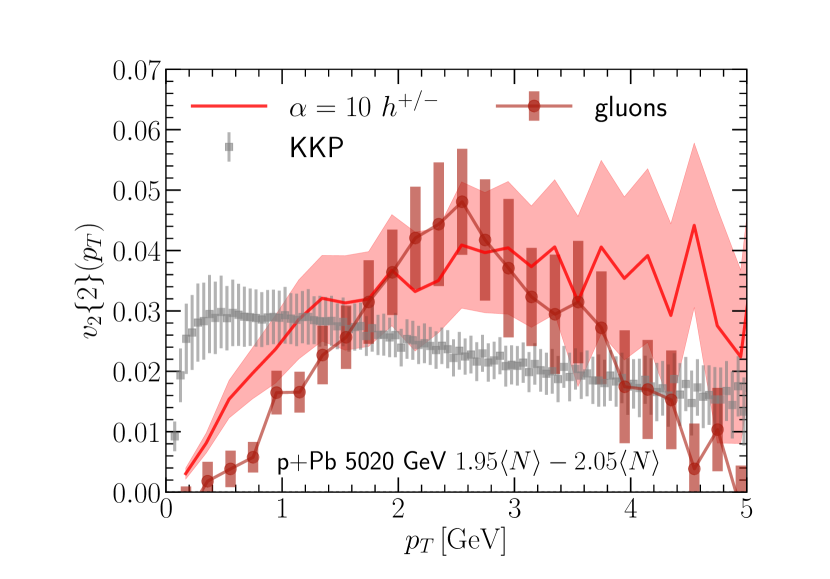
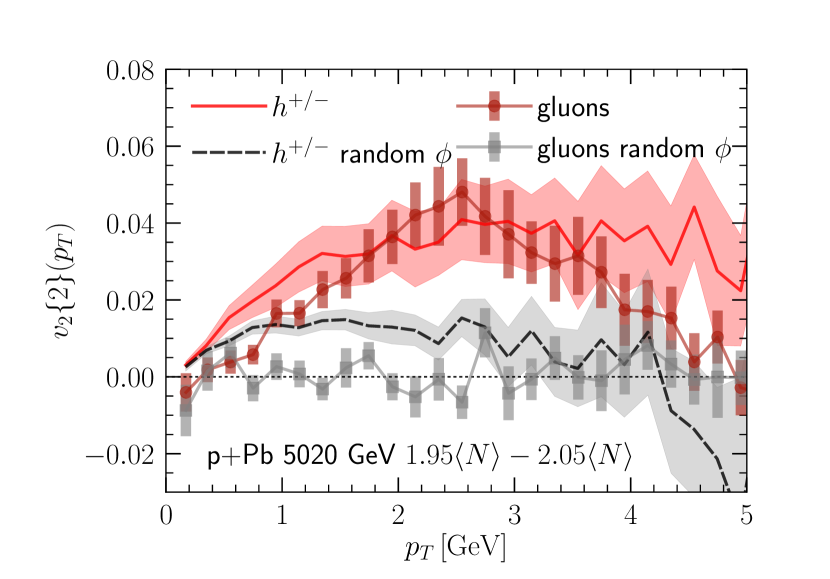
Results for of charged hadrons and gluons are shown in Fig. 4 for events with approximately two times the minimum bias multiplicity . Solid lines in Fig. 4 correspond to the final result for charged hadrons, which we compare to the gluon shown by filled circles. It is interesting to note that the maximal value of the charged hadron is comparable to that of the gluons. Furthermore, the charged hadron is larger than that of the gluons at low , which is expected, as during fragmentation larger gluons fragment into smaller hadrons. The larger hadron compared to gluons for could be explained by realizing that azimuthal anisotropies of gluons from the IP-Glasma decorrelate quickly when their difference is increased Schenke et al. (2015), while the additional ”smearing” in from hadronization reduces this effect. Thus, when moves out of the range of the reference bin, , the decorrelation is more rapid for gluons than charged hadrons.
We note that the charged hadron in the experimental data is approximately a factor of three larger (for e.g. ) than our result Chatrchyan et al. (2013); Aad et al. (2013). The discrepancy likely stems from the presence of large final state effects in nature that are neglected here and can e.g. be implemented using a partonic transport approach Greif et al. (2017) or by incorporating a hydrodynamic phase Schenke et al. (2020b).
We also show the comparison to the charged hadron that one obtains by simply folding the gluon distribution with the KKP fragmentation functions. In this case, the dependence is very different from our result, as the fragmentation functions mostly lead to a shift of the maximal to lower momenta, along with a smearing in that reduces the overall magnitude. We note that in Dusling and Venugopalan (2012) different fragmentation functions were explored, and a strong dependence on the near side associated yields (equivalently, the ) was found. Since the azimuthal anistotropies of charged particles are sensitive to non-perturbative hadronization effects, a realistic modeling is required to compare theoretical results with experimental data. Within our SAHARA+Herwig framework, we have also investigated the effect of disabling color reconnections in Herwig and found no effect on the results for .
In order to understand if an artificial anisotropy can be generated in the hadronization process, and to estimate its size in comparison to the full result, we ran the same simulation after randomizing the azimuthal angles of all gluons in an event. The result is shown in Fig. 5, together with the full result, that we repeat from Fig. 4. The expected zero for gluons is verified. For hadrons, however, a finite is observed (dashed line in Fig. 5), albeit significantly smaller than that in the full simulation that includes the gluon momentum anisotropy. The likely origin of this anisotropy for hadrons are the changing off-diagonal elements of the energy momentum tensor222While energy and momentum are conserved, e.g. is not conserved during our procedure. during the hadronization process, which, as discussed in Romatschke (2015b), can induce azimuthal anisotropies in momentum space.
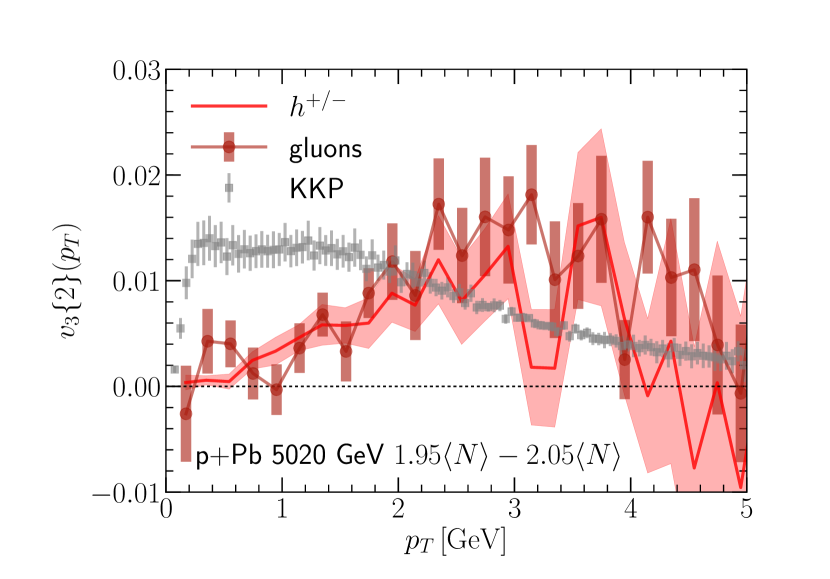
The third harmonic for charged hadrons and gluons in the multiplicity class is shown in Fig. 6. We find that the charged hadron resembles that for gluons closely for all . Again, experimental data for is approximately three times larger than our result Chatrchyan et al. (2013); Aad et al. (2013), as we lack strong final state interactions. Again, we show for comparison the result obtained when folding the gluon distribution with NLO KKP fragmentation functions. As in the case of , the transverse momentum shape of is very different in this case, with the largest values reached at much lower .
As discussed previously in the literature Schenke et al. (2015, 2020a), the momentum anisotropy of gluons in the CGC decreases as a function of multiplicity, which is intuitively explained within the color domain model Dumitru and Giannini (2015); Lappi et al. (2016). In Fig. 7 we show the charged hadron for three different multiplicity classes. While statistical errors are large, we see a systematic decrease of in the bin containing events with multiplicity compared to the class. The difference between the classes around and is small.
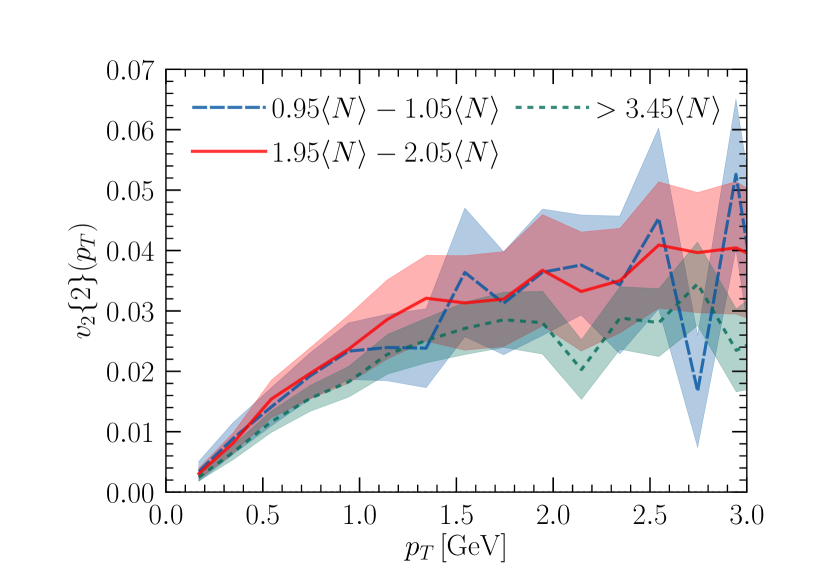
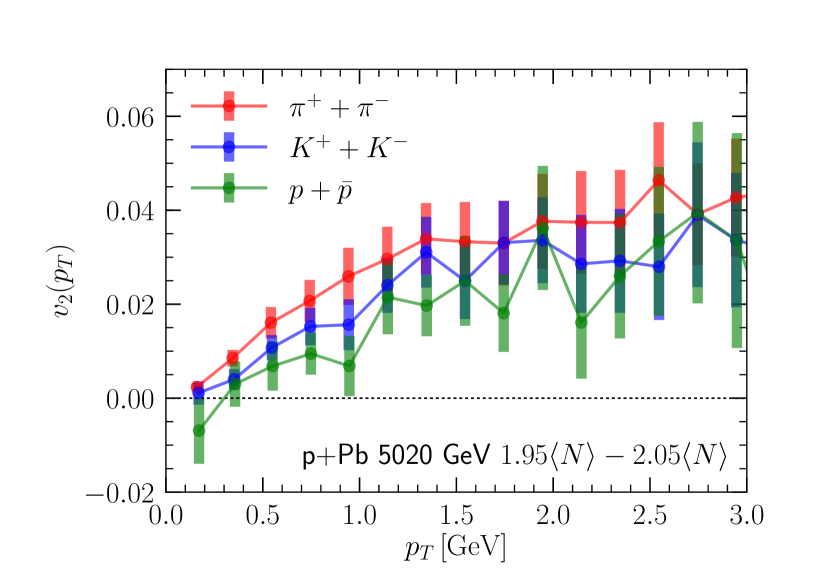
Fig. 8 shows the for identified pions, kaons, and (anti-)protons. While statistical errors are large, one can see a clear mass ordering of the . This is expected, as particles emerge from clusters with a common transverse velocity, similar to the case of particlization from a fluid cell in a hydrodynamic simulation. The effect of mass splitting was also observed in calculations using IP-Glasma and PYTHIA for p+p collisions for similar reasons Schenke et al. (2016). Given these observations, it is hard to imagine a hadronization mechanism that does not lead to mass splitting of the , and identifying the correct underlying mechanism requires a detailed quantitative analysis.
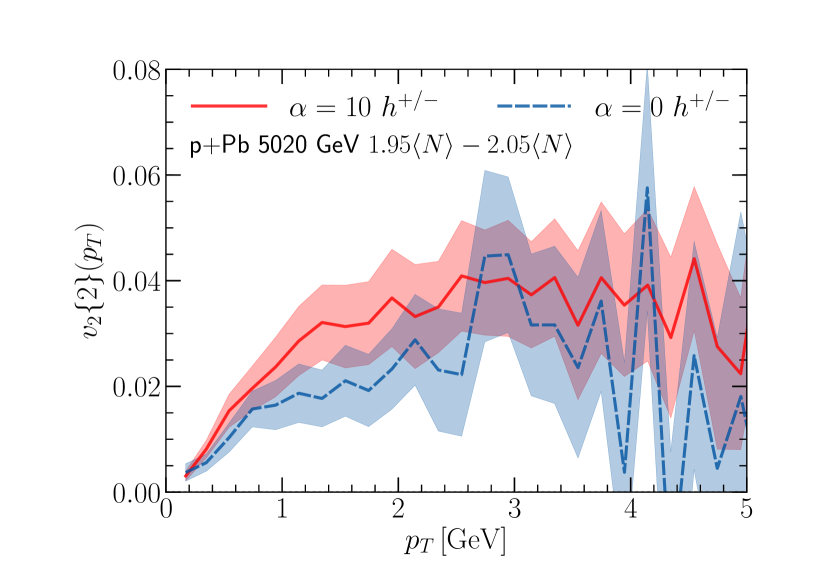
So far we have analyzed azimuthal correlations for the default SAHARA clustering with and . Next, to estimate the uncertainty from our clustering algorithm, we will vary the parameters and discussed below Eq. (7). Fig. 9 shows in the multiplicity class for our standard choice of together with the case . As vanishing means that gluons are randomly assigned to clusters, independently from their position and momenta, it is not surprising that the resulting is reduced in this case. Increasing prefers clustering of nearby gluons (defined via the distance of closest approach), which leads to larger cluster momenta, which in turn will better retain the azimuthal anisotropy of the gluons.
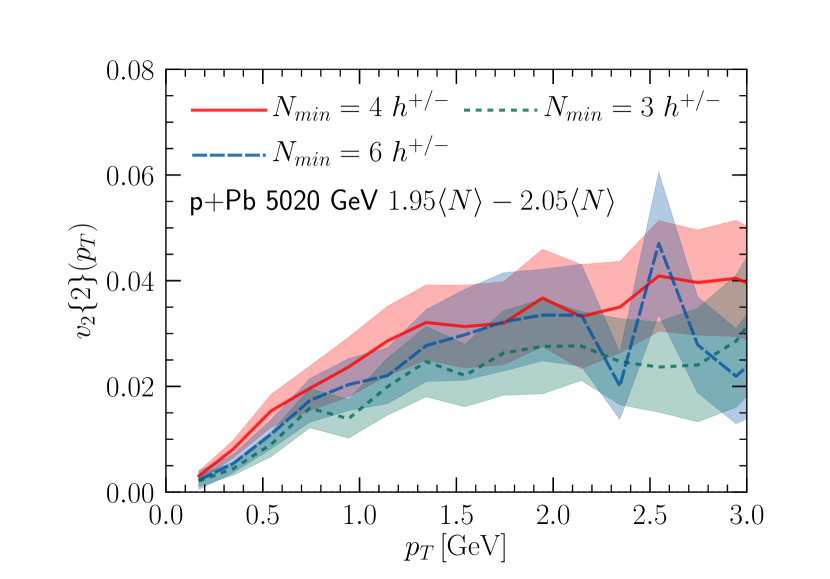
In Fig. 10 we study the dependence of charged hadron on the minimal number of gluons per cluster . The results for and 6 agree within our statistical errors, but we see that the case leads to systematically larger than the other two. While it is expected that an increasing leads to a reduction of , because clusters will be forced to contain more gluons with increasingly different positions and momenta, it is not obvious why reducing from four to three reduces . One possible explanation is that clusters with fewer particles also have a smaller extent in rapidity, such that correlations within individual clusters are less likely to survive the rapidity gap introduced in Eq. (8). However, other effects associated e.g. to details of the color structure, caused by having fewer particles in a cluster, are also conceivable.
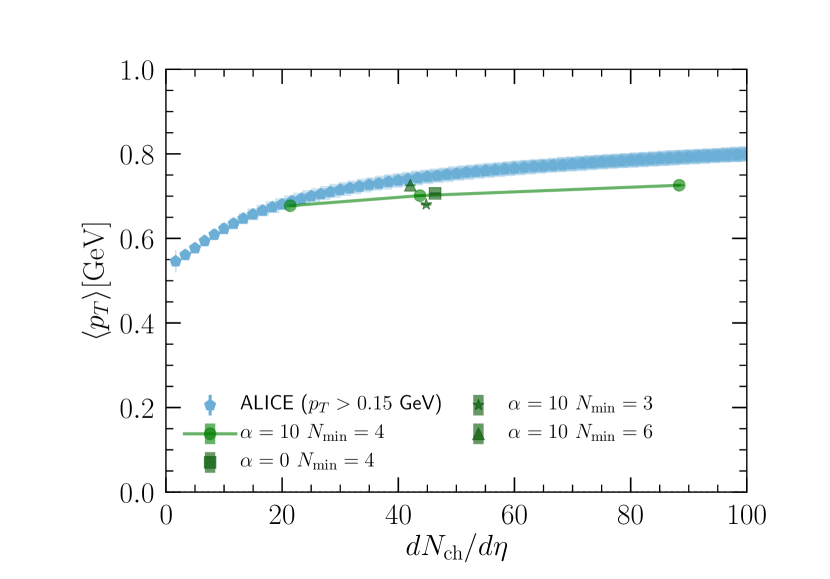
We continue with the study of charged hadron mean transverse momentum as a function of charged hadron multiplicity in Fig. 11. We compare to experimental data from the ALICE Collaboration Abelev et al. (2013), and for the centrality class vary and to estimate the uncertainty from the clustering procedure. Generally, we find that the agreement with the experimental data is rather good, in particular for the lower multiplicities, while the dependence on the clustering parameters and in the studied range is weak.
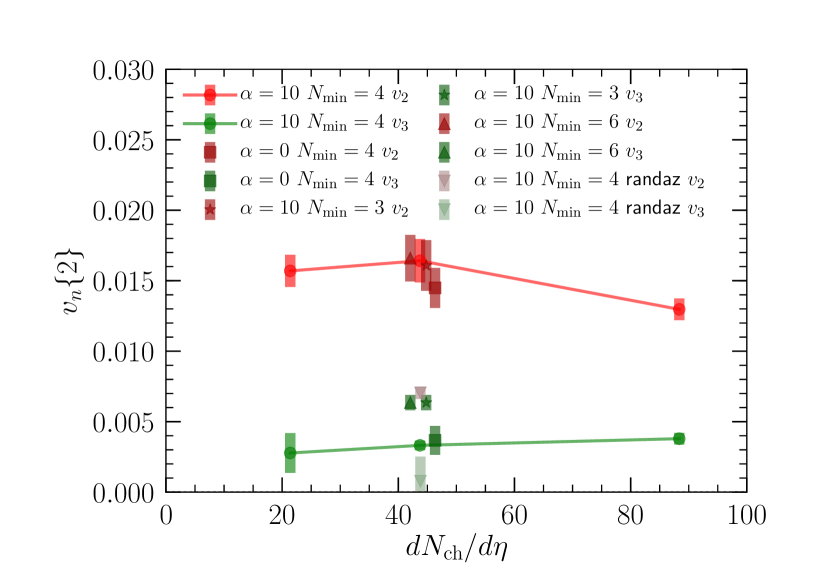
In Fig. 12 we show the -integrated charged hadron for as a function of charged hadron multiplicity. We do not show a comparison to experimental data, as it is at least a factor of three above our results, as discussed above. Similar to Fig. 11, we again show results obtained for varying and for the bin. We find that for the integrated the dependence on the parameters is rather small as it is dominated primarily by low particles, for which we had seen a small effect from the choice of or . Even though for the dependence on the parameters is slightly larger, it is hard to deduce a clear systematic effect. Besides the results from full IP-Glasma+SAHARA+Herwig simulations, which contain initial state momentum correlations of gluons in IP-Glasma, we also show results for the case of randomized gluon azimuthal angles. While the charged hadron is consistent with zero in this case, is finite, as we had observed for .
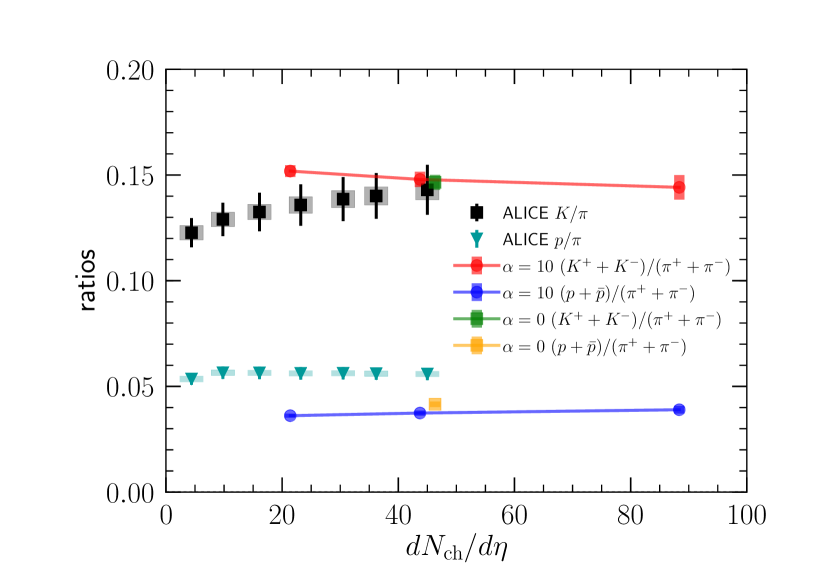
Finally, we present the ratios of kaons and protons to pions as functions of charged hadron multiplicities in Fig. 13. Somewhat surprisingly, as we do not include any quark degrees of freedom, the ratio of kaons to pions agrees well with the experimental data from the ALICE Collaboration Abelev et al. (2014). The ratio of protons to pions underestimates the experimental data by approximately 30-40%. We also show results for , which are very similar to those for , indicating that the hadrochemistry is not significantly affected by the details of the clustering.
VI Conclusions
We presented a newly developed hadronization scheme based on spacetime locality along with a first application to gluonic systems produced in p+Pb collisions at the LHC. As the gluon Wigner distribution is not positive semi-definite, a quasi-particle interpretation is not immediately possible. This is in principle a fundamental problem, which we circumvent by smearing the Wigner distribution over phase-space volumes determined by the uncertainty principle, which makes it positive semi-definite and allows the sampling of individual gluons. These gluons are then clustered based on their distance of closest approach, and the clusters are passed to Herwig, which performs the hadronization according to its default procedure.
We computed transverse momentum spectra and azimuthal momentum anisotropies of charged hadrons, showing that the hadronic observables closely resemble the gluonic ones, with the largest differences for at the lowest . This validates to some degree the comparisons of parton level results to experimental data, as done with some previous CGC based calculations (e.g. Mace et al. (2018, 2019)). Performing independent fragmentation by folding gluon distributions with NLO KKP fragmentation functions on the other hand modifies the dependence of the dramatically.
While spectra and mean transverse momenta agree well with the experimental data, the overall magnitude of the is significantly smaller than what has been observed in experiment, which supports the conclusion Mäntysaari et al. (2017); Aidala et al. (2019); Giacalone et al. (2020) that final state effects (which we do not include here) are crucial to correctly describe the azimuthal anisotropies, also in small systems.
For identified particles we observe a mass splitting of . It is qualitatively similar to what hydrodynamic calculations predict and what was observed in the experimental data. Further, the particle ratios of K/ and p/ are reasonably well described, given that we do not include any quark degrees of freedom.
We also studied the dependence of the clustering parameters on the final observables, finding only a relatively weak dependence, highlighting the robustness of the prescription. Since the SAHARA framework provides a general interface to the hadronization mechanisms implemented in high-energy physics event generators, it would be interesting in the future to also couple to other hadronization descriptions, such as that used in PYTHIA.
Evidently, to achieve a satisfactory description of collective phenomena in small systems, it will be important to include final state effects within our framework. One possible direction would be to follow Greif et al. (2017) and introduce a phase of partonic scatterings via solutions of the Boltzmann equation (for example using BAMPS Xu and Greiner (2005)), whose outcome can then be clustered using SAHARA and hadronized. This would provide a complete microscopic description of nuclear collisions from the beginning to end and could be applied to a plethora of processes.
VII Acknowledgments.
We thank Chun Shen for useful discussions and advice on using the iEbE* framework. We thank Prithwish Tribedy and Raju Venugopalan for helpful discussions. This work was supported by the Helmholtz International Center for FAIR within the framework of the LOEWE program launched by the State of Hesse. This work is supported by the Deutsche Forschungsgemeinschaft (DFG, German Research Foundation) through the CRC-TR 211 ’Strong-interaction matter under extreme conditions’– project number 315477589 – TRR 211. B.P.S. is supported under DOE Contract No. DE-SC0012704. S.P.’s work has been in part supported by the European Union’s Horizon 2020 research and innovation programme as part of the Marie Skłodowska-Curie Innovative Training Network MCnetITN3 (grant agreement no. 722104), and in part by the by the COST actions CA16201 “PARTICLEFACE” and CA16108 “VBSCAN”. Numerical calculations used the resources of the Center for Scientific Computing (CSC) Frankfurt and the National Energy Research Scientific Computing Center, a DOE Office of Science User Facility supported by the Office of Science of the U.S. Department of Energy under Contract No. DE-AC02-05CH11231.
Appendix A Cluster mass distributions
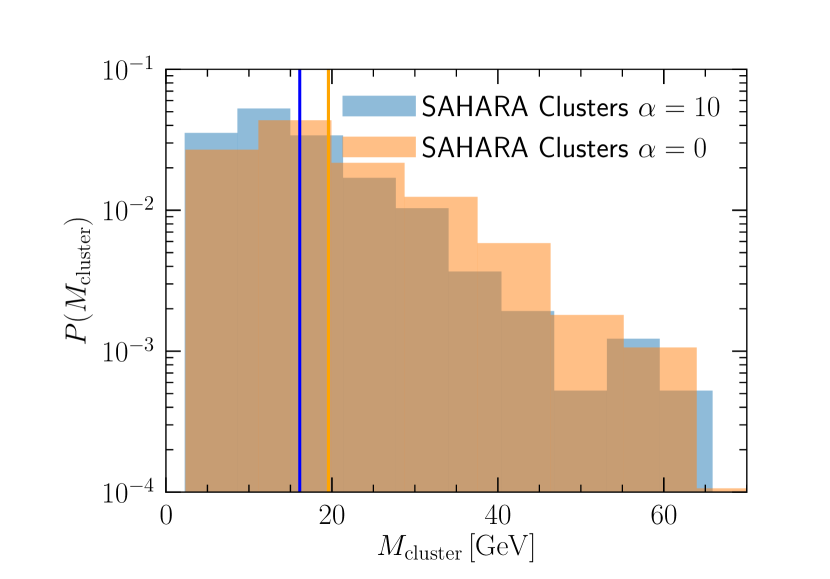
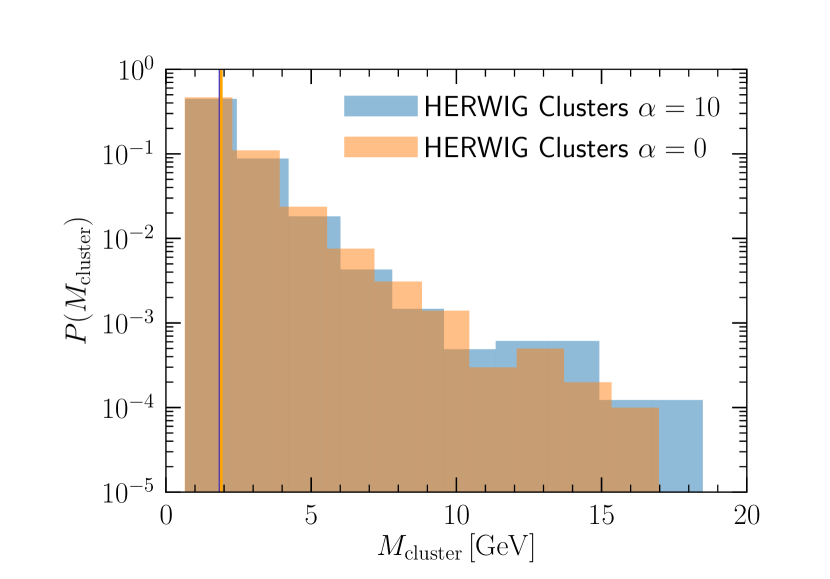
In order to see whether we meet the key assumptions of the cluster hadronization model with the SAHARA cluster systems, we study the distributions of invariant masses of SAHARA clusters (Fig. 14) and of the clusters formed initially within Herwig (Fig. 15) for one specific IP-Glasma event (one configuration of gluon fields).
For SAHARA clusters we see a clear dependence on as expected - smaller leads to larger invariant cluster masses as it leads to particles, that are more separated in momentum space, to be clustered together.
Invariant mass spectra for Herwig clusters fall exponentially and are more universal (independent of ). This indicates that within the mass ranges likely encountered for the SAHARA clusters, the coherent branching algorithm is provided with initial conditions, which guarantee to produce a universal cluster mass spectrum. We have also checked that effects of Herwig’s color reconnection model within the SAHARA clusters are negligible.
References
- Dusling et al. (2016) K. Dusling, W. Li, and B. Schenke, Int. J. Mod. Phys. E 25, 1630002 (2016), arXiv:1509.07939 [nucl-ex] .
- Schlichting and Tribedy (2016) S. Schlichting and P. Tribedy, Adv. High Energy Phys. 2016, 8460349 (2016), arXiv:1611.00329 [hep-ph] .
- Bozek (2012) P. Bozek, Phys. Rev. C 85, 014911 (2012), arXiv:1112.0915 [hep-ph] .
- Bozek and Broniowski (2013a) P. Bozek and W. Broniowski, Phys. Lett. B 718, 1557 (2013a), arXiv:1211.0845 [nucl-th] .
- Bozek and Broniowski (2013b) P. Bozek and W. Broniowski, Phys. Lett. B 720, 250 (2013b), arXiv:1301.3314 [nucl-th] .
- Bozek and Broniowski (2013c) P. Bozek and W. Broniowski, Phys. Rev. C 88, 014903 (2013c), arXiv:1304.3044 [nucl-th] .
- Bozek et al. (2013) P. Bozek, W. Broniowski, and G. Torrieri, Phys. Rev. Lett. 111, 172303 (2013), arXiv:1307.5060 [nucl-th] .
- Bzdak et al. (2013) A. Bzdak, B. Schenke, P. Tribedy, and R. Venugopalan, Phys. Rev. C 87, 064906 (2013), arXiv:1304.3403 [nucl-th] .
- Qin and Müller (2014) G.-Y. Qin and B. Müller, Phys. Rev. C 89, 044902 (2014), arXiv:1306.3439 [nucl-th] .
- Werner et al. (2014) K. Werner, M. Bleicher, B. Guiot, I. Karpenko, and T. Pierog, Phys. Rev. Lett. 112, 232301 (2014), arXiv:1307.4379 [nucl-th] .
- Kozlov et al. (2014) I. Kozlov, M. Luzum, G. Denicol, S. Jeon, and C. Gale, (2014), arXiv:1405.3976 [nucl-th] .
- Schenke and Venugopalan (2014) B. Schenke and R. Venugopalan, Phys. Rev. Lett. 113, 102301 (2014), arXiv:1405.3605 [nucl-th] .
- Romatschke (2015a) P. Romatschke, Eur. Phys. J. C 75, 305 (2015a), arXiv:1502.04745 [nucl-th] .
- Shen et al. (2017) C. Shen, J.-F. Paquet, G. S. Denicol, S. Jeon, and C. Gale, Phys. Rev. C 95, 014906 (2017), arXiv:1609.02590 [nucl-th] .
- Weller and Romatschke (2017) R. D. Weller and P. Romatschke, Phys. Lett. B 774, 351 (2017), arXiv:1701.07145 [nucl-th] .
- Mäntysaari et al. (2017) H. Mäntysaari, B. Schenke, C. Shen, and P. Tribedy, Phys. Lett. B 772, 681 (2017), arXiv:1705.03177 [nucl-th] .
- Schenke et al. (2020a) B. Schenke, C. Shen, and P. Tribedy, Phys. Lett. B 803, 135322 (2020a), arXiv:1908.06212 [nucl-th] .
- McLerran and Venugopalan (1994a) L. D. McLerran and R. Venugopalan, in McLerran and Venugopalan (1994d), pp. 2233–2241.
- McLerran and Venugopalan (1994b) L. D. McLerran and R. Venugopalan, in McLerran and Venugopalan (1994e), pp. 3352–3355.
- McLerran and Venugopalan (1994c) L. D. McLerran and R. Venugopalan, Phys. Rev. D 50, 2225 (1994c), arXiv:hep-ph/9402335 .
- Iancu et al. (2001a) E. Iancu, A. Leonidov, and L. D. McLerran, Nucl. Phys. A 692, 583 (2001a), arXiv:hep-ph/0011241 .
- Iancu et al. (2001b) E. Iancu, A. Leonidov, and L. D. McLerran, Phys. Lett. B 510, 133 (2001b), arXiv:hep-ph/0102009 .
- Ferreiro et al. (2002) E. Ferreiro, E. Iancu, A. Leonidov, and L. McLerran, Nucl. Phys. A 703, 489 (2002), arXiv:hep-ph/0109115 .
- Iancu and Venugopalan (2003) E. Iancu and R. Venugopalan, “The Color glass condensate and high-energy scattering in QCD,” in Quark-gluon plasma 4, edited by R. C. Hwa and X.-N. Wang (2003) pp. 249–3363, arXiv:hep-ph/0303204 .
- Gelis et al. (2010) F. Gelis, E. Iancu, J. Jalilian-Marian, and R. Venugopalan, Ann. Rev. Nucl. Part. Sci. 60, 463 (2010), arXiv:1002.0333 [hep-ph] .
- Kovchegov and Levin (2012) Y. V. Kovchegov and E. Levin, Quantum chromodynamics at high energy, Vol. 33 (Cambridge University Press, 2012).
- Blaizot (2017) J.-P. Blaizot, Rept. Prog. Phys. 80, 032301 (2017), arXiv:1607.04448 [hep-ph] .
- Dumitru et al. (2008) A. Dumitru, F. Gelis, L. McLerran, and R. Venugopalan, Nucl. Phys. A 810, 91 (2008), arXiv:0804.3858 [hep-ph] .
- Kovner and Lublinsky (2011a) A. Kovner and M. Lublinsky, Phys. Rev. D 83, 034017 (2011a), arXiv:1012.3398 [hep-ph] .
- Dumitru et al. (2011) A. Dumitru, K. Dusling, F. Gelis, J. Jalilian-Marian, T. Lappi, and R. Venugopalan, Phys. Lett. B 697, 21 (2011), arXiv:1009.5295 [hep-ph] .
- Kovner and Lublinsky (2011b) A. Kovner and M. Lublinsky, Phys. Rev. D 84, 094011 (2011b), arXiv:1109.0347 [hep-ph] .
- Dusling and Venugopalan (2012) K. Dusling and R. Venugopalan, Phys. Rev. Lett. 108, 262001 (2012), arXiv:1201.2658 [hep-ph] .
- Levin and Rezaeian (2011) E. Levin and A. H. Rezaeian, Phys. Rev. D 84, 034031 (2011), arXiv:1105.3275 [hep-ph] .
- Dusling and Venugopalan (2013a) K. Dusling and R. Venugopalan, Phys. Rev. D 87, 054014 (2013a), arXiv:1211.3701 [hep-ph] .
- Dusling and Venugopalan (2013b) K. Dusling and R. Venugopalan, Phys. Rev. D 87, 094034 (2013b), arXiv:1302.7018 [hep-ph] .
- Dumitru and Giannini (2015) A. Dumitru and A. V. Giannini, Nucl. Phys. A 933, 212 (2015), arXiv:1406.5781 [hep-ph] .
- Dumitru et al. (2015) A. Dumitru, L. McLerran, and V. Skokov, Phys. Lett. B 743, 134 (2015), arXiv:1410.4844 [hep-ph] .
- Schenke et al. (2015) B. Schenke, S. Schlichting, and R. Venugopalan, Phys. Lett. B 747, 76 (2015), arXiv:1502.01331 [hep-ph] .
- McLerran and Skokov (2016) L. McLerran and V. Skokov, Nucl. Phys. A 947, 142 (2016), arXiv:1510.08072 [hep-ph] .
- Schenke et al. (2016) B. Schenke, S. Schlichting, P. Tribedy, and R. Venugopalan, Phys. Rev. Lett. 117, 162301 (2016), arXiv:1607.02496 [hep-ph] .
- Dusling et al. (2018a) K. Dusling, M. Mace, and R. Venugopalan, Phys. Rev. Lett. 120, 042002 (2018a), arXiv:1705.00745 [hep-ph] .
- Dusling et al. (2018b) K. Dusling, M. Mace, and R. Venugopalan, Phys. Rev. D 97, 016014 (2018b), arXiv:1706.06260 [hep-ph] .
- Mace et al. (2018) M. Mace, V. V. Skokov, P. Tribedy, and R. Venugopalan, Phys. Rev. Lett. 121, 052301 (2018), [Erratum: Phys.Rev.Lett. 123, 039901 (2019)], arXiv:1805.09342 [hep-ph] .
- Mace et al. (2019) M. Mace, V. V. Skokov, P. Tribedy, and R. Venugopalan, Phys. Lett. B 788, 161 (2019), [Erratum: Phys.Lett.B 799, 135006 (2019)], arXiv:1807.00825 [hep-ph] .
- Kovner and Skokov (2018) A. Kovner and V. V. Skokov, Phys. Lett. B 785, 372 (2018), arXiv:1805.09297 [hep-ph] .
- Kniehl et al. (2000) B. A. Kniehl, G. Kramer, and B. Potter, Nucl. Phys. B 582, 514 (2000), arXiv:hep-ph/0010289 .
- Sjöstrand et al. (2015) T. Sjöstrand, S. Ask, J. R. Christiansen, R. Corke, N. Desai, P. Ilten, S. Mrenna, S. Prestel, C. O. Rasmussen, and P. Z. Skands, Comput. Phys. Commun. 191, 159 (2015), arXiv:1410.3012 [hep-ph] .
- Bahr et al. (2008) M. Bahr et al., Eur. Phys. J. C 58, 639 (2008), arXiv:0803.0883 [hep-ph] .
- Bellm et al. (2016) J. Bellm et al., Eur. Phys. J. C 76, 196 (2016), arXiv:1512.01178 [hep-ph] .
- Schenke et al. (2012a) B. Schenke, P. Tribedy, and R. Venugopalan, Phys. Rev. Lett. 108, 252301 (2012a), arXiv:1202.6646 [nucl-th] .
- Schenke et al. (2012b) B. Schenke, P. Tribedy, and R. Venugopalan, Phys. Rev. C 86, 034908 (2012b), arXiv:1206.6805 [hep-ph] .
- Schenke et al. (2020b) B. Schenke, C. Shen, and P. Tribedy, Phys. Rev. C 102, 044905 (2020b), arXiv:2005.14682 [nucl-th] .
- Greif et al. (2017) M. Greif, C. Greiner, B. Schenke, S. Schlichting, and Z. Xu, Phys. Rev. D 96, 091504 (2017), arXiv:1708.02076 [hep-ph] .
- Berges et al. (2014) J. Berges, K. Boguslavski, S. Schlichting, and R. Venugopalan, Phys. Rev. D 89, 114007 (2014), arXiv:1311.3005 [hep-ph] .
- Bartels et al. (2002) J. Bartels, K. J. Golec-Biernat, and H. Kowalski, Phys. Rev. D 66, 014001 (2002), arXiv:hep-ph/0203258 .
- Kowalski and Teaney (2003) H. Kowalski and D. Teaney, Phys. Rev. D 68, 114005 (2003), arXiv:hep-ph/0304189 .
- McLerran and Venugopalan (1994d) L. D. McLerran and R. Venugopalan, Phys. Rev. D49, 2233 (1994d).
- McLerran and Venugopalan (1994e) L. D. McLerran and R. Venugopalan, Phys. Rev. D49, 3352 (1994e).
- Kovner et al. (1995) A. Kovner, L. D. McLerran, and H. Weigert, Phys. Rev. D 52, 6231 (1995), arXiv:hep-ph/9502289 .
- Husimi (1940) K. Husimi, Proc. Phys. Math. Soc. Jpn. 22, 264 (1940).
- Gieseke et al. (2018) S. Gieseke, P. Kirchgaeßer, and S. Plätzer, Eur. Phys. J. C 78, 99 (2018), arXiv:1710.10906 [hep-ph] .
- Alwall et al. (2007) J. Alwall et al., Comput. Phys. Commun. 176, 300 (2007), arXiv:hep-ph/0609017 .
- Gieseke et al. (2003) S. Gieseke, P. Stephens, and B. Webber, JHEP 12, 045 (2003), arXiv:hep-ph/0310083 .
- Webber (1984) B. Webber, Nucl. Phys. B 238, 492 (1984).
- (65) The hadronic_afterburner_toolkit is a code package which performs analysis of particle spectra, flow observables, and their correlations using the outputs from hadronic transport models. This work uses v1.0 of the code which can be downloaded from https://github.com/chunshen1987/hadronic_afterburner_toolkit/releases.
- Shen et al. (2016) C. Shen, Z. Qiu, H. Song, J. Bernhard, S. Bass, and U. Heinz, Comput. Phys. Commun. 199, 61 (2016), arXiv:1409.8164 [nucl-th] .
- McDonald et al. (2017) S. McDonald, C. Shen, F. Fillion-Gourdeau, S. Jeon, and C. Gale, Phys. Rev. C 95, 064913 (2017), arXiv:1609.02958 [hep-ph] .
- Schenke et al. (2014) B. Schenke, P. Tribedy, and R. Venugopalan, Phys. Rev. C 89, 024901 (2014), arXiv:1311.3636 [hep-ph] .
- Acharya et al. (2018) S. Acharya et al. (ALICE), JHEP 11, 013 (2018), arXiv:1802.09145 [nucl-ex] .
- Adler et al. (2002) C. Adler et al. (STAR), Phys. Rev. C 66, 034904 (2002), arXiv:nucl-ex/0206001 .
- Bilandzic et al. (2011) A. Bilandzic, R. Snellings, and S. Voloshin, Phys. Rev. C 83, 044913 (2011), arXiv:1010.0233 [nucl-ex] .
- Chatrchyan et al. (2013) S. Chatrchyan et al. (CMS), Phys. Lett. B 724, 213 (2013), arXiv:1305.0609 [nucl-ex] .
- Aad et al. (2013) G. Aad et al. (ATLAS), Phys. Lett. B 725, 60 (2013), arXiv:1303.2084 [hep-ex] .
- Romatschke (2015b) P. Romatschke, Eur. Phys. J. C 75, 429 (2015b), arXiv:1504.02529 [nucl-th] .
- Lappi et al. (2016) T. Lappi, B. Schenke, S. Schlichting, and R. Venugopalan, JHEP 01, 061 (2016), arXiv:1509.03499 [hep-ph] .
- Abelev et al. (2013) B. B. Abelev et al. (ALICE), Phys. Lett. B 727, 371 (2013), arXiv:1307.1094 [nucl-ex] .
- Abelev et al. (2014) B. B. Abelev et al. (ALICE), Phys. Lett. B 728, 25 (2014), arXiv:1307.6796 [nucl-ex] .
- Aidala et al. (2019) C. Aidala et al. (PHENIX), Nature Phys. 15, 214 (2019), arXiv:1805.02973 [nucl-ex] .
- Giacalone et al. (2020) G. Giacalone, B. Schenke, and C. Shen, Phys. Rev. Lett. 125, 192301 (2020), arXiv:2006.15721 [nucl-th] .
- Xu and Greiner (2005) Z. Xu and C. Greiner, Phys. Rev. C 71, 064901 (2005), arXiv:hep-ph/0406278 .