Compaction-Driven Black Hole Growth
Abstract
We study the interplay between galaxy evolution and central black-hole (BH) growth using the NewHorizon cosmological simulation. BH growth is slow when the dark-matter halo is below a golden mass of , and rapid above it. The early suppression is primarily due to gas removal by supernova (SN) feedback in the shallow potential well, predicting that BHs of tend to lie below the linear relation with bulge mass. Rapid BH growth is allowed when the halo is massive enough to lock in the SN ejecta by its deep potential well and its heated circum-galactic medium (CGM). The onset of BH growth between these two zones is triggered by a wet-compaction event, caused, e.g., by mergers or counter-rotating streams. It brings gas that lost angular momentum into the inner- “blue nugget" and causes major transitions in the galaxy structural, kinematic and compositional properties, including the onset of star-formation quenching. The compaction events are confined to the golden mass by the same mechanisms of SN feedback and hot CGM. The onset of BH growth is associated with its sinkage to the center due to the compaction-driven deepening of the potential well and the associated dynamical friction. The galaxy golden mass is thus imprinted as a threshold for rapid BH growth, allowing the AGN feedback to keep the CGM hot and maintain long-term quenching. AGN feedback is not causing the onset of quenching; they are both caused by a compaction event when the mass is between the SN and hot-CGM zones.
keywords:
galaxies: dynamics – galaxies: evolution – galaxies: formation – galaxies: haloes – galaxies: active – quasars: supermassive black holes1 Introduction
Observations of central black holes (BHs) and the associated active galactic nuclei (AGN), as well as cosmological simulations, indicate a characteristic mass for black holes and their host galaxies, near a stellar mass of or a halo mass . For example, AGN are observed to dominate the emission lines in BPT diagrams (Baldwin et al., 1981) in galaxies above this characteristic mass (Kauffmann et al., 2003; Vitale et al., 2013). A comparable mass is indicated in studies of AGN and their host galaxies (e.g. Juneau et al., 2015; Kocevski et al., 2017). Most notably, a similar mass threshold is obtained for AGN-driven outflows (Förster Schreiber et al., 2019). At low masses, there seem to be partial indications that the masses of black holes below fall short of the standard linear relation between black-hole mass and its host bulge mass (Kormendy & Ho, 2013; Reines & Volonteri, 2015). All these indicate that black-hole growth is slow in the low-mass zone and it becomes rapid in the high-mass zone. This in turn indicates that AGN feedback is less relevant in low-mass galaxies while it may be involved in the quenching of star formation in high-mass galaxies. Since we are not aware of an obvious feature in black-hole physics that hints to the origin of such a characteristic mass in the evolution of black holes, one may suspect that this mass arises from the interplay between the black-hole and other physical processes in the host galaxy that control the gas supply to the black-hole. A better understanding of the origin of this interplay between galaxy and black-hole evolution is a primary issue in galaxy formation and our goal here.
Indeed, galaxy formation has a golden mass at the indicated scale, which is seen observationally and fairly understood theoretically (e.g. Dekel et al., 2019). The efficiency of galaxy formation within dark-matter (DM) haloes, as interpreted from the stellar-to-halo mass ratio () that is derived using abundance matching of observed galaxies and theoretical CDM haloes, shows a pronounced peak near the golden mass, with only little redshift dependence at least in the redshift range (Moster et al., 2010; Moster et al., 2013; Behroozi et al., 2013; Rodríguez-Puebla et al., 2017; Moster et al., 2018; Behroozi et al., 2019). The decline of galaxy-formation efficiency on both sides of the peak toward lower and higher masses indicate the operation of effective mechanisms that suppress star formation in the two zones, below and above the golden mass. These quenching mechanisms are assumed to be supernova feedback (and other stellar feedback) in the low-mass zone (e.g. Larson, 1976; Dekel & Silk, 1986), and virial shock heating of the CGM (e.g. Rees & Ostriker, 1977; Silk, 1977; Binney, 1977; Dekel & Birnboim, 2006) plus AGN feedback (e.g. Croton et al., 2006; Cattaneo & Teyssier, 2007; Dubois et al., 2011) in the high-mass zone.
The same golden mass is imprinted as a golden time in the observed cosmological evolution of star-formation-rate (SFR) density. It is rising from to a broad peak near and is steeply declining after till the present (Madau & Dickinson, 2014). The SFR-peak time at reflects the same golden mass scale that is indicated by the stellar-to-halo ratio (Dekel et al., 2019). This is because, as obtained from the Press-Schechter formalism and confirmed in cosmological simulations, the steeply rising typical halo mass that forms at a given time reaches a value comparable to the golden mass at . While the density of accretion rate into haloes is steeply declining with time at all epochs, reflecting the expansion of the Universe and the evolution of the halo population (Dekel et al., 2013), the rise in time of the SFR density prior to its peak at must be obtained by quenching of galaxy formation in the low-mass haloes that dominate at those high redshifts (Bouché et al., 2010). The drop in SFR density with time at low redshifts is steeper than the decline associated with the accretion rate due to quenching in the high-mass haloes that dominate at that epoch. Thus, the rise and fall of the SFR density with time is largely determined by the same quenching mechanisms that operate at low and high mass scales to generate the peak in . The peak epoch of SFR density can be interpreted as a manifestation of the golden mass scale for peak efficiency of galaxy formation.
The golden mass marks a general bimodality about in many galaxy properties including the characteristics of star formation, morphology, kinematics and composition (e.g. Dekel & Birnboim, 2006). Most relevant for the black-hole growth is a dramatic sequence of events that typically occurs in galaxies when they are near the golden mass, seen both in simulations (Zolotov et al., 2015; Tacchella et al., 2016b, a; Tomassetti et al., 2016) and observations (Barro et al., 2013; Van Dokkum et al., 2015; Barro et al., 2017a; Huertas-Company et al., 2018). Many galaxies undergo significant gaseous compaction events into compact star-forming “blue nuggets". The major compaction events that occur near the golden mass trigger inside-out quenching of star formation, which is maintained by the hot CGM and AGN feedback, leading to today’s early-type galaxies. The blue-nugget phase is responsible for dramatic transitions in the main galaxy structural, kinematic and compositional properties, such as a transition from dark-matter to baryon dominance in the galaxy central .
The picture addressed here is that supernova feedback and the hot CGM, which define the zones of low-mass and high-mass quenching of star formation, also define the zones of low-rate and high-rate of black-hole growth (Bower et al., 2017; Dekel et al., 2019). We propose that the same processes confine the major compaction events to the golden mass between these zones, and emphasize in particular that the compaction process is the actual trigger for a boost in the black-hole growth once it is in the zone where growth is possible. The rapidly growing black-hole, through AGN feedback, can then help the hot CGM maintain the quenching of star formation above the golden mass.
The outline of this paper is as follows. In §2 we summarize the roles of supernova feedback and hot CGM in determining the golden mass and the events of wet compaction to blue nuggets near this golden mass. In §3 we address the correlation between the compaction events and black-hole growth in the NewHorizon simulation, which is described in §A. In §4 we discuss the implications on the quenching of star formation. In §5 we summarize our conclusions.
2 The golden mass and compaction to blue nuggets
2.1 Supernova feedback and virial shock heating
An upper limit for a DM-halo virial velocity (which can be translated to halo mass), within which supernova feedback can be effective in heating or ejecting the gas and thus suppressing the SFR, can be estimated in a simple way using the standard theory for supernova bubbles (Larson, 1976; Dekel & Silk, 1986). The energy deposited in the ISM by supernovae that arise from a stellar mass is estimated to be with . The derivation involves the ratio of two timescales which turns out to be roughly constant, the duration of the adiabatic phase of the supernova bubble in which it can deposit energy in the ISM before it cools radiatively, and the dynamical timescale associated with star formation.
For the supernova energy to heat or eject most of the gas of mass that has accreted into the galaxy, it should be comparable to the binding energy of this gas in the DM-halo potential well, , with , where is the halo virial velocity and and are its virial mass radius. At the peak of star-formation efficiency, if a large fraction of the gas that has been accreted into the halo turned into stars with little ejection, one has . By comparing and , this yields a critical upper limit for the virial velocity of a halo in which supernova feedback is effective,
| (1) |
A similar estimate arises from the velocities of supernovae in star-forming clumps, with an assumed SFR efficiency of a few percent and a supernova energy efficiency of per cent (Dubois et al., 2015). Using the standard virial relation, corresponds to at , and it roughly scales as in the Einstein-deSitter regime (roughly valid at ). In haloes above this mass, the potential well is too deep for the supernova-driven winds to significantly heat the gas or escape. This mass scale roughly coincides with the observed peak of star-formation efficiency at .
Figure 1 shows the critical halo mass corresponding to as a function of redshift, rising from at to at . It coincides with the more steeply rising Press-Schechter mass that characterizes the typical mass for haloes at .
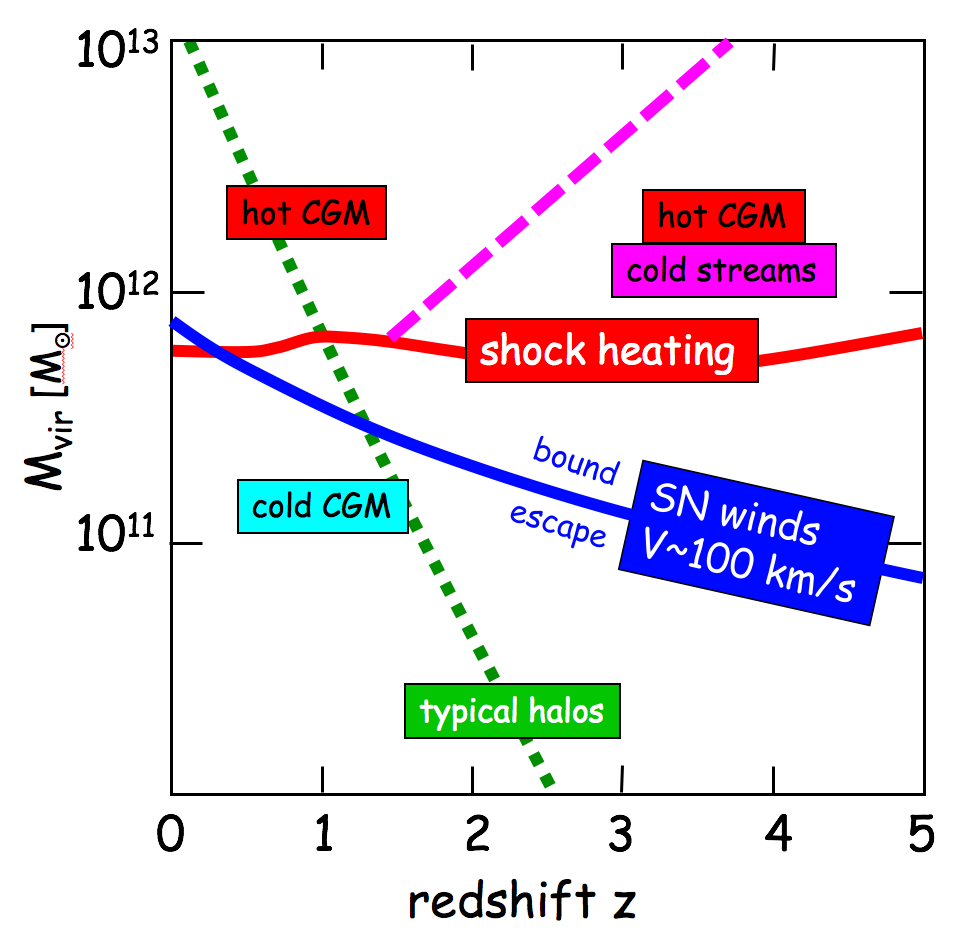
The other characteristic scale is the upper limit for the halo mass within which efficient cold inflow can supply gas for star formation (Rees & Ostriker, 1977; Silk, 1977; Binney, 1977). It is obtained by comparing the gas radiative cooling time to the relevant dynamical time for gas inflow. The key question addressed by Birnboim & Dekel (2003) and Dekel & Birnboim (2006) is whether the shock that forms at the halo virial radius, behind which the gas heats to the virial temperature, can be supported against gravitational collapse. For the post-shock gas to be able to sustain the pressure that supports the shock against gravity, its cooling time has to be longer than the dynamical time for gas compression behind the shock, which is comparable to the halo crossing time, . Since the cooling time is an increasing function of halo mass, the shock-stability analysis reveals a mass threshold for a hot CGM on the order of
| (2) |
Its value is roughly independent of redshift in the range , with an uncertainty of a factor of a few due to the uncertainty in metallicity and the location within the halo where the shock stability is evaluated. This analysis has been supported by idealized spherical simulations.
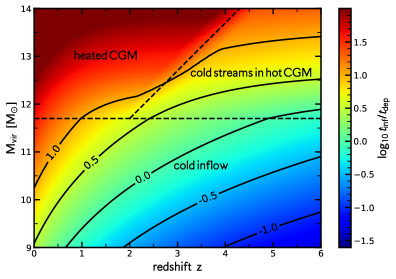
Figure 1 also shows the predicted critical halo mass for virial shock heating as a function of redshift, based on Dekel & Birnboim (2006, Fig. 7). Below the critical curve one expects the cosmological inflow to be all cold, at K, efficiently feeding the galaxy and allowing high SFR. Above the curve one expects the CGM to be shock heated to the virial temperature, thus suppressing the cold gas supply into the galaxy, and maintaining long-term quenching (Birnboim et al., 2007).
At , above the shock-heating curve and below the dashed curve, narrow cold streams are expected to penetrate through the otherwise hot CGM and supply gas for efficient star formation even in haloes above the critical mass (Dekel & Birnboim, 2006). These predictions, based on an analytic study of virial shock stability, have been confirmed in cosmological simulations (Kereš et al., 2005; Ocvirk et al., 2008; Dekel et al., 2009; Nelson et al., 2013, 2016).
The predictions for an upper-limit mass for cold gas supply, as summarized in Fig. 1, including the cold streams in a hot CGM at high redshifts, are consistent with observations. For example, the observed transition from star-forming galaxies to passive galaxies in the plane of halo mass versus redshift, based on abundance matching of galaxies to DM haloes in a CDM cosmology (e.g. Behroozi et al., 2019, Figure 13). The possible involvement of AGN feedback in the quenching of massive galaxies will be discussed in §4.
2.2 Wet Compaction to a Blue Nugget
We have learned from cosmological simulations that most galaxies undergo a substantial wet-compaction event, which typically occurs in a pronounced way when the galaxy mass grows above a threshold at a golden value, and , This occurs especially at when the gas fraction tends to be high. The pioneering exploration of this sequence of events has been performed using the VELA cosmological simulations (Zolotov et al., 2015; Tacchella et al., 2016a; Tomassetti et al., 2016; Dekel et al., 2019, 2020b). The wet-compaction process is a significant gaseous shrinkage into a compact star-forming system within the central - a blue nugget. The resultant gas consumption into new stars and the associated gas removal by stellar and supernova feedback cause gas depletion from the center which results in an inside-out quenching of star-formation rate (SFR) (Tacchella et al., 2016b).
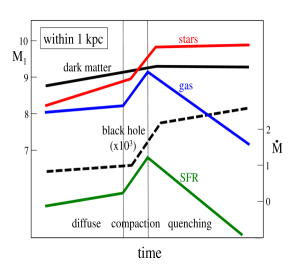
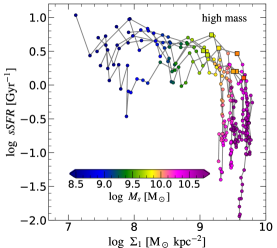
The left panel of Fig. 2 illustrates the main characteristics of this succession of events via the time evolution of gas mass, stellar mass and SFR within the inner kiloparsec, as seen in the simulations. More directly comparable to observations, The right panel of Fig. 2 presents simulated evolution tracks of eight VELA galaxies in the plane of two observable quantities, the specific SFR (sSFR) and , the measure of compactness via the stellar surface density inside . The L-shape evolution track consists of a compaction at a roughly constant sSFR and a subsequent quenching at a constant , with the “shoulder" at the blue-nugget peak of compaction. This universal L-shape evolution track has been confirmed observationally (e.g. Barro et al., 2017a, Fig. 7). The choice of using a fixed as the characteristic radius of the nuggets for all galaxies is motivated by the empirical finding, both in the simulations and the observations, that it provides a robust universal behavior with tighter relations, e.g., in the evolution tracks of Fig. 2. One obtains qualitatively similar results when using instead the effective radius, that is typically on a comparable scale of for galaxies in the range of masses and redshifts concerned, but with a somewhat larger scatter.
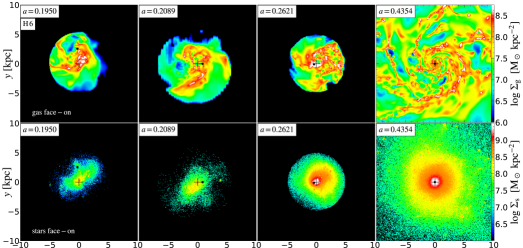
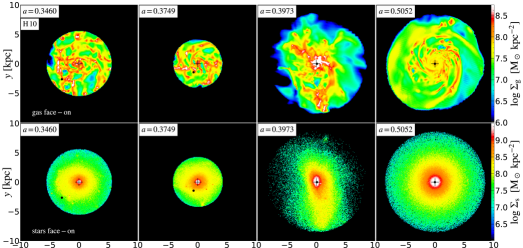
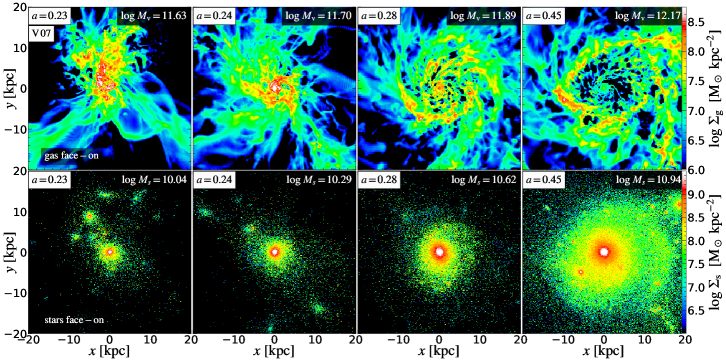
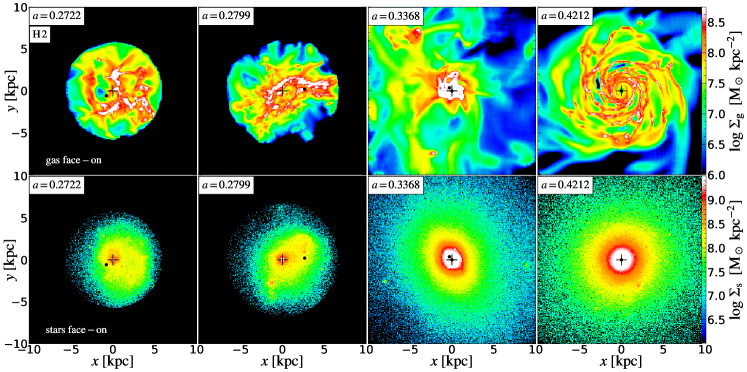
Figure 3 illustrates through images of gas and stellar surface density the evolution through the compaction, blue-nugget and post-blue-nugget phases in an example galaxy from the NewHorizon simulation. Similar sequences of images are shown in §C for two other NewHorizon galaxies, and for an example galaxy from the VELA simulations. They show a similar robust evolution pattern through the compaction event, despite the different numerical codes and the different sub-grid physical recipes adopted in the two suits of simulations, including the presence and absence of AGN feedback.
From the observational perspective, the exploration of blue nuggets started with the discovery of abundant, compact, massive, passive galaxies at , typically encompassing of stars within , termed “red nuggets" (Van Dokkum et al., 2008; Damjanov et al., 2009; Newman et al., 2010; Van Dokkum et al., 2010; Damjanov et al., 2011; Whitaker et al., 2012; Bruce et al., 2012; Van Dokkum et al., 2014, 2015). Their effective radii are about one percent of their halo virial radii, smaller than expected had the gas started in the halo with a common spin parameter and conserved angular momentum (AM) during its contraction (Fall & Efstathiou, 1980). This indicated dissipative contraction accompanied with AM loss, termed a wet compaction (Dekel & Burkert, 2014), implied the existence of gaseous blue nuggets as the direct progenitors of the red nuggets. Indeed, the predicted blue nuggets have been observed soon thereafter, showing properties in agreement with being the red-nugget progenitors (Barro et al., 2013, 2014a; Barro et al., 2014b; Williams et al., 2014; Barro et al., 2015; Van Dokkum et al., 2015; Williams et al., 2015; Barro et al., 2016b, a, 2017b, 2017a). A deep-learning analysis, trained on mock dusty images of the blue nuggets from the simulations, identified with high confidence blue nuggets of similar properties in the multi-color CANDELS-HST imaging survey of galaxies at (Huertas-Company et al., 2018).
The loss of AM that leads to compaction is indicated in the simulations to be triggered by gas-rich mergers ( per cent), by colliding counter-rotating streams, by recycling fountains or by other processes, and to be possibly associated with violent disc instability (Dekel & Burkert, 2014). These processes preferentially occur at high redshifts, where the overall accretion is at a higher rate and richer in gas, leading to deeper compactions into smaller radii with higher densities.
The main compaction events induce major transitions in the galaxy structural, compositional and kinematic properties (e.g. Zolotov et al., 2015; Tacchella et al., 2016b, a). The compaction generates inside-out quenching of star formation. This is accompanied by a transition from an irregular and diffuse configuration to a compact body, to be surrounded by an extended gas-rich ring (Dekel et al., 2020b) and possibly embedded in a stellar envelope. Kinematically, the system evolves from being pressure supported to rotation supported. As a result of the compaction, the central region turns from being dominated by dark-matter to being dominated by baryons. This induces a global-shape transition of the stellar system from prolate to oblate (Ceverino et al., 2015; Tomassetti et al., 2016), in agreement with observations (Van der Wel et al., 2014; Zhang et al., 2019).
For our current purpose, it is important to realize that the blue nuggets tend to form near a characteristic mass. Minor compaction events are seen in the simulations to occur at all masses during the history of a star-forming galaxy (SFG). Repeated episodes of minor compactions followed by quenching attempts can explain the confinement of SFGs to a narrow Main Sequence (Tacchella et al., 2016a). On the other hand, the major compaction events, the ones that involve an order-of-magnitude increase in central density, cause a transition from dark-matter to baryon dominance and trigger deep quenching, occur near the golden mass of , as can be seen in Tomassetti et al. (2016, Fig. 8) and Zolotov et al. (2015, Fig. 21). A deep-learning study of VELA simulated galaxies against observed CANDELS galaxies (Huertas-Company et al., 2018), indeed confirmed a favored stellar mass for the observed blue nuggets near . The presence of a preferred mass for blue nuggets makes the compaction-induced transitions of galaxy properties appear as pronounced systematic variations with mass near the golden mass.
Our understanding is that the major compaction events tend to be confined to near the golden mass primarily because supernova feedback, which suppresses the compactions at lower masses, becomes ineffective near and above the golden mass (Dekel et al., 2019). Supernova feedback at the central regions, which is boosted following the starburst soon after the early phases of the compaction process, removes central gas and suppresses further compaction in galaxies below the critical mass for efficient supernova feedback. Supporting evidence for the effect of supernova feedback on the depth of the compaction events is provided by simulations with stronger feedback, which show compaction events that are less dramatic (e.g., the NIHAO and VELA6 simulations, in preparation). Near and above the golden mass, where the potential well is deep enough, with an escape velocity above the supernova-driven wind velocity (§2.1), and when it becomes even deeper due to the compaction itself, the compaction is not significantly affected by supernova feedback and the contraction can proceed to higher central densities.
The characteristic mass for compaction events, being in the ball park of the golden mass of galaxy formation and the indicated mass threshold for rapid black-hole growth, may indicate that the compaction events have a major role in the transition from slow to rapid black-hole growth, to be explored next.
3 Compaction and Black-Hole Growth
We will demonstrate here, using simulations, that the evolution of galaxies from the supernova zone below the golden mass, through a compaction event near the golden mass, into the hot-CGM phase above the golden mass, determines the black-hole growth rate and imprints the golden mass of galaxies in it. One expects that below the golden mass, namely pre-compaction, the supernova-driven gas heating and ejection from the center suppresses the black-hole growth. Then, the major compaction that tends to occur near the golden mass, where supernova feedback is already inefficient, brings gas into the inner sub-kiloparsec blue nugget. This may lock the black-hole into the galaxy center and induce efficient accretion onto the sub-parsec black-hole, which can trigger a rapid black-hole growth and the activation of an AGN. In more massive haloes, the deep potential well and the hot CGM are expected to lock the central gas in, and allow continuing accretion onto the black-hole.
The suppression of black-hole growth by supernova feedback below the golden mass and the rapid black-hole growth above it have been seen in several different cosmological simulations, using different codes and sub-grid models and especially different implementations of supernova feedback and black-hole growth. This was first seen in a RAMSES simulation by Dubois et al. (2015). By comparing the same simulations with and without supernova feedback, they clearly demonstrated that the suppression of black-hole growth below the golden mass is primarily due to supernova feedback. Similar results were seen in RAMSES simulations by Habouzit et al. (2017), in EAGLE simulations (Bower et al., 2017), in FIRE simulations (Anglés-Alcázar et al., 2017) and in Illustris TNG (Habouzit et al., 2019). (also Prieto et al., 2017; McAlpine et al., 2018; Trebitsch et al., 2018; Trebitsch et al., 2020) In particular, Bower et al. (2017) discuss physical arguments for the suppression of black-hole growth below the golden mass and its inefficiency above the golden mass in terms of the buoyancy of supernova bubbles into a colder CGM versus a hotter CGM in the two zones respectively.
3.1 Following Black Holes and Blue Nuggets in NewHorizon
Our current analysis is based on the NewHorizon cosmological simulation (Dubois et al., 2020)111https://new.horizon-simulation.org/science.html, also used in Park et al. (2019a, b). This is a RAMSES AMR simulation (Teyssier, 2002), zooming in with a high maximum spatial resolution of () on a spherical volume of comoving radius , smoothly embedded in the larger box of the Horizon-AGN simulation (Dubois et al., 2014b; Dubois et al., 2016). By , this volume, encompassing a loose group of galaxies, has eight galaxies that have grown above the golden mass of by that time, which we use in our current analysis. The assumed CDM cosmological parameters resemble the WMAP-7 results (Komatsu et al., 2011), namely, flat curvature, , , , , , and .
The sub-grid physics incorporates both supernova feedback and black holes with AGN feedback, as described in §A based on Dubois et al. (2020) and the NewHorizon website. We bring here a a brief summary of relevant features. The mechanical supernova feedback models successively the phases of energy and momentum conservation (Kimm & Cen, 2014; Kimm et al., 2015), and considers the effect of clustered supernovae (Kim et al., 2017; Gentry et al., 2017, 2019), as well as the momentum due to pre-heating near OB stars (Geen et al., 2015). Massive black holes are implemented as sink particles with a seed mass of and zero spin, which form in cells where both gas and stellar density exceed the density threshold for star formation, and away from neighboring black holes. The black-hole is growing by the Bondi-Hoyle gas accretion rate (Bondi & Hoyle, 1944), modulated by a spin-dependent radiative efficiency that is computed on-the-fly, and limited by the Eddington limit. The required averaged gas properties in the vicinity of the black-hole are measured within a radius of (Dubois et al., 2012), in which the maximum resolution of is kept at all times. AGN feedback is modeled in two modes with different efficiencies in the regimes of high and low accretion rate, determined by the ratio of accretion-to-Eddington rate. In the "radio mode", at low accretion rates, the AGN feedback is in the form of bipolar jets aligned with the black-hole spin. In the "quasar mode", at high accretion rates, the AGN is assumed to deposit thermal energy within a sphere of radius comparable to one cell, with an efficiency that is coupled to the spin-dependent radiative efficiency (Dubois et al., 2012). The black-hole spin is followed on-the-fly due to gas accretion and black-hole mergers, which occur when the pair separation is and the relative velocity is lower than the escape velocity of the binary.
3.2 Supernova suppression and compaction-driven growth
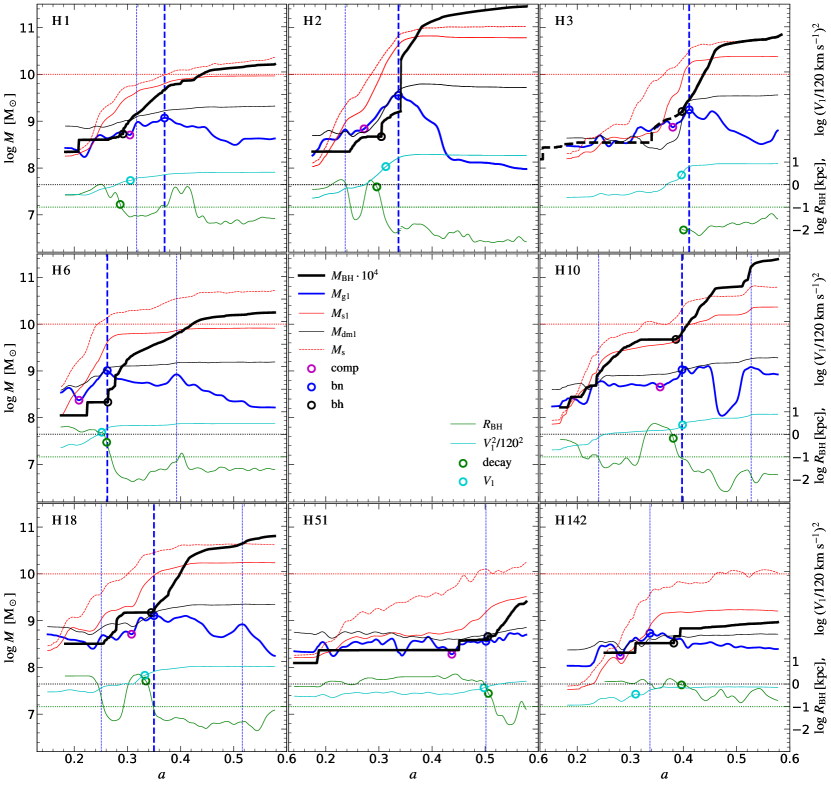
Figure 4 shows the evolution of black-hole mass (black curve, multiplied by ) as a function of expansion factor in the eight NewHorizon simulated galaxies that have grown to above . Shown in comparison are the masses of gas, stars and dark matter within the inner , as well as the total stellar mass. The gas inside (blue) provides the clearest indication for a wet-compaction event, where the gas density rises from the onset of compaction to a blue-nugget peak, followed by gas depletion into star formation and partly into weak supernova-driven outflows that may still persist near the golden mass. This is similar to the generic evolution pattern derived from the VELA simulations shown in the cartoon, Fig. 2, and for several simulated galaxies in Zolotov et al. (2015, Fig. 2). The onset of compaction and the blue-nugget peak, as crudely identified by eye, are marked. The compaction typically lasts for one third of the cosmological time during the event (as in the EdS cosmological regime, valid at , , and ). During the compaction, the central gas density increases by a factor . The history of SFR within the inner (not shown) follows closely the history of the central gas density in accord with the Kennicutt-Schmidt relation (Kennicutt, 1998; Zolotov et al., 2015; Dubois et al., 2020). During the major compaction event, the associated stellar mass within (red) rises from the onset of compaction until the blue-nugget peak and it flattens off to a constant value soon thereafter, a typical increase by a factor of ten. This shoulder in the central stellar-mass curve distinguishes the major compaction to the blue-nugget SFR peak from other possible peaks that mark additional minor compaction events (Tacchella et al., 2016a). The total stellar mass (dashed red) at the blue-nugget peak is typically , reflecting the golden stellar mass scale, as seen in the VELA simulations and discussed in §2.2.
In all cases, we see a suppressed black-hole growth in the pre-compaction, low-mass, supernova regime, followed by a rapid growth post-compaction, into the high-mass, hot-CGM regime, consistent with earlier simulations. The impression is that the rapid black-hole growth starts soon after the onset of compaction, and it continues throughout the compaction process and later on into the hot-CGM regime. Galaxies H2, H6 and H18 provide the clearest cases, where both the compaction and the onset of black-hole growth are pretty well defined. In H1 there is an earlier minor compaction (near ), which is not easily separated from the major compaction, making the identification of the onset of the major compaction uncertain. In H3, the black-hole mass prior to is marked dashed because the black-hole used to reside in another massive galaxy that merged with H3 near that time (where compaction occurred and the black-hole started to grow near ). Missing the full information about the other galaxy (for a technical reason), the association of galaxy properties and black-hole growth in H3 prior to is uncertain. In H10, we identify minor compactions both before and after the major compaction, near and . In the lower-mass galaxy H51, in which the onset of rapid black-hole growth occurs later, shows only a marginal gas compaction event near that time, which is distinguished mostly by the growth of central stellar density that has not reached the plateau by . Finally, in H142, the compaction is relatively well defined, though it is rather weak.
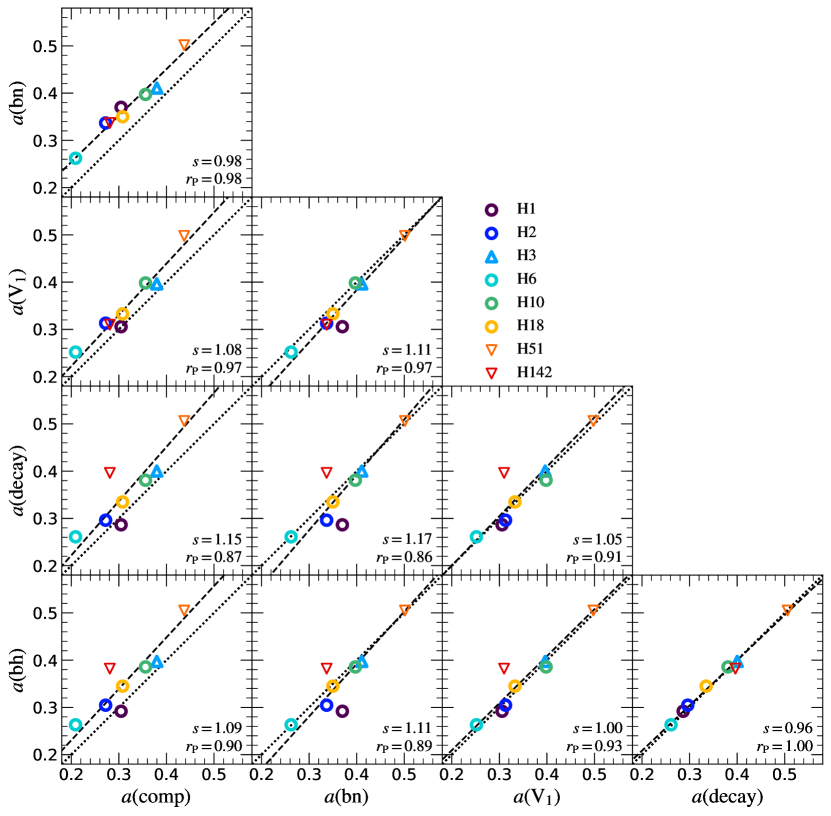
The correlation between the onset of black-hole growth, at , and the compaction event, via its onset and blue-nugget peak at and , respectively, is shown in the two left panels of the bottom row in Fig. 5. The onset of rapid black-hole growth is defined as the upturn to a continuous long-term steep growth of black-hole mass. If a black-hole merger occurs just prior to this upturn, the onset of black-hole growth is identified with the black-hole merger event. We see that the onset of black-hole growth tends to occur slightly after the onset of compaction and slightly before the blue-nugget phase. A symmetric linear regression yields a fairly tight correlation, with a Pearson correlation coefficient of , and a slope of , not far from unity. This is a fairly convincing correlation, given the large uncertainties in the visual identifications of the events.
The impression from the evolution of central gas mass in Fig. 4 is that the major compaction events in NewHorizon are qualitatively similar to the ones in VELA, despite the presence of AGN feedback only in the former. This indicates that AGN feedback does not have a major role in driving the compaction process. Furthermore, one can see in Fig. 4 and Fig. 5 that the onset of rapid black-hole growth and its sinkage to the center (see below) tend to occur slightly after the onset of compaction, consistent with a causal relation where the compaction triggers the rapid black-hole growth, which activates strong AGN feedback.
3.3 Black-hole wandering and lockdown
3.3.1 In the simulations
A clue for how the compaction actually triggers the black-hole growth is provided by tracing the position of the black-hole with respect to the galaxy center, shown as the green curve in Fig. 4. One can see that during the pre-compaction phase the black-hole tends to orbit at one to a few kiloparsecs off the center (which is by itself not always accurately defined in this irregular phase), where the orbital velocity and the supernova-driven dilute-gas environment naturally suppress accretion onto the black-hole. This off-center wandering is also seen in the images shown in Fig. 3 and in §C. Similar wandering of the black holes off the centers has been seen in simulations of low-mass galaxies (Bellovary et al., 2019; Pfister et al., 2019). As seen in Fig. 4 and in Fig. 3, during and soon after the compaction, the black-hole sinks to inside the vicinity of the galaxy center, corresponding to a couple of cell sizes, and stays there. This can be interpreted as being due to the compaction-driven deepening of the potential well, shown in Fig. 4 as the cyan curve marking , with the circular velocity at , as well as the drag against the compaction-driven dense baryons and dark matter. Being locked to the gas-rich galaxy center, with only little gas removal by supernova feedback above the golden mass, the black-hole is now subject to efficient accretion.
Figure 5 also shows the correlations between the events discussed in §3.2 (namely, the onset of black-hole growth, the onset of compaction, and the blue-nugget phase) and the events associated with the sinkage of the black-hole to the center, namely, the time when is half way up from its pre-compaction value to its post-compaction value, and the time of decay when the radius of the black-hole orbit is half way down its pre-compaction value. These events are also marked on the evolution tracks of each galaxy in Fig. 4. We note that the value of at the transition is in the ball park of , marking the critical potential-well depth for effective supernova feedback. We see good correlations with negligible offsets of with and .
3.3.2 Analytic estimates
Why is the black-hole wandering off center when the galaxy is below the golden mass? We recall that since in this regime, supernova feedback can remove the gas from the inner , which suppresses the black-hole growth. The shallow potential well, in a low-mass halo and with dark matter but only little baryons at the center, allows the black-hole to wander. The black-hole may be pushed away from the center partly because in this mass range the mergers are more frequent than an orbital time, (Dekel et al., 2020a). The mergers may increase the orbital angular momentum of the black-hole, and can generate clumps off which the black-hole can scatter (see Pfister et al., 2019). Furthermore, the mergers can trigger bursts of star formation which, through supernovae, could drive turbulence in the remaining central gas and push it to larger radii. As we show next, the dynamical friction (DF) that is exerted on the black-hole by the dark matter and gas, which in principle could decrease the orbital AM of the black-hole and pull it to the center, is weak at this stage.
For a black-hole in a circular orbit at radius with velocity , the timescale for losing all its AM by DF deceleration can be estimated by the Chandrasekhar approximation (Chandrasekhar, 1943),
| (3) |
where is the background density of particles with velocities smaller than and is the Coulomb parameter that under certain assumptions could be crudely approximated by such that . With the orbital time (which is for inside ), and with , we obtain
| (4) |
where the mass ratio is in units of . Pre-compaction, when the black-hole growth is suppressed, one can see in Fig. 4 that at the mass ratio is significantly larger than , implying that the DF is ineffective for a few hundred orbital times, which is in the ball park of a Hubble time.
What is the effect of the compaction-driven deepening of the potential well? As can be seen in Fig. 4, the compaction near the golden mass makes the mass within grow by a factor , causing a contraction of the black-hole orbit. This occurs over a period , which corresponds at to namely . Thus, the potential at changes on a timescale much longer than the orbital time of a few Myr, making the black-hole orbit contract adiabatically by a factor (Flores et al., 1993)222A contraction by a factor of two is obtained in the other limit when the compaction is instantaneous (Freundlich et al., 2020).
Once above the golden mass, the time between mergers becomes longer than the orbital time, so the pushing out of the black-hole becomes weaker and it can continue to sink to the center. With in this regime, there is no significant gas removal by supernova feedback, and the slowly moving black-hole is free to accrete from the compaction-driven enhanced gas density and grow in mass.
The black-hole growth and its sinkage to the center post-compaction is a runaway process, because, according to eq. (3), is rapidly decreasing as is growing and as the black-hole moves inwards where is smaller and is larger. With in eq. (4), we have , which corresponds to a shrinkage of the black-hole to the center over , consistent with the steep shrinkage seen in Fig. 4. The specific Bondi-Hoyle accretion onto the black-hole is similarly growing in proportion to the black-hole mass and the background density, , where is the root-mean-square of the velocity dispersion and the sound speed in the accreting region about the black-hole.
We conclude that the compaction locks the black-hole to the galaxy center due to the combination of adiabatic contraction by the deepening of the potential well and the dynamical friction that is boosted by the increase in density and black-hole mass. Indeed, we see in Fig. 5 that the onset of black-hole growth is correlated with the sinkage of the black-hole to the center, which is correlated with the deepening of the central potential well.
We do not know to what extent the black-hole growth would have been suppressed in the supernova regime had the black-hole been artificially locked to the galaxy center. We note that the raw curves for gas mass within , before they were smoothed as in Fig. 4, show significant fluctuations between output timesteps (Fig. 11). This could be interpreted as episodic removal of gas by supernovae, which may indicate that the black-hole growth would have been suppressed even if locked to the center, possibly implying that the wandering of the black hole off center is only one reason for the suppression of growth.
3.4 Scaling relations of black holes and galaxies
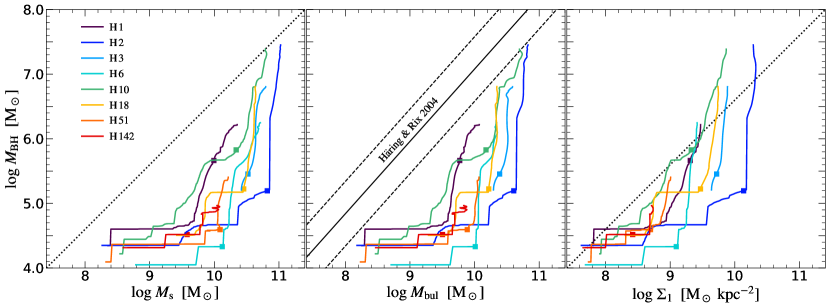
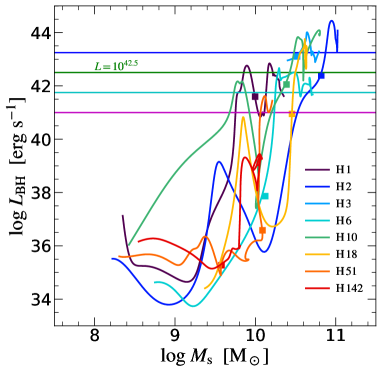
Figure 6 puts together the eight simulated galaxies, showing the evolution tracks of black-hole mass versus total stellar mass , bulge mass, and the stellar surface density within the inner , the latter serving as our most effective measure of compactness. A characteristic L-shape evolution is seen, displaying a suppression of black-hole growth below the golden mass of and a rapid black-hole growth once above the golden mass. The blue-nugget phase for each galaxy, marked by a square symbol, typically coincides with the turn-up of the curve, consistent with a causal connection between the two. A similar turn-up is found to occur at a characteristic threshold of central surface density at , consistent with the black-hole growth being driven by the compaction event. Similar tracks are seen when is plotted against the bulge mass, predicting that black holes of should tend to lie below the standard linear relation between black-hole mass and bulge mass that is observed to be valid for black holes more massive than (e.g. Magorrian et al., 1998; Häring & Rix, 2004; Kormendy & Ho, 2013; Ho & Kim, 2014).
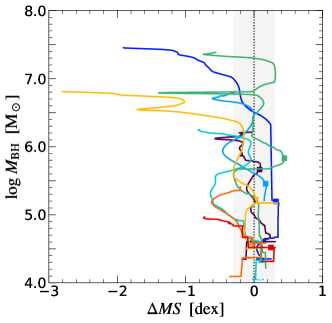
Figure 7 shows for the same eight galaxies the black-hole mass versus the deviation MS of the log SFR from the ridge of the Main Sequence of star-forming galaxies, as it varies with time. We use for the ridge sSFR (Dekel et al., 2013), which is indeed a good fit to the NewHorizon SFGs. This figure may allow an exploration of the relationship between the black-hole growth and the evolution of the galaxies along the MS and the eventual beginning of the quenching process through the Green Valley at negative MS values. During the pre-compaction and the compaction phase we find confined oscillations about the Main-Sequence ridge (Tacchella et al., 2016a), with the blue-nugget peak typically above the ridge. Rapid black-hole growth occurs while the galaxy is still on the Main sequence. Three galaxies in the sample (H2, H10, H18) eventually drop well below the Main Sequence, when the black-hole mass is above (with H10 experiencing a rejuvenation episode by a late compaction event). This may allow testing of the hypothesis put forward by Chen et al. (2020) that much of the black-hole growth occurs in the Green Valley. Some growth occurs at negative values of MS, toward the upper Green Valley, but the onset of rapid black-hole growth seems to precede the entry to the Green Valley.
3.5 AGN fraction
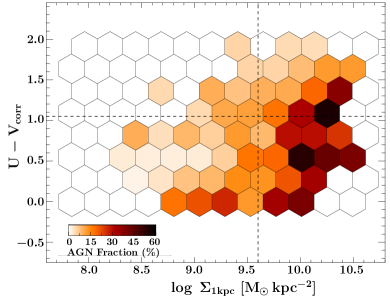
Figure 8, following Kocevski et al. (2017), shows the fraction of CANDELS-survey galaxies that host X-ray detected AGN in the plane of SFR, represented by U-V color, versus compactness, as measured by the stellar surface brightness within , [compared to in Kocevski et al. (2017)]. This plane is similar to the plane shown in Fig. 2 where the L-shape evolution tracks are detected in the simulations, except that here the SFR is growing downwards. One can indeed see a high AGN fraction in the quadrant of high SFR and high compactness representing the blue nugget phase of evolution, in accordance with what we see in the simulations. Similar evidence comes from obscured AGN that tend to reside in compact star-forming galaxies (Chang et al., 2017).
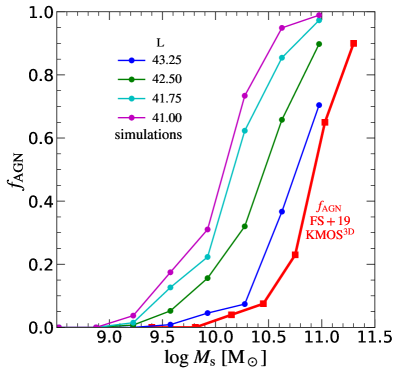
We next attempt to reproduce the fraction of galaxies that host AGN as a function of their stellar mass, in order to compare to observations such as Förster Schreiber et al. (2019, Figs. 6,13). The left panel of Fig. 9 shows the AGN luminosity as a function of stellar mass for the eight massive NewHorizon galaxies shown in the previous figures. The luminosity is derived from the gas accretion rate onto the black-hole, averaged over fine timesteps (median of ), excluding black-hole growth by mergers. The growth rate is derived in the simulations from the Bondi-Hoyle accretion rate (Bondi & Hoyle, 1944) by , where is the radiative efficiency of the black-hole based on its spin as calculated on-the-fly in the simulations. The luminosity is then given by
| (5) |
The radiative efficiency tends to grow with mass, where on average . Using this average as a constant value in eq. (5) does not make a qualitative difference to the results. For the sake of clarity, the luminosity curves in the left panel of Fig. 9 were smoothed over .
The resultant AGN fraction is shown in the right panel of Fig. 9, for each of four different luminosity thresholds in the selection. These are compared to the red curve which represents the fraction observed by Förster Schreiber et al. (2019), who report to have used an effective luminosity threshold of . The predicted curves all resemble in their L shape the observed curve, with the turn-up mass or the AGN fraction shifted as a function of the chosen luminosity threshold. When assuming in the simulations the same threshold as estimated for the observed sample (green), the turn-up mass is apparently underestimated by about half a decade, while a better fit is provided by the simulations with a brighter threshold of (blue). This offset may reflect an uncertainty in the effective luminosity threshold applied in the observations or in the assumed correspondence of luminosity to accretion-rate in the simulations. It may also be a result of a real underestimate of the golden mass in the simulations or an overestimate of the simulated accretion rate. In regard with possibly underestimating the golden mass, one should note that while the existence of a golden mass is robust, rooted in the physical phenomena discussed above, the exact value of the golden mass in the simulations may be subject to the way the sub-grid physics of supernova feedback and black-hole growth are implemented.
Förster Schreiber et al. (2019) also provide (their figure 9) an indication for an anti-correlation between the AGN fraction and the stellar effective radius for galaxies of , consistent with the predicted compaction-driven AGN activity at and above the golden mass. Their figure 3 indicates a correlation of AGN fraction with MS, the deviation from the ridge of the Main Sequence (MS) of star-forming galaxies at a given stellar mass, consistent with the proposed onset of AGN activity at the blue-nugget phase, where the galaxy is above the MS ridge (Tacchella et al., 2016a), similar to what is seen observationally in Fig. 8.
4 Quenching Trigger & Maintenance
The gained understanding of how black-hole growth is triggered by a compaction event has implications on the SFR quenching of massive galaxies and in particular the possible role of AGN feedback in triggering the quenching and in maintaining it for long term.
In order to understand the evolution within the central of a galaxy, and in particular the quenching process at and above the golden mass, it is helpful to appeal to the key parameter , the ratio of timescales for gas inflow into this region and gas depletion from it, by consumption to star formation and by outflows (Tacchella et al., 2016a). Wet compaction is possible if , such that significant dissipative compaction can occur before the gas turns to stars or be ejected by feedback (Dekel & Burkert, 2014). This is also the condition for halting an ongoing depletion-quenching event and rejuvenating a new compaction event by newly accreted gas. On the other hand, the condition for quenching is , ensuring that significant depletion occurs before the gas may be replenished by accretion.
In the cold-flow regime below the critical mass for virial shock heating, the specific inflow rate into the galaxy roughly follows that of the cosmological total specific accretion rate into the halo. In the Einstein-deSitter cosmological regime (roughly valid at ), this is derived analytically and confirmed by simulations (Dekel et al., 2013) to be
| (6) |
where is the halo mass in . It implies that below the golden mass is a strong function of redshift and a weak function of mass. The inflow time becomes much longer once the halo is above the golden mass, where the heated CGM suppresses the cold gas supply, and especially at , when the penetration of cold streams through the hot CGM is suppressed (Fig. 1 Dekel & Birnboim, 2006; Cattaneo et al., 2006).
The average depletion time near the ridge of the Main Sequence of SFGs, as estimated from the VELA cosmological simulations in which AGN feedback is not incorporated (Tacchella et al., 2016a), is
| (7) |
namely a rather weak dependence on both mass and redshift. This turns out to be a good approximation to the observational estimates at (Tacconi et al., 2018). We thus have for masses below the golden mass
| (8) |
For example, for galaxies of , we have at . At higher redshifts, it is more likely to have , namely a necessary condition for wet compaction once there is a trigger, followed by a burst of star formation. At lower redshifts, where is more common, there is an efficient post-compaction central gas depletion with no efficient replenishment by fresh cold gas, allowing deeper long-term quenching, especially when the CGM is hot above the golden mass.
Figure 10 shows the expected quenching efficiency, the ratio , as a function of halo mass and redshift, based on eq. (8) (see also Tacchella et al., 2016a). There is an encouraging qualitative resemblance between this and Figure 13 of Behroozi et al. (2019), which shows in the same plane the distributions of SFR and of the fraction of star-forming galaxies as estimated from observations via abundance matching with CDM haloes. We learn that our qualitative argument, which does not yet include the possible effect of AGN feedback, does recover the quenching efficiency deduced from observations. This is alongside with the success of the L-shape evolution track seen in Fig. 2, also based on simulations with no AGN, in recovering the observed behavior for the onset of quenching (Barro et al., 2017a).
Our picture of quenching is that, overall, the quenching mechanism is primarily a function of mass. In haloes of masses below the golden mass there is quenching by stellar and supernova feedback. Especially at high redshifts, cold gas supply may cause a new compaction event and a new burst of star formation, with boosted supernova feedback that triggers a new quenching attempt. The associated oscillations of about unity cause oscillations about the Main Sequence of SFGs, which can explain the confinement of SFGs to a narrow Main Sequence (Tacchella et al., 2016a). Near the golden mass, a major compaction event triggers a central burst of star formation, which leads to the onset of deeper quenching by gas consumption and supernova feedback that is not followed by efficient replenishment, as becomes larger than unity. The triggered quenching is maintained in haloes above the critical mass, at least partly and for a while, because the shock-heated CGM suppresses gas supply to the central galaxy. This is especially efficient at low redshifts (), where cold streams do not bring gas in above the critical mass (Dekel & Birnboim, 2006; Birnboim et al., 2007). On the other hand, the hot gas in the inner halo can cool and “rain" into the galaxy, thus maintaining a non-negligible level of star formation. This is why the quenching in hydro-cosmological simulations with no AGN feedback is incomplete in many cases, as can be seen in Fig. 2 (Zolotov et al., 2015; Tacchella et al., 2016a).
However, we have learned in the current paper that the major compaction event near and above the golden mass, in the hot-CGM regime, generates a rapid growth of the central black-hole. Based on Fig. 4 and Fig. 5, the onset of rapid black-hole growth indeed tends to occur slightly after the onset of compaction. The black-hole growth activates an energetic AGN that can help keeping the CGM hot and thus maintain the quenching of star formation for a long time (preliminary analysis e.g. in Croton et al., 2006; Bower et al., 2006; Cattaneo & Teyssier, 2007; Cattaneo et al., 2009; Dubois et al., 2010, 2016). This can be tested by correlating the CGM temperature with the AGN activity, which is beyond the scope of this paper. This is consistent with the quenching by AGN after the end of the rapid black-hole growth shown in Fig. 6 of Dubois et al. (2015). According to this scenario, AGN feedback is not the trigger of quenching. It can rather serve as the major source for long-term maintenance of quenching in sufficiently massive hot haloes above the golden mass, after the AGN has been triggered by a major wet-compaction event, the same event that triggered the onset of quenching.
5 Conclusions
There is a rather robust observed threshold for luminous AGN at a characteristic mass corresponding to dark-matter haloes of . Not being aware of any obvious hint in black-hole physics for a characteristic mass of this sort, we investigated how it could be imprinted on the central black-hole by the processes associated with galaxy evolution. Indeed, observations reveal a golden mass scale for efficient star formation in galaxies within dark-matter haloes at a comparable mass, which also translates to the golden time for star formation at , when the mass of typical forming haloes is comparable to the golden mass.
Two physical processes naturally confine the golden mass. On the low-mass side, energy considerations imply that supernova feedback is effective in suppressing star formation in haloes below the golden mass (Dekel & Silk, 1986). On the high-mass side, an analysis of virial shock stability reveals that the halo CGM is heated to the virial temperature in haloes above the golden mass (Dekel & Birnboim, 2006). The resemblance of the critical masses associated with these two different processes (Fig. 1) confines efficient galaxy formation to a peak about the golden mass. One may wonder whether this similarity between the two critical masses is a coincidence or a built in match. On one hand, the analyses in the two cases are related in the sense that the preferred scale arises from comparing a radiative cooling time to the relevant dynamical time. On the other hand, these timescales refer to different environments on different scales. The conditions for cooling (e.g., gas density and metallicity) and the relevant dynamical times (in star-forming clouds versus inflow into the halo) are very different in the two cases.
We pointed out and demonstrated here that the connection of the golden mass to the black-hole growth becomes more concrete once we consider the wet-compaction events that typically occur in the history of galaxies near the golden mass, as shown by simulations (here and in Zolotov et al., 2015; Tomassetti et al., 2016) and as seen in observations (e.g. Barro et al., 2013, 2017a; Huertas-Company et al., 2018). These events induce major transitions in galaxy properties, where in particular they trigger the quenching of star formation by central gas depletion into star formation and outflows. The compaction processes are due to drastic angular-momentum losses, about half caused by mergers and the rest by counter-rotating streams, recycling fountains and other mechanisms. The major deep compaction events to blue nuggets, those that trigger a decisive long-term quenching process and a transition from central dark-matter to baryon dominance, tend to occur near and above the golden mass, at all redshifts. We argue that this preferred mass scale for major compactions is due to the same two physical processes of supernova feedback and hot CGM, which suppress compaction attempts at lower masses and partly at significantly higher masses (Tacchella et al., 2016a).
We demonstrated using the NewHorizon simulation (Dubois et al., 2020) that the compaction events naturally connect the characteristic mass for rapid black-hole growth and AGN activation to the golden mass of galaxy formation. The two zones, of supernova feedback and hot CGM, provide the necessary conditions for black-hole suppression and rapid growth, respectively (Dekel & Silk, 1986; Dubois et al., 2015; Bower et al., 2017). Black-hole growth is suppressed by supernova-driven gas removal in star-forming galaxies of mass below the golden mass, while they can grow above the golden mass as the gas is confined to the center by the halo potential well and the hot CGM. In between the supernova and CGM zones, we have demonstrated that the onset of rapid black-hole growth is driven by the major compaction event that tends to occur near the golden mass due to the same two physical processes.
We found that the onset of black-hole growth in this simulation is associated with a sinkage of the black-hole from its orbit at to the center, due to the deepening of the potential well and the increase of drag as a result of the compaction event.
The quenching of star formation at and above the golden mass is thus proposed to be a multi-stage process. It is triggered by a major compaction event, via central gas depletion due to star formation and outflows. The quenching is then maintained, at least partly and for a while, by the hot CGM that suppresses the cold gas supply to galaxies in haloes above the golden mass, especially at when cold streams have hard times penetrating the hot CGM. Finally, AGN feedback, activated by the compaction-driven black-hole growth, can help keeping the CGM hot and thus maintaining long-term quenching. We note that in this picture, contrary to commonly assumed scenarios, AGN feedback is not responsible for the onset of quenching. Instead, these two phenomena result from the same wet compaction event once the galaxy is near the golden mass defined by supernova feedback and the hot CGM. AGN feedback kicks in later on as a possibly important source for quenching maintenance.
It may be interesting to complement this picture by considering the general interplay between the galaxy and its environment on large scales and its central region during the different phases. In the star-forming supernova zone below the golden mass, cold flows that originate from outside the halo induce star formation that is regulated by supernova feedback, which suppresses the central black-hole growth. Near the golden mass, major compaction events that are induced externally by mergers and counter-rotating streams form compact star-forming blue nuggets, which trigger central quenching inside out. The compaction (outside-in) causes a rapid central black-hole growth. Above the golden mass, the hot CGM maintains the quenching by suppressing the cold gas supply from the halo to the center. The halo deep potential well and hot CGM lock the supernova ejecta and the black-hole to the galaxy center and allow a continuous black-hole growth. The resultant central AGN then helps the quenching on larger scales by keeping the CGM hot for a long time.
Acknowledgments
We thank Dale Kocevski and Sandro Tacchella for assistance with figures 8 and 10. We acknowledge stimulating discussions with Sandy Faber, Natascha Forster-Schreiber, Jonathan Freundlich, Katarina Kraljic, Reinhard Genzel and Joel Primack. This research has been partly supported by BSF 2014-273, NSF AST-1405962, GIF I-1341-303.7/2016, DIP STE1869/2-1 GE625/17-1 and ISF 861/20. We acknowledge the NewHorizon simulation builders team for allowing the use of their non-public data, including Hoseung Choi, Julien Devriendt, Sugata Kaviraj, Katarina Kraljic, Taysun Kimm, Min-Jung Park, Sebastien Peirani, Christophe Pichon, Marta Volonteri and Sukyoung Yi. The NewHorizon work was granted access to the HPC resources of CINES under allocations c2016047637, A0020407637 and A0070402192 by GENCI, KSC-2017-G2-0003 by KISTI, and as a “Grand Challenge" project granted by GENCI on the AMD Rome extension of the Joliot Curie supercomputer at TGCC. This work has made use of the Horizon cluster on which the simulation was post-processed, hosted by the Institut d’Astrophysique de Paris. We warmly thank S. Rouberol for running it smoothly.
Data availability
The data underlying this article were provided by the NewHorizon collaboration. Data will be shared on request to the corresponding author with permission of the NewHorizon collaboration.
References
- Anglés-Alcázar et al. (2017) Anglés-Alcázar D., Faucher-Giguère C.-A., Quataert E., Hopkins P. F., Feldmann R., Torrey P., Wetzel A., Kereš D., 2017, MNRAS, 472, L109
- Aubert et al. (2004) Aubert D., Pichon C., Colombi S., 2004, MNRAS, 352, 376
- Baldwin et al. (1981) Baldwin J. A., Phillips M. M., Terlevich R., 1981, PASP, 93, 5
- Bardeen (1970) Bardeen J. M., 1970, Nature, 226, 64
- Barro et al. (2013) Barro G., et al., 2013, ApJ, 765, 104
- Barro et al. (2014a) Barro G., et al., 2014a, ApJ, 791, 52
- Barro et al. (2014b) Barro G., Trump J. R., Koo D. C., Dekel A., Kassin S. A., Kocevski D. D., Faber S. M., et al. 2014b, ApJ, 795, 145
- Barro et al. (2015) Barro G., Trump J., Koo D. C., Dekel A., Kassin S. A., Kocevski D., Faber S. M., Candels 2015, in American Astronomical Society Meeting Abstracts. p. 111.07
- Barro et al. (2016a) Barro G., et al., 2016a, ApJ, 820, 120
- Barro et al. (2016b) Barro G., et al., 2016b, ApJ, 827, L32
- Barro et al. (2017a) Barro G., et al., 2017a, ApJ, 840, 47
- Barro et al. (2017b) Barro G., et al., 2017b, ApJ, 851, L40
- Behroozi et al. (2013) Behroozi P. S., Wechsler R. H., Conroy C., 2013, ApJ, 762, L31
- Behroozi et al. (2019) Behroozi P., Wechsler R. H., Hearin A. P., Conroy C., 2019, MNRAS, 488, 3143
- Bellovary et al. (2019) Bellovary J. M., Cleary C. E., Munshi F., Tremmel M., Christensen C. R., Brooks A., Quinn T. R., 2019, MNRAS, 482, 2913
- Benson & Babul (2009) Benson A. J., Babul A., 2009, MNRAS, 397, 1302
- Binney (1977) Binney J., 1977, ApJ, 215, 483
- Birnboim & Dekel (2003) Birnboim Y., Dekel A., 2003, MNRAS, 345, 349
- Birnboim et al. (2007) Birnboim Y., Dekel A., Neistein E., 2007, MNRAS, 380, 339
- Blandford & Znajek (1977) Blandford R. D., Znajek R. L., 1977, MNRAS, 179, 433
- Bondi & Hoyle (1944) Bondi H., Hoyle F., 1944, MNRAS, 104, 273
- Bouché et al. (2010) Bouché N., et al., 2010, ApJ, 718, 1001
- Bower et al. (2006) Bower R. G., Benson A. J., Malbon R., Helly J. C., Frenk C. S., Baugh C. M., Cole S., Lacey C. G., 2006, MNRAS, 370, 645
- Bower et al. (2017) Bower R. G., Schaye J., Frenk C. S., Theuns T., Schaller M., Crain R. A., McAlpine S., 2017, MNRAS, 465, 32
- Bruce et al. (2012) Bruce V. A., et al., 2012, MNRAS, 427, 1666
- Cattaneo & Teyssier (2007) Cattaneo A., Teyssier R., 2007, MNRAS, 376, 1547
- Cattaneo et al. (2006) Cattaneo A., Dekel A., Devriendt J., Guiderdoni B., Blaizot J., 2006, MNRAS, 370, 1651
- Cattaneo et al. (2009) Cattaneo A., Faber S. M., Binney J., Dekel A., Kormendy J., Mushotzky R., 2009, Nature, 460, 213
- Ceverino et al. (2015) Ceverino D., Primack J., Dekel A., 2015, MNRAS, 453, 408
- Chabrier (2005) Chabrier G., 2005, in Corbelli E., Palla F., Zinnecker H., eds, Astrophysics and Space Science Library Vol. 327, The Initial Mass Function 50 Years Later. p. 41 (arXiv:astro-ph/0409465)
- Chandrasekhar (1943) Chandrasekhar S., 1943, ApJ, 97, 255
- Chang et al. (2017) Chang Y.-Y., et al., 2017, MNRAS, 466, L103
- Chen et al. (2020) Chen Z., et al., 2020, ApJ, 897, 102
- Croton et al. (2006) Croton D. J., et al., 2006, MNRAS, 365, 11
- Dalgarno & McCray (1972) Dalgarno A., McCray R. A., 1972, ARA&A, 10, 375
- Damjanov et al. (2009) Damjanov I., et al., 2009, ApJ, 695, 101
- Damjanov et al. (2011) Damjanov I., Abraham R. G., Glazebrook K., McCarthy P. J., Caris E., Carlberg R. G., Chen H.-W., et al. 2011, ApJ, 739, L44
- Dekel & Birnboim (2006) Dekel A., Birnboim Y., 2006, MNRAS, 368, 2
- Dekel & Burkert (2014) Dekel A., Burkert A., 2014, MNRAS, 438, 1870
- Dekel & Silk (1986) Dekel A., Silk J., 1986, ApJ, 303, 39
- Dekel et al. (2009) Dekel A., et al., 2009, Nature, 457, 451
- Dekel et al. (2013) Dekel A., Zolotov A., Tweed D., Cacciato M., Ceverino D., Primack J. R., 2013, MNRAS, 435, 999
- Dekel et al. (2019) Dekel A., Lapiner S., Dubois Y., 2019, arXiv e-prints, p. arXiv:1904.08431
- Dekel et al. (2020a) Dekel A., Ginzburg O., Jiang F., Freundlich J., Lapiner S., Ceverino D., Primack J., 2020a, MNRAS, 493, 4126
- Dekel et al. (2020b) Dekel A., Lapiner S., Ginzburg O., Freundlich J., Jiang F., Finish B., Kretschmer M., et al. 2020b, MNRAS, 496, 5372
- Dubois et al. (2010) Dubois Y., Devriendt J., Slyz A., Teyssier R., 2010, MNRAS, 409, 985
- Dubois et al. (2011) Dubois Y., Devriendt J., Teyssier R., Slyz A., 2011, MNRAS, 417, 1853
- Dubois et al. (2012) Dubois Y., Devriendt J., Slyz A., Teyssier R., 2012, MNRAS, 420, 2662
- Dubois et al. (2014a) Dubois Y., Volonteri M., Silk J., 2014a, MNRAS, 440, 1590
- Dubois et al. (2014b) Dubois Y., et al., 2014b, MNRAS, 444, 1453
- Dubois et al. (2015) Dubois Y., Volonteri M., Silk J., Devriendt J., Slyz A., Teyssier R., 2015, MNRAS, 452, 1502
- Dubois et al. (2016) Dubois Y., Peirani S., Pichon C., Devriendt J., Gavazzi R., Welker C., Volonteri M., 2016, MNRAS, 463, 3948
- Dubois et al. (2020) Dubois Y., Beckmann R., Bournaud F., Choi H., Devriendt J., et al. 2020, arXiv e-prints, p. arXiv:2009.10578
- Fall & Efstathiou (1980) Fall S. M., Efstathiou G., 1980, MNRAS, 193, 189
- Flores et al. (1993) Flores R., Primack J. R., Blumenthal G. R., Faber S. M., 1993, ApJ, 412, 443
- Förster Schreiber et al. (2019) Förster Schreiber N. M., et al., 2019, ApJ, 875, 21
- Freundlich et al. (2020) Freundlich J., Dekel A., Jiang F., Ishai G., Cornuault N., Lapiner S., Dutton A. A., Macciò A. V., 2020, MNRAS, 491, 4523
- Geen et al. (2015) Geen S., Rosdahl J., Blaizot J., Devriendt J., Slyz A., 2015, MNRAS, 448, 3248
- Gentry et al. (2017) Gentry E. S., Krumholz M. R., Dekel A., Madau P., 2017, MNRAS, 465, 2471
- Gentry et al. (2019) Gentry E. S., Krumholz M. R., Madau P., Lupi A., 2019, MNRAS, 483, 3647
- Haardt & Madau (1996) Haardt F., Madau P., 1996, ApJ, 461, 20
- Habouzit et al. (2017) Habouzit M., Volonteri M., Dubois Y., 2017, MNRAS, 468, 3935
- Habouzit et al. (2019) Habouzit M., et al., 2019, MNRAS, 484, 4413
- Häring & Rix (2004) Häring N., Rix H.-W., 2004, ApJ, 604, L89
- Ho & Kim (2014) Ho L. C., Kim M., 2014, ApJ, 789, 17
- Huertas-Company et al. (2018) Huertas-Company M., et al., 2018, ApJ, 858, 114
- Juneau et al. (2015) Juneau S., et al., 2015, in Demographics and Environment of AGN from Multi-Wavelength Surveys. p. 51
- Kauffmann et al. (2003) Kauffmann G., Heckman T. M., Tremonti C., Brinchmann J., Charlot S., White S. D. M., Ridgway S. E., et al., 2003, MNRAS, 346, 1055
- Kennicutt (1998) Kennicutt Jr. R. C., 1998, ApJ, 498, 541
- Kereš et al. (2005) Kereš D., Katz N., Weinberg D. H., Davé R., 2005, MNRAS, 363, 2
- Kim et al. (2017) Kim C.-G., Ostriker E. C., Raileanu R., 2017, ApJ, 834, 25
- Kimm & Cen (2014) Kimm T., Cen R., 2014, ApJ, 788, 121
- Kimm et al. (2015) Kimm T., Cen R., Devriendt J., Dubois Y., Slyz A., 2015, MNRAS, 451, 2900
- Kimm et al. (2017) Kimm T., Katz H., Haehnelt M., Rosdahl J., Devriendt J., Slyz A., 2017, MNRAS, 466, 4826
- King et al. (2005) King A. R., Lubow S. H., Ogilvie G. I., Pringle J. E., 2005, MNRAS, 363, 49
- Kocevski et al. (2017) Kocevski D. D., Barro G., Faber S. M., Dekel A., Somerville R. S., Young J. A., Williams C. C., et al. 2017, ApJ, 846, 112
- Komatsu et al. (2011) Komatsu E., et al., 2011, ApJS, 192, 18
- Kormendy & Ho (2013) Kormendy J., Ho L. C., 2013, ARA&A, 51, 511
- Larson (1976) Larson R. B., 1976, MNRAS, 176, 31
- Madau & Dickinson (2014) Madau P., Dickinson M., 2014, ARA&A, 52, 415
- Magorrian et al. (1998) Magorrian J., et al., 1998, AJ, 115, 2285
- McAlpine et al. (2018) McAlpine S., Bower R. G., Rosario D. J., Crain R. A., Schaye J., Theuns T., 2018, MNRAS, 481, 3118
- McKinney et al. (2012) McKinney J., Tchekhovskoy A., Blandford R., 2012, MNRAS, 423, 3083
- Moster et al. (2010) Moster B. P., Somerville R. S., Maulbetsch C., van den Bosch F. C., Macciò A. V., Naab T., Oser L., 2010, ApJ, 710, 903
- Moster et al. (2013) Moster B. P., Naab T., White S. D. M., 2013, MNRAS, 428, 3121
- Moster et al. (2018) Moster B. P., Naab T., White S. D. M., 2018, MNRAS, 477, 1822
- Nelson et al. (2013) Nelson D., Vogelsberger M., Genel S., Sijacki D., Kereš D., Springel V., Hernquist L., 2013, MNRAS, 429, 3353
- Nelson et al. (2016) Nelson D., Genel S., Pillepich A., Vogelsberger M., Springel V., Hernquist L., 2016, MNRAS, 460, 2881
- Newman et al. (2010) Newman A. B., Ellis R. S., Treu T., Bundy K., 2010, ApJ, 717, L103
- Ocvirk et al. (2008) Ocvirk P., Pichon C., Teyssier R., 2008, MNRAS, 390, 1326
- Ostriker (1999) Ostriker E. C., 1999, ApJ, 513, 252
- Park et al. (2019a) Park M., et al., 2019a, in American Astronomical Society Meeting Abstracts #233. p. 206.03
- Park et al. (2019b) Park M.-J., et al., 2019b, ApJ, 883, 25
- Pfister et al. (2019) Pfister H., Volonteri M., Dubois Y., Dotti M., Colpi M., 2019, MNRAS, 486, 101
- Power et al. (2003) Power C., Navarro J. F., Jenkins A., Frenk C. S., White S. D. M., Springel V., Stadel J., Quinn T., 2003, MNRAS, 338, 14
- Prieto et al. (2017) Prieto J., Escala A., Volonteri M., Dubois Y., 2017, ApJ, 836, 216
- Rees & Ostriker (1977) Rees M. J., Ostriker J. P., 1977, MNRAS, 179, 541
- Reines & Volonteri (2015) Reines A. E., Volonteri M., 2015, ApJ, 813, 82
- Reines et al. (2020) Reines A. E., Condon J. J., Darling J., Greene J. E., 2020, ApJ, 888, 36
- Rezzolla et al. (2008) Rezzolla L., Barausse E., Dorband E., Pollney D., Reisswig C., Seiler J., Husa S., 2008, Phys. Rev. D, 78, 044002
- Rodríguez-Puebla et al. (2017) Rodríguez-Puebla A., Primack J. R., Avila-Reese V., Faber S. M., 2017, MNRAS, 470, 651
- Shakura & Sunyaev (1973) Shakura N. I., Sunyaev R. A., 1973, A&A, 500, 33
- Silk (1977) Silk J., 1977, ApJ, 211, 638
- Sutherland & Dopita (1993) Sutherland R. S., Dopita M. A., 1993, ApJS, 88, 253
- Tacchella et al. (2016a) Tacchella S., Dekel A., Carollo C. M., Ceverino D., DeGraf C., Lapiner S., Mandelker N., Primack Joel R., 2016a, MNRAS, 457, 2790
- Tacchella et al. (2016b) Tacchella S., Dekel A., Carollo C. M., Ceverino D., DeGraf C., Lapiner S., Mandelker N., Primack J. R., 2016b, MNRAS, 458, 242
- Tacconi et al. (2018) Tacconi L. J., Genzel R., Saintonge A., Combes F., García-Burillo S., Neri R., Bolatto A., et al. 2018, ApJ, 853, 179
- Teyssier (2002) Teyssier R., 2002, A&A, 385, 337
- Tomassetti et al. (2016) Tomassetti M., et al., 2016, MNRAS, 458, 4477
- Trebitsch et al. (2018) Trebitsch M., Volonteri M., Dubois Y., Madau P., 2018, MNRAS, 478, 5607
- Trebitsch et al. (2020) Trebitsch M., et al., 2020, arXiv e-prints, p. arXiv:2002.04045
- Tweed et al. (2009) Tweed D., Devriendt J., Blaizot J., Colombi S., Slyz A., 2009, A&A, 506, 647
- Van Dokkum et al. (2008) Van Dokkum P. G., et al., 2008, ApJ, 677, L5
- Van Dokkum et al. (2010) Van Dokkum P. G., Whitaker K. E., Brammer G., Franx M., Kriek M., Labbé I., et al. 2010, ApJ, 709, 1018
- Van Dokkum et al. (2014) Van Dokkum P. G., Bezanson R., van der Wel A., Nelson E. J., Momcheva I., Skelton R. E., Whitaker K. E., et al. 2014, ApJ, 791, 45
- Van Dokkum et al. (2015) Van Dokkum P. G., et al., 2015, ApJ, 813, 23
- Van der Wel et al. (2014) Van der Wel A., et al., 2014, ApJ, 792, L6
- Vitale et al. (2013) Vitale M., Mignoli M., Cimatti A., Lilly S. J., Carollo C. M., the zCOSMOS team 2013, A&A, 556, A11
- Whitaker et al. (2012) Whitaker K. E., Kriek M., van Dokkum P. G., Bezanson R., Brammer G., Franx M., Labbé I., 2012, ApJ, 745, 179
- Williams et al. (2014) Williams C. C., Giavalisco M., Cassata P., Tundo E., Wiklind T., Guo Y., Lee B., et al. 2014, ApJ, 780, 1
- Williams et al. (2015) Williams C. C., et al., 2015, ApJ, 800, 21
- Zhang et al. (2019) Zhang H., et al., 2019, MNRAS, 484, 5170
- Zolotov et al. (2015) Zolotov A., et al., 2015, MNRAS, 450, 2327
Appendix A The NewHorizon Simulation
A.1 General
The NewHorizon simulation (Dubois et al., 2020) is a hydro-gravitational zoom-in cosmological simulation using an Eulerian adaptive mesh refinement RAMSES code (Teyssier, 2002). The gas is evolved using a second-order Godunov scheme to solve the Euler equations and an HLLC Rieman solver using the MinMod total variation diminishing scheme for the interpolation of cell quantities at the interface between cells.
The simulation is based on the standard CDM cosmology with the cosmological parameters consistent with the WMAP-7 data (Komatsu et al., 2011), namely flat curvature, total matter density , dark energy density , baryon density , amplitude of matter power spectrum , spectral index , and Hubble constant .
The NewHorizon volume is a high-resolution sphere of radius embedded in the larger, lower resolution Horizon-AGN box of side (Dubois et al., 2014b). The initial conditions in Horizon-AGN had dark-matter particles, while in NewHorizon the dark-matter particle mass is times lower, . The refinement within the zoom-in region is done using a quasi-Lagrangian strategy: a cell is refined if the total mass within it surpass 8 times the initial mass. An extra level of refinement is added when the expansion factor is doubled (i.e. ), thus keeping the minimal cell size within the limits of . In addition a super-Lagrangian refinement is added to the mesh if the cell size is below one Jeans length and where the gas number density exceed .
Radiative cooling is modeled according to rates from Sutherland & Dopita (1993) for gas with temperatures above , and using rates from Dalgarno & McCray (1972) for gas below . The metal-enriched gas is allowed to cool down to . The gas is heated by a uniform UV background radiation following Haardt & Madau (1996), which is turned on after reionization at . Optically thick regions with hydrogen number density greater than are assumed to be self shielded from the UV radiation, so the heating rate is reduced accordingly by a factor of .
The star formation rate follows a Kennicutt-Schmidt relation (Kennicutt, 1998), , where is the star formation rate density, is the gas density and is the varying star formation efficiency per free-fall time. Stars form in cells with hydrogen number density above a threshold of . The star formation efficiency per free-fall time () is determined by the local turbulent Mach number and the Jeans length (Kimm et al., 2017; Trebitsch et al., 2018). The minimal mass for a stellar particle is , where each such particle represents a population of stars with a Chabrier initial mass function (Chabrier, 2005), imposing lower and upper bounds of and , respectively.
Stellar feedback is included in the simulation through Type-II supernovae, each releasing kinetic energy of . A stellar particle allows supernova explosions once older than . The explosion deploys 31 per cent of the mass to the ISM with a metal yield of 5 per cent of the total ejecta. Only massive stars above are assumed to explode. Although the frequency of supernova explosions per solar mass is , this frequency is multiplied by a factor of two to account for the effect of clustered supernovae, which may lower the density in the surrounding medium and increase the radial momentum per supernova in the subsequent explosions (Kim et al., 2017; Gentry et al., 2017, 2019). Mechanical supernova feedback is implemented (Kimm & Cen, 2014; Kimm et al., 2015) to model separately the supernova energy-conservation phase and the momentum-conservation phase. The model identifies the current phase of the supernovae explosion and directly deploys the expected momentum during the snow-plow momentum-conserving phase. In addition to the momentum from supernovae, the simulation takes into account a contribution to radial momentum due to the pre-heating in the vicinity of young OB stars (Geen et al., 2015).
A.2 Black holes and AGN feedback
Massive black holes are implemented as sink particles with a seed mass of and zero spin. Sink particles are formed in cells where both the stellar and gas density exceed the density threshold for star formation, while the stellar velocity dispersion is larger than , and the new seed is located at least away from a neighboring pre-existing black-hole.
The black-hole growth rate is assumed to be , where is the spin-dependent radiative efficiency that is computed in the simulation on-the-fly and is the Bondi-Hoyle gas accretion rate (Bondi & Hoyle, 1944),
| (9) |
where is the averaged gas density, is the average relative velocity of the gas with respect to the black-hole and is the average speed of sound. These averaged gas properties in the vicinity of the black-hole are measured within a radius of () (Dubois et al., 2012). The highest resolution is kept in the vicinity of the black-hole at all times. The accretion rate is limited by the Eddington limit,
| (10) |
with the Thompson cross section.
An explicit drag force is exerted by the gas on the black-hole in order to avoid oscillations of the sink particles due to resolution effects close to high density regions. The sub-grid drag force model mimics the unresolved dynamical friction as exerted by the gas on the massive black-hole. The drag force is measured from the gas quantities within the high resolution sphere of radius around the black-hole. The functional form of the drag force is:
| (11) |
where is the boost factor in high density regions, when the density is high () and otherwise. The fudge factor is a function of the Mach number allowing a more efficient drag force when the gas is supersonic with respect to the black hole (following Ostriker, 1999).
AGN feedback is modeled in two modes of high and low accretion rate. The distinction between these two modes depends on the ratio of the black-hole accretion rate and the Eddington rate (Dubois et al., 2012) with a transition at . The power released by the AGN is , with a different form for the feedback efficiency in the two feedback modes. The "radio mode" occurs when the black-hole accretion rate is low, , during which AGN feedback is in the form of jets, namely, a bipolar release of mass, momentum and energy into a cylinder of radius and height above and below the black-hole position. Feedback efficiency in the radio-mode scales with the black-hole spin. This was modeled using a fourth-order polynomial fit to sampled results from McKinney et al. (2012) of magnetically chocked accretion discs. The black-hole spin tends to values larger than once it starts to accrete gas and gain mass. As a result, while the radio mode is active, the high spin values translate to a typical feedback efficiency of (Dubois et al., 2020, fig. 3). The jets are set in motion with a speed of and their direction is aligned (anti-aligned) with the black-hole spin. The "quasar mode" is active during phases of high accretion rate, , where the feedback deposits thermal energy within a sphere of radius . The feedback efficiency in the quasar mode is coupled to the spin-dependent radiative efficiency (), (Dubois et al., 2012).
The black-hole spin, starting from zero, is followed on-the-fly in the simulation, including the evolution of spin magnitude and direction during both gas accretion and binary black-hole mergers. The evolution of black-hole spin is of paramount importance in the models implemented in the simulation. The radiative efficiency of the AGN, , is spin dependent, therefore, variations in the magnitude of the spin affect the Eddington luminosity as well as the efficiency of both feedback modes. In addition, variation in the direction of black-hole spin will determine the direction of the jets during low accretion rate phases. The radiative efficiency is defined as:
| (12) |
where is the energy per unit rest mass of the innermost stable circular orbit (ISCO), which depends on the Schwarzschild radius and the spin of the black-hole. The radiative efficiency is reduced while the black-hole is in the radio mode by the factor following Benson & Babul (2009). When the accretion is low, the model assumes that the energy deposited as jets is powered by the rotation of the black-hole (Blandford & Znajek, 1977), therefore the magnitude of the BH spin is decreasing when jets are active (following McKinney et al., 2012). At high accretion rates, the magnitude of the spin evolves following Bardeen (1970), spinning up (down) when the accretion disc is aligned (anti-aligned). The angular momentum of accreted gas will determine the evolution in the direction of the black-hole spin. When an accretion disc is misaligned, torques due to Lense-Thirring effect drive the inner parts of the disc to be aligned (or anti-aligned) with the black-hole spin, causing a warp in the disc. Eventually, the viscosity of the disc will force the disc and the black-hole spin to a new stable configuration of alignment (anti-alignment) with the total angular momentum as vectorial sum (King et al., 2005). The unresolved disc is assumed to be a thin Shakura-Sunyaev accretion disc (Shakura & Sunyaev, 1973), which is aligned with the angular momentum of the feeding gas (details in Dubois et al., 2014a).
Two black holes are merged when the distance between them is smaller than and their relative velocity is lower than the escape velocity of the binary. After a binary black-hole merger, the spin of the remnant black-hole is determined by the spins and orbital angular momentum of the two merging black holes (analytic expressions in Rezzolla et al., 2008).
A.3 Galaxy sample and measurements
The identification of haloes is done using the AdaptaHOP halo finder (Aubert et al., 2004) with the Most Massive Substructure Method (Tweed et al., 2009), where the density is smoothed over 20 particles, and considering only haloes with more than 100 dark-matter particles. The center of the halo is identified in the standard NewHorizon analysis using a shrinking-sphere algorithm, where the dark-matter center of mass is calculated at each iteration followed by a reduction of the radius by 10 per cent down to a minimum radius of (Power et al., 2003). The peak of the dark-matter density within this final volume is selected as the halo center. The galaxy center is identified in a similar fashion using the stellar particles with the HOP halo finder, imposing a minimum number of 50 stellar particles. Haloes in the zoom-in volume of NewHorizon that are polluted by low-resolution dark-matter particles from the embedding Horizon-AGN volume are excluded from the sample.
In order to achieve a higher accuracy for the galaxy center position, necessary for the studies of the BH locking to the center, we apply an additional re-centering procedure within the initial radius of . We find the center of mass recursively within a shrinking sphere, where the radius is reduced by 5 per cent at each iteration down to a minimum radius of as long as the sphere contains more than 100 stellar particles. Still, locating the center in low-mass galaxies remains a challenge since the center is ill-defined when the potential well is shallow and there is no distinct bulge.
We identify the central black-hole in each galaxy by selecting the most massive black-hole within a radius of from the galaxy center at the final redshift available for our current analysis, . This is also the closest black-hole to the center in all the cases studied here. We then follow the black-hole back in time using its unique ID. In the event of a binary black-hole merger, the post-merger particle posses the identity of the more massive progenitor.
The bulge mass is measured by the total stellar mass in the spheroid using kinematic decomposition. Each star particle at radius from the center and with a speed is assigned a ratio: , where is the specific angular momentum along the direction of the galaxy spin axis, and is the maximal specific angular momentum of the star. Bulge star particles are defined as those obeying the condition while the rest are considered as disc stars.
| 01 | 0.69 , 2.59 | 0.22 , 2.50 | 0.21 , 1.66 |
|---|---|---|---|
| 02 | 6.88 , 10.63 | 2.49 , 1.11 | 0.15 , 28.39 |
| 03 | 0.50 , 6.40 | 1.02 , 1.60 | 0.03 , 6.40 |
| 06 | 2.08 , 5.32 | 0.64 , 1.46 | 0.30 , 1.77 |
| 10 | 1.17 , 6.14 | 1.23 , 0.81 | 0.47 , 24.42 |
| 18 | 2.63 , 4.28 | 0.99 , 0.19 | 0.15 , 6.44 |
| 51 | 0.27 , 2.16 | 0.18 , 0.42 | 0.02 , 0.25 |
| 142 | 0.26 , 1.02 | 0.34 , 0.29 | 0.03 , 0.09 |
Appendix B Suppression by Supernovae
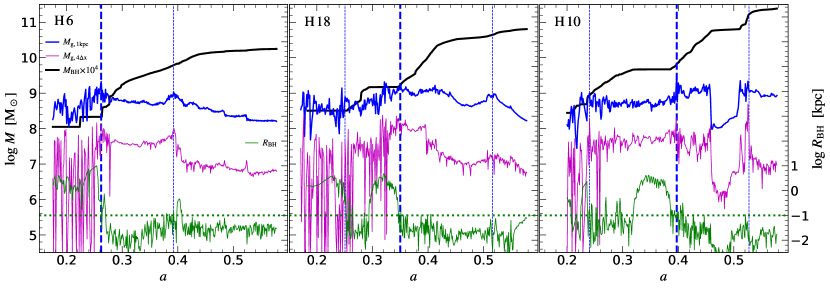
Figure 11 displays the evolution of central gas mass () in three galaxies, as in Fig. 4, but here showing the raw data at each output timestep without any smoothing over time. Also shown is the gas mass within a smaller sphere of radius about the galaxy center, four minimum grid cells or , within which the gas properties are used to determine the accretion rate onto the black-hole in the simulations. Galaxy H6 in Figure 11 (left panel) shows the most clear compaction event associated with an onset of rapid black-hole growth. There are large central gas oscillations prior to the major blue-nugget peak (). These fluctuations can be interpreted as due to repeating episodes of supernova-driven gas ejection in the pre-compaction phase. During the pre-BN phase we usually find the black-hole wandering away from the center with suppressed mass growth. Once the compaction has occurred and the potential well is deep enough to resist SN-driven gas expulsion from the center, we see a transition to smaller central gas mass fluctuations, the black-hole sinks to the inner as can be seen in the green curve (), and it is rapidly gaining mass.
In the middle panel of Fig. 11 we show the evolution of galaxy H18 which generally displays a similar behaviour as seen in H6, namely fluctuations with large amplitudes before the major compaction peak at , and smaller amplitudes in the post-BN phase. Unlike H6, here we identify a minor compaction at before the major blue-nugget peak. Although the fluctuations remain relatively large after the minor compaction, for a short period of time, between , we see a subtle indication for fluctuations with smaller amplitude, possibly caused by an abrupt gas accumulation in the nuclear region () which temporarily increase the depth of the potential well. The gas supply to the center is diminished at as the compaction ends, and once again we see large fluctuations that persist until the major compaction. This behaviour suggests that while the galaxy is still below the golden mass, a minor compaction may briefly induce a deeper potential well due to the sudden gas accumulation in the center, thus triggering the sinkage of the black-hole to the center as well as causing a temporary reduction in the gas fluctuations, both of which will assist the black-hole growth. However, such episodes tend to be short lived when the galaxy is still in the regime where SN explosions can efficiently expel and heat much of the gas before it can form massive permanent stellar body in the center.
In galaxy H10, Figure 11 right panel, we again identify a minor compaction event () before the major blue-nugget (). Here the minor compaction is stronger compared to H18 (or any other pre-BN minor compaction event in the sample), as is evident from the cyan line in Fig. 4 where we see that is reaching shortly after the compaction, indicating that the potential well is close to the critical value below which the galaxy is in the regime of effective SN feedback. We see here somewhat smaller gas fluctuations after the minor compaction. Although this compaction is relatively strong, by the end of this event at , the potential well is not deep enough to lock the black-hole to the gas-rich center, and after it starts wandering off center until the major compaction event.
In all cases we find a correlation between the sinkage of the black-hole to the center and a compaction event, be it the major compaction or a minor one. However, it is only after the major compaction, when the galaxy has reached the golden mass, that we find a potential well which is deep enough to both lock the black-hole to the galactic center and permanently reduce gas fluctuations.
We do not find a prolonged period of time in which the black-hole is in the center while the fluctuations are large. This is not surprising if both the black-hole sinkage to the center and the reduction in gas fluctuations have the same origin, namely the deepening of the potential well due to a compaction event. As a result, we cannot distinguish here the possible effect of gas fluctuations on the suppression of black-hole growth from suppression caused by off centered wandering. The effect of central gas fluctuations on suppression of black-hole growth will require further investigation beyond the scope of this paper.
A similar transition from large to small oscillations in the central gas density within has been seen in FIRE simulations, Fig. 1 of Anglés-Alcázar et al. (2017). The large fluctuations are seen at early times when the black-hole growth is suppressed, while the black-hole starts to grow when the central surface density becomes stable. The repeated ejections in the pre-compaction supernova regime may indicate that certain suppression of black-hole growth could have occurred even if the black-hole was at the center at that time and not wandering off center. This implies that the suppression of black-hole growth may not be solely due to its wandering off center. On the other hand, the intense episodes of supernova feedback may themselves be responsible for the wandering of the black-hole off center. The continuous gas removal from the center may keep the central potential well shallow, allowing the black-hole to orbit about the center. This is until the potential well is deepened by the compaction event, which forces the black-hole to sink to the center, where it can accrete more efficiently.
Although off-centered black holes have been observed in dwarf galaxies (Reines et al., 2020), we caution that further study is required to examine the validity and causes for wandering black holes in simulations.
Appendix C More Images
Figure 12 top and middle panel present a sequence of images similar to Fig. 3 for two additional NewHorizon galaxies, H6 and H10 respectively. Figure 12 bottom panel brings an analogous set of images for a VELA galaxy, V07 (e.g. Zolotov et al., 2015). The sequence of images, for face-on gas and stars, demonstrate the pre-compaction stage, the compaction process, the peak gas compaction in a blue-nugget phase, and the post-compaction disc and ring about a compact passive red nugget. The evolution is qualitatively similar in VELA and New Horizon, despite the different codes and different ways by which the physical sub-grid recipes for star formation and feedback are incorporated. The NewHorizon images show the position of the black-hole in the different stages, demonstrating that it tends to wander off center before the compaction and sink to the center during the compaction process.