Magnetism and electrical transport in Y-doped layered iridate Sr2IrO4
Abstract
Here, we report an investigation of structural, magnetic and electronic properties in Y-doped layered iridate (Sr1-xYx)2IrO4 ( 0.1). The parent Sr2IrO4 is a well-studied spin-orbit coupling (SOC) induced insulator with an antiferromagnetic ground state. The Y-doping here equivalently acts for electron doping without altering the vital parameters such as, SOC and electron correlation. Experimental results show a minute change in structural parameters and an equivalent charge conversion from Ir4+ to Ir3+. Unlike similarly other electron-doped system, the low temperature magnetic and electronic state in present series is minimally influenced. The charge conduction mechanism follows 2-dimensional hopping model in whole series. Magnetoresistance (MR) data show an interesting sign change with both temperature and magnetic field. The positive MR both at low temperature follows weak antilocalization behavior where the sign change in MR is believed to be caused by an interplay between SOC and magnetic moment.
pacs:
75.47.Lx, 75.40.Cx, 75.70.Tj, 75.47.-mI Introduction
The relativistic spin-orbit coupling (SOC) is believed to drive novel ground state in 5-based Sr2IrO4.krempa ; rau ; cao ; caobook This material has layered structure, and recently has received large deal of attention due to its unusual insulating and magnetic states. The structural similarity with high superconducting material i.e., doped La2CuO4 has further added interest in Sr2IrO4 where the band calculations have predicted possible superconductivity in this material with optimum electron/hole doping.yang ; gao ; casa ; yan ; sumita The novel physics in Sr2IrO4 has been explained with = 1/2 ground state.kim1 ; kim2 In octahedral environment, high crystal field splits the orbitals into and levels. In presence of strong SOC, the low lying state is further split into into = 3/2 quartet and = 1/2 doublet. Under this picture, Ir4+ (5) in Sr2IrO4 adopts a half filled = 1/2 state. It has been further argued that even in presence of small electronic correlation (), this narrow = 1/2 state is split into upper (empty) and lower (filled) band which gives a realization of Mott-like insulating state.
The structure has critical role in Sr2IrO4. The layered structure in this material is realized from generalized Ruddlesden-Popper series (SrIrO3)n(SrO) with = 1, where the Ir4+ atoms form a square lattice in each layer with = 1/2 pseudospins. These pseudospins participate in Heisenberg-type antiferromagnetic (AFM) exchange interaction which exhibits sizable anisotropy along in-plane and out-plane direction.fujiyama The rotation/distortion of IrO6 octahedra further induces Dzyaloshinskii-Moriya (DM) type antisymmetric interaction which is believed to give rise weak ferromagnetic (FM) behavior with ordering temperature 225 K.crawford ; ye ; imtiaz1 ; imtiaz2 This picture, however, implies neighboring ionic states i.e., Ir3+ and Ir5+ to be nonmagnetic ( = 0) as those will have fully filled = 3/2, 1/2 and = 3/2 states, respectively. It is worthy to note here that this picture of SOC is described considering an ideal cubic environment of IrO6 octahedra. In reality, however, many materials deviate from this ideal condition. Therefore, different picture of spin-orbit entanglement such as, mixing of states has been proposed for many materials. The prominent examples include pyrochlore iridates (Eu,Sm)2Ir2O7,sagayama ; asih hexagonal lattice systems (Li,Na)2IrO3,mkim ; biffin hyperkagome lattice material Na4Ir3O8,takagi chain compound Sr3CuIrO6,liu etc. In recent times, many theoretical proposals have been put forward to address this new physics originating from an interplay between SOC and noncubic crystal field in iridates, therefore, the magnetic nature of Ir ions, as a whole, need to be investigated properly.liu ; choong ; bhattacharjee ; georg
Considering the anisotropic nature in Sr2IrO4, the approaches of chemical doping both at Sr- and Ir-site have been adopted to understand the exotic magnetic state in this material. In case of Ir-site doping as in Sr2Ir1-xO4 ( = Rh, Ru, Tb, Cu), a complete suppressing of magnetic ordering and insulating state has been observed at different level of doping concentration.clancy ; qi ; calder ; yuan ; wang ; imtiaz3 On the other hand, the isoelectronic doping at Sr-site in (Sr,Ca,Ba)2IrO4 has shown a drastic decrease in resistivity while having insignificant influence on magnetic state.chen1 ; zhao ; souri The La3+ in (Sr1-xLax)2IrO4, interestingly, has shown rapid suppression of both magnetic and insulating state with only 2% of doping concentration.chen ; gretarsson Similarly, Ga3+ doping in (Sr1-xGax)2IrO4 has shown a suppression of insulating state for 0.05 but the study shows magnetic transition temperature in Sr2IrO4 does not change significantly till = 0.15.han As trivalent substitution at Sr-site converts Ir4+ to Ir3+ where the latter is expected to be nonmagnetic, it is surprising that robust magnetism in Sr2IrO4 with such high ordering temperature is suppressed with such small dilution of magnetic lattice.
In present work, we have undertaken Sr-site substitution with Y3+ in (Sr1-xYx)2IrO4. The Y3+ (4) being nonmagnetic, avoids any magnetic interaction with Ir at low temperature. Rather, it equivalently generates Ir3+ (5, = 0) without causing any modification in crucial active interactions such as, SOC and . Therefore, this substitution will act for electron-doping and will possibly introduce site-dilution through Ir3+ in system. Here, it can be mentioned that both Y3+ and La3+ will introduce electron doping in system but the Y3+ will have comparatively large impact on structural parameters due to larger ionic radii mismatch with Sr2+. We have investigated structure, magnetization, electrical transport and magnetotransport in (Sr1-xYx)2IrO4. The system retains its original crystal structure while there are nonmonotonic changes in structural parameters. X-ray photoemission spectroscopy (XPS) measurements suggest Y3+ creates equal amount of Ir3+. Both the magnetic and electronic states are minimally influenced with Y3+ doping. While our analysis shows charge conduction mechanism follows Mott’s two dimensional (D) variable-range-hopping (VRH) model, the magnetoresistance (MR) changes sign with both temperature as well as magnetic field which is due to an interplay between SOC and magnetism.
II Experimental Detail
Series of polycrystalline materials (Sr1-xYx)2IrO4 ( = 0.0, 0.01, 0.02, 0.025, 0.035, 0.05 and 0.10) are prepared by conventional solid state method similar to Ref. [15]. The high purity powder ingredients SrCO3, IrO2 and Y2O3 (Sigma Aldrich, purity 99.99%) are mixed in stoichiometric ratio and ground well. The Y2O3 has been given preheat treatment to remove moisture. The mixed powders have been given several heat treatment in temperature range (1000 - 1100) in powder and pellet form with intermediate grindings. X-ray diffraction (XRD) measurements have been used to check the phase purity of all the samples. The XRD data have been analyzed with Rietveld refinement program to get detail information of structure and phase purity. Further, x-ray photoemission spectroscopy (XPS) study has been done to probe the oxidation state of elements in parent and doped samples. The XPS measurements are performed with base pressure in the range of 10-10 mbar using a commercial electron energy analyzer (Omnicron nanotechnology) and non-monochromatic Al x-ray source ( = 1486.6 eV). CasaXPS software has been used to analyze the XPS data. The samples used for XPS study are in pallet form where the ion beam sputtering has been done on samples to expose the clean surface before measurements. The DC magnetization have been measured using a SQUID magnetometer (Quantum Design) whereas the electrical transport measurements are done in an integrated system from NanoMagnetics Instruments and Cryomagnetics, Inc.
III Result and Discussion
III.1 Structural characterization
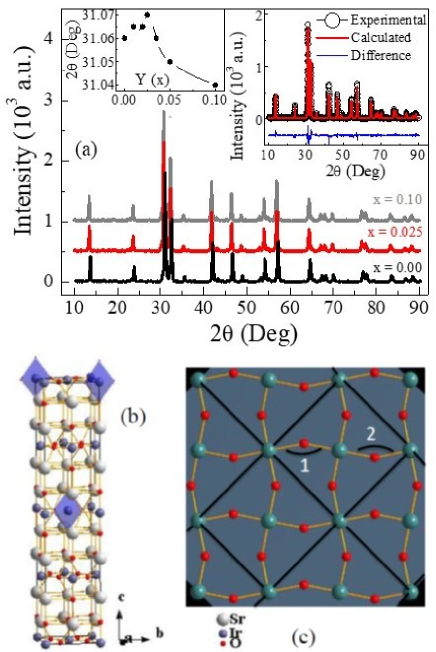
The Fig. 1a shows room temperature XRD pattern of three representative samples with = 0.0, 0.025 and 0.1 of present series. The XRD data indicate there is no substantial changes in pattern with Y substitution which is important considering that Sr2+ (1.21 Å) and Y3+ (0.96 Å) has considerable differences in ionic radii (for coordination number = 7). The left inset of Fig. 1a shows composition dependent peak position of most intense peak situated at 2 31o. The plot shows the maximum peak shifting is about 0.03o which is though nonmonotonous. Interestingly, the peak shifting displays an anomaly around = 0.025 which has been similarly observed for other lattice parameters (discussed later in Fig. 2). The structural analysis of materials has been done by Rietveld refinement of XRD data using FULLPROF program.full Right inset shows the representative Rietveld refinement for parent = 0 material. Rietveld refinement of XRD data shows all the samples are in single phase and crystallize in tetragonal structure with I41/acd symmetry.imtiaz1 ; imtiaz2 We have obtained for Rietveld refinement below 2 for all the samples which implies a good quality fitting. The tetragonal unit cell, as drawn using structural parameters obtained from Rietveld refinement, is shown in Fig. 1b for Sr2IrO4. It can clearly be seen the layered structure of present material where Ir-O active layers are separated by inactive Sr-O layers. Fig. 1c presents the Ir-O layer showing Ir square lattice where 1 and 2 in figure marks the Ir-O-Ir bond-angle.
While Y substitution do not induce any structural phase modification, the lattice parameters show a slight modification with . Figs. 2a and 2b present evolution of lattice parameters and with Y concentration demonstrating both the parameters initially decrease slightly till 0.025 then increases rapidly with . Similar anomalous changes of lattice parameter, which is related to interesting electronic properties, have been evidenced in doped pyrochlore iridate Eu2Ir2O7.surjeet
The overall change/increase in lattice parameters ( and ) across the series is not very significant (below 0.2%) where we obtain an overall increase in unit cell volume is 0.48%. Although, both and parameters show similar change with (Figs. 2a and 2c), but the ratio decreases which implies tetragonal distortion is reduced with progressive substitution of Y. Fig. 2c presents variation of basal plane Ir-O bond angle Ir-O1-Ir which shows similar dip around 0.05. This Ir-O1-Ir is directly related to IrO6 octahedral rotation () around -axis which plays a significant role in Sr2IrO4 as this octahedral distortion is believed to induce Dzyaloshinsky-Moriya (DM) type antisymmetric exchange interaction giving rise to canted AFM spin structure or weak ferromagnetism in this material. For parent Sr2IrO4, we find around 11.3o deg which is consistent with other reports (Fig. 2d).crawford ; imtiaz1 With doping, initially increases to 13.02o at = 0.025, and then with further Y substitution it decreases. The changes in structural parameters in Fig. 2 show a reverse trend around 0.025. This may be related to the fact that at lower concentration of Y3+, which has smaller size compared to Sr2+, both the cell parameters and volume decrease. However, the Ir3+ (0.68 Å), which is generated with Y3+ substitution and has larger size compared to Ir4+ (0.62 Å), will increase the unit cell volume at higher concentration of Y3+. Nonetheless, the observed variation in lattice parameters, bond angle Ir-O1-Ir and octahedral distortion are consistent with each other (Fig. 2).

III.2 X-ray photoemission spectroscopy study
It is important to understand the electronic charge state of Ir in Sr2IrO4 and its evolution with Y substitution which decides the physical properties in these materials. With this aim, we have performed the XPS measurements for representative three samples i.e., = 0.0, 0.025 and 0.05. Figs. 3a, 3b and 3c show the Ir-4f core level spectra for = 0.0, 0.025 and 0.05, respectively. The Ir-4f spectra shows two distinct peaks which correspond to spin-orbit split Ir-4f7/2 and Ir-4f5/2 electronic states that are observed at the binding energies (B.E.) of 62.0 and 65.0 eV, respectively.zhu ; kumar The red lines in Figs. 3a, 3b and 3c are due to overall fitting of data. For = 0.0, the detailed analysis of Ir-4f fitting indicates Ir ions are mostly in Ir4+ charge states (blue solid lines). However, a weak contribution from neighboring ionic states (Ir5+ or Ir3+) can be present in parent Sr2IrO4 due to non-stoichiometry of samples which has been reported in other studies.imtiaz3 ; kumar However, that feature is not clearly evident in present data. For the doped samples as in Figs. 3b and 3c, the similar data analysis indicates that in addition to Ir4+, we find trace of Ir3+ with Ir-4f7/2 and Ir-4f5/2 peaks arising at binding energies of 61.1 and 64.2 eV, respectively (orange solid lines). The origin of Ir3+ in doped samples is related to Y substitution. Interestingly, we find that the amount of Ir3+ increases almost proportionately with Y doping and its amount corresponds to expectations for the level of Y doing (). For instance, we find amount of Ir3+ is about 4.8% and 9% for = 0.025 and 0.05 samples, respectively.

The Figs. 3d and 3e show core-level spectra of the Sr-3d orbitals for representation x = 0.0 and 0.05 samples, respectively where the spin-orbit coupling split doublet peaks related to Sr-3 and Sr- are located at 133.3 and 135.1 eV, respectively. While the red continuous lines in Figs. 3d and 3e are the overall fitting and the solid blue lines are due to fitting with Sr2+ electronic states. Similarly Fig. 3f shows XPS spectra of Y-3p3/2 core level for doped = 0.05 sample. We observe that Y-3 and Y-3 peaks related to Y3+ occur at binding energy around 299.1 and 312 eV respectively with spin-orbit splitting of 12.9 eV. Confirming the Y3+ charge state of Y is important which equivalently converts Ir4+ to Ir3+ and acts for electron doping in system. Fig. 3g shows the variation of Ir3+ with Y3+ doping concentration. Considering that Y() generates 2 amount of Ir3+, it is understood that Y3+ doping generates an equivalent amount of Ir3+ ion. This will help to understand the role of Ir3+ ions on magnetic and transport properties as within the picture of strong SOC, Ir3+ electronic state is believed to be nonmagnetic.
III.3 Magnetization study
Temperature dependent magnetization data measured in 10 kOe magnetic field under zero-field cooled (ZFC) and field cooled (FC) protocol are shown in Figs. 4a ( = 0.0, 0.01 and 0.02) and 4b ( = 0.025, 0.035, 0.05 and 0.1) for (Sr1-xYx)2IrO4 series. For all the samples, data show a sharp increase below around 250 K which is marked by magnetic phase transition. In Sr2IrO4, a magnetic transition from high temperature paramagnetic (PM) to canted-type AFM state at low temperature has been identified.crawford ; imtiaz1 This canted type AFM spin ordering originates due to DM interaction which is induced by distortion/rotation of IrO6 octahedra. As a result, the system exhibits weak ferromagnetism. Using a critical behavior analysis, we have recently shown the nature of FM state in Sr2IrO4 closely follows the mean-field model with FM ordering temperature 225 K which agrees also with other studies.fujiyama ; imtiaz2 The Fig. 4a further shows a downfall in ZFC data and opening of bifurcation between and below 95 K. This downfall in has been shown to arise due to prominent magneto-structural coupling where the spin alignment follows structural evolution at low temperature.imtiaz1 ; jack

It is evident in Figs. 4a and 4b that Y substitution has very weak influence on magnetization as the AFM transition temperature , magnetic moment and bifurcation between magnetization data do not change significantly till = 0.05. For = 0.1, the figure shows a slight decrease in as well as in magnetic moment. This is significant as unlike other electron-doped system (Sr1-xLax)2IrO4 where the magnetic state collapses with 0.02, the magnetic state in present (Sr1-xYx)2IrO4 is minimally disturbed. Given that both Y3+ and La3+ generates Ir3+ and dilutes the magnetic lattice at same scale, the robust magnetic behavior in present series is quite surprising. Here, it can be further added that in another electron-doped (Sr1-xGax)2IrO4, though the order magnetic moment decreases but the magnetic transition temperature remains mostly unchanged with or Ir3+ even till = 0.075.han This indicates that picture of Ir under non-cubic octahedral distortion needs to be reexamined.
To characterize the effective moment in the high temperature PM state, temperature dependent inverse magnetic susceptibility are shown in Fig. 4c for this series. For = 0.0, shows linear behavior above , however, in high temperature regime around 275 K, the (T) deviates from linearity. This deviation arises due to layered structure of Sr2IrO4 which gives an anisotropic magnetic exchange interaction where the strength of exchange interaction is different within the layer and between the layers. A scattering study has shown 2D like anisotropic magnetic interaction in Sr2IrO4 which allows in-plane magnetic interaction to survive at least till 25 K above the (228.5 K).fujiyama Therefore, the slope change in for Sr2IrO4 around 275 K (Fig. 4c) is likely due to anisotropic magnetic exchange coupling. The continuation of spin correlation above appears to be typical feature of layered AFM materials such as, La2CuO4,keimer and iron pnictides.klingeler In doped samples, as seen in Fig. 4c, the (T) becomes almost linear above . The data in PM regime is fitted with Curie-Weiss (CW) law, given as =) where (= NAeff/3kB) is the Curie constant, is the effective PM moment and is the Curie temperature. Straight lines in Fig. 4c are due to fitting with CW law for two representative extreme members of series i.e., = 0.0 and = 0.1. Using the fitted parameter , we have calculated the effective PM moment for all the samples.

The Fig. 4d shows composition dependent , and of present series. We calculate = 0.553 /f.u. for = 0.0 composition which appears much lower than the calculated spin-only value 1.72 /f.u. (= ) for spin-1/2 material. The mostly decreases, though there are rapid decrease at initial level of and above = 0.02, the decrease of becomes slower. Similar, though opposite, trend has been found for where it increases rapidly till = 0.02 then exhibits a slow change. The for parent Sr2IrO4 is as high as 233 K and the value is close to its long-range ordering temperature = 225 K.crawford ; ye ; imtiaz2 Nonetheless, changes in is very small over the series and it remains positive which is surprising because in highest doped sample i.e., = 0.1, there are conversion of 20% Ir4+ to Ir3+ which would cause major dilution of magnetic lattice. From structural organization, Sr2IrO4 has layered structure where magnetically and electronically active Ir-O layers are separated by inactive Sr-O layer (Fig. 1b). For such 2-dimensional lattice, the geometrical percolation threshold for spin-spin only exchange interaction is shown to be around 40% dilution.clancy A recent study in doped Sr2Ir1-xRhxO4 has shown complete disappearance of magnetism at 0.17.clancy Taking into account Rh3+ (4) is itself nonmagnetic and it further generates nonmagnetic Ir5+ ( = 0), this suggests around 34% dilution. In that scenario, the maximum 20% dilution in present (Sr1-xYx)2IrO4 series should suppress the magnetic and insulating state to a large extent which is not evident in results. The La substitution, on the other hand, in (Sr1-xLax)2IrO4 has led to complete suppression of long-range magnetic and insulating state with only 0.02,chen ; gretarsson where the Ir ionic state would be similar in both La- and Y-doped materials. In another electron doped system (Sr1-xGax)2IrO4, though a metallic state is induced in Sr2IrO4 for 0.05 but the long-range transition temperature does not charge much with introduction of Ga3+ (till = 0.075) in system.han In an ideal and cubic octahedral environment, Ir3+ (5) is expected to be nonmagnetic with an impression that 5 oxides possess high value of crystal field effect, hence all the electrons will populate low lying state. However, iridates exhibit prominent SOC. Recent calculations and experimental results (RIXS), however, indicate a mixing of and orbitals and = 3/2 and = 1/2 states due to prominent effects of SOC and non-cubic crystal field effect.liu ; georg In that case, Ir3+ may not turn out to be totally nonmagnetic. Due to large mismatch between Sr2+ and Y3+ ionic size, such probability will be prominent in present (Sr1-xYx)2IrO4 series, the IrO6 octahedra would be in non-ideal and non-cubic environment.
Magnetic field dependent magnetization measured at 2 K are shown in Figs. 5a and 5b for (Sr1-xYx)2IrO4 series. The for Sr2IrO4 shows a large opening at low temperature with coercive field 9370 Oe. With Y substitution, the data show a saturation in high field regime. Moreover, the measured magnetic moment at 2 K and in field 70 kOe decreases with but shows an anomaly around = 0.025 (Fig. 5c). The similarly increases till = 0.025 then begins to decrease till highest doping level = 0.1 (Fig. 5d). Interestingly, this variation of and with has very similarity with and , respectively (see Fig. 4d). In Fig. 5e, we have shown Arrott plot of data. Arrott plot ( vs ) is an effective mean to understand the nature of magnetic state as the positive intercept on axis due to straight line fitting in high field regimes of Arrott plot implies spontaneous magnetization or FM state.arrott For Sr2IrO4, Fig. 5e shows very small positive intercept (magnified view is in inset) which indicates weak ferromagnetism in this material. With Y substitution, we observe an increased positive intercept in Arrott plot which implies an increased spontaneous magnetization or FM behavior (Fig. 5e) in doped samples. This behavior, however, is consistent with saturation (Fig. 5b) and increasing value (Fig. 4d) with doping concentration.
The above results show that magnetic properties are not significantly modified in present (Sr1-xYx)2IrO4 series. In Sr2IrO4, various optical spectroscopy studies have shown results in favor of model. In present series, a distortion in IrO6 octahedra increases due to larger mismatch between Sr2+ and Y3+ ions. Following model, Ir3+ would be nonmagnetic and will act for site dilution. But our results show magnetic state is not modified significantly, thus implying Ir3+ retains magnetism. Therefore, in non-ideal case of IrO6 octahedra the theoretical investigations need to be extended to understand the effective model. Recently, many theoretical studies are debating over the conventional = 1/2 Mott-like insulating picture where this model is based on simplified local cubic symmetry of IrO6 octahedra. For instance, the band topology in Na2IrO3 is explained with an improved model to clarify the topological character of spin-orbit coupled ground state.choong In another report, the distortion of IrO6 is shown to generate a new energy scale which competes with existing SOC and results in state of pseudospin that is significantly different from = 3/2 and 1/2 multiplets.bhattacharjee A recent detailed calculation has discussed the effect of crystal field effect, and SOC on mixing of and orbitals, and its consequences on physical properties.georg Nonetheless, our present study indicates a magnetic nature of Ir3+ which probably gives robust magnetism in (Sr1-xYx)2IrO4.
III.4 Electronic transport study
Electrical resistivity () as a function of temperature is shown in Figs. 6a and 6b for (Sr1-xYx)2IrO4 series. The Sr2IrO4 shows strong insulating behavior which is believed to arise due to opening of exotic Mott-like gap in = 1/2 electronic state.kim1 As evident in Fig. 6, all the samples remain highly insulating unlike its La-doped counterpart.chen The changes of at 2 K exhibit a nonmonotonic behavior showing a dip around = 0.025 (inset of Fig. 6b). Although the Y3+ tunes the band filling proportionally through electron doping but it is not expected to alter both SOC and , which unlike cases of Ir-site doping.clancy ; calder ; imtiaz3 This nonmonotonic changes of is likely to be associated with modification of local crystal structures, such as Ir-O bond-angle and bond-length which show an anomalous changes across = 0.025 (see Fig. 2 ). The simultaneous decrease of both Ir-O bond-angle and bond-length will lead to further overlapping of Ir- and O- orbitals which would facilitate the electron hopping. As a consequence, the initially decreases with and then again increases with opposite changes in structural parameters for 0.025 (inset of Fig. 6b).
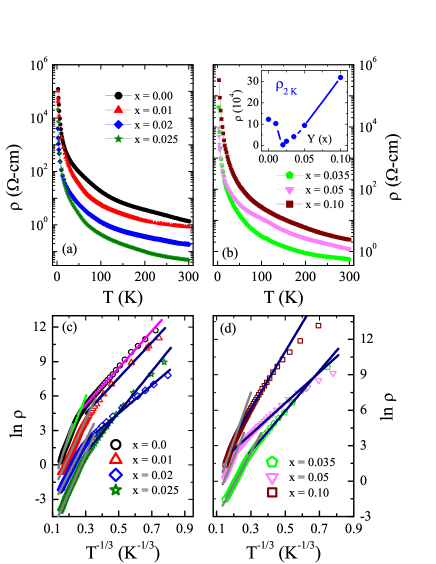
We find that this thermally activated charge conduction in present series can be best described by Mott’s 2D VRH model, = , where = 21.2/[)] is the characteristic temperature, is the Boltzmann constant, ) is the density of states (DOS) at Fermi level and is the localization length.mott We have previously shown that charge conduction in Sr2IrO4 follows Mott’s 2D VRH model in three distinct temperature regimes which are connected to its magnetic and structural state.imtiaz1 ; imtiaz3 For the doped samples, the data can similarly be analyzed with VRH model but in two distinct temperature regimes. Figs. 6c and 6d show vs plotting where the straight line fitting confirms the validity of 2D VRH model. The temperature range of fitting as well as obtained parameter are given in Table 1. The parameter exhibits a nonmonotonic change where its value initially decreases and then increases similar to resistivity value (inset of Fig. 6b). As is contributed by both DOS and localization length, therefore its variation with Y substitution can not be straightforwardly ascribed to any one parameter. Given that shows nonmonotonic change and these materials are highly resistive, we speculate that change in is most likely related with change in .
| Sample | Temperature range (K) | (K) |
| (Sr1-xYx)2IrO4 | (105) | |
| x = 0.0 | 300 - 240 | 1.441(3) |
| 240 - 70 | 0.468(2) | |
| 40 - 5 | 0.048(1) | |
| x = 0.01 | 300 - 45 | 0.307(8) |
| 45 - 5 | 0.039(7) | |
| x = 0.02 | 300 - 40 | 0.230(7) |
| 40 - 5 | 0.018(3) | |
| x = 0.025 | 300 - 40 | 0.345(2) |
| 40- 5 | 0.025(7) | |
| x = 0.035 | 300 - 30 | 0.202(7) |
| 30 - 5 | 0.049(6) | |
| x = 0.05 | 300 - 110 | 0.420(3) |
| 70 - 10 | 0.022(4) | |
| x = 0.10 | 300 - 130 | 0.676(2) |
| 120- 10 | 0.141(7) |
III.5 Magnetoresistance
The magnetoresistance (MR), calculated as = , along with data are shown in Figs. 7a - 7f for (Sr1-xYx)2IrO4 series. The MR value is not very impressive (MR 2%) but its evolution with temperature and magnetic field is interesting. For Sr2IrO4, MR at 2 K initially exhibits slight positive value but with increasing field it changes its sign to negative value (Fig. 7a). During decreasing magnetic field, MR notably shows large hysteresis showing the higher value compared to its value during increasing field. There is a remnant MR at = 0 which implies resistivity does not return to its original value at = 0 Oe. During application of negative magnetic field, MR initially shows a positive value indicating resistivity increases in presence of magnetic field. The MR then shows a peak and changes its sign in higher fields. On Negative side, with decreasing field the MR surprisingly do not show remnant value where it returns to its original value. With stark difference, MR at 300 K in nonmagnetic state shows complete positive value, though its values are almost two order lower than that at 2 K (Fig. 8b). For the doped samples, the MR shows similar hysteresis and sign change but it becomes more symmetric with magnetic field. For instance, positive MR increases during first application of magnetic field. Nonetheless, this behavior of MR appears to be connected with an interplay between SOC and magnetic moment. Further, it can be noted that the magnetic fields, where MR at 2 K shows peaks in both positive and negative field direction, closely match with coercive field in data (Fig. 7).

The MR behavior in Fig. 7 has hysteresis though it shows an asymmetric behavior with respect to applied field. At a first glance, this MR appears to be driven by effect of ‘spin-polarized-tunneling’ which has usually been observed in polycrystalline materials due to grain boundaries.coey ; huang ; gupta The ‘spin-polarized-tunneling’ induced MR basically has following properties; i) MR arises due to an increasing conductance at grain boundary which largely depends on the relative orientation of moment in adjacent grains, ii) This MR is mostly of negative type, as the applied magnetic field only polarizes the moments in adjacent grains which leads to an enhanced conduction, iii) This MR generally shows a high value, around 20-30% or above, iv) As the spin polarization usually requires low field, this MR increases sharply in low field regime (below 0.5 T), and then increases at slower pace. The MR observed in present (Sr1-xYx)2IrO4 series, on the other hand, has different characters. The observed MR in Fig. 7 is considerably low ( 2%), having both positive and negative value with the applied field. The MR here do not show any low/high field phenomenon. The positive MR is further asymmetric to the direction of applied field, and also sensitive to Y-doping or magnetic strength. The positive-negative crossover in MR roughly coincides with the coercive field . Therefore, the present MR is unlikely due to ‘spin-polarized-tunneling’ effect.
Generally, MR in disordered materials exhibits either positive or negative value which is explained using quantum interference phenomenon that is regarded as quantum correction to classical Drude model. While the negative MR is believed to originate from weak localization (WL), the positive MR arises due to weak antilocalization (WAL) effect in electronic transport mechanism. In zero magnetic field, the conductance is suppressed and enhanced in case of WL and WAL, respectively due to coherent back scattering. While traveling back to its original path with an opposite direction, an electron can follow many closed paths. Obviously, electrons have to follow those paths which only allow elastic scattering, otherwise electrons will loose their phase coherence that will eventually decrease the interference effect. Given that total amplitude of back scattering is the sum of amplitudes gained in both clockwise and anticlockwise direction, then in absence of magnetic field, magnetic impurities or any other dephasing scattering entities the calculation shows the amplitude to return to its original position is 2, where the amplitude is due to the phase accumulated in spatial part of the wave function and is the angle accumulated in spin part of the wave function.brahlek In a system without spin-momentum locking, the part turns out to be significantly small, therefore the probability of backscattering in this constructive interference comes out as 4. This enhanced backscattering reduces conductivity and causes WL effect. On the other hand, the prominent spin-momentum locking renders = , thus this destructive interference gives almost zero backscattering which is the case for WAL. Now, in an applied magnetic field the time reversal symmetry is broken, and the two opposite paths acquires two equal but opposite phase = , where is the related magnetic flux and is reduced Planck constant. This additional phase factor modifies the previous amplitude to 2. Therefore, with an increase of magnetic field ( increases) the previously discussed constructive and destructive interference behaves differently. Nonetheless, even a small magnetic field contributes to the destruction of this localization process, hence showing a peak in magnetoconductance data near zero field. In materials with spin-momentum locking as induced by topological surface states or strong SOC, the WAL gives positive MR. The examples include Bi2Se3,chen2 ; liu Bi2Te3,he Au covered Mg film,berg Ir-based Na2IrO3jender , etc.
The Sr2IrO4 has reasonable SOC due to presence of heavy Ir. Previous studies have shown negative MR in bulk Sr2IrO4,chen ; ge however, a sign change in MR from positive to negative with temperature has also been observed in its film.miao The hysteresis as well as sign change in MR in present study indicate MR is governed by an interplay between SOC and magnetism. At 300 K, where the system is in nonmagnetic state, a positive MR is observed. At low temperature magnetic state, a positive MR is observed at the beginning of field application which is again due to prominent SOC in present material. With increasing field, the magnetic moment increases which leads to breaking of time reversal symmetry, hence the moment acts as dephasing factor for electronic interference. The positive MR is, therefore, suppressed and the overall system exhibits negative MR which continues to increase till highest measuring field. The hysteresis and remnant MR is due to an induced moment with application of field. The exotic interplay between SOC and magnetism becomes more evident when MR shows a sign change from negative to positive value with reversal of magnetic field direction (Fig. 7). In an usual loop, as magnetic field is reversed to negative direction, the remnant magnetic moment decreases and becomes zero around the coercive field . Due to suppressed moment in this field regime between 0 to , the SOC dominates and results in a positive MR. In the field higher than , the moment further increases which promotes negative MR (Fig. 7). Interestingly, the peak position in positive MR closely matches with .
In doped materials, Fig. 7 shows that the hysteresis in MR decreases with and the MR becomes more symmetric with field i.e., positive MR increases during first application of field. This increase of positive MR in doped samples is probably due to weakening of magnetism with Y substitution (Fig. 5c) which is also supported by reduced hysteresis in MR data. The influence of magnetic moment on MR appears very evident in highest doped = 0.1 sample where both MR and exhibit saturation in high field regime (Fig. 7f).
The effect of charge localization on magnetoconductivity (MC) has been theoretically described by Hikami-Larkin-Nagaoka (HLN) equation.hln This calculation basically neglects inelastic scattering compared to intrinsic elastic and spin-orbit scatterings and gives following form,
| (1) |
where = (B) – (0), is the electronic charge, is Planck constant, is phase coherence length and is prefactor which indicates type of localization i.e., its positive and negative value signifies WL and WAL, respectively. The value of is predicted to be 0.5 for single channel WAL.
The MR at 2 K exhibits positive value and a dip like feature near origin in negative field side for Sr2IrO4 (see Fig. 7a). This results in a negative MC which is shown (open circle) in Fig 8a where the solid line in the figure represents fitting with HLN equation (Eq. 1). We obtain parameters = -0.07(5) and = 28.3(2) nm. The obtained value of is significantly lower than the expected -0.5 for single channel WAL behavior. The decrease of (still negative) at 2 K is likely due to an effect of magnetic state which strongly reduces the quantum interference effect through breaking time reversal symmetry. The similar decrease of and a systematic crossover between WAL and WL have been observed with magnetic impurity (Cr) in Bi2Se3 topological insulator (TI) system ( decreases from -0.40 to 0.0 with 7% of Cr).liu Similar quenching of WAL has been observed in other TI Bi2Te3 doped with magnetic Fe impurity, showing a crossover from WAL to dependance of MC data with higher concentration of Fe.he In case of topological surface states, theoretical study suggests an opening of energy gap at Dirac point with magnetic impurity which causes such crossover from WAL to WL.lu A transition from WAL to WL has further been discussed in case of graphene, showing it is caused by an intervalley scattering which reduces the chiral nature of Dirac fermions.cann ; tikh As evident, the situation in TI and graphene are different than the iridium oxides which are primarily dominated by SOC, but the root cause remains similar which requires a certain type of symmetry breaking. The present is lower than the values obtained for TI systems that are in range of 100 - 500 nm. This low value of can arise due to an increased magnetic scattering from ordered moments. This impurity induced low values of and are also observed in case of other iridates. For instance, the film of Na2IrO3 shows and in the range of -0.034 to -0.20 and 27 to 11 nm, respectively in the temperature range of 2 to 25 K.jender Nonetheless, an interplay between SOC and magnetic moment on WAL in bulk 5 oxide is quite intriguing. Here, it worth to mention that WL/WAL has originally been discussed at the background of conducting materials but recently this analysis has been tested in semiconducting iridate system.jender Iridates with reasonable SOC and exotic band properties, indeed offer an ideal playground to test theoretical models having topological significances.
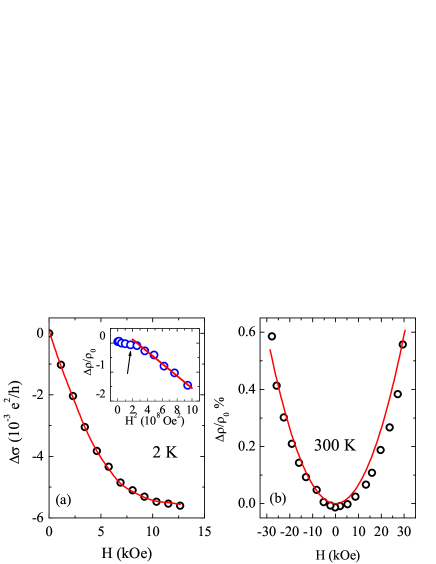
In Fig. 8b, the MR of Sr2IrO4 at 300 K follows parabolic field dependance. However, no dip in MR is observed close to origin which may be due to an effect of high temperature. The dip in MR is sensitive to many parameters. In thin film of Bi2Te3, the dip feature in MR is shown to largely depend on the angle between film plane and magnetic field and magnetic impurities.he However, the MR behavior at 300 K can be attributed to Lorentz deflection of charge carriers. The solid line in Fig. 8b is due to fitting with Kohler’s formula, = which gives charge carrier mobility around 250 cm2 V-1 s-1 which is in the range of semiconducting systems.
The Fig. 7 further shows that the negative MR during first application of field increases almost linearly above , except for parent Sr2IrO4. The nonlinear negative MR at 2 K for Sr2IrO4 follows a dependence in high field regime (see inset of Fig. 8b). In low field regime, however, a deviation from dependence is observed which marks a crossover from initial positive to negative MR with increasing magnetic field (Fig. 7a). This dependance of MR implies a prominent role of magnetic scattering on electron transport. The influence of magnetic scattering in inducing dependance of MC data has been observed in doped TI Bi2Te3.he In doped samples, this dependance is softened, which is probably due to weakening of moment with .
III.6 Conclusion
In conclusion, the structural, magnetic and electronic transport properties are studied in series of 5 oxide (Sr1-xYx)2IrO4 with 0.1. While the system retains its original structural symmetry, the unit cell parameters modify with Y substitution. The spectroscopy reveal that doped Y3+ converts equivalent amount of Ir4+ into Ir3+. Opposed to other electron (La) doped system, the low temperature magnetic and insulating state in Sr2IrO4 is very weakly influenced by Y doping. This implies that generated Ir3+ ions less likely act for site dilution, instead participate in exchange interaction with Ir4+. All samples are highly insulating where the mode of charge conduction follows Mott’s 2D VRH model. The MR at low temperature (2 K) magnetic state shows large hysteresis and a sign change with field while in room temperature PM state, MR exhibits only a positive value. This sign change in MR is believed to be caused by an interplay between SOC and magnetic moment. Further, the positive MR at 2 K is explained with WAL behavior. The present results suggest that the conventional picture of under strong SOC needs to be revisited while the alternative pictures of SOC for non-cubic octahedral environment are already being considered. At the same time, local structural as well as magnetic investigations need to be initiated to comprehend this complex magnetism in these materials.
IV Acknowledgment
We acknowledge IISER, Pune and Sunil Nair for the magnetization measurements. We acknowledge DST-FIST and DST-PURSE for funding the ‘low temperature high magnetic field’ and ‘helium liquefier’ facility, respectively. INB acknowledges CSIR, India for fellowship.
V References
References
- (1) W. W. Krempa, G. Chen, Y. B. Kim and L. Balents, Rev. Condens. Matter Phys. 5, 57 (2014).
- (2) J. G. Rau, E. K-H. Lee and H-Y. Kee, Annu. Rev. Condens. Matter Phys. 7, 195 (2016).
- (3) G. Cao and P. Schlottmann, Reports on Progress in Physics 81, 042502 (2018).
- (4) G. Cao and Lance De-Long, Frontiers of 4d- and 5d-Transition Metal Oxides, World Scientific Publishing Co. Pte. Ltd. (2013).
- (5) Y. Yang, W.-S. Wang, J.-G. Liu, H. Chen, J.-H. Dai and Q.-H. Wan Phys. Rev. B 89 094518 (2014).
- (6) Y. Gao, T. Zhou, H. Huang and Q.-H. Wang, Scientific Reports 5 9251 (2015).
- (7) J. Kim, D. Casa, M. H. Upton, T. Gog, Y.-J. Kim, J. F. Mitchell, M. van Veenendaal, M. Daghofer, J. van den Brink, G. Khaliullin and B. J. Kim, Phys. Rev. Lett. 108 177003 (2012).
- (8) Y. J. Yan, M. Q. Ren, H. C. Xu, B. P. Xie, R. Tao, H. Y. Choi, N. Lee, Y. J. Choi, T. Zhang, and D. L. Feng, Phys. Rev. X 5 041018 (2015).
- (9) S. Sumita, T. Nomoto, and Y. Yanase, Phys. Rev. Lett. 119 027001 (2017).
- (10) B. J. Kim, Hosub Jin, S. J. Moon, J.-Y. Kim, B.-G. Park, C. S. Leem, Jaejun Yu, T.W. Noh, C. Kim, S.-J. Oh, J.-H. Park, V. Durairaj, G. Cao, and E. Rotenberg, Phys. Rev. Lett. 101, 076402 (2008).
- (11) B. J. Kim, H. Ohsumi, T. Komesu, S. Sakai, T. Morita, H. Takagi and T. Arima, Science 323, 1329 (2009).
- (12) S. Fujiyama, H. Ohsumi, T. Komesu, J. Matsuno, B.J. Kim, M. Takata, T. Arima and H. Takagi, Phys. Rev. Lett. 108 247212 (2012).
- (13) M. K. Crawford, M. A. Subramanian, and R. L. Harlow, J. A. Fernandez-Baca, Z. R. Wang and D. C. Johnston Phys. Rev. B 49, 9198 (1994).
- (14) F. Ye, S. Chi, B.C. Chakoumakos, J.A. Fernandez-Baca, T. Qi and G. Cao, Phys. Rev. B 87 140406 (2013).
- (15) Imtiaz Noor Bhatti, R Rawat, A Banerjee and A K Pramanik J. Phys.: Condens. Matter 27, 016005 (2014).
- (16) Imtiaz Noor Bhatti and A. K. Pramanik J. Magn. Magn. Mater. 422, 141 (2017).
- (17) H. Sagayama, D. Uematsu, T. Arima, K. Sugimoto, J. J. Ishikawa, E. O’Farrell and S. Nakatsuji, Phys. Rev. B. 87, 100403(R) (2013)
- (18) R. Asih, N. Adam, S. S. M.-Tajudin, D. P. Sari, K. Matsuhira, H. Guo, M. Wakeshima, Y. Hinatsu, T. Nakano, Y. Nozue, S. Suiaiman, M. I. M.-Ibrahim, P. K. Biswas and I. Watanabe, J. Phys. Soc. Jpn. 86, 024705 (2017).
- (19) M. Kim, B. H. Kim and B. I. Min, Phys. Rev. B. 93, 195135 (2016).
- (20) A. Biffin, R. D. Johnson, S. Choi, F. Freund, S. Manni, A. Bombardi, P. Manuel, P. Gegenwart and R. Coldea, Phys. Rev. B. 90, 205116 (2014).
- (21) Y. Okamoto, M. Nohara, H. A.-Katori and H. Takagi, Phys. Rev. Lett. 99, 137207 (2007).
- (22) X. Liu, V. M. Katukuri, L. Hozoi, Wei-Guo Yin, M. P. M. Dean, M. H. Upton, J. Kim, D. Casa, A. Said, T. Gog, T. F. Qi, G. Cao, A. M. Tsvelik, J. van den Brink and J. P. Hill, Phys. Rev. Lett. 109, 157401 (2012).
- (23) C. H. Kim, H. S. Kim, H.Jeong, H. Jin and J. Yu, Phys. Rev. Lett. 108, 106401 (2012).
- (24) S. Bhattacharjee, Sung-Sik Lee and Yong Baek Kim, New Journal of Physics 14 073015 (2012).
- (25) G. L. Stamokostas and G. A. Fiete, Phys. Rev. B 97, 085150 (2018)
- (26) J. P. Clancy, A. Lupascu, H. Gretarsson, Z. Islam, Y. F. Hu, D. Casa, C. S. Nelson, S. C. LaMarra, G. Cao and Young-June Kim, Phys. Rev. B. 89, 054409 (2014).
- (27) T. F. Qi O. B. Korneta, L. Li, K. Butrouna, V. S. Cao, Xiangang Wan, P. Schlottmann, R. K. Kaul and G. Cao, Phys. Rev. B. 86, 125105 (2012).
- (28) S. Calder, J. W. Kim, G.-X. Cao, C. Cantoni, A. F. May, H. B. Cao, A. A. Aczel, M. Matsuda, Y. Choi, D. Haskel B. C. Sales, D. Mandrus, M. D. Lumsden and A. D. Christianson, Phys. Rev. B 92, 165128 (2015).
- (29) S. J. Yuan, S. Aswartham, J. Terzic, H. Zheng, H. D. Zhao, P. Schlottmann, and G. Cao, Phys. Rev. B 92, 245103 (2015)
- (30) J. C. Wang, S. Aswartham, F. Ye, J. Terzic, H. Zheng, D. Haskel, S. Chikara, Y. Choi, P. Schlottmann, R. Custelcean, S. J. Yuan, and G. Cao, Phys. Rev. B. 92, 214411 (2015).
- (31) Imtiaz Noor Bhatti, R.S. Dhaka and A. K. Pramanik, Phys. Rev. B 96, 144433 (2017).
- (32) X. Chen and S. D. Wilson, Phys. Rev. B 94, 195115 (2016).
- (33) H. Zhao, J. Terzic, H. Zheng, Y. Ni, Y. Zheng, F. Ye, P. Schlottmann and Gang Cao, Journal of Physics: Condensed Matter 10.1088/1361-648X/aac23d (2018).
- (34) M. Souri, B. H. Kim, J. H. Gruenewald, J. G. Connell, J. Thompson, J. Nichols, J. Terzic, B. I. Min, G. Cao, J. W. Brill and A. Seo, Phys. Rev. B 95 235125 (2017).
- (35) X. Chen, T. Hogan, D. Walkup, W. Zhou, M. Pokharel, M. Yao, Wei Tian, T. Z. Ward, Y. Zhao, D. Parshall, C. Opeil, J. W. Lynn, V. Madhavan, and S. D. Wilson, Phys. Rev. B 92, 075125 (2015).
- (36) H. Gretarsson, N. H. Sung, J. Porras, J. Bertinshaw, C. Dietl, Jan A. N. Bruin, A. F. Bangura, Y. K. Kim, R. Dinnebier, J. Kim, A. Al-Zein, M. Moretti Sala, M. Krisch, M. Le Tacon, B. Keimer, and B. J. Kim, Phys. Rev. Lett. 117, 107001 (2016).
- (37) T. Han, Y. Wang, J. Yang, L. He, J. Xu, D. Liang, H. Han, M. Ge, C. Y. Xi, W K Zhu, C. Zhang, and Y. Zhang Appl. Phys. Lett. 109, 192409 (2016)
- (38) J. Rodriguez-Carvajal, Physica B 192, 55 (1993)
- (39) P. Telang, K. Mishra, G. Prando, A. K. Sood, and S. Singh, Phys. Rev. B 99 201112 (2019)
- (40) W. K. Zhu, M. Wang, B. Seradjeh, Fengyuan Yang, and S. X. Zhang Phys. Rev. B. 90, 054419 (2014).
- (41) H. Kumar and A. K. Pramanik, J. Magn. Magn. Mater. 409, 20 (2016).
- (42) B. Keimer, N. Belk, R. J. Birgeneau, A. Cassanho, C. Y. Chen, M. Greven, M. A. Kastner, A. Aharony, Y. Endoh, R. W. Erwin and G. Shirane Phys. Rev. B. 46 14034 (1992).
- (43) R. Klingeler, N. Leps, I. Hellmann, A. Popa, U. Stockert, C. Hess, V. Kataev, H.-J. Grafe, F. Hammerath, G. Lang, S. Wurmehl, G. Behr, L. Harnagea, S. Singh and B. Bchner, Phys. Rev. B 81 024506 (2010).
- (44) G. Jackeli, and G. Khaliullin, Phys. Rev. Lett. 102, 017205 (2009).
- (45) A. Arrott, Phys. Rev. 108, 1394 (1957).
- (46) N. Mott, Conduction in Non-Crystalline Materials, Clarendon Press, Oxford (1993).
- (47) J. Chen, H. J. Qin, F. Yang, J. Liu, T. Guan, F. M. Qu, G. H. Zhang, J. R. Shi, X. C. Xie, C. L. Yang, K. H. Wu, Y. Q. Li, and L. Lu, Phys. Rev. Lett. 105, 176602 (2010).
- (48) H-T. He, G. Wang, T. Zhang, I-K. Sou, G. K. L. Wong, and J-N. Wang, Phys. Rev. Lett. 106, 166805 (2011).
- (49) M. Jenderka, J. Barzola-Quiquia, Z. Zhang, H. Frenzel, M. Grundmann, and M. Lorenz, Phys. Rev. B 88, 045111 (2013).
- (50) G. Bergman, Phys. Rev. Lett. 48 1046 (1982)
- (51) M. Ge, T. F. Qi, O. B. Korneta, D. E. De Long, P. Schlottmann, W. P. Crummett, and G. Cao, Phys. Rev. B 84, 100402 (2011)
- (52) L. Miao, H. Xu and Z. Q. Mao, Phys. Rev. B 89, 035109 (2014)
- (53) J. M. D. Coey, J. Appl. Phys. 85, 5576 (1999)
- (54) H. Y. Hwang, S-W. Cheong, N. P. Ong, and B. Batlogg, Phys. Rev. Lett. 77, 2041 (1996)
- (55) A. Gupta, G. Q. Gong, G. Xiao, P. R. Duncombe, P. Lecoeur, P. Trouilloud, Y. Y. Wang, V. P. Dravid, and J. Z. Sun, Phys. Rev. B 54, 15629 (1996)
- (56) M. Brahlek, N. Koirala, N. Bansal, S. Oh, Solid State Communications 215, 54 (2015)
- (57) S. Hikami, A. I. Larkin and Y. Nagaoka, Prog. Theor. Phys. 63, 707 (1980)
- (58) H-Z Lu, J. Shi and S-Q. Shen, Phys. Rev. Lett. 107, 076801 (2011)
- (59) E. McCann, K. Kechedzhi, V. I. Falko, H. Suzuura, T. Ando and B. L. Altshuler, Phys. Rev. Lett. 97 146805 (2006)
- (60) F. V. Tikhonenko, Phys. Rev. Lett. 103, 226801 (2009)