The Evolution of NGC 7465 as Revealed by its Molecular Gas Properties
Abstract
We present ALMA observations of CO isotopologues and high-density molecular tracers (HCN, HCO+, CN, etc.) in NGC 7465, an unusually gas-rich early-type galaxy that acquired its cold gas recently. In the inner 300 pc, the molecular gas kinematics are misaligned with respect to all other galaxy components; as the gas works its way inward it is torqued into polar orbits about the stellar kinematically-decoupled core (KDC), indicating that the stellar KDC is not related to the current gas accretion event. The galaxy also exhibits unusually high 12CO/13CO line ratios in its nucleus but typical 13CO/C18O ratios. Our calculations show that this result does not necessarily indicate an unusual [12CO/13CO] abundance ratio but rather that 12CO (1-0) is optically thin due to high temperatures and/or large linewidths associated with the inner decoupled, misaligned molecular structure. Line ratios of the higher-density tracers suggest that the densest phase of molecular gas in NGC 7465 has a lower density than is typical for nearby galaxies, possibly as a result of the recent gas accretion. All of the observed molecular properties of NGC 7465 are consistent with it having acquired its molecular (and atomic) gas from a spiral galaxy. Further detailed studies of the CO isotopologues in other early-type galaxies would be valuable for investigating the histories of those that may have acquired their gas from dwarfs. Finally, these ALMA data also show an unidentified line source that is probably a background galaxy similar to those found at in blind CO surveys.
1 Introduction
The gas in early-type galaxies (ETGs) offers interesting clues into their evolution, as there can be a much stronger disconnect between the stars and the gas than there is in spiral galaxies. In spirals, the continuous star formation activity implies that there has been a continuous supply of cold gas over a Hubble time, and the stars and the gas have co-evolved in an uninterrupted symbiotic relationship. In contrast, in early-type galaxies much of the cold and warm gas is kinematically misaligned (even retrograde) with respect to the stars, such that there is little possibility the stars formed from that gas or the gas was expelled from those stars.
We expect irregular gas kinematics in the outer parts of galaxies where the cold gas (especially HI) is more vulnerable to interactions and will retain signatures of disruption for many Gyr. But such misalignments are also present in the inner few kpc of early-type galaxies, where we find that 20% of the regular, relaxed CO disks have polar or retrograde rotation with respect to the stars in the host galaxy. Thus, as much as 30% to 50% of the molecular gas in early-type galaxies has been acquired recently from some external source such as an accreted dwarf galaxy (Davis et al., 2011). Similar results are found for ionized gas (Jin et al., 2016; Bryant et al., 2019). Of the remainder, some of the relaxed, prograde molecular gas may have been resident in its host early-type galaxy for a long time, through the galaxy’s transition to the red sequence (e.g. Davis & Bureau, 2016). Some of the molecular gas probably also originated in its current host, but made an extended detour through a hot phase in the galactic halo before condensing back into a cold phase (e.g. Russell et al., 2019; Davis et al., 2019).
These varied histories also have implications for the physical properties of the gas. If the cold gas in an early-type galaxy was accreted in a minor merger or from a relatively pristine cold flow, the metallicity and isotopic abundance patterns in the molecular gas could reflect a significantly different star formation history and stellar initial mass function (IMF) from those that produced the current stellar populations in the galaxy (Davis & Young, 2019). On the other hand, if the gas has been resident in the galaxy for a long time, gradually mixing with the mass loss material from evolved stars in the galaxy, we would expect a much tighter correspondence between the metallicity and isotopic abundances of the stars and the gas.
In this context we have been undertaking detailed studies of the chemical and physical properties of the molecular gas in early-type galaxies; these chemical and physical properties might also serve as indicators of the galaxies’ histories in a complementary manner to the information revealed by kinematics. Here we present Atacama Large Millimeter/submillimeter Array (ALMA) observations of the early-type galaxy NGC 7465, which is known to have recently accreted its cold gas (Section 2). We present 12CO (1-0) data at 0.′′8 (110 pc) resolution and 12CO, 13CO, C18O, and several other higher-density molecular tracers at 2′′ (280 pc) resolution (Section 3). We describe the millimeter continuum emission, compare it to the optical nebular emission line ratios, and estimate the ionized gas metallicity (Section 4). We also make comparisons of CO to stellar and ionized gas kinematics at matched resolution (Section 5). Quantitative analysis of the molecular line ratios, their spatial variations, and comparisons to other galaxy types (Sections 6 - 11) reveal clues to the evolution of NGC 7465 and the broader context of galaxy evolution.
2 About NGC 7465
NGC 7465 was originally selected because it is a member of the ATLAS3D sample of early-type galaxies (Cappellari et al., 2011), so there is a wealth of information about its stellar and gas content, including two-dimensional maps of its stellar kinematics, ionized gas distribution and kinematics, stellar populations, star formation history, atomic gas, and molecular gas (Krajnović et al., 2011; Young et al., 2011; Serra et al., 2012; McDermid et al., 2015, and references therein). It is one of the more CO-bright members of the ATLAS3D sample, so there is extensive information on its 12CO J=1-0 emission. Its stellar mass is and its adopted distance is 29.3 Mpc (Cappellari et al., 2011).
Though it is an early-type galaxy, NGC 7465 shows moderate levels of current star formation. Davis et al. (2014) estimated its total star formation rate from its 22µm WISE flux, giving 1.37 M⊙ yr-1 and a specific star formation rate SFR/M⋆ yr-1. These rates are low when compared to nearby spirals, placing NGC 7465 below the “star formation main sequence” or SFR–M⋆ relation (e.g. Cluver et al., 2014) but high when compared to other early-type galaxies (Davis et al., 2014). Its depletion time (SFR/Mgas) is relatively long, at 7 Gyr. Its radio and far-IR continuum emission imply a radio/FIR ratio that is also consistent with star formation activity (Nyland et al., 2017).
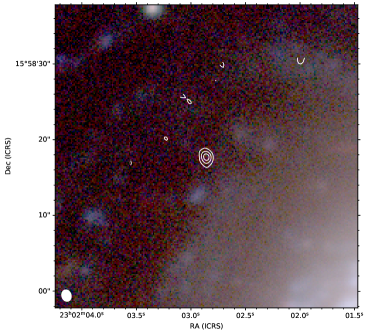
In addition to being CO-bright, NGC 7465 is notable for signatures of interactions with near neighbors NGC 7463 and NGC 7464 at projected separations 20 kpc. Though it is an early-type galaxy (an S0 galaxy and a fast rotator), it has faint blue outer arms at radii of 8 to 10 kpc (Figure 1). Its HI emission is highly disturbed and strongly misaligned with respect to the stellar body of the galaxy (Li & Seaquist, 1994; Serra et al., 2012). This kinematic evidence strongly suggests that the galaxy’s cold gas was recently acquired from some external source, and this accretion/interaction event probably drove the formation of the blue outer arms. The stellar kinematics show a kinematically-distinct core (Krajnović et al., 2011) which, as we will show, is probably not related to the most recent gas-transfer interaction. A deep -band image from Duc et al. (2015) also shows recent star formation activity in an irregular spiral structure at radii 3′′ to 20′′ ( 0.4 to 3 kpc).
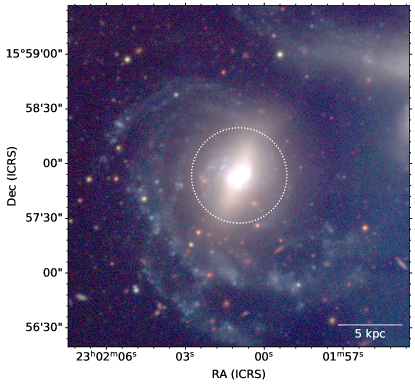
NGC 7465 is classified as a barred S0 galaxy by some (e.g. de Vaucouleurs et al., 1991), and indeed Figure 1 might be interpreted as a nearly face-on galaxy with a bar 1′ (8.5 kpc) in length. An alternative interpretation arising from the ATLAS3D dynamical analysis (Cappellari et al., 2013) is that the inner ′′ of the galaxy is an edge-on axisymmetric fast rotator and the outer blue arms are transient extraplanar structures. The primary reason for this alternative interpretation is that the inner part of NGC 7465 does not show typical kinematic features of strongly barred early-type galaxies, which are (1) large misalignments between the photometric major axis of the bar and the kinematic major axis of the stars in that region, and (2) cylindrical rotation in the stellar kinematics, yielding parallel iso-velocity contours (Krajnović et al., 2011; Lablanche et al., 2012). Additional stellar kinematic data covering a larger field of view would be helpful in distinguishing between these alternatives.
Finally, IRAM 30m observations of molecular lines in the ATLAS3D galaxies have shown that NGC 7465 has some uncommon integrated molecular line ratios (Crocker et al., 2012). Relative to 12CO, NGC 7465 has unusually faint 13CO and HCN, and it has a low HCN/HCO+ ratio. At higher resolution, these line ratios might reflect the influence of an active galactic nucleus on its surrounding medium. The galaxy contains a Seyfert or LINER nucleus (e.g. Gonçalves et al., 1999), a 5 GHz synchrotron point source (Nyland et al., 2016) and a Swift hard X-ray source (Baumgartner et al., 2013). Our new ALMA data, with additional lines and higher spatial resolution, provide a better perspective on how to interpret the molecular line ratios and connect them to the physical properties of the gas and to galaxy evolution.
3 Observations
NGC 7465 has been observed by ALMA in several projects. Here we used the Band 3 observations of 13CO, C18O, and CS in project 2018.1.01253.S (December 2018); 12CO, HCN, C2H, and HCO+ in 2016.1.01119.S (November 2016); and 12CO and CN in 2018.1.01599.S (October 2018). We used the standard pipeline-calibrated raw data and carried out continuum subtraction, imaging, and cleaning ourselves. An additional round of phase self calibration was not found to offer any improvement in the images because of the relatively modest signal-to-noise ratios. For continuum subtraction we used zero-order or first-order fits to the line-free channels in the visibility domain; for imaging, we made a wide variety of images at varying channel widths and resolutions as necessary to optimize the resolution or to match resolutions for resolved line ratios. The times on source, along with fiducial (“natural” weighting) beam sizes and rms noise levels, are indicated in Table 1 for the detected spectral lines.
Line emission in the data cubes was cleaned down to about the 1 level and primary beam corrections were applied. The 12CO integrated intensity images (e.g. Figure 1) were created by modestly smoothing the data cube in spatial and velocity dimensions and clipping on the smoothed cubes to create a velocity-dependent mask defining the volume with emission. These 12CO masks were then applied to the fainter lines for creating their integrated intensity images.
Line fluxes reported in this paper include uncertainties which are only based on the thermal fluctuations in the data, representing signal-to-noise considerations; they do not include uncertainties in the absolute flux calibration scale, such as those due to secular variability in the calibrator sources. The flux calibration of ALMA data that have been processed with standard calibration procedures is usually accurate to 5% to 10% (e.g. Martín et al., 2019; Andrews et al., 2018; Remijan et al., 2019). Line ratios between data taken in different observing setups and different tunings, such as 12CO/13CO (see Table 1), have an additional uncertainty due to this absolute flux calibration. However, line ratios between data taken simultaneously using the same setup (e.g. 13CO/C18O or HCN/HCO+) do not have this additional uncertainty.
In addition to the spectral lines mentioned above, we also have upper limits on CH3OH(), SiO(2-1; ), and HNCO. Furthermore, there is an unidentified line source in the vicinity of NGC 7465. It seems to be a galaxy at a much higher redshift, and it is described in more detail in Appendix A.
| Line | Time | Beam size | rms | |
|---|---|---|---|---|
| (sec) | (′′) | (mJy bm-1) | (km s-1) | |
| 12CO(1-0) | 1590 | 1.601.18 | 1.59 | 5.1 |
| 11733 | 0.810.74 | 0.53 | 2.6 | |
| CN(1-0) | 11733 | 0.840.76 | 0.066 | 45.0 |
| 13CO(1-0) | 3810 | 1.891.81 | 0.38 | 13.3 |
| C18O(1-0) | 3810 | 1.901.82 | 0.35 | 13.3 |
| CS(2-1) | 3810 | 2.122.04 | 0.29 | 14.9 |
| CH3OH() | 3810 | 2.182.06 | 0.35 | 15.1 |
| HCO+(1-0) | 8890 | 1.701.37 | 0.26 | 13.1 |
| HCN(1-0) | 8890 | 1.711.38 | 0.26 | 13.2 |
| HNCO | 8890 | 1.721.39 | 0.28 | 13.3 |
| C2H(N=1-0) | 8890 | 1.721.38 | 0.29 | 13.4 |
| SiO(2-1, ) | 8890 | 1.731.39 | 0.28 | 13.5 |
Note. — Beam sizes and rms noise levels refer to images made with “natural” uv-weighting and the listed channel widths. In the case of the 12CO and CN observations, the channel widths in the last column are close to the best velocity resolutions allowed by the data. For the other lines, the listed channel widths are representative but not the best possible. At a distance of 29.3 Mpc, 1′′ corresponds to 140 pc.
4 Radio continuum and ionized gas
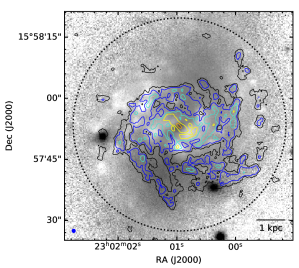
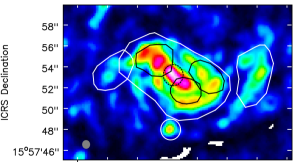
As we have observations at similar angular resolutions covering a large range of frequencies from 86 to 115 GHz (with gaps), the data are suitable for imaging the continuum intensity and estimating the spectral index of any emission. NGC 7465 has two continuum point sources, one in the nucleus and one 5′′ south of the nucleus (Figure 2). The nuclear source has a falling spectral index; its flux densities measured at 86.15 and 107.9 GHz are 742 12 Jy and 616 18 Jy, respectively. Parametrizing the flux density as therefore gives Similarly, using all of the available line-free frequencies in CASA’s multi-term, multi-frequency synthesis deconvolver (Rau & Cornwell, 2011), we find These estimates are consistent with each other and both clearly indicate synchrotron emission in the nucleus of the galaxy, which is not surprising given the other active galactic nucleus (AGN) indicators mentioned in Section 2. For comparison, Domínguez-Fernández et al. (2020) find that at 230 GHz the nuclear continuum source has a flux density of 900 200 Jy, which is broadly consistent with the flux densities measured here and suggests that in this mm regime the nuclear source’s spectrum is flattening as dust emission begins to dominate.
The fainter continuum source has flux densities of 155 12 Jy and 245 18 Jy at 86.15 and 107.9 GHz, suggesting instead a rising spectral index consistent with dust emission. It appears to be associated with a region of recent star formation activity, as indicated by a bright blue source in the image, peaks in [O III] and H emission (Ferruit et al., 2000), and a small peak in the molecular surface brightness.
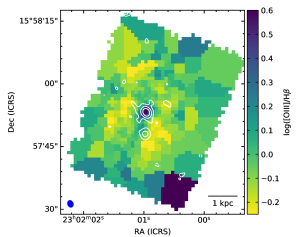
Moustakas & Kennicutt (2006) presented optical spectroscopy and measurements of the nebular emission line fluxes in NGC 7465. The nebular spectrum (from a region 2.′′5 square) has log([N II]/H) = -0.28 0.03 and log([O III]/H) = 0.44 0.03, suggesting the ionization there is dominated by the AGN (Moustakas et al., 2010). The spectrum integrated over a much larger 50′′ 60′′ rectangular region has log([N II]/H) = -0.39 0.03 and log([O III]/H) = 0.06 0.03, consistent with star formation activity. The ATLAS3D data provide more spatial information at higher resolution, though only on the [O III]/H ratio; they show an even higher ratio of log([O III]/H) = 0.62 in the nucleus, on the location of the nuclear radio synchrotron and hard X-ray sources (Figure 2). Lower ratios of log([O III]/H) from to are seen in patches at radii of 3′′ to 10′′, and while this single ratio cannot conclusively identify the source of ionization (e.g. Sarzi et al., 2010), all the data are consistent with the interpretation that the current star formation activity in the interior of the galaxy is particularly concentrated in this annular region.
The nebular emission line fluxes in Moustakas & Kennicutt (2006) also enable an estimate of the gas metallicity in NGC 7465. We use line fluxes integrated over the large 50′′ 60′′ region; following the prescriptions outlined in Moustakas et al. (2010), the emission line ratios suggest a metallicity consistent with solar. We find 12 + log(O/H) = 8.38 0.06 using the calibration of Pilyugin & Thuan (2005) and 9.0 using the calibration of Kobulnicky & Kewley (2004); each of these is consistent with its respective median of the SINGS galaxies (mostly spirals) in Moustakas et al. (2010).
5 Molecular Gas Distribution and Kinematics
5.1 Large-scale disk
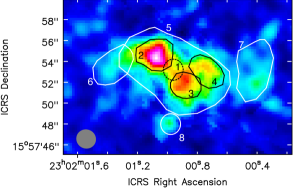
The 12CO emission from NGC 7465 (Figure 1) shows a disky structure consisting of irregular, flocculent spiral arms extending to radii of at least 20′′. Some emission is also detected beyond the half-power point of the ALMA primary beam, so it seems likely that there is significant molecular gas beyond the region that we are able to image in these datasets. This irregular disk has an axis ratio near 1, suggesting a low inclination, but its kinematic major axis is strongly twisted and asymmetric as might be expected of recently accreted gas (Figure 3). Although there is a large mismatch between the angular resolution of the HI and CO data, the CO velocity field on large scales is consistent with that of the HI (Li & Seaquist, 1994), suggesting that those two gas phases probably have a common origin.
Section 2 discusses the fact that it is not clear whether NGC 7465 is a face-on barred galaxy or an edge-on axisymmetric galaxy with extraplanar arm/ring structures. In either case, steady-state models are likely to be misleading when trying to interpret this galaxy’s kinematics. The interactions with its neighbors mean that its potential is rapidly time-varying. Either these interactions, or the perturbations caused by a bar (if one is present), might explain the non-circular motions and possible gas inflows discussed in this section. In addition, we note that dense molecular gas is found over most of the extent of the elongated structure. In a bar model, this would imply that either dense gas is present beyond the inner Lindblad resonance (ILR), contrary to expectation (e.g. Athanassoula, 1992), or alternatively that the radius of the ILR is much larger than is usual in early-type disk galaxies and it extends to almost the end of the bar and thus corotation. Overall, we therefore argue that it is problematic to interpret the gas distribution and kinematics in NGC 7465 in terms of a relaxed/steady state early-type barred disk galaxy potential.
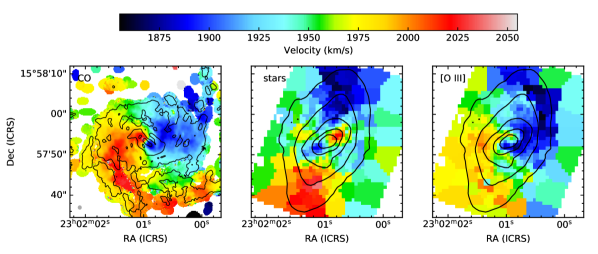
5.2 Inner kpc and decoupled core
At radii 5′′ (where we have most of our molecular line detections) the ATLAS3D stellar isophotes are flattened and their major axis is aligned to the kinematically-decoupled stellar core (KDC; Figure 3, center panel). The KDC is both photometrically and kinematically misaligned by 150° with respect to stellar structures farther out. In this region the molecular gas forms a bright ridge about 10′′ long (1.4 kpc), oriented along a northeast-southwest axis. The ridge is misaligned by about 100° with respect to the stellar KDC and 120° with respect to the stellar kinematic and photometric axes at larger radii. The molecular gas shows a strong velocity gradient along the ridge, so that the most extreme CO velocities are found along the ridge, about 1′′ from the nucleus as defined by the radio continuum position. 12CO (2-1) emission at higher resolution (Domínguez-Fernández et al., 2020) shows a patchy spiral feature that can be followed inward to a radius of 2′′ and a smaller molecular ridge 2′′ long, with a saddle at the location of the AGN. But the smaller ridge observed in (2-1) emission maintains the same orientation as the more extended ridge we observe in the present data; thus, on scales of 1′′ (140 pc) the molecular ridge is still perpendicular to the stellar KDC.
Davis et al. (2011) discussed the kinematics of ionized and molecular gas in early-type galaxies, and noted that the two phases agreed in all of the cases they studied at moderate ( 1 kpc) resolution. That is also still true in NGC 7465 for radii 2′′ (280 pc), but for smaller radii the kinematics of the ionized and molecular gas diverge. The ionized gas continues its inward twist such that at small radii the kinematic position angle of the ionized gas nearly matches that of the stellar KDC but is 45° offset from the molecular kinematic position angle. The molecular gas, on the other hand, maintains its fixed orientation nearly perpendicular to the stellar KDC. This divergence of the kinematics is suggestive of more complex noncircular motions or perhaps multiple ionization sources in the galaxy’s nucleus, such that the inner ionized gas is decoupled from the molecular gas. The ionized gas kinematics in the center of NGC 7465 may even be tracing an AGN-driven ionized outflow, and Appendix B presents a closer look at that evidence.
The mismatch between molecular and stellar kinematics in the center of NGC 7465 also means that the stellar KDC has not formed out of the molecular gas currently present in the galaxy. It must represent a previous formation event, or perhaps a much earlier episode of an extended interaction. More detailed observations of the stellar populations in the KDC would be required to date its formation (e.g. Sarzi et al., 2016).
5.3 Other molecular species in the inner kpc
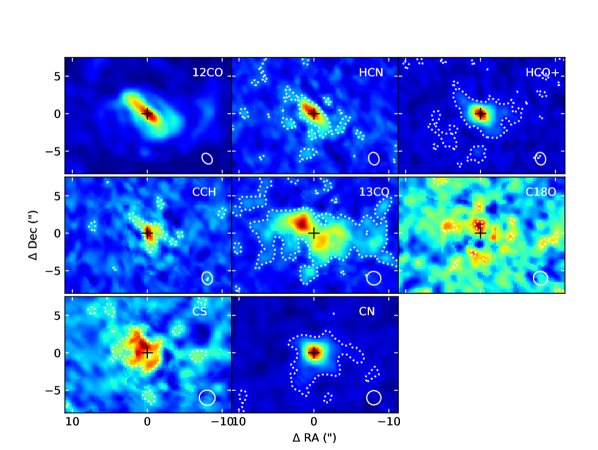
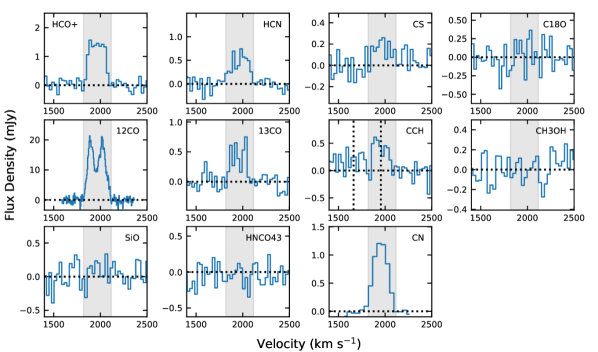
The integrated intensity maps of the other molecular lines are presented in Figure 4. To avoid biases related to the different signal-to-noise ratios, a velocity-dependent mask tracing the 12CO emission is used for all of the other spectral lines. Their distributions can be broadly classified into two major groups. 12CO, HCN, HCO+, CN, and C2H are centrally concentrated and peaked on the nucleus of the galaxy, whereas 13CO and C18O show peaks a couple of arcseconds ( 1 beam) north and east of the nucleus rather than on the nucleus itself. In 13CO, for example, the integrated intensity at the position of the nucleus is a factor of two lower than farther out along the molecular ridge. CS emission is relatively weak and while it appears to have a peak off the nucleus, the spatially-resolved ratios (Section 6) suggest that this appearance may be due to noise in the integrated intensity. Finally, HNCO, CH3OH and SiO emission are not detected in these data.
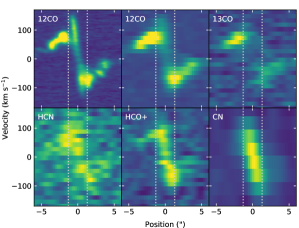
Position-velocity slices through the data cubes (Figure 5) are consistent with those from Domínguez-Fernández et al. (2020), showing the presence of two kinematic structures in the central molecular gas of NGC 7465. At radii 1.′′3 we find a nuclear ring or bar (or possibly an outflow) that is most prominent in HCO+ and CN emission, also visible in HCN and 12CO emission, and extremely weak or absent in 13CO emission. Exterior to 1.′′3 the primary structure is the warped disk, where the 13CO emission is at its brightest, and there the 13CO emission follows the 12CO emission. The appearance of a Keplerian decline in the 12CO emission in Figure 5 is an artifact of the twist in the kinematic position angle, so that at large radii this slice is closer to the kinematic minor axis than the major axis.
6 Line strengths: CO isotopologues
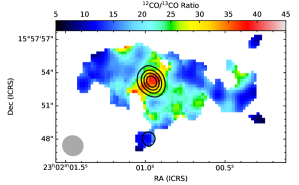
For the bright lines of NGC 7465, we can create line ratio maps from the integrated intensity images, as in Figure 6 for 12CO/13CO. For the fainter lines we measure integrated line fluxes and ratios by defining spatial regions (Figure 7), summing the cubes within the spatial regions to produce integrated spectra (e.g. Figure 8), and then summing the spectra over velocity ranges defined by the 12CO emission. This procedure ensures that the same data volume is used for both lines of a ratio, even if their signal-to-noise ratios are very different. Spatially-resolved line ratios measured in this manner are presented in Figures 9 and 10. Reference column densities for the nuclear spectrum in the optically thin and local thermodynamic equilibrium (LTE) approximations are listed in Table 2 and line fluxes for all of our defined regions are presented in Appendix C.
For an alternate method of exploring spatial variations in line ratios, we also implemented a “shift and stack” technique. In this method all of the spectra within a given annulus (about the nuclear 3mm continuum peak) can be aligned in velocity, using the 12CO velocity field at each position to determine the velocity shift. Thus all of the expected signal can be concentrated in a narrow range of frequencies. However, because of the departures from azimuthal symmetry in the center of NGC 7465, ratios produced by this technique have significantly larger uncertainties than those derived from individual regions.
| Species | Line flux | (20 K) | (90 K) |
|---|---|---|---|
| (Jy km s-1) | (cm-2) | (cm-2) | |
| 12CO | 3.52 (0.04) | 17.14 | 17.69 |
| 13CO | 0.096 (0.014) | 15.65 | 16.20 |
| C18O | 0.039 | 15.26 | 15.81 |
| HCN | 0.132 (0.012) | 12.80 | 13.37 |
| HCO+ | 0.303 (0.013) | 13.39 | 13.96 |
| CN | 0.226 (0.006) | 13.61 | 14.16 |
| CS | 0.041 (0.009) | 13.02 | 13.54 |
| C2H | 0.091 (0.014) | 14.70 | 15.27 |
| CH3OH | 0.035 | 13.95 | 14.57 |
| SiO | 0.040 | 12.79 | 13.33 |
| HNCO | 0.037 | 13.49 | 14.19 |
Note. — Line fluxes are measured in a circular region 2′′ (280 pc) in diameter, centered on the nuclear 3mm continuum source; column densities are averaged over this region. Statistical uncertainties of the line fluxes are listed in brackets, or the upper limits are quoted as 3 times the statistical uncertainty of the sum over the adopted velocity range. For 13CO the peak intensity is offset from the nucleus and a 2′′ region centered on the peak has a line flux of 0.015 Jy km s-1. Column densities are calculated for two representative temperatures in the optically thin LTE assumption. Current data do not constrain the optical depths of the HCN and HCO+ transitions, but CN and C2H are optically thin (Section 8) and even 12CO might be at this position (Section 11.1).
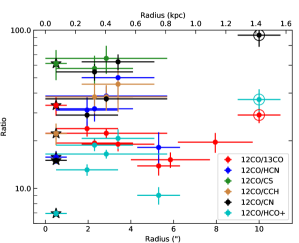
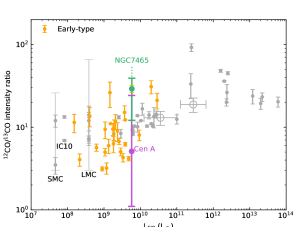
NGC 7465 has relatively weak 13CO emission. Measured 12CO(1-0)/13CO(1-0) ratios are highest at 39 9 in the nucleus, or 33 5 when averaged over a circle of 1′′ radius, decreasing to 15 2 at a radius of 1 kpc (see Figures 6 and 9).111All line ratios reported in this paper are computed using integrated fluxes expressed in temperature units (K km s-1). The large ratios in the center of NGC 7465 are higher than those typically found in nearby spirals, which tend to be in the range of 8–20 (especially on scales 1 kpc, e.g. Crocker et al., 2012; Cao et al., 2017; Cormier et al., 2018; Israel, 2020). For comparison, Figure 11 shows typical 12CO/13CO line ratios for galaxies of various types and illustrates that the high ratios in the nucleus of NGC 7465 are similar to those found in ULIRGs and advanced mergers such as Arp 220 and NGC 2623 (Brown & Wilson, 2019). Figure 11 also shows that the range of 12CO/13CO line ratios exhibited by early-type galaxies is a factor of 10, broader than the range exhibited by any other galaxy type. Other early-type galaxies known to have high 12CO/13CO ratios include NGC 1266 and UGC 09519 (Crocker et al., 2012); NGC 1266 is remarkable for having a strong AGN-powered molecular outflow (Alatalo et al., 2014), while UGC 09519 has a kinematically-misaligned HI disk that suggests it was recently acquired (Serra et al., 2014). NGC 7465 is thus consistent with the pattern that high 12CO/13CO ratios tend to be associated with major disturbances to the ISM.
NGC 7465’s strong radial gradient in 12CO/13CO is also uncommon. It amounts to a factor of two over an unresolved length scale, such that the ratios at radii 140 pc are at least a factor of two higher than those outside and possibly more. For context, the spirals in Paglione et al. (2001), Cao et al. (2017), and Cormier et al. (2018) sometimes have enhancements of 13CO in their nuclei and sometimes deficits, but none of them are as extreme as in NGC 7465. Two barred lenticular galaxies are in fact similar to spirals in this respect (Topal et al., 2016), with typical 12CO/13CO ratios about 5 to 15, and with the higher ratios in the central kpc or so; they only exhibit modest gradients of a factor of two over kpc scales. Measurements at sub-kpc resolution sometimes show spatial gradients of the same magnitude as those in NGC 7465. Meier & Turner (2004) found variations of factors of 5 over 200 pc in the center of NGC 6946, but unlike NGC 7465, the spiral shows an enhancement of 13CO in its center. The strong deficit of 13CO in the center of NGC 7465 is more reminiscent of the nearby early-type galaxy Cen A, where McCoy et al. (2017) find 12CO/13CO 20 in the circumnuclear disk at radii 200 pc and 12CO/13CO reaching nearly to unity farther out in the arms.
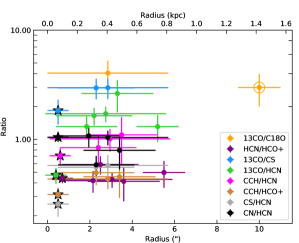
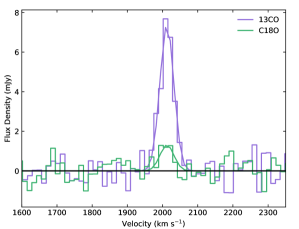
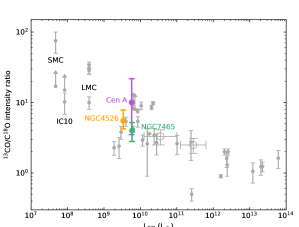
Measurements of 13CO/C18O in NGC 7465 are limited to a few spatial regions with detections of C18O (e.g. Figure 12). In a large spatial region defined by all of the detected 12CO emission, we have a tentative detection of C18O yielding 13CO/C18O = 3.0 1.0. The bright molecular ridge has a ratio of 4.0 1.2. Figure 13 shows that these ratios are similar to those of galaxies of comparable IR luminosity (e.g. Jiménez-Donaire et al., 2017). Further interpretation of the CO isotopologue line ratios is in Section 11.
7 High-Density tracers
Figures 9 and 10 show that, as expected, the emission from HCN, HCO+, and C2H is enhanced relative to 12CO and 13CO in the center of NGC 7465. This pattern is common in nearby galaxies and is expected to be driven by higher gas densities in the centers (e.g. Jiménez-Donaire et al., 2019). We also observe radial trends in C2H/HCN and C2H/HCO+, in the sense that C2H is more strongly enhanced just outside of the nucleus than in the nucleus itself. HCN/HCO+ and 12CO/CS are effectively constant wherever we can measure them, but CS/HCN increases with radius. All of these results are discussed in greater detail below.
7.1 HCN and HCO+
Relative to 12CO, NGC 7465 has fairly typical HCN brightness compared to other nearby galaxies. Specifically, 12CO/HCN in Figure 9 ranges from 16 1 to 50 15. These ratios are very similar to their analogs measured in the nearby spirals of the EMPIRE survey by Jiménez-Donaire et al. (2019) and in two other lenticulars by Topal et al. (2016). The EMPIRE data have somewhat lower linear resolution (1 to 2 kpc) than our measurements in NGC 7465 (240 pc) but in all of these cases the disks are well resolved.
In contrast, the HCN in NGC 7465 is relatively faint compared to that in a larger sample of early-type galaxies; in the unresolved single-dish measurements of Crocker et al. (2012), NGC 7465 has the highest 12CO/HCN ratio of the sample. The unresolved measurements undoubtedly fold in some radial gradients, so it is difficult to make detailed comparisons at different scales and it would be worthwhile to obtain additional resolved 12CO/HCN measurements in early-type galaxies.
The large difference in critical or effective density between CO and HCN implies that observed ratios like 12CO/HCN encode information about the density distribution of the molecular gas, or equivalently the relative proportions of low-density and high-density gas (e.g. – cm-3 vs. – 106 cm-3; Meier & Turner, 2012; Leroy et al., 2017). Thus, NGC 7465 has a mix of low/high-density gas which is typical of most nearby spirals, but it is relatively deficient in high-density gas compared to many other local early-type galaxies. The proportion of high-density gas is maximized in the nucleus but is also high towards the southern continuum source, where we find the second-lowest 12CO/HCN and 12CO/HCO+ ratios in the galaxy as well as some of the lowest reliably-measured 12CO/13CO ratios. This region must contain a concentration of dense gas with relatively high CO optical depth.
Relative to 12CO, NGC 7465 is exceptionally bright in HCO+ emission when compared to nearby galaxies. We measure local 12CO/HCO+ ratios from in the nucleus to in the disk. In comparison, the spiral galaxies of the EMPIRE survey usually have 12CO/HCO+ even in their nuclei (Jiménez-Donaire et al., 2019). Thus, the regions of NGC 7465 with the faintest HCO+, at radii kpc, still have brighter HCO+ than is common even in the nuclei of the spirals. It is also notable that the HCO+ emission in the nucleus of NGC 7465 has a dramatically different line shape than 12CO (Figure 8), which probably reflects differing spatial distributions.
7.2 HCN/HCO+
Because HCO+ is so bright, the HCN/HCO+ ratios in NGC 7465 are low; they are significantly everywhere we are able to measure them, and this is unusual for nearby galaxies. We measure HCN/HCO+ = 0.44 0.04 in the nucleus, with ratios elsewhere ranging up to 0.60 0.11. In nearby galaxies it is much more common to find HCN/HCO+ 1 (e.g. Jiménez-Donaire et al., 2019; Topal et al., 2016). Ratios 1 are seen in restricted parts of a few spirals (e.g. parts of NGC 4254 and Maffei 2; Meier & Turner, 2012; Gallagher et al., 2018). Low ratios of HCN/HCO+ 0.5 are occasionally seen in other early-type galaxies (Crocker et al., 2012) and more commonly in ULIRGs and starburst galaxies (e.g. Baan et al., 2008; Krips et al., 2008; Privon et al., 2015; Sliwa & Downes, 2017). Extremely low HCN/HCO+ ratios 0.2 have been measured in dwarf galaxies like the LMC and IC 10 (Seale et al., 2012; Braine et al., 2017; Kepley et al., 2018; Anderson et al., 2014). In this respect, NGC 7465 has more in common with starburst or dwarf galaxies than with nearby spirals. The low HCN/HCO+ and HCN/CO ratios in NGC 7465 also place it firmly amongst the nuclear starburst galaxies and “composite” Seyferts in the HCN(1-0) diagnostic diagram of Kohno et al. (2001).
Spatial variations in the HCN/HCO+ ratios of NGC 7465 do not significantly exceed the ratios’ mutual statistical uncertainties, so there is no compelling evidence for a radial gradient (Figure 10). Even though there is an AGN in NGC 7465, there is definitely no enhancement in HCN/HCO+ towards the nucleus, unless it is on length scales of tens of pc where it would be obscured by our spatial resolution. There is certainly nothing like the factor of 2 rise in HCN/HCO+ seen in the central 0.5 kpc of NGC 1068 (Viti et al., 2014).
7.3 Physical properties of the dense molecular gas
Due to the difference in critical densities, the HCN/HCO+ line ratio is most commonly interpreted as an indicator of density in the high-density ( cm-3) portion of the molecular gas. However, for the lowest HCN/HCO+ line ratios in the LMC, Anderson et al. (2014) have appealed to a combination of low density and low gas-phase metallicity, with low metallicity contributing in two ways. First, lower heavy element abundances will produce lower column densities of these species and smaller optical depths in their transitions, which is necessary for the line ratio to deviate from 1. On top of that, lower metallicities are associated with lower [N/O] abundance ratios (van Zee & Haynes, 2006), which might manifest as lower abundances of HCN relative to HCO+ (Braine et al., 2017).
NGC 7465 does not have a low metallicity (Section 4), so there is no reason to assume a low [N/O] ratio a priori. However, the observed line ratios in NGC 7465 do constrain the abundance ratio [HCN/HCO+] to be significantly smaller than that inferred for NGC 253 by Meier et al. (2015), which was [HCN/HCO+] 5. In LTE, reproducing our observed line ratios of HCN/HCO+ = 0.44 0.04 requires an abundance ratio [HCN/HCO+] (Table 2).222We adopt the convention that ratios written without brackets (e.g. HCN/HCO+) refer to measured line ratios whereas ratios inside square brackets (e.g. [HCN/HCO+]) refer to estimated molecular abundances after correcting for optical depth and excitation effects. In the more likely situation that LTE does not apply, we make calculations using the RADEX large velocity gradient code (van der Tak et al., 2007) to account for optical depth and excitation effects on the HCN/HCO+ line ratio; broad ranges of parameters will reproduce the data from NGC 7465 but they always require an abundance ratio [HCN/HCO+] and a ratio of 5 is ruled out as it cannot reproduce the line ratios in NGC 7465. For an assumed [HCN/HCO+] = 3, relatively low densities cm-3 are required to reproduce the observed line ratios. Thus, even though the metallicity of NGC 7465 is not low enough to suggest unusually low N abundance, the observed HCN/HCO+ line ratios in NGC 7465 are best explained with a combination of relatively low-density gas and/or a relatively low HCN abundance (or enhanced HCO+). More specific estimates of the density and temperature will require additional transitions or isotopologues, but the inference of a low HCN abundance is robust to other variations in physical properties.
Viewing the molecular gas as two “phases” – a more diffuse phase with densities to cm-3 traced by CO, and a denser phase cm-3 traced by HCN and similar species – the strong spatial trends in diffuse/dense gas tracers suggest that the relative proportions of the two phases change with radius in NGC 7465. However, the internal properties of the denser phase do not seem to change, even though the properties in the more diffuse phase are dramatically varying (Section 11.1).
8 C2H and CN: photodissociation regions
The C2H molecule is regarded as a tracer of photon-dominated or photodissociation regions (PDRs), as its formation is driven by the presence of C+, and it has been shown to be brighter on the illuminated sides of molecular clouds (e.g. Meier & Turner, 2005, 2012; Meier et al., 2015; García-Burillo et al., 2017). The two main fine structure blends in our data are , , with a rest frequency of 87.3169 GHz, and , , at 87.40199 GHz. They are separated by 292 km s-1, which is just greater than the velocity range covered by 12CO in NGC 7465, so they are not overlapping. The low-frequency component is detected in NGC 7465 but the high-frequency component is not; as the high-frequency component is a factor of 2.3 fainter in LTE in the optically thin limit, its nondetection is not surprising, but we can rule out line ratios 1 (the optically thick limit). Thus we cannot measure the C2H optical depth directly but the data are consistent with the transitions being optically thin. Further, the C2H line fluxes quoted in this paper refer only to the blend at 87.32 GHz.
The C2H emission in NGC 7465 is relatively bright, when compared to HCN. We find C2H/HCN ratios ranging from 0.71 0.13 in the nucleus to 1.0 0.2 in the outer parts of the molecular ridge. These are significantly higher than the corresponding ratios in the central kpc of NGC 253, which range from 0.17 to 0.47 ( 15%; Meier et al., 2015). The C2H/HCN ratios in NGC 7465 are also on the high side when compared to the set compiled by Martín et al. (2014) for active and starbursting galaxies. On the other hand, ratios of C2H/HCO+ in NGC 7465 are very similar to those in NGC 253 and other galaxies. We find 0.31 0.05 to 0.50 0.11 in NGC 7465, where Meier et al. find 0.20 to 0.57 ( 15%) in NGC 253 and most of the sample galaxies in Martín et al. (2014) show a similar range. These results suggest that HCN emission in NGC 7465 is relatively faint because of moderate densities in the molecular gas; both C2H and HCO+ are relatively prominent because their critical densities are a factor of 10 lower than that of HCN.
In addition to being bright, the C2H emission in NGC 7465 is also notable in that the radial trends of C2H/HCN and C2H/HCO+ in NGC 7465 are opposite to the trends in NGC 253. In the spiral those ratios peak at the nucleus; in other words, C2H is more strongly concentrated than HCN and HCO+ are. In NGC 7465 it is the opposite – C2H is less centrally concentrated than HCN and HCO+. The radial trend in NGC 7465 thus suggests enhanced C2H emission just outside of the nucleus, at radii 2′′ to 5′′ or 280 to 700 pc (as far out as we can detect C2H). If the C+ ionization is indeed dominated by star formation activity, this radial trend might be consistent with the ionized gas emission line ratios in Figure 2 (Section 4): the lowest [O III]/H ratios (most suggestive of star formation activity) occur slightly outside the nucleus at radii 3′′ to 10′′. Similarly, from the stellar population analysis of Krajnović et al. (2020), there is a suggestion that the smallest stellar ages occur at a radius of 2.′′5 rather than at larger or smaller radii.
As another tracer of C+, we note that NGC 7465 is also detected in [C II] 158µm emission (Lapham et al., 2017), though the spatial resolution is not good enough to compare to the radial trends in our ALMA data. Many spiral galaxies are known to have significant central deficits of [C II] emission at radii 1 kpc, and many potential explanations have been proposed (e.g. Smith et al., 2017). Possibly, in some cases, the central [C II] deficit arises because an AGN’s hard radiation field drives the ionization balance towards C2+; in other cases, a softer radiation field (caused by old stellar populations) may be driving the ionization balance towards neutral carbon. At present we simply comment that the central C2H deficit in NGC 7465 (relative to HCN and HCO+) might be consistent with what is known about the ionization states of C in other galaxy nuclei.
The CN(1-0) transition is also a PDR tracer (Boger & Sternberg, 2005), though it is expected to be even more strongly enhanced in X-ray dominated regions (XDRs) and may thus help to distinguish between PDRs and XDRs (Meijerink et al., 2007). It has fine structure components that appear in these data as blends with rest frequencies of about 113.17 GHz and 113.49 GHz; they are clearly separated in our data and both are clearly detected. The high-frequency blend is the brighter one and there is no evidence that their line ratio in NGC 7465 ever deviates from the theoretical optically thin limit of 2 (e.g. Meier et al., 2015). Thus, the CN emission in NGC 7465 is optically thin. For simplicity, we show only the brighter component in the figures and the line fluxes we quote refer only to it.
The range of 12CO/CN ratios we measure in NGC 7465 is large, from in the nucleus to when averaged over the full 12CO emission region, and it is consistent with the wide range of ratios measured in other nearby galaxies (Wilson, 2018). CN/HCN ratios are consistent with 1 aside from one region, and this again is very typical of local galaxies (Ueda et al., 2017; Cicone et al., 2020).
There is some evidence that CN is even more centrally concentrated in NGC 7465 than the other high-density tracers like HCN. The radial variations of 12CO/CN exceed those of all other 12CO ratios (Figure 9). The transition in line profile shapes, from double-peaked 12CO through flat-topped HCO+ to centrally-peaked CN (Figures 8 and 5), might thus suggest the presence of a high-density circumnuclear disk at pc. CN might be particularly enhanced close to the AGN because of its X-ray sensitivity (Meijerink et al., 2007). Higher resolution data, especially for CN, would be valuable for testing this scenario. As a caveat we note that the current data do not show a measurable radial trend in CN/HCN (Figure 10), but such a trend could be obscured by the resolution and sensitivity of our data. We do find a systematic difference in the spatial distribution of the two PDR tracers, C2H and CN; C2H is less centrally concentrated than HCN whereas CN is equally or possibly more centrally concentrated than HCN. The differences between these two species might be consistent with an interpretation that C2H is a better tracer of star formation activity whereas CN is a better tracer of XDRs.
9 CS
The CS molecule is also a high-density tracer, whose transition has a critical or effective density intermediate between those of HCN and HCO+ (e.g. Leroy et al., 2017). There is also some evidence that CS emission is enhanced in PDRs, where the radiation field is stronger (Lintott et al., 2005; Meier & Turner, 2005), which has motivated suggestions that CS emission traces massive star formation even better than HCN emission does (e.g. Bayet et al., 2009; Davis et al., 2013).
NGC 7465 has 12CO/CS ratios that are fairly typical compared to those of other nearby galaxies. We find 12CO/CS = 62 13 in the nucleus, with variations of no more than 25% in all of the regions where we detect CS. For comparison, the spirals in Gallagher et al. (2018) have typical ratios of 12CO/CS 90 in their central kpc, so NGC 7465 is brighter in CS than these. However, it is faint in CS compared to the other early-type galaxies in Davis et al. (2013), which have 12CO/CS in the range of 9 to 44. The spatially-unresolved (IRAM 30m) ratios in Davis et al. (2013) might also be biased high if the beam-filling factor of 12CO is higher than CS, so that resolved measurements of CS would probably increase the discrepancy between them and NGC 7465.
CS/HCN, which should provide better insight (than 12CO/CS) into the properties of the dense molecular phase, is very similar in NGC 7465 to other nearby galaxies. We find 0.26 0.06 in the nucleus of NGC 7465 and 0.57 0.14 for the larger regions that extend to 0.8 kpc. These ratios are consistent with those in the spirals Maffei 2 and NGC 253 (0.2 to 1; Meier & Turner, 2012; Meier et al., 2015). The spirals in Gallagher et al. (2018) also typically have CS/HCN 0.1 to 0.3, with localized ratios up to 0.5 in the central 200 pc of NGC 3627 or the arms of NGC 4321. CS/HCN in NGC 7465 is also consistent with the single-dish measurements of some other early-type galaxies in Davis et al. (2013). It is notable that others of the early-type galaxies in that sample have highly unusual ratios of CS/HCN as large as 3, so that bright CS emission might be a feature of some early-type galaxies.
In terms of radial trends, it is striking that the nucleus of NGC 7465 does not differ from the off-nuclear regions in terms of 12CO/CS; in contrast, there are strong radial trends of factors of 2–4 in 12CO/HCN, 12CO/HCO+, 12CO/C2H and 12CO/CN. We also find no radial variation of HCN/HCO+ but a factor of two in CS/HCN. If the density of the molecular gas were the only factor driving changes in those line ratios, we would expect HCN, HCO+, and CS to behave in qualitatively the same fashion as the critical density of CS is intermediate between those of HCO+ and HCN. Evidently, then, we require more than simple density variations to explain the behavior of these high-density tracers in NGC 7465.
Davis et al. (2013) have also studied unresolved CS emission in a small sample of early-type galaxies. They compared it to [O III]/H, which can serve as an indicator of whether the ionization in the optically-emitting ionized gas is dominated by AGN activity or star formation (see also Section 4). In their early-type galaxies, the global [O III]/H ratio is correlated with CS/HCN in the sense that galaxies whose ionization is more dominated by star formation (smaller [O III]/H; softer radiation fields) have higher CS/HCN. NGC 7465 is consistent with this trend, both in terms of its integrated line ratios and its internal spatially-resolved behavior, for which we find higher CS/HCN and lower [O III]/H (and bluer optical colors) at 0.5 to 1 kpc than towards the nucleus. NGC 7465 thus provides circumstantial evidence supporting the interpretation that CS emission is enhanced by PDR conditions.
For the ionized gas metallicity estimates in Section 4 and the column density estimates in Table 2, NGC 7465 is also consistent with the suggestions of Bayet et al. (2012) and Davis et al. (2013) that CS/HCN could be used as an indicator of the metallicity of the molecular gas. Future work on spatially-resolved nebular emission line data might also be valuable to test whether the trend in Davis et al. (2013) also applies within individual galaxies.
10 Shock tracers
Emission from SiO, CH3OH, and HNCO is commonly interpreted as tracing shocks in the ISM (e.g. Meier & Turner, 2012; Meier et al., 2015), as significant energy input in the form of shocks is required to liberate them from grain surfaces. These molecules are not detected in NGC 7465, with the most stringent limits being 12CO/(SiO, CH3OH, or HNCO) 83 near the center of NGC 7465. Ratios relative to 12CO are not particularly significant in terms of a physical interpretation, but here merely serve as an indication of the relative faintness of the lines compared to detections in other galaxies. For context, in NGC 253, Meier et al. (2015) found spatially-resolved ratios of 12CO/SiO and 12CO/HNCO 20 to 80; NGC 253 thus has brighter SiO and HNCO than NGC 7465, by at least a factor of 4 relative to 12CO. The circumnuclear disk of NGC 1068 has 12CO/SiO = 12.5 1.5 (García-Burillo et al., 2010), which again is at least a factor of 7 brighter in SiO than NGC 7465. Finally, Topal et al. (2016) also measured 12CO/HNCO = 66 5 and 78 18 in the centers of the lenticulars NGC 4710 and NGC 5866. Thus, these two also have modestly brighter HNCO than NGC 7465.
For CH3OH, Davis et al. (2013) detected a small sample of early-type galaxies with unresolved measurements of 12CO/CH3OH in the range 14 to 70. As we measure 12CO/CH3OH 83, we conclude that NGC 7465 is also relatively faint in CH3OH emission. Similarly, unresolved measurements of CH3OH/HCN reach as high as 1.5 to 2.2 in the early-type galaxies NGC 6014 and NGC 5866 (Davis et al., 2013), whereas the resolved upper limits in NGC 7465 are 0.2 to 0.8.
In short, SiO, CH3OH, and HNCO are relatively weak in NGC 7465 compared to other galaxies that have been studied to date. The relatively weak emission from these shock tracers is a bit surprising, given the obvious disturbances in the galaxy (Sections 2 and 5). The molecular and HI disks are strongly warped and their kinematics are significantly misaligned with respect to those of the stars, so it is clear that the gas was recently acquired from an external source. We might have expected stronger emission from shock tracers as the gas disk is still in the process of settling; possibly the shocks are primarily occurring farther out in the galaxy, where our sensitivity is not currently good enough to detect the shock tracers.
11 Discussion: constraints on abundances and galaxy evolution
11.1 CO isotopic ratios in NGC 7465
Figure 11 shows that the center of NGC 7465 boasts an unsually high 12CO/13CO line ratio; it is reminiscent of the ratios commonly observed in LIRGs and ULIRGs rather than those in spirals and other early-type galaxies. It also constrains the [12CO/13CO] abundance in the nucleus of NGC 7465 to be 39 9, which is consistent with most measurements in the disk of the Milky Way, in other nearby spirals, and in part of the LMC (e.g. Johansson et al., 1994; Meier et al., 2008; Romano et al., 2019, and references therein). However, it is incompatible with the very low abundance ratios of [12C/13C] = 9 ( 2), 21 ( 6), and 24 ( 1) estimated in the centers of NGC 4945, NGC 253, and the Milky Way (Langer & Penzias, 1990; Tang et al., 2019; Martín et al., 2019). Thus, the chemical enrichment pattern in the central molecular gas of NGC 7465 differs from the pattern in these nearby spirals.
The smaller 13C abundance in the center of NGC 7465 is plausibly connected with the clear signs of gas accretion, as the gas currently in the center of NGC 7465 was recently in a different galaxy and possibly in the outskirts of that galaxy. For context, the stellar dynamical analysis of Cappellari et al. (2013) implies a maximum circular rotation speed of 163 km s-1, so the orbital time at the outer edge of the molecular arms in our data (15′′ or 2.1 kpc) is 80 Myr. It may have taken a few orbital times for the gas to make its way inward to the center of the galaxy, and this timescale is comparable to or shorter than the timescale for significant 13C production (e.g. Romano et al., 2019).
Low inferred optical depths in 12CO(1-0) (see below) also imply that both 13CO and C18O are optically thin and thus the measurements of [13CO/C18O] in NGC 7465 are 2.98 0.99 and 4.0 1.2. These measurements are made in overlapping regions so they are not independent.
The optical depths of the CO transitions also convey information about the physical properties of the molecular gas, and if the [12CO/13CO] abundance ratio in the center of NGC 7465 is in the typical range of 40–60, then the 12CO emission is unusually optically thin. We thus consider several possible explanations for the unusually high 12CO/13CO line ratio in the center of NGC 7465 and its strong radial gradient.
(1) Unusual isotopic abundances due to a burst of star formation? Away from the nucleus, the 12CO/13CO and 13CO/C18O line ratios in NGC 7465 are similar to those in nearby spirals. But a very recent burst of star formation in the center of the galaxy would affect the isotopic abundances, as 13C in particular comes from low-mass stars with long lifetimes and a region undergoing a starburst might therefore be deficient in 13C. Indeed, this effect probably contributes to the exceptionally high ratios of 12CO/13CO 90 in the advanced merger NGC 2623 (Brown & Wilson, 2019). In NGC 7465, although there is some current star formation activity in the central kpc (Sections 2 and 4), the star formation rate is modest compared to what we usually think of as starbursts. The luminosity-weighted mean stellar ages are younger in the center of the galaxy (Krajnović et al., 2020) but neither the ages themselves nor the radial gradient in stellar ages are unusual even for early-type galaxies. Ultimately a full multi-level isotopic abundance study would be necessary to resolve the question, but with current data the motivation for assuming unusual isotopic abundances in NGC 7465 is not compelling.
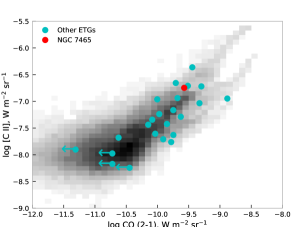
(2) Unusual molecular abundances due to fractionation or photodissociation of the rarer isotopes? The photodissociation of CO and H2 molecules usually proceeds through absorption-driven excitation, meaning that the molecules can shield themselves from photodissociation if they have sufficient column densities to make the relevant UV transitions optically thick. 13CO and C18O molecules should then be found deep within the dark interior of a molecular cloud, in the same way (but more so) that 12CO molecules should be found deeper than H2 and there may be a skin of CO-dark H2 around a UV-illuminated cloud. However, this isotope-specific photodissociation is probably not the explanation for the high 12CO/13CO ratio in the center of NGC 7465. The C18O species should be even less abundant than 13CO (e.g. Meier et al., 2008; Romano et al., 2019). Thus, photodissociation effects predict that unusually large 12CO/13CO line ratios should also be accompanied by unusually large 13CO/C18O ratios, which we do not find in NGC 7465 (Figure 13). We further note that the center of NGC 7465 does not exhibit particularly unusual levels of photodissociation in general, as its [C II]/CO line ratio is typical for nearby spiral galaxies (Figure 14). Finally, Viti et al. (2020) argue that fractionation is unlikely to be a significant effect for the CO isotopologues in typical conditions, though it may be more important for other molecular species.
(3) Variations in the physical properties of the gas? The spatial variation of 12CO/13CO, with higher ratios in the central 100 pc of the galaxy (Figure 6), suggests that the optical depth of both molecular species is lower in the center. For typical abundances and conditions, the optical depth of 12CO (1-0) must change by a factor of a few such that it is at 1 kpc and , possibly as low as 0.1, at 100 pc. Thus, while the 12CO column density estimates in Table 2 are underestimates, they are not as far off as usually assumed, and they are probably less than a factor of 2 too low. Further, the inferred variations of optical depth could be plausibly explained by radial variations of the temperature and/or density of the molecular gas.
Bayet et al. (2013) used the and transitions of 12CO and 13CO to constrain the densities and temperatures of the molecular gas in 18 early-type galaxies, including NGC 7465. They found the most probable conditions for NGC 7465 to be in the range to cm-3 and 80 to 150 K. Notably, these are the highest temperatures inferred for the sample of 18. These estimates are based on single-dish spectra, so they are spatially unresolved and dominated by the conditions at small radii where the emission is brightest. However, for these densities and temperatures, calculations using the RADEX code (van der Tak et al., 2007) suggest that increases in the temperature of a factor of 3 (e.g. from 30 K to 90 K) could account for the larger 12CO/13CO 1-0 ratio in the central 100 pc of NGC 7465. Density changes could have a similar effect on 12CO/13CO but would then also produce a factor of at least 2 variation in HCN/HCO+, which we have ruled out. Therefore, unless the CO-emitting gas is completely disconnected from the HCN-emitting gas, temperature variations are more likely than density variations to explain the 12CO/13CO gradient in NGC 7465. On the other hand, Bayet et al. (2013) did not make use of resolved kinematic information or the fact that the molecular line widths all increase dramatically towards the nucleus of NGC 7465, which can also affect the line ratios and is discussed in more detail below.
(4) Lower opacity due to higher line width? It is striking that the highest 12CO/13CO ratios in NGC 7465 are coincident with the largest linewidths and strongest local velocity gradients in the galaxy (Figure 5; Appendix B). The 12CO line profiles in the disk at radii of 5′′ to 20′′ (0.7 to 2.8 kpc) have full widths at half maximum (FWHM) of 23.5 5 km s-1, whereas the line profiles in the nucleus are much broader and double-peaked (Figure 8). At 0.′′8 (110 pc) resolution, the line profile toward the nucleus has a FWHM of 230 km s-1; that is 10 times larger than in the disk of the galaxy. And since the optical depth of a transition depends on the ratio of the total column density to the line width (e.g. Paglione et al., 2001; van der Tak et al., 2007), such a dramatic increase in the line width could produce a corresponding factor of 10 decrease in the optical depth and a rise in the 12CO/13CO ratio.
With the present data it is not possible to distinguish whether the 12CO optical depths in NGC 7465 are more significantly affected by temperature changes or increases of the line widths. Some of the line profiles in the centers of the lenticulars NGC 4710 and NGC 5866 have similarly large linewidths to NGC 7465 but they do not have unusually large 12CO/13CO ratios (Topal et al., 2016). Thus, it’s not yet clear what the difference is between these cases and NGC 7465. Additional data on higher-energy transitions would help distinguish between the possibilities.
For context, some authors have suggested that mechanical feedback from star formation increases local velocity dispersions in molecular gas, produces low-density, diffuse gas, and contributes to increases in 12CO/13CO ratios near regions of active star formation (e.g. Tan et al., 2011). But in most spirals the variations of linewidths and 12CO/13CO have smaller magnitude than we find. Conversely, other studies of early-type galaxies have found that dynamically regular, relaxed disks in high-density environments like the Virgo Cluster tend to have low 12CO/13CO ratios, and those could be due to a combination of relaxed kinematics and ram-pressure stripping of low-density gas (e.g. Crocker et al., 2012; Alatalo et al., 2015).
AGN-driven outflows might also disturb their surrounding molecular gas, increasing its linewidths and its 12CO/13CO line ratios (e.g. NGC 1266, Crocker et al., 2012). Further inspection of the 12CO/13CO ratios in Figure 6 shows that the ratios are high (the optical depths are low) not just towards the AGN but also in a band stretching along the minor axis of the molecular ridge. In combination with the unusually misaligned gas kinematics in the center of the galaxy (Figure 3; Appendix B), this pattern in the 12CO/13CO ratio image suggests that there might be a modest-velocity ionized gas outflow from the AGN stirring up the gas along the minor axis of the molecular ridge.
11.2 Implications of the CO isotopic abundances for galaxy evolution
Comparisons of the stellar and gas kinematics in early-type galaxies provide clear evidence that much – perhaps as much as half – of the gas in early-type galaxies has been acquired from some outside source, after the main stellar body was in place (Sarzi et al., 2006; Davis et al., 2011; Bryant et al., 2019). Additional detailed work on the gas/dust ratios and associations with morphological disturbances suggests that most of the “outside sources” are minor mergers with mass ratios (Kaviraj et al., 2012; Davis et al., 2015). In some cases there are also additional clues about the origin of the gas from similarities or differences between the metallicities of the gas and the stars; for gas accreted in a minor merger, one might expect the metallicity of the accreted gas to be lower than the metallicity of the bulk of the stars (Griffith et al., 2019; Davis & Young, 2019).
NGC 7465 clearly did acquire its cold gas from an external source, given the kinematic mismatches between the CO, HI, and the stars. But the gas probably did not come from a dwarf galaxy in a minor merger. The large HI content (9.5 M⊙; Serra et al., 2012) is most consistent with the gas coming from a large spiral galaxy. Indeed, there are several other similarly gas-rich galaxies still in its group (Li & Seaquist, 1994; Serra et al., 2012). Furthermore, the metallicity of the ionized gas in NGC 7465 is consistent with that of a spiral rather than a dwarf (Section 4). And finally, the inferred CO isotopic ratios in NGC 7465 are also consistent with it having captured its molecular gas from a spiral. Its 13CO/C18O ratios are entirely unremarkable for spirals; its nuclear 12CO/13CO line ratio is a factor of 2 to 3 higher than is common in spirals, but the measurement can be plausibly attributed to high temperatures and/or large linewidths rather than to abundance variations.
For other early-type galaxies with smaller gas masses, CO isotopic ratios may serve as an important complement to metallicity for identifying the original host of their external-source cold gas. Or, indeed, for early-type galaxies with relaxed prograde gas, these indicators should help identify externally-sourced cold gas even when the kinematics are inconclusive. As 13C is a slow-release element with significant production in low- to intermediate-mass stars, it may retain signatures of an external origin longer than 12C or 18O, and possibly also longer than kinematic disturbances (e.g. if the gas is now located in the interior of the galaxy where dynamical timescales are short).
Figures 11 and 13, which are motivated by the discussions in Taniguchi & Ohyama (1998), Zhang et al. (2018), and Méndez-Hernández et al. (2020), illustrate that ULIRGs and sub-mm galaxies tend to have high 12CO/13CO line ratios and low 13CO/C18O ratios . In fact, there also appears to be a strong correlation between these line ratios and the total FIR luminosity of a galaxy. The cause of such a correlation is not obvious; presumably the total FIR luminosity of a galaxy is a proxy for other properties that are more fundamental. Zhang et al. (2018) argued it is a proxy for the IMF, though Romano et al. (2019) cast doubt on that interpretation given the highly uncertain production rates of 18O.
In any case, a thorough understanding of the chemical evolution of galaxies requires that we should be able to connect the sub-mm galaxies at at the highest luminosities in Figures 11 and 13, to their descendants in the local universe. It is usually assumed that the sub-mm galaxies have actual abundance ratios [13CO/C18O] 1 to 2, just like their observed line ratios, because their high 12CO/13CO line ratios indicate that 13CO and C18O should be optically thin (e.g. Danielson et al., 2013; Sliwa et al., 2017). Over time the 13C abundance should increase due to its production in low- to intermediate-mass stars. And as the sub-mm galaxies already have stellar masses typically to M⊙ at (Boogaard et al., 2019), their modern-day descendants will be amongst the most massive local galaxies. But large galaxies in the local universe tend to have higher ratios of [13CO/C18O] or [13C/12C][16O/18O] around 5 to 6 (e.g. Martín et al., 2019; Harada et al., 2018; Romano et al., 2019). Whether the chemical evolution models can reproduce these kinds of variations on the appropriate timescales depends a great deal on their assumptions, particularly involving the production of the rare isotopes (Romano et al., 2019). Further isotopic observations of massive early-type galaxies, particularly those that might have retained their molecular gas through the cosmic star formation peak and through their transition to the red sequence, would be useful for testing the chemical evolution models.
On a related note, Bayet et al. (2012) and Davis et al. (2013) have argued that the [HCN/CO] abundance ratio might be a useful indicator of -element enhancement in molecular gas. As this enhancement is common in the stellar populations of early-type galaxies, studies of [HCN/CO] and [HCN/CS] abundance ratios (Section 9) could provide additional chemical clues to the evolution of early-type galaxies and the origin of their gas.
12 Summary
We present spatially-resolved molecular line observations of NGC 7465, an unusually gas-rich early-type galaxy that recently acquired M⊙ of atomic and molecular gas in an interaction with another galaxy. Its disturbed kinematics indicate that the gas is still in the process of settling and migrating inward. We analyze ALMA observations of 12CO (1-0) at 0.′′8 resolution (110 pc) plus the 3mm lines of 13CO, C18O, HCO+, HCN, CN, C2H, and CS at 2′′ resolution (280 pc) and the continuum emission. Besides NGC 7465, the data reveal an unidentified line source with a relatively bright peak line flux density of 2.5 mJy; it is probably a galaxy at or 1.4.
We find two 3mm continuum sources in NGC 7465; the brighter one is a nuclear synchrotron source associated with the AGN that is also detected in low-frequency radio and hard X-ray emission. The fainter one is associated with molecular clouds and star formation activity, traced by local peaks in 12CO, 13CO, HCN, HCO+, and CS (though not CN).
The 12CO (1-0) distribution at 0.′′8 resolution (110 pc) shows a low-inclination flocculent disk with a strong kinematic position angle twist spiraling inwards to a linear ridge or bar-like feature where the highest velocities are found. In the inner 300 pc of the galaxy, the molecular gas kinematics are misaligned by 120° with respect to the large-scale stellar rotation, by 100° (in the other direction) with respect to the stellar kinematically-decoupled core, and by about 45° with respect to the ionized gas kinematics. We conclude that the prominent stellar kinematically-decoupled core did not form out of the molecular gas present now; it must have had its origin in a previous event. Furthermore, the complex misalignments may be signatures of outflows or other non-circular kinematics in ionized gas. Despite the dramatic kinematic misalignments, there is no evidence of enhanced emission from the shock tracers SiO, CH3OH, or HNCO.
All of the detected molecules are centrally concentrated except for 13CO (and possibly C18O and CS). The distribution of 13CO has a prominent central dip of almost a factor of two in integrated line intensity and it peaks at about 300 pc from the nucleus. The central 13CO dip produces an unusually large nuclear 12CO/13CO line ratio, at this resolution. This ratio is higher than those found in typical spirals and early-type galaxies; it is comparable to those measured in ULIRGs and sub-mm galaxies. It also constrains the abundance ratio [12CO/13CO] which is typical of spiral disks but is higher than sometimes found in spiral nuclei. The isotopic ratios are thus consistent with the gas having been accreted from another spiral galaxy and transported rapidly (faster than the 13C enrichment timescale) to the nucleus of NGC 7465. The observed 13CO/C18O line ratio suggests [13CO/C18O] = 4.0 1.2, which is also consistent with a spiral galaxy origin but is significantly higher than corresponding ratios estimated in ULIRGs/sub-mm galaxies and lower than ratios in Local Group dwarfs.
Modest star formation activity is occurring in the center of NGC 7465 but there is no compelling reason to assume the intrinsic [12CO/13CO] abundance ratio is very different from the range of that is usually found in the disks of spirals. In this case the 12CO (1-0) emission from the nucleus of NGC 7465 must be unusually optically thin, perhaps even having Such low optical depths are plausible because of (1) the high CO temperatures K inferred from single-dish data on multiple J-level transitions, and (2) the very large linewidth in the center of the galaxy. The nuclear spectrum ( pc) has a FWHM of 250 km s-1, a factor of 10 larger than elsewhere in the galaxy, due to the strong velocity gradient in the central misaligned molecular structure (possibly an edge-on circumnuclear ring).
HCN emission is relatively faint in NGC 7465 and HCO+ is relatively bright, yielding HCN/HCO+ ratios in the range of 0.4 to 0.6 everywhere we can measure – these ratios are a factor of two lower than typical for spiral galaxies. An assumption of LTE requires an intrinsic abundance ratio [HCN/HCO+] but even for densities too low to approach LTE the data still require [HCN/HCO+] which is smaller than is found in some nearby spirals. We also find (based on previously published nebular line fluxes) roughly solar metallicity in the ionized gas outside of the nucleus, where ionization is not dominated by the AGN. Thus, even though the galaxy’s gas-phase metallicity does not suggest an intrinsically low N abundance, the observed HCN/HCO+ line ratios do still seem to require relatively low densities in the dense molecular phase (e.g. cm-3) and/or low HCN abundances.
We find no measurable gradient in the HCN/HCO+ line ratio on scales of 100 pc to 1 kpc. Thus, even though there is an AGN in NGC 7465, it is not affecting the J=1-0 line ratios of the dense molecular tracers on those scales (in marked contrast to some other AGN). On the other hand, the proportion of dense relative to diffuse molecular gas is clearly changing with radius, as reflected by ratios like 12CO/HCN, 12CO/HCO+, and 12CO/CN. Thus the physical properties of the densest phase of the molecular gas do not appear to change with radius, even though the properties of the more diffuse phase must be changing to reproduce the 12CO/13CO variation.
The CN emission from NGC 7465 is optically thin and unremarkable in its intensity. C2H is relatively bright, with C2H/HCN 1. As C2H and HCO+ have quite similar critical densities, we infer that the relative brightness of C2H is also an indicator of relatively low densities in the “high-density” molecular phase. The intensity and spatial distribution of CS emission in NGC 7465 are consistent with previous suggestions that CS can be enhanced in regions of star formation activity, here traced by low [O III]/H ratios.
All of the gas-phase data gathered about NGC 7465 to date – the gas content, kinematics, metallicity, and molecular and isotopic abundance patterns – are consistent with the interpretation that it acquired its gas recently from a large spiral galaxy rather than a dwarf galaxy. In the broader context, however, more work is needed on isotopic abundance ratios in early-type galaxies. Some of them are believed to have accreted their gas recently from a dwarf galaxy, while others may have retained small quantities of molecular gas from their previous lives as sub-mm galaxies at through the Universe’s peak star formation epoch, all the way down to the present day. More quantitative work is also required on modeling the isotopic abundance evolution of early-type galaxies, to test whether the current-day properties of these galaxies can be reproduced and what constraints they may impose on the evolutionary models.
ADS/JAO.ALMA#2018.1.01253.S,
ADS/JAO.ALMA#2016.1.01119.S, and
ADS/JAO.ALMA#2018.1.01599.S. ALMA is a partnership of ESO (representing its member states), NSF (USA) and NINS (Japan), together with NRC (Canada), MOST and ASIAA (Taiwan), and KASI (Republic of Korea), in cooperation with the Republic of Chile. The Joint ALMA Observatory is operated by ESO, AUI/NRAO and NAOJ. The National Radio Astronomy Observatory is a facility of the National Science Foundation operated under cooperative agreement by Associated Universities, Inc.
Appendix A A distant, unidentified source near NGC 7465
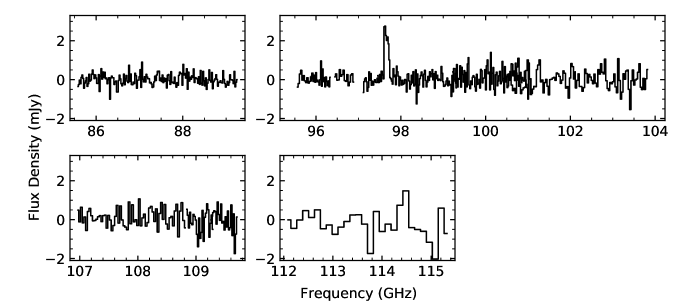
We find strong line emission and 3mm continuum emission from an unidentified source near (in projection) to NGC 7465. The line is centered at 97.67 GHz and its width is 0.14 GHz. The source is modestly resolved in these data, and its position is 23h 02m 02.s857, 15° 58′ 17.′′8 (ICRS). Figure 15 shows its location on a deep optical image from the MATLAS survey (Duc et al., 2015) and Figure 16 shows its spectrum. It also has a 3mm continuum flux density of (0.11 0.01) mJy/beam and a slight suggestion of rotation along a northwest – southeast axis, but the distance between the image centroids in the extreme channels is only 0.′′35 so the rotation is not well resolved in these data.
Although the source is superposed on the outer parts of NGC 7465, where there are bright blue patches associated with recent star formation activity, there is no optical source coincident with the 3mm emission. It certainly is not a part of NGC 7465 due to its large linewidth and the fact that its frequency does not match any known bright line. But as we only have one detected spectral line in the frequencies covered by these data, it is difficult to identify the line. If it is 12CO(1-0), it would be at In this case 13CO(1-0) would be around 93.4 GHz, where we have no coverage, and HCN(1-0) would be beyond the low frequency end of ALMA Band 3. If the line is 12CO(2-1), it would be at , 13CO(2-1) would be at 93.3 GHz, and HCN(3-2) would be at 112.6 GHz. No line is apparent at 112.6 GHz but the data do not rule out typical HCN/12CO ratios like those seen in local galaxies. Similarly if the line is 12CO(3-2) at HCN(4-3) would be at 100.1 GHz but the limits on a nondetection there are not yet useful. Firm identifications of the redshift in this case will probably require searches for the corresponding higher-J transitions of 12CO in the higher ALMA bands or the lower-J transitions at the Jansky Very Large Array.
| Line ID | Diameter | Line width | Mdyn | Flux | Mmol | Mmol/Mdyn | ||
|---|---|---|---|---|---|---|---|---|
| (kpc) | (km s-1) | (M⊙) | (Jy km s-1) | (K km s-1 pc2) | (M⊙) | |||
| 12CO(1-0) | 0.1802 | 1.06 | 409 | 5.2/ | 0.87 | 1.4 | 4.9 | 0.95 |
| 12CO(2-1) | 1.3604 | 2.94 | 217 | 4.0/ | 0.46 | 1.1 | 4.0 | 10.0 |
| 12CO(3-2) | 2.5404 | 2.81 | 115 | 1.1/ | 0.24 | 8.1 | 2.9 | 27 |
Note. — Calculations are made assuming a flat universe with H0 = 70 km s-1 Mpc-1, , and . The linear diameter is estimated from the emission centroids in the outermost channels. The line luminosity is calculated as in Carilli & Walter (2013). Estimated luminosity conversions from J=2-1 or J=3-2 to J=1-0 are made using assumed excitations as in Boogaard et al. (2019) and the molecular mass (with He) is then estimated from the inferred 12CO(1-0) luminosity using a conversion factor M⊙ (K km s-1 pc2)-1 (Boogaard et al., 2019).
Table 3 lists estimated line fluxes, luminosities, and masses for the most probable line identifications. Assuming the object is in dynamical equilibrium, so that we can compare its inferred dynamical and molecular masses, it seems more likely that the line is 12CO(1-0) or 12CO(2-1) than any higher-J transition. The higher-J levels would require the source to be quite close to face-on in order to make the inferred dynamical mass larger than the molecular mass. The line profile is consistent with a rectangular or double-horned shape, suggesting it comes from a rotating disk with gas extending to the flat part of the rotation curve, so the dynamical equilibrium assumption is plausible by this measure.
The source is very similar in integrated line flux and width to the typical 3mm 12CO lines detected by ALMA in a blind survey of the Hubble Ultra-Deep Field (HUDF; González-López et al., 2019; Walter et al., 2016). Its continuum is brighter than is typical, as the brightest 3mm continuum source in the HUDF has a flux density of 46 7 Jy whereas this one has 110 10 Jy. But overall, this source is compatible with being a similar object to those. Most of them are identified as 12CO(2-1) at redshifts of 1.0 to 1.5, based on associations with optical counterparts and occasionally detections of higher-J lines in higher ALMA bands. In fact, all of the 12CO detections in the HUDF have optical counterparts (González-López et al., 2019), and they are typically 0.01 to 1 Jy at an observed wavelength of 1 m (Boogaard et al., 2019). The ground-based optical data shown in Figure 15 cannot rule out the faintest of those typical optical counterparts.
Appendix B Possible evidence for an AGN-driven ionized outflow
Figure 17 shows a side-by-side comparison of the inner structure of NGC 7465, in some indicators that might reveal a small AGN-driven ionized outflow. Ferruit et al. (2000) presented narrowband HST [O III] and H imaging which showed enhanced [O III]/H in a ′′ region with a southeast-northwest elongation, consistent with the structure in the ATLAS3D [O III]/H data. This region of more strongly-ionized gas is expected to trace enhanced shocks and/or harder radiation fields. The velocity of the ionized gas shows a gradient along a similar kinematic axis of roughly 35°, as indicated by the ellipse in Figure 17, and the velocity dispersion in [O III] is also enhanced near the ends of the major axis of this ellipse. However, the velocity resolution of the [O III] kinematic data is not good enough to show any signatures of double-peaked line profiles.
The 12CO kinematic and photometric position angles in this region show that the molecular gas predominantly traces a disk or a ring perpendicular to the suggested outflow axis. Thus, enhanced [O III]/H ratios along that axis might simply reflect lower opacities on that axis and higher opacities in the dusty molecular disk, rather than actual outflow. The enhanced 12CO velocity dispersion along the proposed outflow axis is probably then related to the kinematics of the molecular disk rather than the outflow, and enhanced 12CO/13CO line ratios along the proposed outflow axis might reflect higher temperatures or larger linewidths (Section 11.1). In short, the features observed here could be caused by an ionized outflow but are not definitive evidence; higher resolution spectrosocopy targeting the optical nebular lines would be useful in testing for the existence of an outflow.
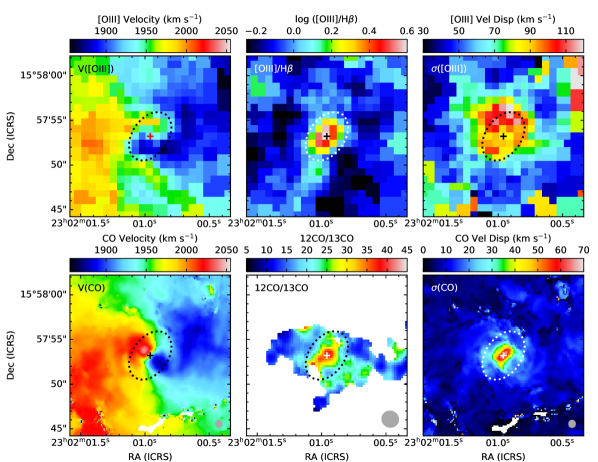
Appendix C Line fluxes in NGC 7465.
Table C presents all the line fluxes measured in the regions used for the analysis of spatial variations in the molecular properties of NGC 7465.
=5.5cm {rotatetable}
| Rgn | Dist. | Area | 12CO | 13CO | C18O | HCN | HCO+ | CN | CS | C2H | CH3OH | SiO | HNCO |
|---|---|---|---|---|---|---|---|---|---|---|---|---|---|
| ID | (′′) | (′′) | (Jy km s-1) | (Jy km s-1) | (Jy km s-1) | (Jy km s-1) | (Jy km s-1) | (Jy km s-1) | (Jy km s-1) | (Jy km s-1) | (Jy km s-1) | (Jy km s-1) | (Jy km s-1) |
| 1 | 0.5 | 3.1 | 3.515 (0.040) | 0.096 (0.013) | 0.039 | 0.132 (0.012) | 0.303 (0.013) | 0.226 (0.006) | 0.041 (0.009) | 0.091 (0.014) | 0.035 | 0.040 | 0.037 |
| 2 | 2.3 | 8.8 | 6.877 (0.069) | 0.325 (0.023) | 0.061 | 0.128 (0.022) | 0.219 (0.018) | 0.122 (0.015) | 0.087 (0.018) | 0.104 (0.022) | 0.057 | 0.066 | 0.061 |
| 3 | 1.9 | 5.9 | 4.852 (0.062) | 0.186 (0.020) | 0.050 | 0.092 (0.019) | 0.222 (0.018) | 0.162 (0.008) | 0.041 | 0.065 | 0.057 | 0.053 | 0.058 |
| 4 | 3.4 | 7.4 | 3.787 (0.053) | 0.182 (0.018) | 0.054 | 0.045 (0.014) | 0.109 (0.015) | 0.058 (0.007) | 0.043 | 0.048 (0.016) | 0.042 | 0.047 | 0.050 |
| 5 | 2.9 | 57.2 | 30.888 (0.277) | 1.266 (0.093) | 0.311 (0.091) | 0.477 (0.070) | 1.122 (0.070) | 0.814 (0.035) | 0.337 (0.068) | 0.468 (0.086) | 0.260 | 0.234 | 0.222 |
| 6 | 5.8 | 10.0 | 2.163 (0.047) | 0.130 (0.014) | 0.041 | 0.041 | 0.034 | 0.018 | 0.034 | 0.036 | 0.027 | 0.039 | 0.032 |
| 7 | 7.9 | 15.6 | 4.312 (0.091) | 0.201 (0.029) | 0.082 | 0.057 | 0.067 | 0.037 | 0.053 | 0.069 | 0.060 | 0.064 | 0.073 |
| 8 | 5.3 | 3.1 | 0.598 (0.016) | 0.039 (0.005) | 0.013 | 0.019 (0.005) | 0.040 (0.005) | 0.007 | 0.013 | 0.014 | 0.015 | 0.017 | 0.018 |
| 9 | 10.0 | 759.8 | 80.792 (0.866) | 2.540 (0.279) | 0.845 (0.265) | 0.668 | 1.328 (0.212) | 0.843 (0.131) | 0.643 | 0.602 | 0.659 | 0.631 | 0.745 |
Note. — Regions are identified by number in Figure 7. The distance in column 2 refers to the typical distance between the nuclear continuum source and points within the region, and it indicates the radial coordinate used for each region in Figures 9 and 10. Region 9 is a much larger irregular area roughly 38′′ by 32′′ in diameter, encompassing virtually all of the detected 12CO emission in these data, and its typical radial coordinate is arbitrarily set to 10′′ for ease in plotting. Line ratios measured in K units can be calculated from these table entries by multiplying the ratio in Jy units by the square of the ratio of the lines’ wavelengths.
References
- Alatalo et al. (2014) Alatalo, K., Nyland, K., Graves, G., et al. 2014, ApJ, 780, 186
- Alatalo et al. (2015) Alatalo, K., Crocker, A. F., Aalto, S., et al. 2015, MNRAS, 450, 3874
- Anderson et al. (2014) Anderson, C. N., Meier, D. S., Ott, J., et al. 2014, ApJ, 793, 37
- Andrews et al. (2018) Andrews, S. M., Huang, J., Pérez, L. M., et al. 2018, ApJ, 869, L41
- Astropy Collaboration et al. (2013) Astropy Collaboration, Robitaille, T. P., Tollerud, E. J., et al. 2013, A&A, 558, A33
- Astropy Collaboration et al. (2018) Astropy Collaboration, Price-Whelan, A. M., SipHocz, B. M., et al. 2018, aj, 156, 123
- Athanassoula (1992) Athanassoula, E. 1992, MNRAS, 259, 345
- Baan et al. (2008) Baan, W. A., Henkel, C., Loenen, A. F., Baudry, A., & Wiklind, T. 2008, A&A, 477, 747
- Baumgartner et al. (2013) Baumgartner, W. H., Tueller, J., Markwardt, C. B., et al. 2013, ApJS, 207, 19
- Bayet et al. (2009) Bayet, E., Aladro, R., Martín, S., Viti, S., & Martín-Pintado, J. 2009, ApJ, 707, 126
- Bayet et al. (2012) Bayet, E., Davis, T. A., Bell, T. A., & Viti, S. 2012, MNRAS, 424, 2646
- Bayet et al. (2013) Bayet, E., Bureau, M., Davis, T. A., et al. 2013, MNRAS, 432, 1742
- Boger & Sternberg (2005) Boger, G. I., & Sternberg, A. 2005, ApJ, 632, 302
- Boogaard et al. (2019) Boogaard, L. A., Decarli, R., González-López, J., et al. 2019, ApJ, 882, 140
- Braine et al. (2017) Braine, J., Shimajiri, Y., André, P., et al. 2017, A&A, 597, A44
- Brown & Wilson (2019) Brown, T., & Wilson, C. D. 2019, ApJ, 879, 17
- Bryant et al. (2019) Bryant, J. J., Croom, S. M., van de Sande, J., et al. 2019, MNRAS, 483, 458
- Cao et al. (2017) Cao, Y., Wong, T., Xue, R., et al. 2017, ApJ, 847, 33
- Cappellari et al. (2011) Cappellari, M., Emsellem, E., Krajnović, D., et al. 2011, MNRAS, 413, 813
- Cappellari et al. (2013) Cappellari, M., Scott, N., Alatalo, K., et al. 2013, MNRAS, 432, 1709
- Carilli & Walter (2013) Carilli, C. L., & Walter, F. 2013, ARA&A, 51, 105
- Cicone et al. (2020) Cicone, C., Maiolino, R., Aalto, S., Muller, S., & Feruglio, C. 2020, A&A, 633, A163
- Cluver et al. (2014) Cluver, M. E., Jarrett, T. H., Hopkins, A. M., et al. 2014, ApJ, 782, 90
- Cormier et al. (2018) Cormier, D., Bigiel, F., Jiménez-Donaire, M. J., et al. 2018, MNRAS, 475, 3909
- Crocker et al. (2012) Crocker, A., Krips, M., Bureau, M., et al. 2012, MNRAS, 421, 1298
- Danielson et al. (2013) Danielson, A. L. R., Swinbank, A. M., Smail, I., et al. 2013, MNRAS, 436, 2793
- Davis (2014) Davis, T. A. 2014, MNRAS, 445, 2378
- Davis et al. (2013) Davis, T. A., Bayet, E., Crocker, A., Topal, S., & Bureau, M. 2013, MNRAS, 433, 1659
- Davis & Bureau (2016) Davis, T. A., & Bureau, M. 2016, MNRAS, 457, 272
- Davis et al. (2019) Davis, T. A., Greene, J. E., Ma, C.-P., et al. 2019, MNRAS, 486, 1404
- Davis & Young (2019) Davis, T. A., & Young, L. M. 2019, MNRAS, 489, L108
- Davis et al. (2011) Davis, T. A., Alatalo, K., Sarzi, M., et al. 2011, MNRAS, 417, 882
- Davis et al. (2014) Davis, T. A., Young, L. M., Crocker, A. F., et al. 2014, MNRAS, 444, 3427
- Davis et al. (2015) Davis, T. A., Rowlands, K., Allison, J. R., et al. 2015, MNRAS, 449, 3503
- de Vaucouleurs et al. (1991) de Vaucouleurs, G., de Vaucouleurs, A., Corwin, Herold G., J., et al. 1991, Third Reference Catalogue of Bright Galaxies
- Domínguez-Fernández et al. (2020) Domínguez-Fernández, A. J., Alonso-Herrero, A., García-Burillo, S., et al. 2020, arXiv e-prints, arXiv:2003.05663
- Duc et al. (2015) Duc, P.-A., Cuillandre, J.-C., Karabal, E., et al. 2015, MNRAS, 446, 120
- Emonts et al. (2019) Emonts, B., Raba, R., Moellenbrock, G., et al. 2019, arXiv e-prints, arXiv:1912.09437
- Ferruit et al. (2000) Ferruit, P., Wilson, A. S., & Mulchaey, J. 2000, ApJS, 128, 139
- Gallagher et al. (2018) Gallagher, M. J., Leroy, A. K., Bigiel, F., et al. 2018, ApJ, 858, 90
- García-Burillo et al. (2010) García-Burillo, S., Usero, A., Fuente, A., et al. 2010, A&A, 519, A2
- García-Burillo et al. (2017) García-Burillo, S., Viti, S., Combes, F., et al. 2017, A&A, 608, A56
- Gonçalves et al. (1999) Gonçalves, A. C., Véron-Cetty, M. P., & Véron, P. 1999, A&AS, 135, 437
- González-López et al. (2019) González-López, J., Decarli, R., Pavesi, R., et al. 2019, arXiv e-prints, arXiv:1903.09161
- Griffith et al. (2019) Griffith, E., Martini, P., & Conroy, C. 2019, MNRAS, 484, 562
- Harada et al. (2018) Harada, N., Sakamoto, K., Martín, S., et al. 2018, ApJ, 855, 49
- Heikkilä et al. (1999) Heikkilä, A., Johansson, L. E. B., & Olofsson, H. 1999, A&A, 344, 817
- Henkel et al. (2014) Henkel, C., Asiri, H., Ao, Y., et al. 2014, A&A, 565, A3
- Israel (2020) Israel, F. P. 2020, A&A, 635, A131
- Israel et al. (2003) Israel, F. P., Johansson, L. E. B., Rubio, M., et al. 2003, A&A, 406, 817
- Jiménez-Donaire et al. (2017) Jiménez-Donaire, M. J., Cormier, D., Bigiel, F., et al. 2017, ApJ, 836, L29
- Jiménez-Donaire et al. (2019) Jiménez-Donaire, M. J., Bigiel, F., Leroy, A. K., et al. 2019, ApJ, 880, 127
- Jin et al. (2016) Jin, Y., Chen, Y., Shi, Y., et al. 2016, MNRAS, 463, 913
- Johansson et al. (1994) Johansson, L. E. B., Olofsson, H., Hjalmarson, A., Gredel, R., & Black, J. H. 1994, A&A, 291, 89
- Kaviraj et al. (2012) Kaviraj, S., Ting, Y.-S., Bureau, M., et al. 2012, MNRAS, 423, 49
- Kennicutt et al. (2011) Kennicutt, R. C., Calzetti, D., Aniano, G., et al. 2011, PASP, 123, 1347
- Kepley et al. (2018) Kepley, A. A., Bittle, L., Leroy, A. K., et al. 2018, ApJ, 862, 120
- Kohno et al. (2001) Kohno, K., Matsushita, S., Vila-Vilaró, B., et al. 2001, in Astronomical Society of the Pacific Conference Series, Vol. 249, The Central Kiloparsec of Starbursts and AGN: The La Palma Connection, ed. J. H. Knapen, J. E. Beckman, I. Shlosman, & T. J. Mahoney, 672
- Krajnović et al. (2011) Krajnović, D., Emsellem, E., Cappellari, M., et al. 2011, MNRAS, 414, 2923
- Krajnović et al. (2020) Krajnović, D., Ural, U., Kuntschner, H., et al. 2020, A&A, 635, A129
- Krips et al. (2008) Krips, M., Neri, R., García-Burillo, S., et al. 2008, ApJ, 677, 262
- Lablanche et al. (2012) Lablanche, P.-Y., Cappellari, M., Emsellem, E., et al. 2012, MNRAS, 424, 1495
- Langer & Penzias (1990) Langer, W. D., & Penzias, A. A. 1990, ApJ, 357, 477
- Lapham et al. (2017) Lapham, R. C., Young, L. M., & Crocker, A. 2017, ApJ, 840, 51
- Leroy et al. (2009) Leroy, A. K., Walter, F., Bigiel, F., et al. 2009, AJ, 137, 4670
- Leroy et al. (2017) Leroy, A. K., Usero, A., Schruba, A., et al. 2017, ApJ, 835, 217
- Li & Seaquist (1994) Li, J. G., & Seaquist, E. R. 1994, AJ, 107, 1953
- Lintott et al. (2005) Lintott, C. J., Viti, S., Rawlings, J. M. C., et al. 2005, ApJ, 620, 795
- Martín et al. (2019) Martín, S., Muller, S., Henkel, C., et al. 2019, A&A, 624, A125
- Martín et al. (2014) Martín, S., Verdes-Montenegro, L., Aladro, R., et al. 2014, A&A, 563, L6
- McCoy et al. (2017) McCoy, M., Ott, J., Meier, D. S., et al. 2017, ApJ, 851, 76
- McDermid et al. (2015) McDermid, R. M., Alatalo, K., Blitz, L., et al. 2015, MNRAS, 448, 3484
- Meier & Turner (2004) Meier, D. S., & Turner, J. L. 2004, AJ, 127, 2069
- Meier & Turner (2005) —. 2005, ApJ, 618, 259
- Meier & Turner (2012) —. 2012, ApJ, 755, 104
- Meier et al. (2008) Meier, D. S., Turner, J. L., & Hurt, R. L. 2008, ApJ, 675, 281
- Meier et al. (2015) Meier, D. S., Walter, F., Bolatto, A. D., et al. 2015, ApJ, 801, 63
- Meijerink et al. (2007) Meijerink, R., Spaans, M., & Israel, F. P. 2007, A&A, 461, 793
- Méndez-Hernández et al. (2020) Méndez-Hernández, H., Ibar, E., Knudsen, K. K., et al. 2020, MNRAS, 497, 2771
- Mittal et al. (2011) Mittal, R., O’Dea, C. P., Ferland, G., et al. 2011, MNRAS, 418, 2386
- Mittal et al. (2012) Mittal, R., Oonk, J. B. R., Ferland, G. J., et al. 2012, MNRAS, 426, 2957
- Moustakas & Kennicutt (2006) Moustakas, J., & Kennicutt, Robert C., J. 2006, ApJS, 164, 81
- Moustakas et al. (2010) Moustakas, J., Kennicutt, Robert C., J., Tremonti, C. A., et al. 2010, ApJS, 190, 233
- Nyland et al. (2016) Nyland, K., Young, L. M., Wrobel, J. M., et al. 2016, MNRAS, 458, 2221
- Nyland et al. (2017) —. 2017, MNRAS, 464, 1029
- Paglione et al. (2001) Paglione, T. A. D., Wall, W. F., Young, J. S., et al. 2001, ApJS, 135, 183
- Privon et al. (2015) Privon, G. C., Herrero-Illana, R., Evans, A. S., et al. 2015, ApJ, 814, 39
- Rau & Cornwell (2011) Rau, U., & Cornwell, T. J. 2011, A&A, 532, A71
- Remijan et al. (2019) Remijan, A., Biggs, A., Cortes, P., et al. 2019, ALMA Technical Handbook, ALMA Doc. 7.3 version 1.1, , , ISBN 978-3-923524-66-2
- Rémy-Ruyer et al. (2015) Rémy-Ruyer, A., Madden, S. C., Galliano, F., et al. 2015, A&A, 582, A121
- Romano et al. (2019) Romano, D., Matteucci, F., Zhang, Z.-Y., Ivison, R. J., & Ventura, P. 2019, MNRAS, 490, 2838
- Russell et al. (2019) Russell, H. R., McNamara, B. R., Fabian, A. C., et al. 2019, MNRAS, 490, 3025
- Sarzi et al. (2006) Sarzi, M., Falcón-Barroso, J., Davies, R. L., et al. 2006, MNRAS, 366, 1151
- Sarzi et al. (2010) Sarzi, M., Shields, J. C., Schawinski, K., et al. 2010, MNRAS, 402, 2187
- Sarzi et al. (2016) Sarzi, M., Ledo, H. R., Coccato, L., et al. 2016, MNRAS, 457, 1804
- Seale et al. (2012) Seale, J. P., Looney, L. W., Wong, T., et al. 2012, ApJ, 751, 42
- Serra et al. (2012) Serra, P., Oosterloo, T., Morganti, R., et al. 2012, MNRAS, 422, 1835
- Serra et al. (2014) Serra, P., Oser, L., Krajnović, D., et al. 2014, MNRAS, 444, 3388
- Sliwa & Downes (2017) Sliwa, K., & Downes, D. 2017, A&A, 604, A2
- Sliwa et al. (2017) Sliwa, K., Wilson, C. D., Aalto, S., & Privon, G. C. 2017, ApJ, 840, L11
- Smith et al. (2017) Smith, J. D. T., Croxall, K., Draine, B., et al. 2017, ApJ, 834, 5
- Tan et al. (2011) Tan, Q.-H., Gao, Y., Zhang, Z.-Y., & Xia, X.-Y. 2011, Research in Astronomy and Astrophysics, 11, 787
- Tang et al. (2019) Tang, X. D., Henkel, C., Menten, K. M., et al. 2019, A&A, 629, A6
- Taniguchi & Ohyama (1998) Taniguchi, Y., & Ohyama, Y. 1998, ApJ, 507, L121
- Topal et al. (2016) Topal, S., Bureau, M., Davis, T. A., et al. 2016, MNRAS, 463, 4121
- Ueda et al. (2017) Ueda, J., Watanabe, Y., Iono, D., et al. 2017, PASJ, 69, 6
- van der Tak et al. (2007) van der Tak, F. F. S., Black, J. H., Schöier, F. L., Jansen, D. J., & van Dishoeck, E. F. 2007, A&A, 468, 627
- van Zee & Haynes (2006) van Zee, L., & Haynes, M. P. 2006, ApJ, 636, 214
- Viti et al. (2020) Viti, S., Fontani, F., & Jiménez-Serra, I. 2020, MNRAS, 497, 4333
- Viti et al. (2014) Viti, S., García-Burillo, S., Fuente, A., et al. 2014, A&A, 570, A28
- Walter et al. (2016) Walter, F., Decarli, R., Aravena, M., et al. 2016, ApJ, 833, 67
- Wang et al. (2009) Wang, M., Chin, Y. N., Henkel, C., Whiteoak, J. B., & Cunningham, M. 2009, ApJ, 690, 580
- Werner et al. (2014) Werner, N., Oonk, J. B. R., Sun, M., et al. 2014, MNRAS, 439, 2291
- Wilson (2018) Wilson, C. D. 2018, MNRAS, 477, 2926
- Wilson et al. (2013) Wilson, C. D., Cridland, A., Foyle, K., et al. 2013, ApJ, 776, L30
- Young et al. (2011) Young, L. M., Bureau, M., Davis, T. A., et al. 2011, MNRAS, 414, 940
- Zhang et al. (2018) Zhang, Z.-Y., Romano, D., Ivison, R. J., Papadopoulos, P. P., & Matteucci, F. 2018, Nature, 558, 260