Inference and model selection in general causal time series with exogenous covariates
Mamadou Lamine DIOP 111Supported by the MME-DII center of excellence (ANR-11-LABEX-0023-01) and William KENGNE 222Developed within the ANR BREAKRISK: ANR-17-CE26-0001-01 and the CY Initiative of Excellence (grant ”Investissements d’Avenir” ANR-16-IDEX-0008), Project ”EcoDep” PSI-AAP2020-0000000013
THEMA, CY Cergy Paris Université, 33 Boulevard du Port, 95011 Cergy-Pontoise Cedex, France.
E-mail: mamadou-lamine.diop@u-cergy.fr ; william.kengne@u-cergy.fr
Abstract:
In this paper, we study a general class of causal processes with exogenous covariates, including many classical processes such as the ARMA-GARCH, APARCH, ARMAX, GARCH-X and APARCH-X processes.
Under some Lipschitz-type conditions, the existence of a -weakly dependent strictly stationary and ergodic solution is established.
We provide conditions for the strong consistency and derive the asymptotic distribution of the quasi-maximum likelihood estimator (QMLE), both when the true parameter is an interior point of the parameters space and when it belongs to the boundary.
A significance Wald-type test of parameter is developed. This test is quite extensive and includes the test of nullity of the parameter’s components, which in particular, allows us to assess the relevance of the exogenous covariates.
Relying on the QMLE of the model, we also propose a penalized criterion to address the problem of the model selection for this class. The weak and the strong consistency of the procedure are established.
Finally, Monte Carlo simulations are conducted to numerically illustrate the main results.
Keywords: Causal processes, exogenous covariates, quasi-maximum likelihood estimator, consistency, boundary, significance test, model selection, penalized criterion.
1 Introduction
Autoregressive time series with exogenous covariates provide effective ways to take into account some available extra information in the models. The well known example that has been widely studied is the ARMAX model, see Hannan (1976), Hannan and Deistler (2012). The GARCH-type models with exogenous covariates have recently attracted much attention in the literature, see for instance Han and Kristensen (2014) for GARCH-X, Francq and Thieu (2019) for APARCH-X. Guo et al. (2014) considered the factor double autoregressive model, whose ARX and ARCH-X are particular cases. We consider a large class of causal time series models, whose ARMAX and GARCH-X type models are specific examples.
Let be a vector of covariates, with . Consider the class of affine causal models with exogenous covariates,
Class - A process belongs to - if it satisfies:
| (1.1) |
where are two measurable functions and assumed to be known up to the parameter , which belongs in a compact subset (); and is a sequence of zero-mean independent, identically distributed (i.i.d) random variable satisfying for some and . Remark that, if for some constant (absence of covariates), then (1.1) reduces to the classical affine causal models that has already been considered in the literature (see, for instance, Bardet and Wintenberger (2009), Bardet et al. (2012), Bardet et al. (2020)). One can see that, the ARMAX, GARCH-X, APARCH-X models belong to the class -.
There exist several important contributions devoted to autoregressive models with covariates; we refer to Hannan and Deistler (2012), Han and Kristensen (2014), Sucarrat et al. (2016), Francq and Sucarrat (2017), Pedersen and Rahbek (2018), Francq and Thieu (2019), Grønneberg and Holcblat (2019), Zambom and Gel (2020) and the references therein for some developments on ARMAX and conditional volatility type models with exogenous covariates. The class - is more general than the models considered in the aforementioned works, as well as the factor double autoregressive model proposed by Guo et al. (2014) which is a particular case of the model (1.1). Note as well that, the class - provides a more general way to take into account covariates in the model, and one can see that the linear covariates regressors considered by Francq and Thieu (2019) and many other works is a specific case. Compared to Bardet and Wintenberger (2009), besides taking into account covariates in the model (1.1), we address the inference when the true parameter belongs to the boundary of the parameter set and the model selection question.
In this new contribution, we consider the class of model (1.1) and address the following issues.
-
(i)
Existence of a stationary solution. We provide sufficient conditions that ensure the existence of a -weakly dependent stationary and ergodic solution of (1.1). At a first glance, one might think that these conditions are the same as those obtained by Bardet and Wintenberger (2009), but in our case, the existence of the covariates must be taken into account.
-
(ii)
Inference for the class -. An inference based on the quasi likelihood of the model is carried out. The consistency of the quasi-maximum likelihood estimator (QMLE) is established and we derived the asymptotic distribution of this estimator (even when belongs to the boundary of ).
-
(iii)
Significance test of parameter. A Wald-type significance test of parameter of the model (1.1) is conducted. The proposed test is quite extensive and includes the test of nullity of the parameter’s components. An asymptotic study is carried out, which shows in particular that, when the true parameter belongs to the boundary of , the asymptotic distribution of the test statistic under the null hypothesis is quite different from the classical chi-square distribution.
-
(iv)
Model selection. A penalized criterion based on the quasi likelihood of the model is proposed for model selection in the class -. We provides conditions that ensure the weak and the strong consistency of the proposed procedure. These conditions shows in particular that, the Hannan-Quinn information Criterion (HQC) with a regularization parameter (see (3.2)) is strongly consistent for sufficiently large .
The article is organized as follows. In Section 2, firstly, we provide conditions for stability properties. Secondly, we give the definition of the QMLE and study its asymptotic properties; a significance test of parameter with an asymptotic study is also addressed. Section 3 focuses on the model selection and the consistency of the proposed procedure. Some classical examples of processes belonging to the class - are detailed in Section 4. Section 5 gives some empirical results, whereas Section 6 is devoted to a summary and conclusion. Section 7 contains the proofs of the main results.
2 Assumptions, inference and test of the parameters
2.1 Assumptions
Throughout the sequel, the following norms will be used:
-
•
, for any , ;
-
•
, for any matrix , where denotes the set of matrices of dimension with coefficients in , for ;
-
•
for any compact set and function ;
-
•
, if is a random vector with finite order moments, for .
We will denote by the null vector of any vector space. Let be the generic symbol for any of the functions or . We set the following classical Lipschitz-type conditions for any compact set .
Assumption A (): For any , the function is times continuously differentiable on with ; and there exists two sequences of non-negative real numbers and satisfying: , for ; such that for any ,
where denotes any vector, matrix norm.
The following assumption is considered on the function in the cases of ARCH-X type process.
Assumption A (): Assume that . There exists two sequences of non-negative real numbers and satisfying: , for ; such that for any ,
In the whole paper, we impose an autoregressive-type structure on the covariates:
| (2.1) |
where is a sequence of zero-mean random variables such as is i.i.d and is a function with values in satisfying
| (2.2) |
for some and non-negative sequence such that .
For , when (2.2) holds, we define the set
In the sequel, we make the convention that if A holds then for all and if A holds then for all .
2.2 Inference and significance test of parameter
In this paragraph, we describe the use of the Gaussian quasi-maximum likelihood to obtain an estimator of the parameters of the model (1.1). The main asymptotic properties of this estimator are also established. Assume that the observations are generated from (1.1) and (2.1) according to the true parameter which is unknown. For all , denote by the -field generated by the whole past at time . The mean and the variance of and and variance respectively. For any , the conditional Gaussian quasi-log-likelihood is given by (up to an additional constant)
where , and .
Since are not observed, is approximated by
where , and . Thus, the QMLE of is defined by
We set the following regularity conditions to assure the identifiability of the model and to derive the asymptotic behavior of the QMLE.
-
(A0):
for all and some , ;
-
(A1):
such that , for all ;
-
(A2):
for all , , or , where ′ denotes the transpose.
Assumption (A0) is an identifiability condition and it will be discussed in detail for each of the examples of processes studied in the paper. From (A1), the quasi likelihood is well defined, whereas (A2), which is classical (see for instance Bardet and Wintenberger (2009)) allows to derive the asymptotic distribution of the QMLE. The following theorem addresses the strong consistency of the QMLE.
Theorem 2.2
To derive the asymptotic distribution of the QMLE, it is necessary to take into account the constraints in the parameter space corresponding to the model. For example, in some processes belonging to (1.1), such as the ARCH-X models (see below), the components of are constrained to be positive or equal to zero. In order to propose a parsimonious representation, it is often required to test whether or not the exogenous covariates are relevant. For example, in an ARCH-X model defined by , the true parameter vector is . The significance test of the covariate consists to verify the nullity of the parameter ; that is, if the true parameter vector can be of the form which is not an interior point of . In this situation, it is impossible to apply the asymptotic normality results based on the classical assumption of ”interior point” to derive the asymptotic behavior of the test statistic used. To take into account such a scenario in the general class (1.1), we will consider that the component of is constrained if the -th section of is of the form with . Assume that the (with ) last components of are constrained, and let . Therefore, if and with , then is not an interior point of . For instance, in a scenario where , with the QMLE , it holds that which cannot tend to a Gaussian distribution with mean . By convention, it is assumed that if . When and the set is assumed to be large enough, then the following relation holds:
| (2.4) |
where when and , when and , and otherwise. The set is a convex cone which is equal to if .
Let us define the following matrices
| (2.5) |
Under the assumptions A, A (with ), one can show the existence of and . In addition, in view to (A2), the same arguments as in Bardet and Wintenberger (2009) allow to establish that matrix is positive definite. Consider then the -scalar product and the norm for . Let us define the -orthogonal projection of a vector on the cone as follows:
This definition is equivalent to
| (2.6) |
Note that, when , we have . Combining all the regularity conditions and definitions given above, we obtain the following main result.
Theorem 2.3
Assume that (A0)-(A2), (A), (A) (for ) and (2.2) (with ) hold with
| (2.7) |
for and some .
-
•
If with , then
-
•
If with , then
The matrix can be consistently estimated by , where
Now, we are interested to investigate whether or not a given subset of components of are equal to some fixed vector. To do so, consider the following hypothesis testing:
| (2.8) |
where is a full-rank matrix and is a vector of dimension . Define the Wald-type test statistic given by
| (2.9) |
Under , the asymptotic behavior of is given by the following theorem.
Theorem 2.4
Under , assume that the assumptions of Theorem 2.3 hold. Then
By the above theorem, at a nominal level , the critical region of the test is , where is the -quantile of the distribution of . The critical value can be computed through Monte-Carlo simulations. The following corollary follows immediately when belongs to the interior of the parameter space.
Corollary 2.5
Assume that the conditions of Theorem 2.4 hold. If , then converges to a chi-square distribution with degrees of freedom.
Under , one can easily see that ; which shows that the test is consistent in power. In the empirical studies, we will restrict our attention to test the relevance of the exogenous covariates by using the hypothesis (2.8) with and an appropriate matrix .
3 Model selection
3.1 Model selection framework
Assume that is a trajectory of the process satisfying - (defined as in (1.1)), where the true parameter is unknown. Let be a finite collection of models belonging to - with . Assume that contains at least the true model corresponding to the parameter . Our objective is to develop a procedure that allows to select the ”best model” (that we denote by ) among the collection such that it is ”close” to for large enough. To this end, we consider the following definitions and notations in the sequel:
-
•
a model is considered as a subset of and denote by the dimension of (i.e, );
-
•
for , is a compact set containing , where denotes the parameter vector associated to the model ;
-
•
is considered as a subset of the power set of ; that is, .
For instance, when the observations are generated from a ARMAX model (defined below), the collection of the competing models could be considered as a family of ARMAX with , where are the fixed upper bounds of the orders satisfying , , . The parameter space is a compact subset of , and thus a model is a subset of .
3.2 Model selection criterion and asymptotic results
Note that, under the identifiability assumption (A0), one can show that, for all , the function has a unique maximum in (see proof of Theorem 2.2). Let us thus define the ”best” parameter associated to the model as
When , we have ; that is, will play the role of the true parameter in cases of ”true” or overfitted model. For , we define the QMLE of as
| (3.1) |
Now, define the penalized criteria by
| (3.2) |
where is an increasing sequence of the regularization parameter (possibly data-dependent) that will be used to calibrate the penalty term, and is the number of non-zero components of that will be called the dimension of the model . The selection of the ”best” model is then obtained by minimizing the penalized contrast; that is,
| (3.3) |
Using the results of Theorems 2.2 and 2.3, we establish the asymptotic behavior of the model selection procedure, as shown in the following theorem.
Theorem 3.1
Remark that, if for some , then (3.4) is satisfied. The first and second parts of Theorem 3.1 show the consistency of the selection procedure; in particular, the second part provides sufficient conditions for the consistency of the HQC procedure. The last part establishes that the estimator of the parameter of the selected model obeys the law of iterated logarithm.
4 Some examples
In this section, we detail some particular processes satisfying the class (1.1). We show that the regularity conditions required for the main results are satisfied for these processes, with a particular emphasis on the identifiability assumption. For each example discussed, we consider that () represents a vector of covariates; and is a sequence of zero-mean i.i.d. random variable satisfying for some and .
4.1 Threshold ARX models
Consider the threshold autoregressive model with exogenous covariates (TARX) defined by,
| (4.1) |
where is the true parameter and , , , (for ) are assumed to be twice continuously differentiable functions on . This model is a generalization of the threshold AR process of Tong (1990). Also, the ARMAX process (see Hannan and Deistler (2012)) is a specific example of the model (4.1). Set for all . If and , then, assumption A holds and there exists a stationary and ergodic solution with -order moment. The assumption (A1) holds with . Denote for ,
| (4.2) |
the field generated by . Let us set following additional conditions:
-
(B0):
for all ;
-
(B1):
for such that or , given is non-degenerate;
-
(B2):
if is a sequence of vector of such as (with ), then is non-degenerate;
-
(B3):
the function or , for some is injective;
-
(B4):
The function (or for some ) is is injective and holds (B2).
To ensure the identifiability, both the assumptions (B3) and (B4) are not necessary; that is, the model is identifiable if (B1) and ((B3) or (B4)) hold. Indeed, let such that . Then,
| (4.3) |
By contradiction, assume that or for some and let be the smallest integer satisfying or . It holds from (4.3) that,
| (4.4) |
Since the right-hand side of (4.1) is -measurable (thanks to the non anticipative property of the process ), given is degenerate, which contradicts the assumption . Thus, and for all . Therefore,
-
•
if (B3) holds, then ;
-
•
else, if (B4) holds, then we have from (4.1),
which implies that (by the assumption (B2)); and consequently, . Hence, .
In the case of the ARX() models (obtained when , for all ), the condition (B1) is not necessary; the identifiability holds with (B0) and ((B3) or (B4)).
4.2 Asymmetric Power ARCH-X models
Consider the Asymmetric Power ARCH with with exogenous covariates (APARCH-X) defined by,
| (4.5) |
where is the true parameter, , , , , are non-negative (componentwise for ) functions assumed to be twice continuously differentiable on , with for all , is a vector of non-negative (componentwise) covariates, and . This process is an example of the class (1.1) with and . Numerous classical ARCH-type parametrizations, for instance, GARCH-X (obtained with and ), TARCH-X (obtained with ) are specific example of (4.2). There are several works in the literature based on the GARCH-X model, see for instance Han and Kristensen (2014), Nana et al. (2013), Han (2015). Model (4.2) is a generalization of the class of APARCH-X() studied by Francq and Thieu (2019). Assume that , where is given by
Therefore, A holds; and a stationary and ergodic solution with -order moment exists. If , then the assumption (A1) is satisfied. The following assumptions are needed to ensure the identifiability.
-
(B5):
for all and , the support of the distribution of given is not included in or in and contains at least three points.
-
(B6):
the function or for some , is injective.
-
(B7):
The function (or for some ) is injective, and the condition (B2) holds for this model.
By going along similar lines as in the Subsection 4.1 and by using the Lemma 4 in [8], one get that, if (B5) and ((B6) or (B7)) hold, then the model (4.2) is identifiable.
Let us stress that, the i.i.d. assumption for is a bit strong for the model (4.2). This assumption, which is needed to the large class - can be relaxed to is a martingale difference sequence (see, for instance, [8] in the case of APARCH-X() model) when checking the identifiability. Also, as pointed out by Francq and Thieu (2019), in the absence of covariates and when is i.i.d (i.e., the case of the APARCH model), the assumption (B5) can be automatically reduced to: and the support of the distribution of contains at least three points. Moreover, Assumption (B5) prevents taking redundant covariate; for instance, it excludes the situation where or for some .
4.3 ARX()-ARCH() models
Consider the ARX()-ARCH() model given by,
| (4.6) |
where is the true parameter, and , , , , , are assumed to be twice continuously differentiable on , and satisfying for all . Model (4.6) is an extension of the ARMA-GARCH, ARMAX-GARCH processes. This model belongs to the class - with
for all . Hence, the assumption A holds with and . From an expansion of , one can easily get that, A holds with
Therefore, the stationarity set is defined by
Assumption (A1) is satisfied if . The identifiability conditions can be obtained as in Subsection 4.1 and 4.2.
5 Simulation study
In this section, we consider a double autoregressive model with exogenous covariates, defined by
| (5.1) |
where is an exogenous multivariate covariate process with values in (), , , , , , , denotes the Hadamard product (componentwise multiplication), is a white noise with . This model is a generalization of the factor double autoregressive (FDAR) process introduced by Guo et al. (2014) to extend the double AR model proposed by Ling (2007). The ARX() and ARCH-X() are particular cases of the model (5.1). We assume that is a VAR(1) (vector autoregressive) process:
| (5.2) |
where , is a real coefficients -matrix and is a white noise with . If , then the stability condition (2.2) holds with and for . The stationarity set is
with if and if . Based on the examples discussed in Section 4, if the conditions (B0) and (B3) hold for (5.1), then to satisfy the identifiability condition, it suffices to impose the following assumption on the covariate:
(B7): if and are sequences of vector of such as and (with , ), then and are not degenerated.
Set and ; the true parameter is . In the sequel, we focus on the following two cases.
Case 1. We consider an example of model (5.1) with univariate covariates where and ; the AR parameter is set to and .
Case 2. In this second example, model (5.1) is considered with univariate/multivariate covariates where , and ; thus, the true parameter is . This second example is related to the real data application (see Section 6).
5.1 Estimation and significance test
Some results from Monte Carlo simulations are displayed to assess the asymptotic properties of the QMLE, as well as to investigate the empirical size and power of the proposed procedure on testing the significance of the covariate . We will consider samples where the innovation is generated from Gaussian and Student distributions (with 5 with degrees of freedom). The model (5.1) is considered in the Case 1 with (scenario S0, S1, S’0 and S’1 below). In the Case 2 (, ), we consider scenarios with univariate covariate (scenario S”0 and S”1 below), the AR parameter are .
-
•
scenario S0: ;
-
•
scenario S1: ;
-
•
scenario S’0: ;
-
•
scenario S’1: .
-
•
scenario S”0: ;
-
•
scenario S”1: .
The scenarios S0, S’0 and S”0 correspond to cases where the covariate is absent; S”0 and S”1 are related to the real data application. We consider the following significance tests:
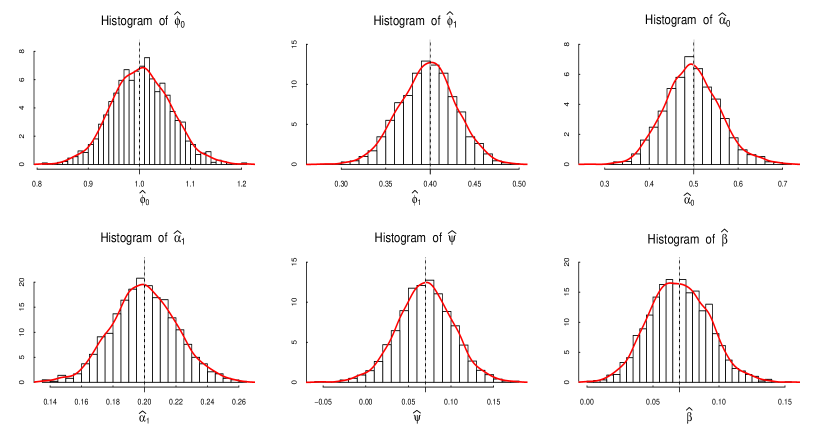
In each of the scenarios S0, S1, S’0, S’1, S”0 and S”1, we simulate replications with the sample size and test the nullity of the vector after estimating the parameters of interest. Table 1 contains the empirical mean and root mean square error (RMSE) of each component of the estimator. The last two columns of Table 1 indicate the empirical levels and powers of the above tests at the nominal level , where the empirical powers are computed under the alternative respectively in the scenario S1, S’1 and S”1. For the scenario S’1, the histograms and estimated densities of the estimates are plotted in Figure 1.
From these findings, one can see that, in all scenarios, the performance of the QMLE is satisfactory in terms of the mean and that, the RMSE of the estimators decreases when increases. This is consistent with the results of Theorem 2.2. Also remark that, the fact of computing the QMLE with for trajectories generated without covariates (see the scenarios S0, S’0 and S”0) does not affect the performance of the QMLE, which again confirms its good theoretical properties. As seen in Figure 1, for each component of , the estimated density is very close to that of the normal distribution; which is in accordance with the asymptotic results obtained from Theorem 2.3 when . The results of the test (see Table 1) show that, the statistic is slightly oversized for in cases where the innovation is generated from Student distributions, but the empirical levels are reasonable when in the sense that, they are very close to the nominal one. Further, the empirical powers displayed increases with the sample size and are quite accurate.
5.2 Model selection
Now, we are going to carry out other simulation experiments aimed at evaluating the effectiveness of the proposed model selection procedure in the model (5.1) for choosing the order in the Case 1. To this end, is set as the ”true” model and that the following scenarios are considered:
-
•
scenario S: ;
-
•
scenario S: .
The competing models used are all process satisfying (5.1) with , which leads us to a collection of 10 models.
In the Case 2, consider the multivariate covariate , a VAR(1) (see (5.2)) with parameter , and
Consider the scenario S”1 with the covariate as the true model. The Case 2 with all the combination of the covariates is performed on the data; that is, there are 32 competing models. This example is related and close to the real data application.
For , we simulate independent replications in each of the three scenarios S, S and S”1. We compare the performances of the procedure with (see (3.2)) linked to the Bayesian Information Criteria (BIC) and the procedure with () linked to the Hannan-Quinn information Criterion (HQC). For the scenarios S and S, Figures 2 displays the points , where denotes the average of the orders selected with trajectories of length , as well as the curve of the proportions of number of replications (frequencies) where the associated criterion selects the true order. For the scenario of the Case 2 (i.e, S”1), the probabilities of choosing the true covariate are displayed in Figure 3.
From these figures, the first remark is that, for all the penalties, the performances of the procedure increase with in each scenario. Further, the probability of selecting the true order is very close to when . This shows that, these procedures are in accordance with the results of Theorem 3.1. One can notice that, in the scenario , the penalty is more interesting for selecting the true order than the others penalties for a small sample size (see Figure 2 ((a) and (b)) for ), while in the scenarios and S”1, the HQC with slightly outperforms the BIC penalization when (see Figure 2 ((c) and (d)) and Figure 3). However, the larger the sample size, the penalty (except for the case where ) provides the same accuracies in comparison with the penalty, and displays satisfactory results. The results also show that, as increases, the performances of the penalty increase, which reveals that the common use of the classical HQC penalization (i.e, the penalty with ) is not always the optimal choice to select the best model with this information criterion.
| QMLE | Statistic | |||||||||||
| Scenario | Noise | Levels | Powers | |||||||||
| S0 | Gaussian | Mean | ||||||||||
| Rmse | ||||||||||||
| Mean | ||||||||||||
| Rmse | ||||||||||||
| Student | Mean | |||||||||||
| Rmse | ||||||||||||
| Mean | ||||||||||||
| Rmse | ||||||||||||
| \hdashline[2pt/3pt] S1 | Gaussian | Mean | ||||||||||
| Rmse | ||||||||||||
| Mean | ||||||||||||
| Rmse | ||||||||||||
| Student | Mean | |||||||||||
| Rmse | ||||||||||||
| Mean | ||||||||||||
| Rmse | ||||||||||||
| S’0 | Gaussian | Mean | ||||||||||
| Rmse | ||||||||||||
| Mean | ||||||||||||
| Rmse | ||||||||||||
| Student | Mean | |||||||||||
| Rmse | ||||||||||||
| Mean | ||||||||||||
| Rmse | ||||||||||||
| \hdashline[2pt/3pt] S’1 | Gaussian | Mean | ||||||||||
| Rmse | ||||||||||||
| Mean | ||||||||||||
| Rmse | ||||||||||||
| Student | Mean | |||||||||||
| Rmse | ||||||||||||
| Mean | ||||||||||||
| Rmse | ||||||||||||
| S”0 | Gaussian | Mean | ||||||||||
| Rmse | ||||||||||||
| Mean | ||||||||||||
| Rmse | ||||||||||||
| Student | Mean | |||||||||||
| Rmse | ||||||||||||
| Mean | ||||||||||||
| Rmse | ||||||||||||
| \hdashline[2pt/3pt] S”1 | Gaussian | Mean | ||||||||||
| Rmse | ||||||||||||
| Mean | ||||||||||||
| Rmse | ||||||||||||
| Student | Mean | |||||||||||
| Rmse | ||||||||||||
| Mean | ||||||||||||
| Rmse | ||||||||||||


6 Real data example
We consider the daily concentrations of the PM10 (particulate matter with a diameter less than 10) in the Vitória metropolitan area; see Figure 4(a). These data as well as those of the other meteorological variables (see below) are obtained from the State Environment and Water Resources Institute, and were collected at eight monitoring stations. We focus on the data from January 21st, 2005 to March 04th 2006, these observations on 408 days are a part of a large dataset (available at https://rss.onlinelibrary.wiley.com/pb-assets/hub-assets/rss/Datasets/RSSC%2067.2/C1239deSouza-1531120585220.zip) which were analyzed by Souza et al. (2018) to quantify the association between respiratory disease and air pollution concentrations.
The variables considered are: the average concentration for the particulate matter (PM10, ), sulphur dioxide (SO2, ), nitrogen dioxide (NO2, ), carbon monoxide (CO, ), ozone (O3, ); and Air relative humidity (RH, %). Table 2 displays some elementary statistics of these variables.
| Variable | Mean | SD | Min | Med | Max | ||
| PM10 () | 32.04 | 8.62 | 11.16 | 26.19 | 31.87 | 36.92 | 66.60 |
| SO2 () | 11.64 | 2.74 | 4.89 | 9.75 | 11.63 | 13.48 | 19.29 |
| NO2 () | 24.57 | 6.41 | 10.47 | 19.93 | 23.79 | 28.84 | 46.84 |
| CO () | 969.70 | 254.85 | 456.00 | 785.10 | 951.00 | 1129.70 | 2141.50 |
| O3 () | 29.96 | 7.68 | 16.76 | 24.79 | 28.46 | 33.96 | 66.52 |
| RH (%) | 79.21 | 6.52 | 62.45 | 74.36 | 78.67 | 83.62 | 95.39 |
As pointed out by Ng and Awang (2018), PM10 is a notorious air pollutant associated in particular with detrimental health impacts; it affects the respiratory and cardiopulmonary functions and increases the morbidity and mortality rate of related diseases. Therefore, forecasting the PM10 concentration and understanding its relation with other factors is an important issue. Several models, including among others models, ARIMA, MLR (multiple linear regression), RTSE (Regression with time series error), were considered; we refer to Ng and Awang (2018) and Ng (2017) and the references therein for an overview of this issue.
In this section, we focus on the forecast of the PM10 concentration from some meteorological variables of the previous day. We apply the model (5.1) with , and the covariate (the value of the corresponding variable at day ). The following issues are addressed.
-
1.
Model selection. The aim is to select the orders and the ”best” subset of the covariates that are the major factor related to the next-day PM10 concentration. For this purpose, we consider all the combination of the covariates with ; which represents a collection of 376 models. The procedure based on the penalized criteria (see (3.2)) is applied with the regularization parameter . These criteria (BIC and HQC) select the model with , and the covariate . Compared to ARIMA, this model is also preferred. This result is in accordance with some existing works (see, for instance, Ng and Awang (2018) and Ng (2017)) which have found that the air humidity of the previous day is an important factor related to PM10 concentration.
-
2.
Estimation and significance test. The estimated model is:
where in parentheses are the standard errors of the estimators obtained from the robust sandwich matrix. The test (2.8) with is now applied for testing the significance of the covariate. At the nominal level , the critical value of the test, computed from is 2.68 and the statistic, computed from (see (2.9)) is 10.86. Thus, the null hypothesis is rejected. Figure 4 displays the histogram and cumulative periodogram of the residuals as well as the autocorrelation functions of the squared residuals. From these findings, the residuals do not show any signs of correlation.
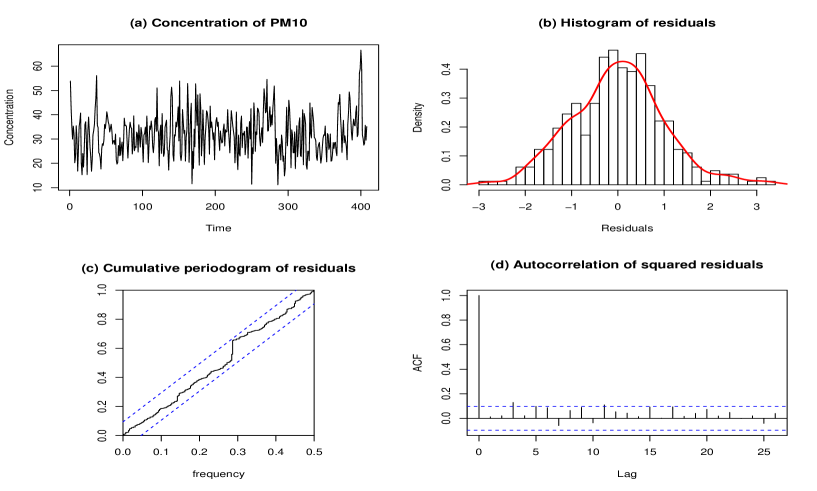
Figure 4: (a) The daily concentrations of the PM10 from January 21st, 2005 to March 04th 2006; (b), (c) the histogram and the cumulative periodogram of the residuals; (d) the autocorrelation functions of the squared residuals.
In conclusion of this section, let us stress that, several authors have applied the MLR and the RTSE on other data and have found that NO2, CO, O3 were also important factors associated to the PM10 concentration (see Ng and Awang (2018) and Ng (2017) and the references therein). For the data considered here, and by applying the model (5.1), it appears that these variables were less important in for forecasting the PM10 concentrations.
7 Summary and conclusion
This paper considers a general class of causal processes with exogenous covariates in a semiparametric framework. This class is quite extensive and many classical processes such as ARMA-GARCH, ARMAX-GARCH-X, APARCH-X, are particular cases.
Sufficient conditions for the existence of a stationary and ergodic solution are provided.
A quasi likelihood estimator is performed for inference; the consistency of this estimator is established and the asymptotic distribution is derived. This distribution coincides with the Gaussian one, when the true parameter is an interior point of the parameter’s space.
A Wald-type statistic is proposed for testing the significance test of parameter. The asymptotic studies show that, this test has correct size asymptotically and is consistent in power. In certain cases, this test can be used in particular to test the relevance of the exogenous covariates.
The model selection question for the class - is carried out by a penalized quasi likelihood contrast. The weak and the strong consistency of the proposed procedure is established. These results provide sufficient conditions for the consistency of the BIC and the HQC procedures. Simulation study shows that, the empirical and the theoretical results are overall in accordance.
An extension of this works is to address the inference, the significance test of parameter, the model selection problem for the class - with a non Gaussian quasi likelihood. For instance, as pointed out by Kengne (2021), the use of the Laplacian quasi likelihood will allow to reduce the order of moments imposed to the process.
Other topics of a research project, are the change-point detection and the prediction question (see for instance Ing (2003), Ing and Wei (2003, 2005)) for this class of models.
8 Proofs of the main results
To simplify the expressions, in the proofs of Theorems 2.2, 2.3 and 3.1, we will use the conditional Gaussian quasi-log-likelihood given by and . Throughout the sequel, denotes a positive constant whom value may differ from an inequality to another.
8.1 Proof of Proposition 2.1
We verify that the process satisfies the conditions required for the Theorem 3.1 in Doukhan and Wintenberger [6]. According to (1.1), for all ,
with and for all . Thus, the equation (1.1) of [6] holds for . For a vector , define the norm for some . According to Doukhan and Wintenberger (2008), it suffices to show that:
-
(i)
for some ;
-
(ii)
there exists a non-negative sequence satisfying such that, for all ,
8.2 Proof of Theorem 2.2
We consider the following lemma.
Proof of Lemma 8.1
Remark that
Hence, by Corollary 1 of Kounias and Weng (1969), with (without loss of generality), it suffices to show that
| (8.1) |
For any , by applying the mean value theorem at the functions and , we have
This implies
Moreover, since for some , by Assumption A, one can easily show that:
| (8.2) | |||
| (8.5) |
Then, by the Hölder’s inequality, we have
Again, by the Hölder’s inequality, from (8.2) and (8.5), we obtain
Hence, from (2.3), we deduce
where the last inequality holds since . Thus, the condition (8.1) is satisfied. This completes the proof Lemma 8.1.
To complete the proof of Theorem 2.2, we will show that: (1.) and (2.) the function has a unique maximum at .
-
(1.)
For all , using the inequality for all , we have
Hence, from (8.2), we deduce
which shows that (1.) holds.
-
(2.)
Let with . We have
(8.6) Moreover,
Therefore, using (8.6) and by applying the Jensen’s inequality, we get
Since for any ; and for , we deduce:
-
•
if , then and ,
-
•
if , then
From the identifiability condition (A0), when and , we necessarily have . This implies , and thus .
The equality holds a.s. if and only if . This achieves the proof of (2.).
-
•
Since is stationary and ergodic, the process is also a stationary and ergodic sequence. Then, according to (1.), by the uniform strong law of large number applied on the process , it holds that
Then, by Lemma 8.1, we obtain
| (8.9) |
The part (2.) and (8.9) lead to conclude the proof of the theorem.
8.3 Proof of Theorem 2.3
The following lemma is needed.
Proof of Lemma 8.2
-
(i.)
Remark that
(8.10) Moreover, for all ,
(8.11) which implies
Using the relation , we get
(8.12) By applying the Hölder’s inequality to the terms of the right hand side of ((i.)), we have
Moreover, since , using A and A (with ), one can go along similar lines as in Bardet and Wintenberger (2009) to establish the following results:
(8.13) (8.18) Thus, using (8.2), (8.5), (8.13) and (8.18) with , we obtain
Therefore, in view of the condition (2.7), it holds that
By the inequality (8.10), we deduce
This proves the part (i.) of Lemma 8.2.
-
(ii.)
This part can be established by using the same arguments as in the proof of Lemma 8.1.
-
(iii.)
Let us show that , for all .
From ((i.)), for any , we haveTherefore, according to (A1), we get
(8.19) Moreover, by A and A, one can show that
Thus, by applying the Hölder’s inequality to the terms of the right hand side of ((iii.)), it suffices to use (8.2) and (8.13) to obtain .
Since for all , from the stationarity and ergodicity properties of and the uniform strong law of large numbers, it holds thatThis completes the proof of Lemma 8.2.
The following lemma is also needed.
Lemma 8.3
Proof of Lemma 8.3
-
(i.)
Recall that and that for all ,
Since the functions , , and are -measurable, we have
which shows that (i.) holds.
-
(ii.)
Let be a sequence satisfying . For any , we have
Thus,
We conclude the proof of the part (ii.) by using Lemma 8.2 (ii.).
Now, we use the results of Lemma 8.2 and 8.3 to prove the first part of Theorem 2.3.
The second part can be established by going along similar lines as in Kengne (2021).
By applying a second-order Taylor expansion to the function , for all , there exists between and such that
| (8.20) |
where
Let us define the vector
Then, we can rewrite (8.20) as
| (8.21) |
Define also
Then, by (2.4), for large enough, we have
where is the -projection of on . Using this relation and the definition of , we have
Furthermore, from (8.21) and the definition of , it holds that
Therefore,
| (8.22) |
Let us consider the following Lemma.
Lemma 8.4
Assume that the conditions of Theorem 2.3 hold. Then
By Lemma 8.4 and (8.22), it follows that
| (8.23) |
Moreover, according to the equivalent definition of the -orthogonal projection in (2.6), we get
Therefore, from (8.23), we obtain
| (8.24) |
Now, using Lemma 8.3 (i.), we apply the central limit theorem for the stationary ergodic martingale difference sequence . It follows that
| (8.25) |
and thus
| (8.28) |
Hence, . From this, it suffices to use (8.24) to conclude the proof of Theorem 2.3.
8.4 Proof of Theorem 2.4
Under , we have . Then, we get
| (8.31) |
Recall that, by Theorem 2.4, we have with .
Furthermore, .
Thus, from (8.4), it holds that
which establishes the theorem.
Proof of Corollary 2.5.
When , we have
with and . Since is symmetric, the vector follows a multivariate Gaussian distribution with mean and covariance matrix , where is the identity matrix of size .
Therefore, all components of are independent, standard normal distributed random variables. This leads to the conclusion.
8.5 Proof of Theorem 3.1
Consider the following lemma.
Lemma 8.5
Assume that the conditions of Theorem 3.1 hold. Then
Proof of Lemma 8.5.
Using the inequality (8.10) and Corollary 1 of of Kounias and Weng (1969), it suffices to show that
| (8.32) |
In the proof of Lemma 8.3, we have established that
Then, from the condition (3.4), we obtain
Let us prove the part (i.) of the theorem.
-
(i.)
We have
Therefore, it suffices to show that
(8.33) 1. Let such as . We have,
(8.34) Let us establish that
(8.35) From the Taylor expansion of , we can find between and such that
(8.36) where
and
Moreover, since , in this case of overfitting, the same arguments as in the proof of Lemma 8.3 (ii.) lead to
Then, one can show as in the proof of Theorem 2.3 that . Also, we have . In addition, is a stationary ergodic square integrable martingale difference sequence (see above). Hence, from the law of iterative logarithm for martingales (see for instance [27, 28]), we get,
Thus, we have from (8.36),
(8.37) By using the same arguments with , we get
(8.38) Therefore, since and , then (8.34) and (8.35) lead to
This implies that, for large ,
with probability one; that is, .
2. Let such as . We have,
(8.39) Using the same arguments in the proof of Theorem 3.1 of Bardet et al. (2020), we get
where , for all . Note that, the function has a unique maximum at (see the proof of Theorem 2.2). Since , it holds that ; and consequently, . Thus, according to (8.39) and since , we get
This implies that . Hence, the condition (8.33) holds; and the part (i.) of the theorem is established.
-
(ii.)
Let such as . We have
Moreover, from the same arguments as in the proof of Theorem 3.1 in Kengne (2021), one can show that
Thus, we can find a constant such that if , then
This implies that
(8.40) Note that, the inequality (8.40) also holds when (see the part 2. of the proof of (i.)). Hence, we deduce that ; which establishes the strong consistency of .
-
(iii.)
Using Lemma 8.5, this part can be proved by going along similar lines as in Kengne (2021).
Acknowledgements
The authors are very grateful to the Editor, the Associate Editor and the anonymous Referee for many relevant suggestions and comments which helped to improve the contents of this article.
References
- [1] Bardet, J. M., Kengne, K. and Wintenberger, O. Multiple breaks detection in general causal time series using penalized quasi-likelihood. Electronic Journal of Statistics 6, (2012), 435-477.
- [2] Bardet, J.-M. and Wintenberger, O. Asymptotic normality of the quasi-maximum likelihood estimator for multidimensional causal processes. The Annals of Statistics 37, 5B, (2009), 2730-2759.
- [3] Bardet, J.-M., Kamila, K. and Kengne, W. Consistent model selection criteria and goodness-of-fit test for common time series models. Electron. J. Stat. 14, (2020), 2009-2052.
- [4] Bierens, H. J. Topics in advanced econometrics: estimation, testing, and specification of cross-section and time series models. Cambridge University Press, (1996).
- [5] Deistler, M. The properties of the parameterization of ARMAX systems and their relevance for structural estimation and dynamic specification. Econometrica: Journal of the Econometric Society, (1983), 1187-1207.
- [6] Doukhan, P. and Wintenberger, O. Weakly dependent chains with infinite memory. Stochastic Process. Appl. 118, (2008), 1997-2013.
- [7] Francq, C. and Sucarrat, G. An equation-by-equation estimator of a multivariate log-GARCH-X model of financial returns. Journal of Multivariate Analysis, 153, (2017), 16-32.
- [8] Francq, C. and Thieu, L.Q. QML inference for volatility models with covariates. Econometric Theory, 35, (2019), 37-72.
- [9] Grønneberg, S. and Holcblat, B. Factor double autoregressive models with application to simultaneous causality testing. Annals of Statistics 47(6), (2019), 3216–3243.
- [10] Guo, S., Ling S. and Zhu, K. Factor double autoregressive models with application to simultaneous causality testing. Journal of Statistical Planning and Inference 148, (2014), 82-94.
- [11] Han, H. and Kristensen, D. Asymptotic Theory for the QMLE in GARCHX Models With Stationary and Nonstationary Covariates. Journal of Business Economic Statistics 32, (2014) , 416-429.
- [12] Han, H. Asymptotic properties of GARCH-X processes. Journal of Financial Econometrics, 13, (2015), 188-221
- [13] Hannan, E.J. The identification and parameterization of ARMAX and state space forms. Econometrica: Journal of the Econometric Society, (1976), 713–723.
- [14] Hannan, E. J. and Deistler, M. The statistical theory of linear systems. SIAM, (2012).
- [15] Ing, C.-K. Multistep prediction in autoregressive processes. Econometric theory, 19(02), (2003), 254-279.
- [16] Ing, C.-K. and Wei, C.-Z. On same-realization prediction in an infinite-order autoregressive process. Journal of Multivariate Analysis, 85(01), (2003), 130-155.
- [17] Ing, C.-K. and Wei, C.-Z. Order selection for same-realization predictions in autoregressive processes. The Annals of Statistics, 33(05), (2005), 2423-2474.
- [18] Kengne, W. Strongly consistent model selection for general causal time series. Statistics and Probability Letters, (2021).
- [19] Kounias, E.G. and Weng, T.-S. An inequality and almost sure convergence. Annals of Mathematical Statistics 33, (1969), 1091-1093.
- [20] Ling, S. and McAleer, M. Asymptotic theory for a vector ARMA-GARCH model. Econometric theory 19(02) (2003), 280-310.
- [21] Ling, S. Adouble AR model: structure and estimation. Statist. Sinica 17, (2007), 161-175.
- [22] Nana, G.N., Korn, R. and Elwein-Sayer, C. GARCH-extended models: theoretical properties and applications. arXiv:1307.6685v1, (2013).
- [23] Ng, K. Y. Statistical Modelling For Forecasting PM10 Concentrations In Peninsular Malaysia. PhD Thesis, Universiti Sains Malaysia, (2017).
- [24] Ng, K. Y. and Awang, N. Multiple linear regression and regression with time series error models in forecasting PM 10 concentrations in Peninsular Malaysia. Environmental monitoring and assessment 190(2), (2018), 1-11.
- [25] Pedersen, R.S. and Rahbek, A. Testing Garch-X Type Models. Econometric Theory 35(5), (2018), 1-36.
- [26] Souza, J. B., Reisen, V. A., Franco, G. C., Ispány, M., Bondon, P., and Santos, J. M. Generalized additive models with principal component analysis: an application to time series of respiratory disease and air pollution data. Journal of the Royal Statistical Society: Series C (Applied Statistics) 67, 2 (2018), 453–480.
- [27] Stout, W. F. The Hartman-Wintner law of the iterated logarithm for martingales. The Annals of Mathematical Statistics 41 (1970), 2158-2160.
- [28] Stout, W. F. Almost sure convergence. Academic press (1974).
- [29] Sucarrat, Genaro and Grønneberg, S. and Escribano, A. Testing for local covariate trend effects in volatility models. Computational Statistics & Data Analysis 100 (2016), 582-594.
- [30] Tong, H. Non-linear time series: a dynamical system approach. Oxford University Press (1990).
- [31] Zambom, A. Z. and Gel, Y. R. Testing for local covariate trend effects in volatility models. Electronic Journal of Statistics 14(2) (2020), 2529-2550.