Update of the CLRP eye plaque brachytherapy database for photon-emitting sources
Habib Safigholi, Zack Parsons, Stephen G. Deering, and Rowan M. Thomson
Carleton Laboratory for Radiotherapy Physics, Department of Physics,
Carleton University, Ottawa, Ontario, K1S 5B6, Canada
email: a) safigholi@gmail.com and b) rthomson@physics.carleton.ca
Abstract
Purpose: To update and extend the Carleton Laboratory for Radiotherapy Physics (CLRP) Eye Plaque (EP) dosimetry database for low-energy photon-emitting brachytherapy sources using egs_brachy, an open-source EGSnrc application. The previous database, CLRP_EPv1, contained datasets for the Collaborative Ocular Melanoma Study (COMS) plaques (10-22 mm diameter) with 103Pd or 125I seeds (BrachyDose-computed, 2008). The new database, CLRP_EPv2, consists of newly-calculated 3D dose distributions for 17 plaques [8 COMS, 5 Eckert & Ziegler BEBIG, and 4 others representative of models used worldwide] for 103Pd, 125I, and 131Cs seeds.
Acquisition and Validation Methods:
Plaque models are developed with egs_brachy, based on published/manufacturer dimensions and material data. The BEBIG plaques (modelled for the first time) are identical in dimensions to COMS plaques but differ in elemental composition and/or density. Previously-benchmarked seed models are used. Eye plaques and seeds are simulated at the centre of full-scatter water phantoms, scoring in (0.05 cm)3 voxels spanning the eye for scenarios: (i) ‘HOMO’: simulated TG43 conditions; (ii) ‘HETERO’: eye plaques and seeds fully modelled; (iii) ‘HETsi’ (BEBIG only): one seed is active at a time with other seed geometries present but not emitting photons (inactive); summation over all seeds in a plaque then yields ‘HETsum’ (includes interseed effects). For validation, doses are compared to those from CLRP_EPv1 and published data.
Data Format and Access:
Data are available at https://physics.carleton.ca/clrp/eye_plaque_v2, http://doi.org/10.22215/clrp/EPv2. The data consist of 3D dose distributions (text-based EGSnrc “3ddose” file format) and graphical presentations of the comparisons to previously published data.
Potential Applications:
The CLRP_EPv2 database provides accurate reference 3D dose distributions to advance ocular brachytherapy dose evaluations. The fully-benchmarked eye plaque models will be freely-distributed with egs_brachy, supporting adoption of model-based dose evaluations as recommended by TG-129, TG-186, and TG-221.
Key words: CLRP, eye plaque, dose calculation, brachytherapy, egs_brachy
I. Introduction
Eye plaque (EP) brachytherapy plays an important role in the treatment of intraocular cancers offering delivery of conformal doses to the tumour, with steep dose gradients sparing critical organs at risk [1, 2, 3]. Survival rates with plaque therapy have been reported to be comparable to enucleation but with eye preservation and the possibility of retaining some visual function [4, 5]. Recent work suggests inferior clinical outcomes with proton therapy compared with eye plaque brachytherapy [6].
The small size of the eye combined with considerable dose gradients for eye plaque brachytherapy mean that dosimetry is critical [1, 2]. Traditionally, dose calculations for plaques containing photon-emitting sources follow the water-based approach of Task Group (TG) 43 [7]. Model-based dose calculation algorithms (MBDCAs), including Monte Carlo (MC) simulations, promise more accurate dose evaluations by accounting for non-water treatment components (applicator, sources) and patient non-water tissues. Various MC studies have demonstrated considerable errors incurred with the TG-43 approach for eye plaque brachytherapy dose evaluation [1]. For example, MC studies focusing on modelling plaque backing/insert materials (in water phantom) report dose decreases relative to TG-43 of 11 to 40% in the tumour, and as large as 90% in organs at risk for the standardized plaques of the Collaborative Ocular Melanoma Study (COMS) containing 125I or 103Pd seeds [8, 9, 10, 11]. Considerable differences with TG-43 have been demonstrated for other photon-emitting plaque models as well as when modelling non-water patient/ocular anatomy [12, 10, 13, 14]. These discrepancies with TG-43 doses motivated both TG-129 and TG-221 to recommend that dose evaluations accounting for the effects of the plaque backing and insert be carried out in parallel with traditional TG-43 calculations [2, 1], in accord with the general recommendations of TG-186 on adoption of MBDCAs in brachytherapy [15].
The present work supports widespread adoption of MC dose evaluations for photon-emitting eye plaques. We use egs_brachy, a freely-distributed and open-source EGSnrc application [16, 17], to develop 17 eye plaque models: 10-24 mm diameter COMS, 12-20 mm BEBIG (manufactured by Eckert & Ziegler BEBIG, Berlin, Germany), and four 16 mm diameter plaques representative of various models in use worldwide [14]. Employing benchmarked egs_brachy 125I, 103Pd, and 131Cs seed models[18], we simulate the eye plaques in a water phantom to generate 3D dose distributions scored in (0.05 cm)3 voxels in the eye region.
These 3D dose distributions are used to completely update and extend the Carleton Laboratory for Radiotherapy Physics (CLRP) Eye Plaque Brachytherapy database that was originally published in 2008 (version 1, “CLRP_EPv1”: contained BrachyDose-calculated dose distributions for 10-22 mm COMS plaques with 103Pd or 125I seeds [10]). The present article describes the CLRP_EPv2 database https://physics.carleton.ca/clrp/eye_plaque_v2 (http://doi.org/10.22215/clrp/EPv2) that contains 3D dose distributions for diverse photon-emitting eye plaques, and the egs_brachy plaque models that will be freely-distributed with the egs_brachy distribution (https://physics.carleton.ca/clrp/egs_brachy/).
II. Acquisition and Validation Methods
II.A. Monte Carlo simulations of eye plaques
All MC calculations are performed with EGSnrc application egs_brachy [16] (GitHub commit hash 8166234, 2020, available at https://github.com/clrp-code/egs_brachy/tree/egs_brachy_2020). The benchmarking of egs_brachy is documented in previous publications [16, 17, 18]. Transport parameters are generally EGSnrc defaults [19] , using the low-energy default specifications distributed with egs_brachy. Electron transport is not modelled. The photon energy transport cutoff is set to 1 keV. Photoelectric absorption, Rayleigh scattering, Compton scattering, and fluorescent emission of characteristic x rays are simulated. Photon cross sections are from the XCOM database [20]. Dose is approximated as collision kerma, scored with a tracklength estimator in voxels with mass energy absorption coefficients (distributed with egs_brachy; previously calculated with EGSnrc application g [21]). The “unrenormalized” photoelectric cross sections are used, consistent with EGSnrc default [19] (note that there is ambiguity in whether renormalized or unrenormalized Scofield photoelectric cross sections are in better agreement with experimental data [22]).
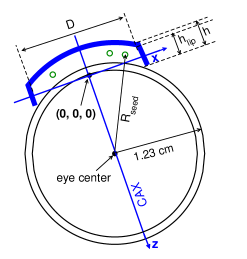
The egs class library geometry module is used to develop the eye plaque models: COMS plaques with diameters () from 10 to 24 mm (in 2 mm increments) [2, 23], BEBIG plaques with diameters from 12 to 20 mm (in 2 mm increments; simulated for the first time), and four different 16 mm diameter “representative” plaque models [1, 14]. These representative plaque models were previously developed by Lespérance et al [14] to approximate different plaque models in use worldwide (for which exact dimensions and material specifications are not widely available and/or accurately known), and include: “Short lip-acrylic” (Sla) [24], “COMS-thin acrylic” (Cta) [25], “No lip-Silastic” (NlS)[26], “Stainless steel-acrylic” (Ssa)[27]. The plaque models and associated parameters are summarized in table 1††margin: Table 1 with parameters/dimensions defined in figure 1††margin: Fig 1 ; the online CLRP_EPv2 database contains diagrams of each plaque model.
| Dimensions (mm) | ||||||||
|---|---|---|---|---|---|---|---|---|
| Plaque model | Backing (thickness) | Insert | Radionuclides | Ref. | ||||
| COMS | Modulay (0.5 mm) | full, Silastic | 125I,103Pd,131Cs | 2.75 | 2.7 | 13.7 | [2, 10, 23] | |
| BEBIG | BioPontoStar (0.5 mm) | full, Silastic | 125I | 2.75 | 2.7 | 13.7 | ∗ | |
| COMS - thin acrylic (Cta) | Modulay (0.5 mm) | thin 0.85 mm, acrylic | 125I,103Pd,131Cs | 16 | — | 2.7 | 13.7 | [14, 25] |
| Short lip - acrylic (Sla) | Modulay (0.5 mm) | full, acrylic | 125I,103Pd,131Cs | 16 | 1.8 | 1.5 | 12.95 | [14, 24] |
| No lip - Silastic (NlS) | Modulay (0.5 mm) | full, Silastic | 125I,103Pd,131Cs | 16 | 1.8 | — | 12.95 | [14, 26] |
| Stainless steel - acrylic (Ssa) | stainless steel (1 mm) | full, acrylic | 125I,103Pd,131Cs | 16 | 2.75 | 2.1 | 13.45 | [14, 27] |
∗ Personal communication, Michael Andrássy (Eckert & Ziegler BEBIG) June 18, 2019
Each eye plaque model has a backing (with or without collimating lips), and contains either a full insert (that conforms to the outer sclera) or a thin layer of fixative that holds seeds in place. The COMS plaques have a Modulay backing (elemental composition by mass: 77% Au, 14% Ag, 8% Cu, and 1% Pd; mass density, = 15.8 g/cm3) with collimating lips and a full Silastic insert seed carrier (39.9% Si, 28.9% O, 24.9% C, 6.3% H, 0.005% Pt; = 1.12 g/cm3)[2]. Compared to the COMS plaques, the BEBIG plaques have identical geometry but with a different gold alloy comprising the backing, “Bio PontoStar” (87% Au, 10.6% Pt, 1.5% Zn, 0.2% Rh, 0.2% In, 0.2% Ta, and 0.02% Mn, = 18.8 g/cm3), and the Silastic insert has a different mass density of ( = 1.09 g/cm3 [Personal communication, Michael Andrássy (Eckert & Ziegler BEBIG), June 18, 2019]). The representative plaque models (Cta, Sla, NlS) have Modulay backings, with the exception of the plaque model with the stainless steel backing (Ssa; 99.05% Fe, 0.005% Mn, 0.003% Si, and 0.0015%, = 7.9 g/cm3); their inserts are either Silastic or acrylic (32% O, 60.1% C, 8.06% H, =1.19 g/cm3). All representative plaques have collimating lips (but of varying lengths, - see table 1) with the exception of “No lip -Silastic” (NlS).
All plaques models are based on fitting an idealized eye [2] assumed to be a sphere of radius 1.23 cm, i.e., for the eye plaque models with a full insert (COMS, BEBIG, Sla, NlS, Ssa), the insert conforms to the eye’s outer sclera (radius 1.23 cm). The “eye plaque” coordinate system is used [10, 2, 14] and has its origin at the inner sclera on the plaque’s central axis, taken to be 0.1 cm from the outer sclera (figure 1). The plaque’s central axis (CAX) defines the -axis, with and coordinates transverse to the plaque. Plaques contain between 5 and 33 seeds, with positions and orientations provided in the online CLRP_EPv2 database based on earlier publications: TG-129 report [2] (COMS 10 - 22 mm; BEBIG), Cutsinger et al [23] (COMS 24 mm), and Lespérance et al [14] (representative plaques: Cta, Sla, NlS, Ssa).
Three different seeds are used for COMS and representative plaque simulations: the 103Pd Theragenics TheraSeed® model 200[28, 18], 125I Amersham OncoSeed model 6711[29, 18], and 131Cs Isoray model CS-1 Rev2® [30, 18]. For BEBIG plaques, the ophthalmic 125I BEBIG IsoSeed® I-125 (I25.S16) is used which is geometrically identical to the I25.S06 but has higher activity for use in ophthalmologic oncology [31, 18]. The egs_brachy models of these seeds were recently developed and benchmarked as part of updated 2020 CLRP TG-43v2 database [18]. Photons are initialized within the seeds according to the NNDC spectra [32] for 103Pd and 131Cs seeds, and for 125I from the NCRP report 58[33], all consistent with CLRP TG43v2 database [18]. The phase space source, particle recycling and other variance reduction technique features of egs_brachy (that enhance simulation efficiency) are not used[16]. The mean energy of photons emitted from the seeds calculated by egs_brachy are 20.51 keV (103Pd model 200), 27.34 keV (125I model 6711), 30.29 keV (131Cs model CS-1), and 28.16 keV (I25.S16) [18].
Plaques and seeds are modelled at the centre of a full-scatter water phantom ( = 0.998 g/cm3) which extends from -15 cm 15 cm. Dose is scored in a array of (0.05 cm)3 voxels spanning the eye region, extending from -1.275 cm 1.275 cm, and from -0.075 cm 2.475 cm (voxels centered along the plaque’s central axis). For voxels that overlap with the plaque, dose is scored only in the portion of the voxel not occupied by the plaque, necessitating application of egs_brachy’s voxel volume correction for which random points/cm3 is used [18, 16].
Different scenarios are simulated, all with seeds fully modelled:
-
1.
‘HOMO’: Simulated TG-43 conditions with the plaque backing/insert modelled as water and no interseed effects (egs_brachy in ‘superposition’ run mode).
-
2.
‘HETERO’: Eye plaques containing seeds are fully modelled in the water phantom.
-
3.
‘HETsi’ (BEBIG plaques only): One seed is modelled at a time, with other seed geometries present but the seeds inactive. This produces one 3D dose distribution for each seed position in a plaque. This is repeated for all seeds to enable superposition (accounting for seeds of possibly differing source strengths) to obtain ‘HETsum’ which is the sum of all HETsi (includes interseed effects).
Each calculation involves simulation of photon histories to ensure type A statistical uncertainties 0.2% (1 sigma) at cm (along the central axis at the opposite side of the eye to the plaque). Doses are reported in terms of dose rate per unit seed air kerma strength (Gy h-1 U-1 where 1 U1 cGy cm2 h-1) by dividing the calculated MC dose per history by the seed air kerma strength per history (). The values were previously calculated for the NIST WAFAC detector geometry as part of the CLRP TG43v2 database as Gy cm2/hist (103Pd model 200), Gy cm2/hist (125I model 6711), Gy cm2/hist (125I I25.S16), and Gy cm2/hist (131Cs model CS-1)(https://physics.carleton.ca/clrp/egs_brachy/seed_database_v2) [18]. As an example of the calculation time for a clinical scenario: simulation of a COMS 16 mm plaque fully loaded with 13 125I seeds (model 6711) requires 200 s to achieve 2% statistical uncertainty at the tumor apex ( cm on the plaque central axis) on a single Intel Xeon 3.0 GHz CPU; calculations can be completed in a few seconds running on multiple cores (in parallel).
For validation purposes, the results of the 3D MC dose calculations (.3ddose) are imported into a CLRP in-house software tool (https://physics.carleton.ca/clrp/3ddose_tools/3ddose-tools), e.g., to extract doses along different axes (CAX: central axis, ; transverse for cm).
II.B. CLRP_EPv2 data overview
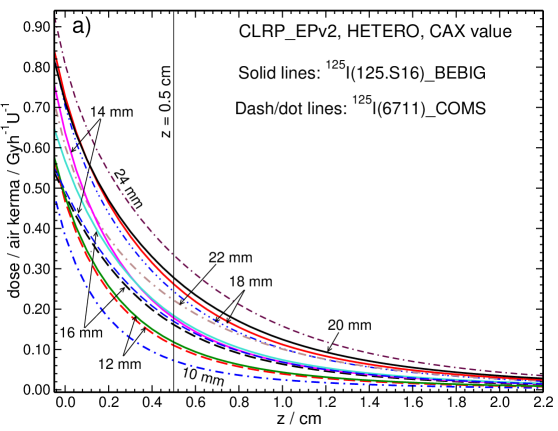
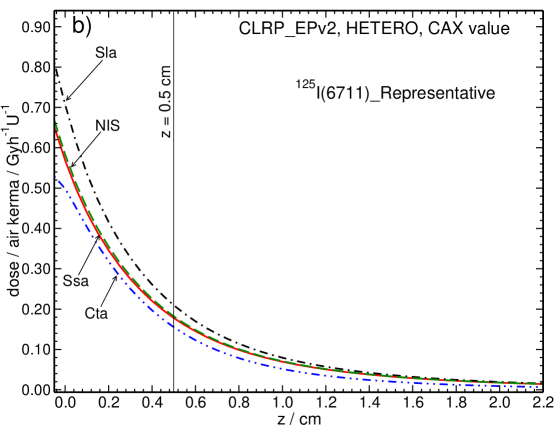
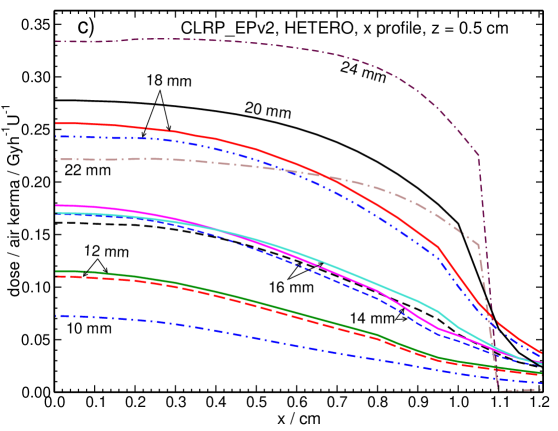
Table 2††margin: Table 2 and figure 2††margin: Fig 2 summarize CLRP_EPv2 data for all 17 plaques loaded with the different seeds, with additional data provided online. In general, considerable dose reductions for HETERO relative to HOMO doses are observed (e.g., Table 2), due to the attenuation and scattering in the backing/insert material. Doses decrease considerably with position along the plaque central axis, with steeper fall-off for lower energy 103Pd (20.51 keV) compared with higher energy 125I [27.34 keV (6711), 28.16 keV (I25.S16)] or 131Cs (30.29 keV) seeds. These general observations are consistent with earlier work [10, 12, 11, 9, 13, 14, 8]. The lowest dose per unit seed air kerma strength along central and transverse axes is for 10 mm COMS which is the smallest-diameter plaque; conversely, the highest values are for 24 mm COMS, the largest-diameter plaque (figure 2). In general, HOMO and HETERO dose rates per unit seed air kerma strength for BEBIG plaques are greater than those for the corresponding COMS plaques.
All representative plaque models generated greater dose rates per unit seed air kerma strength compared to the 16 mm COMS or BEBIG plaques with the lowest dose rate for Cta and highest dose rate for Sla plaque. Also, the transverse dose profiles are relatively flat (near the central axis; 0 to 0.8 cm) for plaques with higher seed number capacity (22 and 24 mm) due to the seed distribution in the plaque.
| COMS (mm) | BEBIG (mm) | Representative | ||||||||||||||||
|---|---|---|---|---|---|---|---|---|---|---|---|---|---|---|---|---|---|---|
| Nuc | (cm) | 10 | 12 | 14 | 16 | 18 | 20 | 22 | 24 | 12 | 14 | 16 | 18 | 20 | Cta | Sla | Ssa | NlS |
| 0.0 | .889 | .875 | .867 | .852 | .853 | .848 | .854 | .844 | .879 | .871 | .857 | .857 | .852 | 1.00 | 1.02 | .964 | .922 | |
| 0.1 | .897 | .887 | .880 | .870 | .866 | .862 | .863 | .857 | .885 | .878 | .869 | .864 | .861 | .995 | 1.01 | .963 | .934 | |
| 0.2 | .897 | .890 | .884 | .878 | .872 | .870 | .869 | .864 | .884 | .879 | .873 | .867 | .864 | .988 | 1.00 | .961 | .938 | |
| 125I | 0.5 | .883 | .881 | .880 | .878 | .874 | .873 | .872 | .869 | .871 | .869 | .868 | .864 | .862 | .968 | .978 | .945 | .935 |
| 1.0 | .854 | .855 | .857 | .859 | .858 | .859 | .859 | .858 | .843 | .844 | .846 | .845 | .844 | .939 | .949 | .923 | .919 | |
| 1.5 | .832 | .834 | .835 | .838 | .838 | .839 | .839 | .836 | .824 | .822 | .825 | .825 | .824 | .915 | .927 | .903 | .904 | |
| 0.0 | .780 | .762 | .753 | .731 | .737 | .732 | .741 | .730 | .989 | 1.01 | .982 | .850 | ||||||
| 0.1 | .803 | .790 | .781 | .769 | .767 | .763 | .766 | .759 | .984 | .999 | .982 | .880 | ||||||
| 0.2 | .812 | .803 | .796 | .788 | .783 | .781 | .782 | .776 | .980 | .992 | .981 | .893 | ||||||
| 103Pd | 0.5 | .814 | .812 | .809 | .807 | .804 | .802 | .802 | .800 | .967 | .977 | .973 | .904 | |||||
| 1.0 | .802 | .803 | .803 | .804 | .804 | .803 | .805 | .803 | .953 | .962 | .962 | .901 | ||||||
| 1.5 | .793 | .794 | .793 | .795 | .794 | .794 | .795 | .796 | .943 | .951 | .953 | .895 | ||||||
| 0.0 | .919 | .906 | .896 | .885 | .881 | .877 | .882 | .871 | 1.00 | 1.02 | .948 | .937 | ||||||
| 0.1 | .923 | .912 | .904 | .897 | .889 | .886 | .888 | .879 | .992 | 1.01 | .945 | .944 | ||||||
| 0.2 | .920 | .913 | .905 | .900 | .892 | .889 | .890 | .882 | .984 | .996 | .941 | .945 | ||||||
| 131Cs | 0.5 | .897 | .896 | .893 | .893 | .887 | .887 | .887 | .881 | .961 | .970 | .925 | .937 | |||||
| 1.0 | .859 | .861 | .861 | .865 | .863 | .864 | .866 | .861 | .923 | .935 | .896 | .916 | ||||||
| 1.5 | .830 | .832 | .833 | .838 | .836 | .838 | .839 | .835 | .895 | .905 | .874 | .897 | ||||||
II.C. Data validation
For validation, dose distributions (from 3ddose files: dose rates per unit seed air kerma strength, see section II.A.) are compared to previously-published doses computed with BrachyDose data from CLRP_EPv1 for 10 - 22 mm COMS with 125I, 103Pd[10, 11] and 16 mm COMS with 131Cs (Ref. [13]); MCNP data[9, 8] for 10 - 22 mm COMS plaques (125I, 103Pd, 131Cs); BrachyDose data for representative plaques [14]. It is not possible to directly compare results for BEBIG and 24 mm COMS plaques because the present study is the first published MC simulation of these plaques (but results for these plaques are compared to the other plaque sizes/types). The following subsections summarize some of the comparisons, including doses along central and transverse axes, as well as at points of interest in the eye (on the central axis: sclera, optic disc, posterior pole, fovea, eye center, lens, lacrimal gland for 8 different plaque positions of the COMS 16 mm plaque, following the work of Rivard et al [8]). Doses are compared directly and also via the the percent difference of doses for egs_brachy () and another code (, from BrachyDose or MCNP):
| (1) |
The following subsections provide a sample of the comparisons carried out, demonstrating overall that egs_brachy dose distributions are in excellent agreement with previously published results.
II.C.1. COMS plaques
Dose distributions generated with egs_brachy for COMS plaques compare well with published BrachyDose and MCNP data, as demonstrated by the overview of comparison results presented in this section.
Figure 3††margin: Fig 3 presents data for some COMS plaques along the central and transverse () axis, focusing on HETERO results; Figure 4††margin: Fig 4 summarizes HETERO dose differences over all COMS plaque sizes, comparing egs_brachy with BrachyDose [10, 14] and MCNP [9]. Across all plaque sizes, egs_brachy and BrachyDose central axis HETERO doses are within 1.2% (103Pd), 1.3% (125I), and 1.4% (131Cs ; 16 mm COMS only), and median discrepancies are much smaller (Fig. 4); agreement is comparable along transverse axes. Comparing egs_brachy and MCNP central axis HETERO doses, percent differences are at most 3.7% (103Pd), 2.2% (125I), and 1.8% (131Cs) for HETERO.
In considering the results in figure 4, there are different trends for with the different radionuclides and codes. For example, all median values for egs_brachy and BrachyDose are very near zero for 103Pd but slightly higher and positive (near 0.5%) for 125I. The values of are generally largest for MCNP and egs_brachy, with the largest and positive values for 103Pd, followed by 131Cs , whereas the values are more generally negative for 125I. The fact that the comparisons lie above and below zero for different radionuclides suggests good agreement in the plaque models.
Overall, doses along the central axis are in good agreement between egs_brachy and previously-published BrachyDose and MCNP results, noting that statistical uncertainties are on for BrachyDose [10, 14, 13] and order of 2% for MCNP (exception: 7.6% for 22 mm plaque)[9]. Discrepancies between results for the different codes may be due to a combination of factors including cross sections, transport parameters, code versions, source spectra, mass-energy absorption coefficient values. Melhus and Rivard [9] estimated that the total uncertainty on their results is 5% at a depth of 5 mm from the plaque (all three radionuclides and COMS plaque sizes, including non-statistical sources of uncertainty).
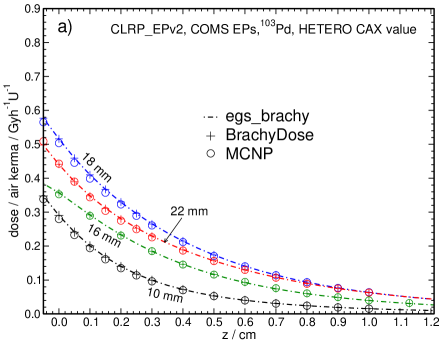
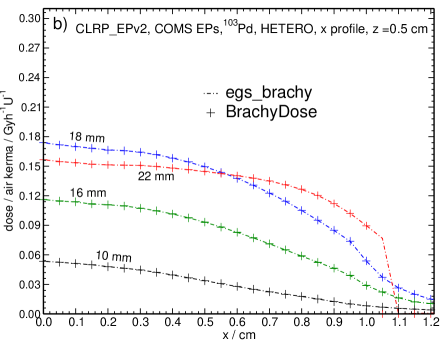
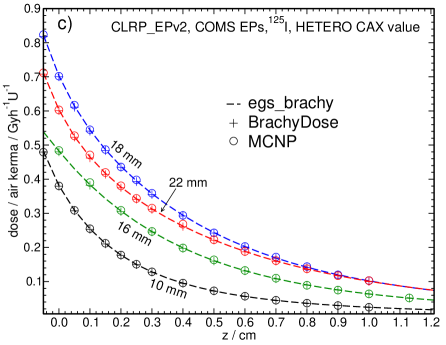
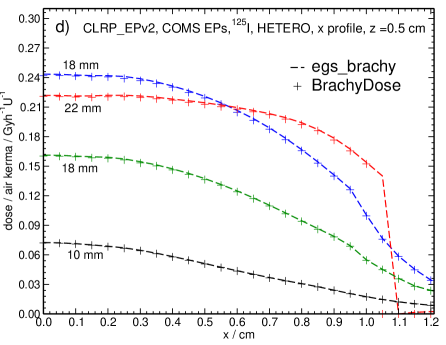
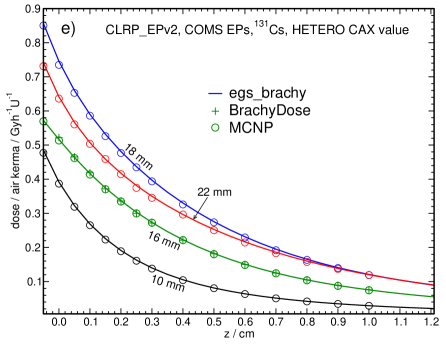
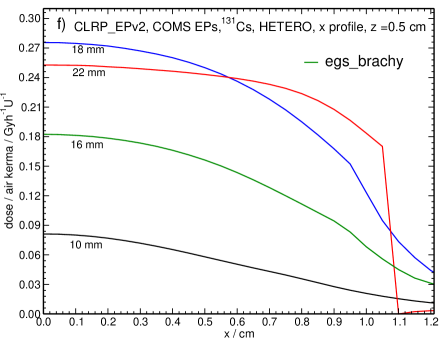
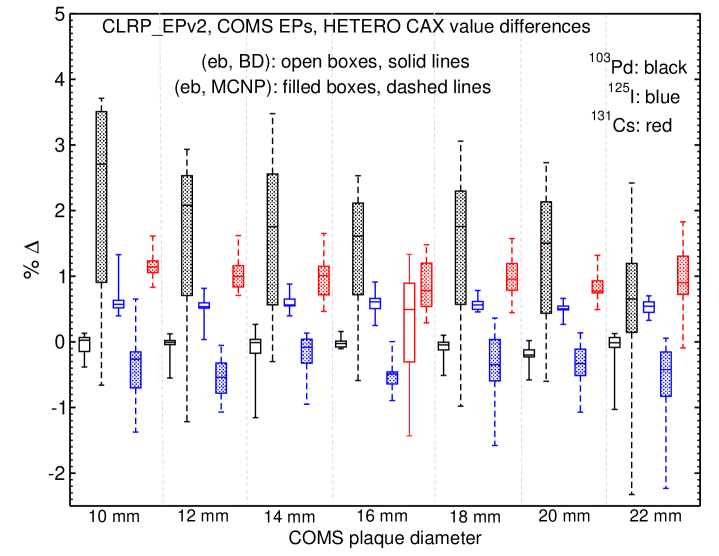
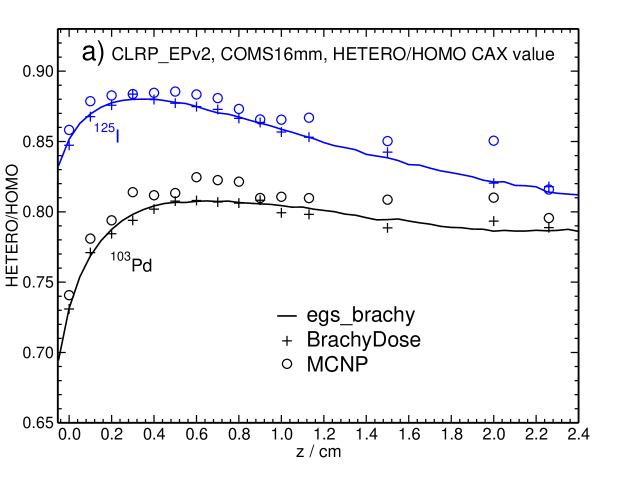
Figure 5††margin: Fig 5 provides further comparison of egs_brachy results with BrachyDose and MCNP for 16 mm COMS. Fig. 5a presents the ratio of doses HETERO/HOMO along the central axis for egs_brachy, BrachyDose [10, 13], and MCNP [8]: comparing with egs_brachy, BrachyDose ratios are within 1.5% (103Pd), 0.5% (125I), and those for MCNP are within 3.0% (103Pd), and 3.5% (125I). The fact that dose ratios are systematically higher for MCNP relative to egs_brachy (and BrachyDose) may be partially attributed to the fact that HOMO MCNP simulations include interseed attenuation (those for egs_brachy and BrachyDose do not), thus lower the dose in the denominator and increasing the HETERO/HOMO ratio. Previous research assessed the magnitude of interseed effects, reporting that doses differed by less than 0.5% (HETERO) and by 1 to 2% for seeds in water (HOMO) [10].
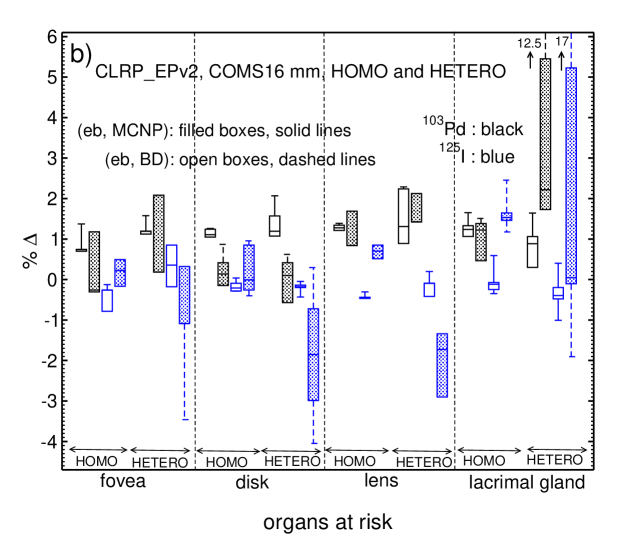
For all codes, the largest discrepancies are observed at the opposite side of the eye to the plaque where the statistical uncertainties are largest. Figure 5b summarizes comparisons of doses at organs at risk (positioned off the central axis), considering eight different plaque positions as done by Rivard et al [8]: differences are 2.3% for egs_brachy and BrachyDose and 4% for egs_brachy and MCNP with the exception of the lacrimal gland HETERO dose for two (of the eight) plaque positions considered. For those positions, the lacrimal gland HETERO doses are very low (3.5 Gy for 103Pd and 6.6 Gy for 125I, compared with 85 Gy as the prescription dose) and MCNP differs by 12.5% (103Pd) and 17% (125I) from egs_brachy. This large discrepancy in the dose at the lacrimal gland for these plaque positions has been observed previously in comparing BrachyDose and MCNP doses [8] and elsewhere in comparing egs_brachy, BrachyDose, and MCNP results [8, 17].
The results shown in this subsection demonstrate that there is generally closer agreement between the two EGSnrc-based code, egs_brachy and BrachyDose, than between egs_brachy and MCNP, consistent with previous work [17]. Overall, these comparisons validate the new egs_brachy models and 3D dose distributions for COMS plaques.
II.C.2. BEBIG plaques
The present work offers the first MC simulations of the BEBIG model plaques, and so comparisons to previously published results are not possible. However, the BEBIG plaques are of the same (geometric) dimensions to the COMS plaques, and thus the validation of our egs_brachy models for those plaques (section II.C.1.) supports the new egs_brachy BEBIG models. The dose distributions are expected to be different for BEBIG compared with COMS due to differences in plaque backing medium (elemental composition and density), insert density, and seed model (125I: IsoSeed® I25.S16 for BEBIG, model 6711 for COMS) on the basis of earlier work investigating backing composition [10] and seed type [11]; this is confirmed by the results (e.g., Table 2).
Figure 6††margin: Fig 6 provides a subset of dose results for a few BEBIG plaque diameters, contrasted with corresponding COMS plaques. Fig. 6a demonstrates that when the doses are normalized to the dose at cm on the plaque central axis (as an example prescription point), doses on the plaque central axis within the tumour ( cm) are slightly lower for BEBIG than for the corresponding COMS plaque (by less than 2% on average), and at the inner sclera the doses for BEBIG plaques are lower by 3.5% (12 mm), 3.4% (14 mm), 2.5% (16 mm), 2.9% (18 mm), and 2.8% (20 mm).
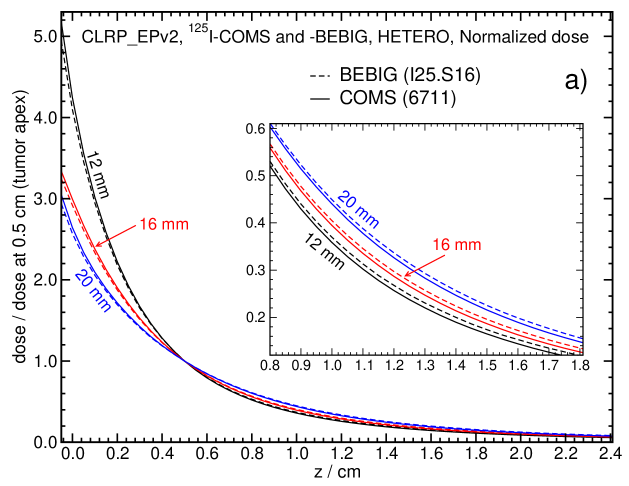
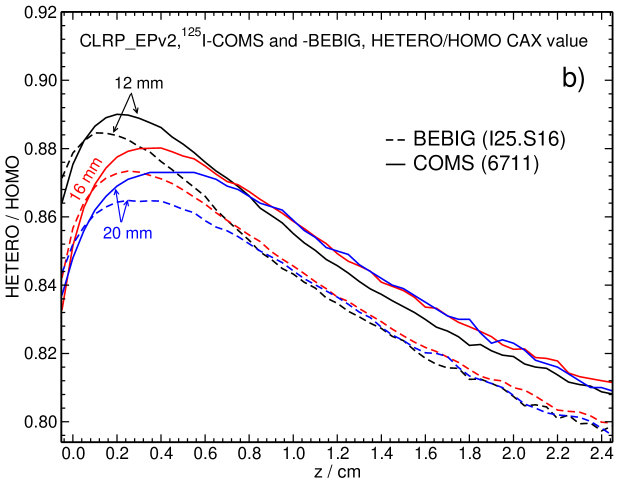
Figure 6b presents the ratio of HETERO/HOMO doses for a subset of BEBIG and COMS plaque sizes (125I seed models: I25.S16 for BEBIG, 6711 for COMS), characterizing the heterogeneity effect due to the plaque. Over all plaque sizes, the dose ratio HETERO/HOMO is larger for BEBIG relative to COMS very near the plaque, but further from the plaque the dose decrease is more substantial for BEBIG than COMS. These differences between BEBIG and COMS dose distributions result from a combination of effects due to plaque backing materials of different elemental compositions and densities, different insert mass densities, and distinct seed models.
The lower mass density of Silastic combined with the slightly higher average energy of the BEBIG I25.S16 seeds results in a slightly higher HETERO/HOMO dose ratio very near the plaque. Further away, the higher atomic number of predominant plaque components (Au, Pt) for BEBIG plaques results in larger dose decreases compared with COMS plaques (no Pt; Ag with Au, among other elements), in accord with previous results comparing pure gold backings with Modulay [10]. Overall, the differences between HETERO/HOMO dose ratios for BEBIG and COMS are 2% or less, consistent with previous comparisons of plaque backings [10] and seed models [11].
In a separate set of simulations, interseed attenuation is investigated for the BEBIG plaques (containing I25.S16 seeds) by comparison of HETERO simulations with and without interseed effects (egs_brachy ‘normal’ and ‘superposition’ run modes, respectively). Interseed attenuation reduces doses by (12 mm), 0.4% (14 mm), 0.3% (16 mm), 1.0% (18 mm), and 1.6% (20 mm) at the inner sclera and by (12 mm), 0.2% (14 mm), 0.2% (16 mm), 0.2% (18 mm), and 0.5% (20 mm) at cm. These relatively small differences between HETERO simulations with and without interseed effects are in accord with previous work that considered other seed models [10, 11].
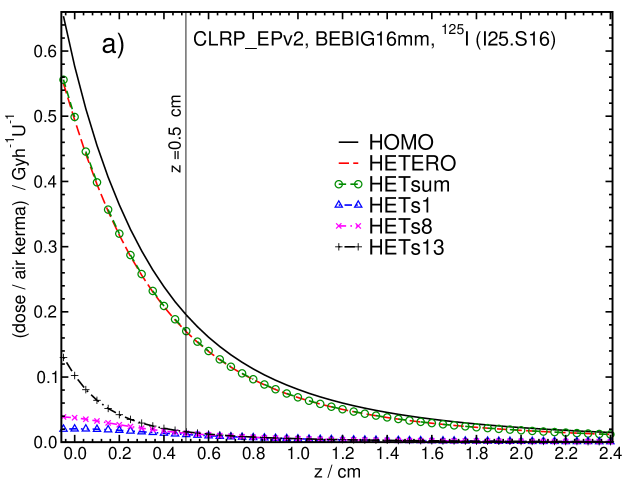
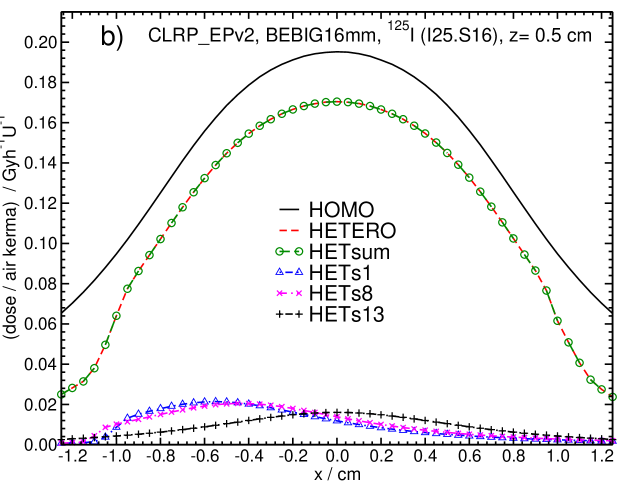
Figure 7††margin: Fig 7 summarizes the HETsi and HETsum results in comparison with HETERO and HOMO. The figures demonstrate that superposition of the HETsi results to determine HETsum provides dose distributions in excellent agreement (as expected) with HETERO results.
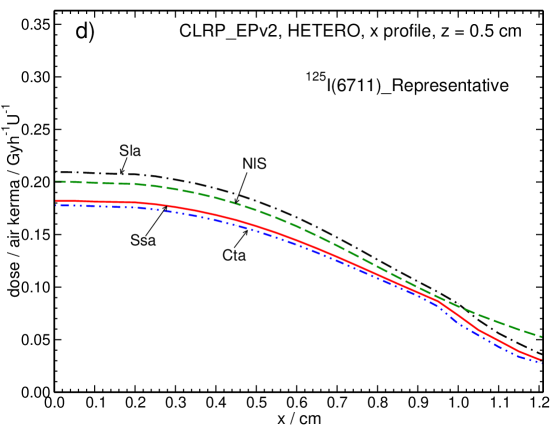
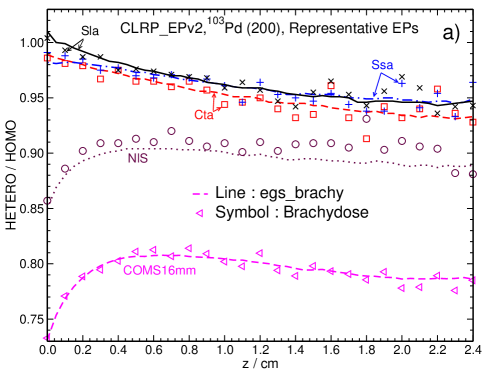
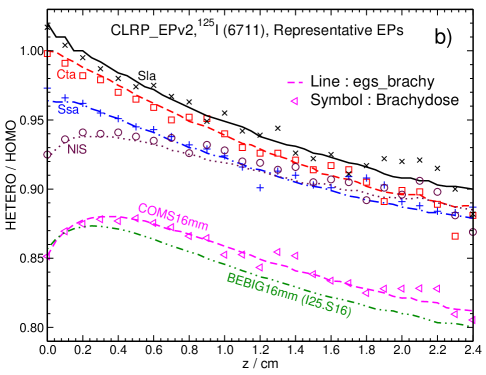
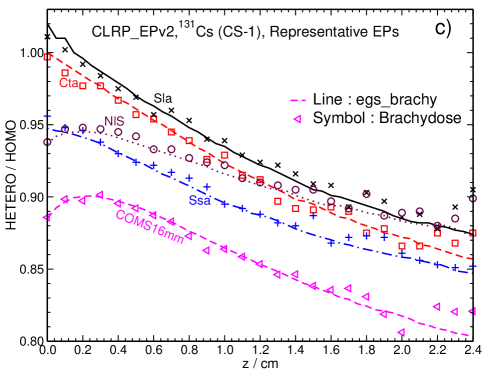
II.C.3. Representative plaques
Figure 8††margin: Fig 8 provides HETERO/HOMO dose ratios along the central axis for the representative plaques, comparing results to those from BrachyDose from previous work [1, 14], as well as 16 mm COMS and BEBIG results for comparison. The egs_brachy and BrachyDose results are in good agreement, with percent differences of 0.1% to 1.1% for cm (assumed tumour apex) and between 0.1% to 4.5% beyond tumor apex to the opposite side of sclera (where statistical uncertainties are larger). The smallest deviations overall are observed for the “Stainless steel - acrylic” (Ssa) plaque, with average deviations of 0.2% for cm; conversely, the largest discrepancies are observed for “No-lip - Silastic” (NlS) with average deviations of 0.5% for cm and 0.9% for larger . The BrachyDose results for the HETERO/HOMO dose ratio are generally observed to fluctuate about the smoother lines presented by the egs_brachy results, in accord with the larger statistical uncertainties on the BrachyDose results (sub-1% for ) in comparison with egs_brachy (sub-0.2%). Apart from differences in the number of histories used to generate results for egs_brachy and BrachyDose, there are also differences in the spectra of initialized particles, small differences in plaque dimensions (due to rounding in intermediate calculations to specify plaque geometries), and differences in the voxel scoring grid, as well as differences associated with the different codes as seen previously [17, 8].
Near the plaque (and sclera), the “Short lip - acrylic” plaque is observed to increase doses relative to HOMO doses, in accord with Lespérance et al [14] who attributed this to the combined effects of fluorescence photons from the plaque and less photon attenuation through the (short) acrylic insert (for HETERO simulations) in comparison with water (HOMO). For all other representative plaques, the HETERO/HOMO dose ratio is near the plaque due to the lack of scatter and attenuation due to the plaque backing and insert. For all plaque models (and seed types), the dominant effect of the plaque is a reduction in backscattering from regions behind it. Scattered radiation accounts for more of the total dose in regions further from the plaque and so a reduction in the number of scattered photons when the plaque is present (in comparison with not, HOMO) causes decreasing HETERO/HOMO dose ratios with distance from the plaque [14].
III. Data Format and Access
The CLRP_EPv2 website is hosted at Carleton University, Ottawa, Ontario, Canada. The database is available online at https://physics.carleton.ca/clrp/eye_plaque_v2. The main page of the database lists the 17 plaques which for the online datasets are available, as well as details about plaque and seed models, MC simulation scenarios and normalization, and a spreadsheet of HOMO and HETERO doses along the central axis with 0.05 cm resolution. The CLRP_EPv2 database includes results from more than 100 independent egs_brachy simulations. For each plaque model, the following information is available on the CLRP_EPv2 database:
-
•
A to-scale image showing the eye plaque cross-section fully loaded with seeds in each of the Cartesian planes intersecting the origin, created using egs_view images of actual egs++ model of the plaque and seeds.
-
•
A description of the plaque model, and seed coordinates according to publications and manufacturer information, as implemented in egs++. These models will be released for use with the open-source egs_brachy application.
-
•
Files containing 3D dose distributions (.3ddose) in a zipped format for HOMO and HETERO scenarios, as well as HETsi for BEBIG plaques. Doses are provided in units of dose rate per unit seed air kerma (Gy h-1 U-1). Total dose (in Gy) in each voxel may be obtained by multiplying the data by the air kerma per seed (in units of U; 1 U 1 cGy cm2 h-1), and integrated over the treatment time, taking the exponential decay of the sources into account. Statistical uncertainties (1 sigma) on the dose in each voxel is also included in the 3ddose file (as fractions of the local dose).
- •
- •
- •
- •
IV. Potential Impact
The most recent AAPM task group reports pertaining to eye plaque brachytherapy, namely TG-129 [2] and TG-221 [1], recommend that HETERO doses be calculated (or estimated) and reported in parallel with the traditional water-based (HOMO) TG-43 doses. These recommendations are consistent with the recommendations of AAPM-ESTRO-ABG TG-186, which recommends adoption of model-based dose calculations where possible and reporting of their doses alongside TG-43. Thus, the publicly-available 3D dose distributions and associated data provided in CLRP_EPv2 for each plaque and seed supports TG-129, 221, and 186 recommendations, enabling HETERO dose estimations and MC dose evaluations. Furthermore, the plaque models developed herein will be distributed freely with egs_brachy, as will the seed models that are documented within the CLRP_TG43v2 [18] database (https://physics.carleton.ca/clrp/egs_brachy/seed_database_v2). The models may be used to carry out custom calculations within user-specified phantoms, including virtual patient models derived from patient (CT) datasets. In addition, the eye plaque models may then be modified by users to develop models representative of their own practice. Overall, the dose distributions and freely-distributed egs_brachy plaque models support state-of-the art, advanced dose evaluations for ocular brachytherapy.
V. Conclusion
The CLRP_EPv2 database offers accurate 3D dose distributions for more plaque models and radionuclides, plus lower statistical uncertainties than CLRP_EPv1. The CLRP_EPv2 database contains new datasets for 17 plaques (8 COMS, 5 BEBIG, and 4 representative plaques) and 3 radionuclides [103Pd, 125I (2 seed models), and 131Cs], including both HOMO and HETERO (also HETsi for BEBIG) scenarios. The CLRP_EPv2 data are validated by comparison with BrachyDose and MCNP published data, for the plaque models for which such data exist: COMS plaque data is in good accord with previous BrachyDose and MCNP results, and representative plaques agree with previous BrachyDose results. For example, on the plaque central axis HETERO doses agree within 2% for BrachyDose and 5% for MCNP for COMS plaques, while doses agree within 4.5% with BrachyDose for the representative plaques. The BEBIG plaques, modelled for the first time, differ only in media (elemental composition, density) from the COMS plaques, and differences in the relative HETERO/HOMO dose ratios may be understood on the basis of the higher-atomic number content of the BEBIG plaque backings in comparison with COMS, the lower density of the seed-carrier insert, as well as the differences in emitted photon spectra [125I: I125.S16 for BEBIG, 6711 for COMS]. The HETsi dose distributions offer the potential for users to tally dose distributions with different weights for custom-loading plaques with seeds of different activities. The CLRP_EPv2 database provides reference 3D dose distributions that support the recommendations of AAPM TG-129 and TG-221. The reference 3D dose distributions and benchmarked egs_brachy (MC) models of plaques and seeds will be freely distributed at (https://physics.carleton.ca/clrp/eye_plaque_v2), enabling advances in ocular brachytherapy research, dosimetry, and clinical practice.
VI. Acknowledgements
Chris Melhus and Mark Rivard are thanked for providing their MCNP5 data directly to facilitate comparisons. The authors acknowledge the Natural Sciences and Engineering Research Council of Canada (NSERC), the Canada Research Chairs program, the Ministry of Research and Innovation of Ontario, and a Compute Canada National Resource Allocation.
VII. Conflict of interest statement
This work was partially supported by Eckert & Ziegler BEBIG GmbH of Berlin, Germany.
References
- 1 R. M. Thomson, K. M. Furutani, T. W. Kaulich, F. Mourtada, M. J. Rivard, C. G. Soares, F. M. Vanneste, and C. S. Melhus, AAPM recommendations on medical physics practices for ocular plaque brachytherapy: Report of task group 221, Med. Phys. 47, e92 – e124 (2020).
- 2 S.-T. Chiu-Tsao, M. A. Astrahan, P. T. Finger, D. S. Followill, A. S. Meigooni, C. S. Melhus, F. Mourtada, M. E. Napolitano, R. Nath, M. J. Rivard, D. W. O. Rogers, and R. M. Thomson, Dosimetry of 125I and 103Pd COMS eye plaques for intraocular tumors: Report of Task Group 129 by the AAPM and ABS, Med. Phys. 39, 6161 – 6184 (2012).
- 3 ABS. OOTF. Committee, The American Brachytherapy Society consensus guidelines for plaque brachytherapy of uveal melanoma and retinoblastoma, Brachytherapy 13, 1 – 14 (2014).
- 4 COMS Group, The COMS randomized trial of iodine 125 brachytherapy for choroidal melanom. III. Initial Mortality findings. COMS report no. 18, Arch. Ophthalmol. 105, 969–982 (2001).
- 5 COMS Group, The COMS randomized trial of iodine 125 brachytherapy for choroidal melanom. V. Twelve-year mortality rates and prognostic factors: COMS report no. 28, Arch. Ophthalmol. 124, 1684–1693 (2006).
- 6 A. J. Lin, Y. J. Rao, S. Acharya, J. Schwarz, P. K. Rao, and P. Grigsby, Patterns of care and outcomes of proton and eye plaque brachytherapy for uveal melanoma: review of the National Cancer Database, Brachytherapy 16, 1225–1231 (2017).
- 7 M. J. Rivard et al., Supplement 2 for the 2004 update of the AAPM Task Group No. 43 Report: Joint recommendations by the AAPM and GEC-ESTRO, Med. Phys. 44, e297 – e338 (2017).
- 8 M. J. Rivard et.al., Comparison of dose calculation methods for brachytherapy of intraocular tumors, Med. Phys. 38, 306 – 316 (2011).
- 9 C. S. Melhus and M. J. Rivard, COMS eye plaque brachytherapy dosimetry simulations for 103Pd, 125I, and 131Cs, Med. Phys. 35, 3364 – 3371 (2008).
- 10 R. M. Thomson, R. E. P. Taylor, and D. W. O. Rogers, Monte Carlo dosimetry for 125I and 103Pd eye plaque brachytherapy, Med. Phys. 35, 5530 – 5543 (2008).
- 11 R. M. Thomson and D. W. O. Rogers, Monte Carlo dosimetry for 125I and 103Pd eye plaque brachytherapy with various seed models, Med. Phys. 37, 368 – 376 (2010).
- 12 R. M. Thomson, K. M. Furutani, J. S. Pulido, S. L. Stafford, and D. W. O. Rogers, Modified COMS plaques for 125I and 103Pd iris melanoma brachytherapy, Int. J. Radiat. Oncol. Biol. Phys. 78, 1261 – 1269 (2010).
- 13 M. Lesperance, M. Inglis-Whalen, and R. M. Thomson, Model-based dose calculations for COMS eye plaque brachytherapy using an anatomically realistic eye phantom, Med. Phys. 41, 021717 (12pp) (2014).
- 14 M. Lesperance, M. Martinov, and R. M. Thomson, Monte Carlo dosimetry for 103Pd, 125I, and 131Cs ocular brachytherapy with various plaque models using an eye phantom, Med. Phys. 41, 031706 (14pp) (2014).
- 15 L. Beaulieu, A. C. Tedgren, J.-F. Carrier, S. D. Davis, F. Mourtada, M. J. Rivard, R. M. Thomson, F. Verhaegen, T. A. Wareing, and J. F. Williamson, Report of the Task Group 186 on model-based dose calculation methods in brachytherapy beyond the TG-43 formalism: Current status and recommendations for clinical implementation, Med. Phys. 39, 6208 – 6236 (2012).
- 16 M. Chamberland, R. E. P. Taylor, D. W. O. Rogers, and R. M. Thomson, egs_brachy: a versatile and fast Monte Carlo code for brachytherapy, Phys. Med. Biol. 61, 8214 – 8231 (2016).
- 17 R. M. Thomson, R. E. P. Taylor, M. J. P. Chamberland, and D. W. O. Rogers, Reply to Comment on ’egs_brachy: a versatile and fast Monte Carlo code for brachytherapy’, Phys. Med. Biol. 63, 038002(5pp) (2018).
- 18 H. Safigholi, M. J. P. Chamberland, R. E. P. Taylor, C. H. Allen, M. P. Martinov, D. W. O. Rogers, and R. M. Thomson, Update of the CLRP TG-43 parameter database for low-energy brachytherapy sources, Med. Phys. 47, 4656–4669 (2020).
- 19 E. Mainegra-Hing, D. Rogers, F. Tessier, and B. Walter, The EGSnrc Code System: Monte Carlo Simulation of Electron and Photon Transport,NRCC Report PIRS-701, Technical report, National Research Council Canada, Ottawa, Canada. https://nrc-cnrc.github.io/EGSnrc/, (2020).
- 20 M. J. Berger and J. H. Hubbell, XCOM: Photon cross sections on a personal computer, Report NBSIR87–3597, National Institute of Standards Technology (NIST), Gaithersburg, MD 20899, U.S.A., 1987.
- 21 E. Mainegra-Hing, D. W. O. Rogers, R. Townson, B. R. B. Walters, F. Tessier, and I. Kawrakow, The EGSnrc g application Technical Report PIRS-3100, Technical report, National Research Council Canada, Ottawa, Canada. https://nrc-cnrc.github.io/EGSnrc/, (2020).
- 22 ICRU, Report 90: Key data for ionizing-radiation dosimetry: measurement standards and applications, J ICRU 14, 1–110 (2014).
- 23 S. E. M. Cutsinger, K. M. Furutani, R. M. Forsman, and S. M. Corner, Seed coordinates of a new COMS‐like 24 mm plaque verified using the FARO Edge, J of App Clin Med Phys 16, 293 – 301 (2015).
- 24 D. P. Potter, Treatment of intraocular melanoma: new concepts, Bull Mem Acad R Med Belg 158, 103–111 (2003).
- 25 P. T. Finger, A. Berson, and A. Szechter, Palladium-103 plaque radiotherapy for choroidal melanoma, Ophthalmology 106, 606 – 613 (1999).
- 26 I. Puusaari, J. Heikkonen, and T. Kivela, Effect of radiation dose on ocular complications after iodine brachytherapy for large uveal melanoma: empirical data and simulation of collimating plaques, Invest Ophthalmol Vis Sci 45, 3425–3434 (2004).
- 27 D. Granero, J. Pérez-Calatayud, F. Ballester, E. Casal, and J. De Frutos, Dosimetric study of the ROPES eye plaque, Med. Phys. 31, 3330–3336 (2004).
- 28 J. I. Monroe and J. F. Williamson, Monte Carlo-aided dosimetry of the Theragenics TheraSeed Model 200 103Pd interstitial brachytherapy seed, Med. Phys. 29, 609 – 621 (2002).
- 29 J. Dolan, Z. Li, and J. F. Williamson, Monte Carlo and experimental dosimetry of an 125I brachytherapy seed, Med. Phys. 33, 4675 – 4684 (2006).
- 30 M. J. Rivard, Brachytherapy dosimetry parameters calculated for a 131Cs source, Med. Phys. 34, 754 – 762 (2007).
- 31 H. Hedtjärn, G. A. Carlsson, and J. F. Williamson, Monte Carlo-aided dosimetry of the symmetra model I25.S06 I125, interstitial brachytherapy seed, Med. Phys. 27, 1076–1085 (2000).
- 32 Brookhaven National Laboratory, National Nuclear Data Center, http://www.nndc.bnl.gov/nudat2.
- 33 NCRP Report 58, A Handbook of Radioactivity Measurements Procedures, NCRP Publications, 7910 Woodmont Avenue, Bethesda, MD. 20814 USA (1985).