X-raying the galaxy pair Arp 41: no collision in NGC 1232 and three ultraluminous sources in NGC 1232A
Abstract
We studied the apparent galaxy pair NGC 1232/NGC 1232A with Chandra, looking for evidence of interactions and collisions. We report that there is no cloud of diffuse emission in NGC 1232, contrary to previous claims in the literature. Instead, we find that the small “companion” galaxy NGC 1232A contains three ultraluminous X-ray sources with peak 0.3–10 keV luminosities above erg s-1 (assuming a cosmological distance of 93 Mpc for this galaxy). For its mass, morphology, metal abundance and bright ULX population, NGC 1232A is analogous to the more nearby late-type spiral NGC 1313.
keywords:
galaxies: individual: NGC 1232, NGC 1232A – accretion, accretion disks – stars: black holes – X-rays: binaries1 Introduction
The population properties of X-ray binaries and ultraluminous X-ray sources (ULXs) are a tracer of stellar mass and star formation rate in their host galaxies (Lehmer et al., 2019). In turn, ULXs affect the surrounding interstellar medium with their radiative power and mechanical luminosity, creating X-ray photo-ionized nebulae and/or shock-ionized bubbles (Pakull & Mirioni, 2002).
As part of this investigation, we are doing a long-term search for ULXs in star-forming galaxies of different morphological types. The galaxy pair NGC 1232/NGC 1232A (Arp 41) is a particularly interesting target. The larger galaxy in the pair is the face-on spiral NGC 1232, of Hubble type SABc, with a Hubble distance Mpc (based on its recession speed of 1450 km s-1 with respect to the cosmic background), and a redshift-independent distance Mpc. See the NASA/IPAC Extragalactic Database (NED111 https://ned.ipac.caltech.edu.) for the full reference list of those two distance values; for the redshift-independent distance, we took the median value of 19 different measurements reported in NED, mostly based on the Tully-Fisher relation (Tully & Fisher, 1977). In this paper, we will use the value of 14.5 Mpc. A study based on three Chandra observations from 2008–2010 claimed (Garmire, 2013) that there was X-ray evidence for a minor collision, perhaps a dwarf satellite that passed through the disk of NGC 1232 and shock-ionized the gas around the impact region. Our first objective was to test this widely publicized claim222See, e.g., https://chandra.harvard.edu/photo/2013/ngc1232/, revisiting the original data and including subsequent Chandra observations from 2012–2015.
Our second objective was to study the apparent companion, NGC 1232A. Although at first sight this late-type barred spiral looks like a Magellanic-dwarf satellite of the main galaxy, it has a heliocentric recession speed of (660045) km s-1 (Jones et al., 2009), which corresponds to a distance modulus of mag, or a luminosity distance of Mpc (HyperLEDA database333http://leda.univ-lyon1.fr). This is the reason why NGC 1232 + NGC 1232A were cited by Arp (1982) as one of the most striking examples of “discrepant redshift” in galaxy pairs. Unfortunately, no reliable redshift-independent distance measurement exists for this galaxy. The peak rotational velocity of the disk in NGC 1232A sometimes listed in galaxy databases (e.g., HyperLEDA) is in fact meaningless (Fouque et al., 1990), because of contamination from the outer spiral arm of NGC 1232. Therefore, this value cannot be used for Tully-Fisher estimates of distance and baryonic mass.
2 Observations and Data Analysis
The galaxy pair was observed by Chandra/ACIS on seven occasions between 2008 and 2015: six times with ACIS-I and once with ACIS-S, for a total of 295 ks (Table 1). We downloaded the data from the public archives, then reprocessed and analysed them with the Chandra Interactive Analysis of Observations (ciao) software version 4.12 (Fruscione et al., 2006), Calibration Database 4.9.1. In particular, we used the ciao tasks chandra_repro to create new level-2 event files, reproject_obs to create stacked images, srcflux to determine model-independent fluxes, and specextract to create spectra and associated response and ancillary response files (both for individual observations and combined for all datasets).
More specifically, when we extracted the spectra of extended regions (for the study of the diffuse emission in NGC 1232), we built spatially weighted ancillary response functions (specextract parameter “weight = yes”) without a point-source aperture correction (specextract parameter “correctpsf = no”). Conversely, when we extracted the spectra of point-like sources (the ULXs in NGC 1232A), we set ”weight = no” and “correctpsf = yes”. Our definition of the extended source and background regions in NGC 1232 is described in details in Section 3.1. For the point-like sources in NGC 1232A, we used source extraction circles of radius, and local background annuli at least 4 times the size of the source regions.
We then used the ftools (Blackburn, 1995) task grppha to rebin the spectra to 1 count per bin. Finally, we modelled the spectra with xspec (Arnaud, 1996) version 12.11.0, fitting them with the Cash statistics (Cash, 1979). As a further check of our main results, we rebinned the same spectra to 15 counts per bin and re-fitted them with the statistics.
| ObsID | Instrument | Obs. Date | Exp. Time (ks) |
|---|---|---|---|
| 10720 | ACIS-I | 2008-11-03 | 47.0 |
| 10798 | ACIS-I | 2008-11-05 | 52.9 |
| 12153 | ACIS-I | 2010-09-29 | 50.0 |
| 12198a | ACIS-S | 2010-11-30 | 46.5 |
| 14236b | ACIS-I | 2012-06-13 | 48.9 |
| 15391 | ACIS-I | 2013-10-13 | 21.3 |
| 16486 | ACIS-I | 2013-10-14 | 28.3 |
| 17463 | ACIS-I | 2015-11-10 | 44.5 |
a: Its field of view covers NGC 1232A but only half of NGC 1232.
b: Its field of view covers only the north-east corner of NGC 1232, and does not include NGC 1232A.
| (kev) | (keV) | Sector | ||
|---|---|---|---|---|
| Westc | ||||
| North | ||||
| East | ||||
| South |
a: observed (absorbed) 0.5–2 keV surface brightness, in units of erg cm-2 s-1 arcmin-2;
b: unabsorbed 0.5–2 keV surface luminosity, in units of erg s-1 arcmin-2, assuming a distance of 14.5 Mpc;
c: the alleged hot cloud centre (red circle in Garmire 2013).
3 Main Results
3.1 No evidence of galaxy collisions in NGC 1232
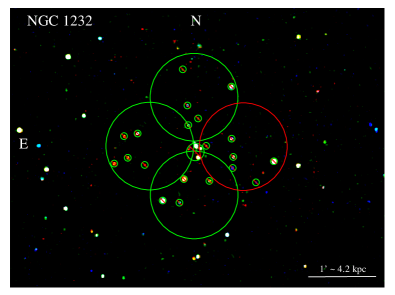
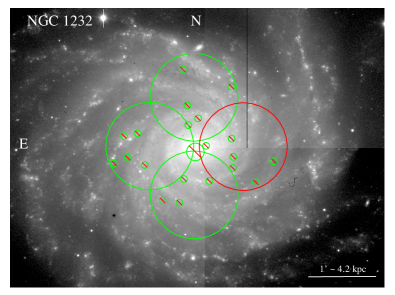
We analyzed the stacked ACIS-I images, looking for an excess of diffuse hot plasma emission to the west and to the north of the nucleus, as claimed by Garmire (2013). Neither the distribution of count rates or the fluxes measured with srcflux suggest any such excess. However, we do notice that our stacked images contain many more point sources (obviously, because they are deeper than the images available to Garmire 2013). Several well-resolved point-like sources were just below the signal-to-noise threshold of the adaptive-smoothing task csmooth used by Garmire (2013), based on the first three Chandra observations alone. As a result, we suspect that csmooth treated the photons associated to those faint sources as diffuse emission, and smeared them into a large cloud, whose size is a function of the smoothing-scale parameter.
To investigate the matter in more details, we reproduced the circular extraction region used by Garmire (2013) (red circle in our Figure 2, corresponding to the red circle in their Fig. 2, with a radius of 40′′). However, in our case, we removed several point sources inside the large circle, because we are looking only for the diffuse hot gas. The detection threshold for our identification of point-like sources was 12 net counts (0.3–7 keV band) in the stacked ACIS-I image; this corresponds to a 0.3–10 keV luminosity of 2 erg s-1 for a power-law photon index . There are about 150 “diffuse” net counts inside the red circle, and an additional 190 counts in point-like sources that we have excluded but which were included in the spectrum of Garmire (2013).
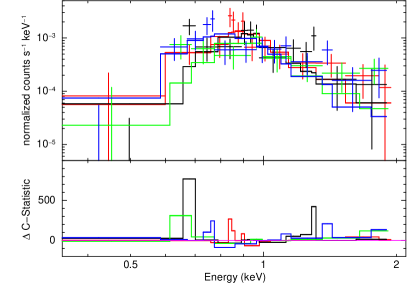
We extracted background-subtracted spectra (with their corresponding response and ancillary response files) from each ACIS-I exposure and combined them, for a total exposure time of 243 ks. For each exposure, the background region was carefully chosen in the same ACIS-I chip, at the outer edge or outside the star-forming disk of the galaxy (to minimize the possible presence of diffuse hot gas in the background region), and with an area of at least three times the source region. Point-like sources were also excluded from the background regions. We then repeated the same procedure, placing the same sized extraction region at different locations around the nucleus (north, east and south). In each case, we also subtracted the point-like sources inside the extraction circle (Figure 2). All four sectors have a similar number of diffuse net counts (between 125–150). Finally, we fitted the four stacked spectra (west, north, east and south locations) simultaneously in xspec. After initially fitting the spectra over the whole 0.3–7 keV band, we realized that there is no significant emission (no net counts) above the background level at energies 2 keV; thus, we limited our spectral fits to the 0.5–2.0 keV range. The inclusion of the energy channels 2 keV has only the effect of increasing the noise but does not change the best-fitting values. If the results of Garmire (2013) are correct, we expect a strong excess of diffuse emission in the northern and western circles compared with the other two.
For our spectral fitting, we drew on our experience of diffuse emission in galaxies, and assumed a two-temperature thermal plasma model (phabs (apec apec) in xspec). The temperatures were free parameters but were locked across the four spectra. Not unexpectedly, they converge to values of 0.3 keV and 0.8 keV, which are typical of hot gas in normal star-forming galaxies (Mineo et al., 2012b; Lehmer et al., 2015). The normalizations of the two plasma components were left free for each spectrum. The intrinsic column density (in addition to the line-of-sight component) was fixed to zero. More realistically, the diffuse emission may see an additional absorption of 1021 cm-2 through the halo and part of the disk; however, ACIS-I is not very sensitive at soft X-ray energies: this, combined with the low number of counts, makes it impossible to determine the intrinsic accurately.
To ascertain whether our modelling result was robust, we repeated it in several different ways. First, we fitted the four spectra with the Cash statistics (C-stat ). Then, we rebinned the data to 15 counts per bin and refitted it with statistics (). Then, we left the intrinsic absorption as a free parameter: the best-fitting value increases to cm-2, but remains consistent with 0 within the 90% confidence limit. We tried unlocking the temperatures between the four spectra, but found that the two sets of values still cluster around 0.3 and 0.8 keV. We also tried replacing the higher-temperature apec component with a power-law of photon index 1.7, but found that the emission between 0.5–2 keV is still mostly due to the thermal plasma component, with only minor changes to flux and luminosity.
We conclude that there is significant thermal plasma emission in each of the four regions, in the 0.5–2 keV band (Figure 3). Above 2 keV, we expect an additional power-law component from unresolved point-like sources fainter than 1037 erg s-1, but such component is not significant above the background noise in our spectra, and its presence or absence does not substantially affect our estimate of the thermal plasma luminosity at 0.5–2 keV. Our main result (Table 2) is that the flux and luminosity of the diffuse emission in the four quadrants is similar within a factor of 2 (or even less, if we take into account their error bars): an unremarkable variability in a normal galaxy, considering that spiral arms, gas and stellar distributions are never perfectly symmetric. The luminosity of the western sector is not particularly high or remarkable compared with the other three. In fact, the average luminosity of western plus northern sectors (the alleged hot cloud) is identical to the average luminosity of eastern plus southern sectors. By comparison with the flux in the western sector given by Garmire (2013), we infer a 0.5–2 keV diffuse, unabsorbed flux of 4.6 erg cm-2 s-1 arcmin-2, as opposed to their reported value of 7 erg cm-2 s-1 arcmin-2 (for the same choice of ). Our lower value, as we mentioned earlier, is because we have not included a few point-like sources whose flux was instead included in the measurement of Garmire (2013).
The overall hot gas luminosity of NGC 1232 is also not at all remarkable. Based on the measured X-ray luminosity of the inner disk, we estimate a total hot gas luminosity of 1–2 erg s-1 from the whole star-forming disk (radius of 2′), at the assumed Tully-Fisher distance of 14.5 Mpc, or a factor of two higher if we assume a cosmological distance of 21 Mpc. This is indeed the range of luminosities expected (Mineo et al., 2012b) for a galaxy with the star formation rate of NGC 1232 (0.4–0.9 yr-1, depending on the assumed distance: Araújo de Souza et al. 2018).
In summary, there is no evidence that the diffuse hot gas distribution in NGC 1232 is in any way modified or enhanced by a recent minor collision. A more thorough discussion on the X-ray properties and luminosity function of the point sources in NGC 1232 is beyond the scope of this paper.
| Source | R.A.(J2000) | Dec(J2000) |
|---|---|---|
| X-1 | 03:10:01.01 | 20:35:53.8 |
| X-2 | 03:10:02.14 | 20:36:11.1 |
| X-3 | 03:10:02.92 | 20:36:01.3 |
3.2 Surprisingly luminous ULXs in NGC 1232A
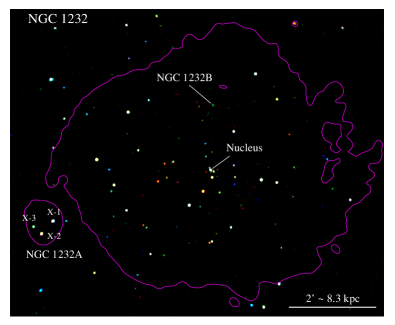
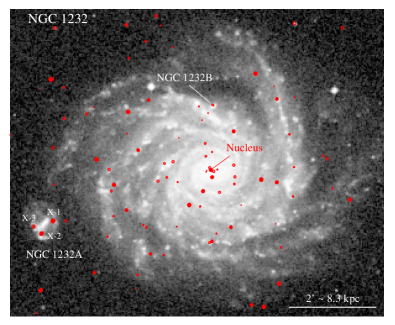
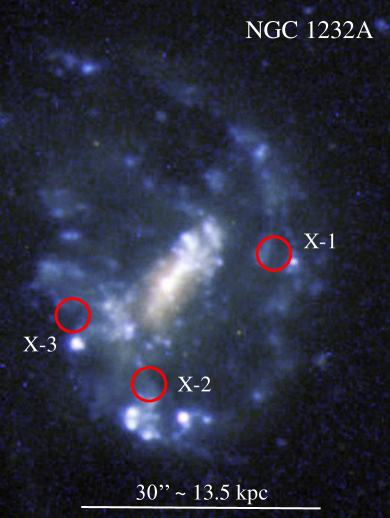
There are three bright point-like sources inside the D25 extent of the small, neighbouring galaxy NGC 1232A. Here, we label them for simplicity X-1, X-2 and X-3 in order of decreasing average flux from the stacked Chandra image. Their coordinates are listed in Table 3. We determined the coordinates of those three sources from a stacked ACIS image of the 7 observations covering NGC 1232A; we used the centroiding task dmstat in ciao. The 90% uncertainty radius of ACIS-I observations taken around 2008–2015 is 0′′8444https://cxc.harvard.edu/cal/ASPECT/celmon/. By taking an average of 7 observations, we effectively reduced this uncertainty to 0′′3. Unfortunately there are no sources with both Gaia and Chandra detections within a few arcmin of NGC 1232A. A few X-ray sources at the outskirts of NGC 1232, which appear to have a point-like optical counterpart, confirm that the X-ray astrometry of the stacked image is accurate within 0′′3.
The probability that the faintest source is a background AGN projected by chance inside the D25 of the galaxy is 0.15 (Luo et al., 2017). The probability that all three sources are background AGN is 10-3. We cannot completely rule out that one or more of those three sources belong to NGC 1232, but there is no evidence that the outer spiral arm of the main galaxy extends in front of NGC 1232A. Thus, the simplest explanation is that all three sources belong to the latter galaxy. More specifically, they appear to be associated with its spiral arms rather than the bar or the nuclear region (the nucleus of NGC 1232A is not detected).
Unfortunately, there are no high-quality images of NGC 1232A available in public data archives. By far the best image of the galaxy pair was taken with FORS1 on the Very Large Telescope (VLT) in 1998 September, during the calibration phase of that instrument; it was published as a European Southern Observatory (ESO) press release555https://www.eso.org/public/images/eso9845d. However, the original data for that observation were not archived and have been lost (Mariya Lyubenova, priv.comm.; Nathalie Fourniol, priv.comm.) Nonetheless, we used the public-outreach JPG image from ESO together with a FITS image from the Digitized Sky Survey to illustrate an indicative position of the three ULXs (Figure 4).
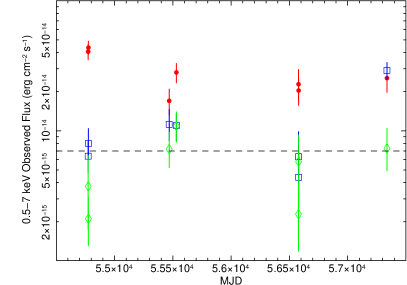
We determined the model-independent fluxes of the sources in each observation, to study their long-term variability properties (Figure 5). The observed fluxes vary by a factor of a few between the seven epochs (X-2 and X-3 being more variable than X-1). This level of irregular variability is a common feature of persistently active ULXs (Weng & Feng, 2018). Then, we modelled the combined spectra for each source.
| Model Parameters | Values |
|---|---|
| tbabs tbabs po | |
| ( cm-2) | |
| C-stat/dof | (0.83) |
| ( erg cm-2 s-1)b | |
| ( erg s-1)c | |
| tbabs tbabs diskbb | |
| ( cm-2) | |
| (keV) | |
| ( km2)d | |
| (km)e | |
| C-stat/dof | (0.83) |
| ( erg cm-2 s-1)b | |
| ( erg s-1)c | |
a: units of photons keV-1 cm-2 s-1 at 1 keV.
b: observed flux in the 0.5–7 keV band
c: de-absorbed luminosity in the 0.3–10 keV band, defined as times the de-absorbed 0.3–10 keV model flux.
d: , where is the “apparent” inner disk radius in km, the distance to the galaxy in units of 10 kpc (here, ), and is our viewing angle. The total luminosity of the disk is (Makishima et al., 1986)
e: the “true” inner-disk radius is defined as for a standard disk (Kubota et al., 1998), and was defined in Table note d.
| Model Parameters | Values |
|---|---|
| tbabs tbabs (po apec) | |
| ( cm-2) | |
| (keV) | |
| ()a | |
| C-stat/dof | (0.81) |
| ( erg cm-2 s-1) | |
| ( erg s-1) | |
| tbabs tbabs (diskbb apec) | |
| ( cm-2) | |
| (keV) | |
| ( km2) | |
| (km) | |
| (keV) | |
| () | |
| C-stat/dof | (0.81) |
| ( erg cm-2 s-1) | |
| ( erg s-1) | |
a: units of , where is the luminosity distance in cm, and and are the electron and H densities in cm-3.
3.2.1 X-1: a hard power-law spectrum
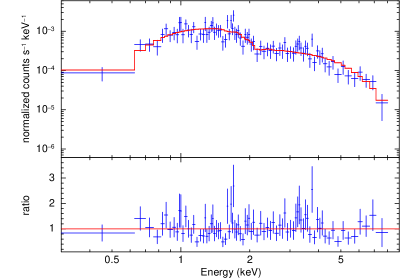
The spectrum of X-1 is best-fitted (C-stat ) by a power-law model (no significant curvature), with a rather hard photon index (Table 4, Figure 6), which classifies it in the hard ultraluminous regime (Sutton et al., 2013). In other words, the spectral luminosity increases with energy, in the Chandra band. A disk-blackbody spectrum provides a statistically identical fit (C-stat ) but the best-fitting temperature is 2.2 keV. This is too hot (Kubota & Makishima, 2004) and the corresponding luminosity too much above Eddington to be consistent with a standard disk around a stellar-mass compact object; if the spectrum is thermal, it is more likely to be in the slim disk regime (Watarai et al., 2001). At 93 Mpc, the average unabsorbed 0.3–10 keV luminosity is 4–5 erg s-1, but as high as 7 erg s-1 in both the observations from 2008.
3.2.2 X-2: a softer ULX with possible thermal plasma emission
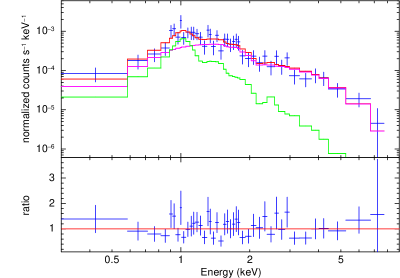
The average spectrum of X-2 is softer than that of X-1. A simple power-law model (C-stat ) requires : an approximately flat value of the spectral luminosity , so that it is not obvious which of the three ultraluminous regimes defined by Sutton et al. (2013) it belongs to. The fit is marginally improved (C-stat ) by the addition of a thermal plasma component at a temperature of keV; in our xspec analysis, we used the apec model (Table 5). When a thermal plasma component is present, the best-fitting power-law photon index is . As a further check on the significance of the thermal plasma component, we refitted the same spectrum, regrouped to 15 counts per bin, with the statistics. We find the same best-fitting values. Without the apec component, we obtain ; with the apec component, . Alternatively, we fitted the spectrum with a disk-blackbody model without thermal plasma emission (C-stat ; ) and with thermal plasma emission (Figure 7; C-stat ; ).
Although the improvement provided by the apec component is statistically small (particularly in the case of the power-law model), adding this component does visually allow the model to do a better job at reproducing the slightly peaked nature of the spectrum around 1 keV (Figure 7), and similar emission has been seen in other ULX systems (e.g., Middleton et al. 2015). We therefore report the results both with and without the APEC component, for completeness. The contribution of thermal plasma emission in other ULXs is generally linked to the presence of strong outflows (Pinto et al., 2016, 2017), so we think it worthwhile to report this possibility for X-2.
The average 0.3–10 keV unabsorbed luminosity is erg s-1 (Table 5), of which 3 erg s-1 may be in the thermal plasma component. However, in ObsID 17463, X-2 reached erg s-1.
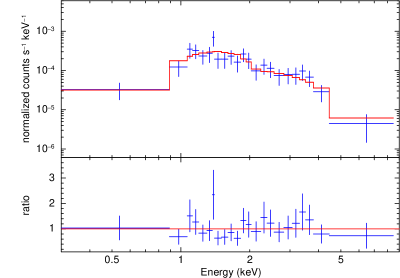
3.2.3 X-3: a lightly curved spectrum
The stacked spectrum of X-3 has an acceptable fit (Table 6) with a power-law model (C-stat , or ) with (again, a flat spectral luminosity). It has a marginally better fit (C-stat ; ) with a curved model such as diskbb (Figure 8), with keV and inner disk radius km. The average 0.3–10 keV luminosity is erg s-1 for the disk-blackbody model or erg s-1 for the power-law model (which requires a higher intrinsic column density).
| Model Parameters | Values |
|---|---|
| tbabs tbabs po | |
| ( cm-2) | |
| C-stat/dof | (0.74) |
| ( erg cm-2 s-1) | |
| ( erg s-1) | |
| tbabs tbabs diskbb | |
| ( cm-2) | |
| (keV) | |
| ( km2) | |
| (km) | |
| C-stat/dof | (0.70) |
| ( erg cm-2 s-1) | |
| ( erg s-1) | |
4 Discussion
The original purpose of our work was to investigate the claimed cloud of hot gas in the disk of NGC 1232. We found that such cloud does not exist. Thus, there is no X-ray evidence of a recent dwarf galaxy interaction. Any alleged peculiarity in the star formation density (Araújo de Souza et al., 2018) in that region must be purely coincidental. The absence of such disk perturbation is consistent with the recent results of Lima-Costa et al. (2020).
Our result is also a reminder that researchers need to be very careful when they apply adaptive smoothing techniques to X-ray images of nearby galaxies, as such smoothing may generate fake regions of diffuse emission.
Instead, we discovered three previously overlooked ULXs in the apparent companion galaxy NGC 1232A. All three ULXs reach 1040 erg s-1 during at least some of the Chandra observations; X-1 and X-2 are persistently above 1040 erg s-1 and peak at 7 erg s-1 and 5 erg s-1, respectively.
Finding three ULXs of such luminosity in a relatively small, isolated field galaxy is unusual: on average, we expect only 1 ULX at a luminosity 1040 for a star formation rate of 10 yr-1 (Mineo et al., 2012a). Even at 93 Mpc, NGC 1232A is a small galaxy. Its absolute -band magnitude mag (HyperLEDA) corresponds to a stellar mass , where we used a conversion factor (Bell & deJong, 2001). This is approximately the same stellar mass as the Large Magellanic Cloud (van der Marel, 2006), but NGC 1232A has a more regular structure.
A better comparison is the nearby ( Mpc) late-type barred spiral NGC 1313 (Silva-Villa & Larsen, 2012), which has two persistent-but-variable ULXs with erg s-1 (Sathyaprakash et al., 2020; Pinto et al., 2020, 2016; Bachetti et al., 2013; Grisé et al., 2008). The two galaxies have similar morphology and (within a factor of 2) similar stellar mass (cf. mag for NGC 1313) and blue luminosity ( mag for NGC 1232A; mag for NGC 1313). NGC 1232A is larger, with a D25 major axis of kpc, compared with 13 kpc for NGC 1313. Based on the star formation rate of 0.7 yr-1 in NGC 1313 (Hadfield & Crowther, 2007), we plausibly expect a rate of 1 yr-1 in NGC 1232A. There are no published studies of the SFR in NGC 1232A, and its recession speed is high enough that its H emission falls outside the standard narrow-band H filters. A few mid-infrared measurements at various locations in NGC 1232A are available from in the Wide-field Infrared Survey Explorer (WISE; Wright et al. 2010; Cutri et al. 2012). A luminosity-weighted average of the WISE colors gives us mag, mag, where , and are the magnitudes in the 3.4-m, 4.6-m and 12-m bands, respectively. This places NGC 1232A right on the “star-formation sequence” of normal disk galaxies (Jarrett et al., 2019), in the “active disk” sector of the WISE colour plane. (As a comparison, the WISE colours of our “sister” galaxy NGC 1313 are mag, mag, very close to NGC 1232A along the same sequence). Nearby disk galaxies along the mid-infrared star-formation sequence and with a stellar mass similar to that of NGC 1232A have indeed a star formation rate between yr-1 and 1 yr-1 (Jarrett et al., 2019).
One explanation for the overdensity of ULXs in small star-forming galaxies is their lower-metallicity environment (Mapelli et al., 2010; Prestwich et al., 2013; Brorby et al., 2014; Lehmer et al., 2020). The only metallicity study of NGC 1232A in the literature (van Zee & Bryant, 1999) is based on a long-slit spectrum taken with the Palomar 5-m telescope. The slit covers the nuclear region and a bright H II region 19′′ to the south. The latter is close to but 2′′–3′′ to the west of X-2, which is not on the slit. van Zee & Bryant (1999) find an oxygen abundance of at the spiral arm location, much lower than in the nuclear region (). As a comparison, NGC 1313 has an oxygen abundance of at the same relative fraction of its D25 radius (Pilyugin et al., 2014). The mean values for the Large and Small Magellanic Clouds are and , respectively (Toribio San Cipriano et al., 2017). Thus, NGC 1232A is among the most metal-poor disk galaxies, but not exceptionally so. Lehmer et al. (2020) showed that galaxies with low metal abundances formed an increased number of high-mass X-ray binaries and ULXs at luminosities erg s-1; at a metallicity of , the probability of finding a ULX with a 0.5–8 keV luminosity 1040 erg s-1 is 0.2 for a star formation rate of 1 yr-1. This is about three times higher than the ULX occurrence rate observed in solar-metallicity galaxies (Lehmer et al., 2020), but it is still far too low to explain the three ULXs seen in NGC 1232A. If the observed number of ULXs for an individual galaxy is drawn from a Poisson distribution with the expectation value set by the prediction from Lehmer et al. (2020), the presence of three bright ULXs in NGC 1232 corresponds to a probability of 10-3. This appears an impossibly low probability; however, observations and simulations suggest that the number density of galaxies with stellar mass 10 in the local universe is 0.02 (Mpc)-3 (Karachentsev et al., 2013; Torrey et al., 2015; Conselice et al., 2016; Bernardi et al., 2017), corresponding to 105 galaxies like NGC 1232 or bigger within 100 Mpc. On the other hand, we also have to consider that only a few 100 nearby galaxies have been observed by Chandra: so, within the observed sample, NGC 1232A must be a very rare galaxy, which deserves further multiband studies of its star formation properties and compact object activity.
Acknowledgements
RS acknowledges hospitality at Sun Yat Sen University in Zhuhai, during part of this work. We thank Tom Jarrett for his explanations about star formation rates from WISE bands, and Alister Graham for comments about disk galaxy structure. We also appreciated the useful comments and suggestions from the referee. This publication makes use of data products from the Wide-field Infrared Survey Explorer, which is a joint project of the University of California, Los Angeles, and the Jet Propulsion Laboratory/California Institute of Technology, funded by the National Aeronautics and Space Administration.
Data Availability
The raw Chandra datasets used for this work are all available for download from their respective public archives. The reduced data can be provided upon request.
References
- Araújo de Souza et al. (2018) Araújo de Souza A., Martins L.P., Rodríguez-Ardila A., Fraga L., 2018, AJ, 155, 234
- Arnaud (1996) Arnaud K.A., 1996, ASPC, 101, 17
- Arp (1982) Arp H., 1982, ApJ, 263, 54
- Bachetti et al. (2013) Bachetti M., et al., 2013, ApJ, 778, 163
- Bell & deJong (2001) Bell E.F., de Jong, R.S., 2001, ApJ, 550, 212
- Bernardi et al. (2017) Bernardi M., Meert A., Sheth R.K., Fischer J.-L., Huertas-Company M., Maraston C., Shankar F., Vikram V., 2017, MNRAS, 467, 2217
- Blackburn (1995) Blackburn J.K., 1995, in ASP Conf. Ser., Vol. 77, Astronomical Data Analysis Software and Systems IV, ed. R.A. Shaw, H.E. Payne, and J.J.E. Hayes (San Francisco: ASP), 367.
- Brorby et al. (2014) Brorby M., Kaaret P., Prestwich A., 2014, MNRAS, 441, 2346
- Cash (1979) Cash W., 1979, ApJ, 228, 939
- Conselice et al. (2016) Conselice C.J., Wilkinson A., Duncan K., Mortlock A., 2016, ApJ, 830, 83
- Cutri et al. (2012) Cutri R.M., et al., 2012, VizieR Online Data Catalog: WISE All-Sky Data Release
- Fouque et al. (1990) Fouque P., Durand N., Bottinelli L., Gouguenheim L., Paturel G., 1990, A&AS, 86, 473
- Fruscione et al. (2006) Fruscione A., et al., 2006, SPIE, 6270, 1
- Garmire (2013) Garmire G.P., 2013, ApJ, 770, 17
- Grisé et al. (2008) Grisé F., Pakull M.W., Soria R., Motch C., Smith I.A., Ryder S.D., Böttcher M., 2008, A&A, 486, 151
- Hadfield & Crowther (2007) Hadfield L.J., Crowther P.A., 2007, MNRAS, 381, 418
- Karachentsev et al. (2013) Karachentsev I.D., Makarov D.I., Kaisina E.I., 2013, AJ, 145, 101
- Jarrett et al. (2019) Jarrett T.H., Cluver M.E., Brown M.J.I., Dale D.A., Tsai C.W., Masci F., 2019, ApJS, 245, 25
- Jones et al. (2009) Jones D.H., et al., 2009, MNRAS, 399, 683
- Kubota & Makishima (2004) Kubota A., Makishima K., 2004, ApJ, 601, 428
- Kubota et al. (1998) Kubota A., Tanaka Y., Makishima K., Ueda Y., Dotani T., Inoue H., Yamaoka K., 1998, PASJ, 50, 667
- Lehmer et al. (2015) Lehmer B.D., et al., 2015, ApJ, 806, 126
- Lehmer et al. (2019) Lehmer B.D., et al., 2019, ApJS, 243, 3
- Lehmer et al. (2020) Lehmer B.D., et al., 2020, ApJ, in press (arXiv:2011.09476)
- Lima-Costa et al. (2020) Lima-Costa F., Martins L.P., Rodríguez-Ardila A., Fraga L., 2020, A&A, 642, 203
- Luo et al. (2017) Luo B., et al., 2017, ApJSS, 228, 2
- Makishima et al. (1986) Makishima K., Maejima Y., Mitsuda K., Bradt H.V., Remillard R.A., Tuohy I.R., Hoshi R., Nakagawa M., 1986, ApJ, 308, 635
- Mapelli et al. (2010) Mapelli M., Ripamonti E., Zampieri L., Colpi M., Bressan A., 2010, MNRAS, 408, 234
- Middleton et al. (2015) Middleton M.J., et al., 2015, MNRAS, 454, 3134
- Mineo et al. (2012a) Mineo S., Gilfanov M., Sunyaev R., 2012, MNRAS, 419, 2095
- Mineo et al. (2012b) Mineo S., Gilfanov M., Sunyaev R., 2012, MNRAS, 426, 1870
- Pakull & Mirioni (2002) Pakull M.W., Mirioni L., 2002, proc. of the symposium ‘New Visions of the X-ray Universe in the XMM-Newton and Chandra Era’, 26–30 November 2001, ESTEC, The Netherlands (arXiv:astro-ph/0202488)
- Pilyugin et al. (2014) Pilyugin L.S., Grebel E.K., Kniazev A.Y., 2014, AJ, 147, 131
- Pinto et al. (2016) Pinto C., Middleton M.J., Fabian A.C., 2016, Natur, 533, 64
- Pinto et al. (2017) Pinto C., et al., 2017, MNRAS, 468, 2865
- Pinto et al. (2020) Pinto C., et al., 2020, MNRAS, 492, 4646
- Prestwich et al. (2013) Prestwich A.H., Tsantaki M., Zezas A., Jackson F., Roberts T.P., Foltz R., Linden T., Kalogera V., 2013, ApJ, 769, 92
- Ryder & Dopita (1994) Ryder S.D., Dopita M.A., 1994, ApJ, 430, 142
- Sathyaprakash et al. (2020) Sathyaprakash R., et al., 2019, MNRAS, 488, L35
- Silva-Villa & Larsen (2012) Silva-Villa E., Larsen S.S., 2012, MNRAS, 423, 213
- Sutton et al. (2013) Sutton A.D., Roberts T.P., Middleton M.J., 2013, MNRAS, 435, 1758
- Toribio San Cipriano et al. (2017) Toribio San Cipriano L., Domínguez-Guzmán G., Esteban C., García-Rojas J., Mesa-Delgado A., Bresolin F., Rodríguez M., Simón-Díaz S., 2017, MNRAS, 467, 3759
- Torrey et al. (2015) Torrey P., et al., 2015, MNRAS, 454, 2770
- Tully & Fisher (1977) Tully R.B., Fisher J.R., 1977, A&A, 54, 661
- van der Marel (2006) van der Marel R.P., 2006, STScI Symposium Series, Vol. 17 (Cambridge, UK: Cambridge University Press)
- van Zee & Bryant (1999) van Zee L., Bryant J., 1999, AJ, 118, 2172
- Watarai et al. (2001) Watarai K.-Y., Mizuno T., Mineshige S., 2001, ApJ, 549, L77
- Weng & Feng (2018) Weng S.-S., Feng H., 2018, ApJ, 853, 115
- Wright et al. (2010) Wright E.L., et al., 2010, AJ, 140, 1868