![[Uncaptioned image]](/html/2102.10122/assets/x2.png)
![]()
|
|
Coincident angle-resolved state-selective photoelectron spectroscopy of acetylene molecules: a candidate system for time-resolved dynamics |
| S. Mandala, R. Gopalb, H. Srinivasc, A. D’Eliad, A. Sena, S Sene, R. Richterf, M. Corenog,h, B. Bapata, M. Mudrichi,j, V. Sharmae† and S. R. Krishnanj∗ | |
|
|
The acetylene-vinylidene system serves as a benchmark for investigations of ultrafast dynamical processes where the coupling of the electronic and nuclear degrees of freedom provides a fertile playground to explore the femto- and sub-femto-second physics with coherent extreme-ultraviolet (EUV) photon sources both on the table-top as well as free-electron lasers. We focus on detailed investigations of this molecular system in the photon energy range eV where EUV pulses can probe the dynamics effectively. We employ photoelectron-photoion coincidence (PEPICO) spectroscopy to uncover hitherto unrevealed aspects of this system. In this work, the role of excited states of the \ceC2H2+ cation, the primary photoion, is specifically addressed. From photoelectron energy spectra and angular distributions, the nature of the dissociation and isomerization channels is discerned. Exploiting the -collection geometry of velocity map imaging spectrometer, we not only probe pathways where the efficiency of photoionization is inherently high but also perform PEPICO spectroscopy on relatively weak channels. |
1 Introduction
One of the outstanding problems of interest in time-resolved spectroscopy and quantum dynamics of molecular systems is phenomena involving the interplay between nuclear motion and electron dynamics1, 2. In femto- and sub-femto-second timescales, a deep understanding of these scenarios is intimately related to realizing the grand challenge of making molecular movies; "watching" chemical reactions take place3. Among important aspects of the physics of systems beyond the Born-Oppenheimer approximation4, decoupling nuclear and electronic dynamics, the role of conical intersections5, shape resonances6, and fast rearrangements within molecules7, 8, 9 are of particular interest. Proton migration ensuing in the rearrangement of photoexcited molecular systems has a prominent place not only owing to the intriguing physics, but also due to its importance in biological systems; this plays a key role in processes underlying human vision10, photosynthesis11, proton tunneling in DNA12 and radiation damage13, to name a few.
The acetylene-vinylidene system has long served as the benchmark for investigations of isomerization especially on ultrafast timescales 7, 14, 15 as well as in static spectroscopy and theoretical investigations16, 17, 18, 19. Both the photoexcitation of outer-valence electrons7 in the extreme-ultraviolet as well as core-shell electrons in the hard-xray regimes can effect isomerization8. Understanding this system paves way for investigating the dynamics of proton migration in larger systems such as benzene9, and proton conduction in covalently bonded molecules20 and weakly bound aggregates such as bio-interfaces21. In order to perform time-resolved spectroscopy of the acetylene-vinylidene system, an intimate knowledge of not only the neutral molecule but also the residual ion and more importantly, the details of photoelectron energies and angular distributions is essential: For example, transient absorption, laser-induced fluorescence or resonant multiphoton ionization methods which are popular in this context are effective when the system is spectroscopically well-characterized. The dynamics of wavepacket resulting from the finite bandwidth of interrogating pulses can be traced effectively when the states involved are known a priori.
In this article, we use photoelectron imaging in coincidence with photoion spectrometry to uncover the details of this benchmark system in the spirit of preparing the ground for further investigations of this system using table-top as well as free-electron pulsed laser sources. While, reports on the transient dynamics of this system have been published, our recent investigations of this molecular system embedded in \ceHe nanodroplet-environment motivate further time-resolved studies22 to estimate the time scale of environment assisted Penning ionization of \ceC2H2 from higher lying states of \ceHe∗ () band. One of the key advantages of photoelectron spectroscopy is that it can be readily applied in time-resolved studies bringing with it the advantage of accessing the entire reaction coordinate even when the electronic and vibrational states evolve in time. Thus, photon energy dependent study of partial cross sections and photoelectron angular distributions has proved to be a useful tool to probe different resonant autoionization processes and shape resonance phenomena in molecular species23, 24, 25, 26.
In these investigations of acetylene (\ceC2H2) photoionization by the photoelectron-photoion coincidence technique, we report the photoelectron energy spectra (PES) corresponding to different ionization channels of \ceC2H2+ along with their accompanying photoelectron angular distributions (PADs). This allows us to discern PES and PADs for each \ceC2H2 fragment ion as a function of photon energy; this includes the primary photoion \ceC2H2+ as well as those resulting from further dissociation and isomerization. The choice of the velocity-map-imaging scheme for photoelectrons is deliberate. This technique is a preferred method for studying molecules and clusters with extreme-ultraviolet pulses and high-harmonic generation methodology27 owing to the inherently high-collection efficiency over the entire solid angle28, 29, 30. Thus, our results can be immediately carried forward and applied to these scenarios.
The key findings of this work are as follows: Firstly, we precisely characterize all the fragmentation channels and determine the electronic states responsible for producing each of these fragments. These are validated by the fact that the contributions of the highest occupied molecular orbital (HOMO) to the photoelectron spectra are in good agreement with prior theoretical work31. However, the photoelectron angular distribution measurements do not always agree with reported theory; nor do they evidence autoionizing resonances when correlated to particular ionic fragments. But it is noteworthy that earlier computations do not match unanimously, either31, 32. Thus, our work provides pertinent inputs for revisions over and above the existing work. Owing to the merits of the experimental technique, we employ, we could ascertain that the less abundant ionic fragments which result from single ionization including, \ceC2+, \ceCH2+, \ceCH^+ and \ceC+ arise from the higher-excited ionic states. The hallmark of this article is that, to the best of our knowledge, we have for the first time measured state-selective branching ratios, photoelectron angular distributions and asymmetry parameters, as a function of photon energy, for all the relevant cationic states of primary photoion, \ceC2H2+, for different photoionization pathways both below and above the double ionization energy of this paradigmatic molecular system.
2 Experimental methods
The experiments reported here were carried out at the Gasphase beamline of the Elettra Sincrotrone, Trieste. Fig.1 shows the schematic diagram of the experimental setup, whose details have been published earlier 33. Here, high-purity \ceC2H2 gas was effused into the source chamber through a dosing valve. The \ceC2H2 gas was distilled before entering this valve to remove acetone contamination. In the distillation process, the gas mixture was passed through a slurry of ethanol and liquid \ceN2 maintained at . The source chamber is connected to spectrometer chamber through a conical skimmer which maintains a differential pressure; \ceC2H2 gas effuses into spectrometer chamber which is maintained at mbar, while the source chamber remains at mbar.

The spectrometer chamber holds two co-axial spectrometers - a velocity map imaging (VMI) spectrometer and a time-of-flight (ToF) spectrometer (cf. fig.1). A focused beam of linearly polarized extreme-ultraviolet (EUV) photons passes through the geometric centre of the two spectrometers at right angle to the spectrometer axis which is also perpendicular to its polarization axis (). Photon energies in the range between and eV were used in our study. We exploited the excellent photon energy definition possible at this beamline quantified by the resolving power of the monochromator upstream, ; using a set of gratings, high-quality photon beams in the energy range eV are accessible here. The synchrotron ring delivers the photon beam in this case in the form of ps pulses with typical peak intensity of W/m2 and repetition rate of MHz. Here, randomly oriented \ceC2H2 molecules are photoionized by the EUV light and the resultant photoelectrons and photoions are detected in coincidence with the VMI and ToF spectrometers, respectively. The charged particle count rate was maintained at kHz by adjusting two slits on the photon beam path. This synchronous detection scheme of photoelectrons and photoions enables us to measure the kinetic energies and angular distributions for photoelectrons correlated to different photoions formed due to \ceC2H2 photoionization. Therefore, unlike previous studies 34, 23, 35, not only do we get the photoelectron energy distributions of \ceC2H2 photoionization, but also this provides photoelectron energy spectra and angular distributions correlated to specific photoions and photoionization channels.
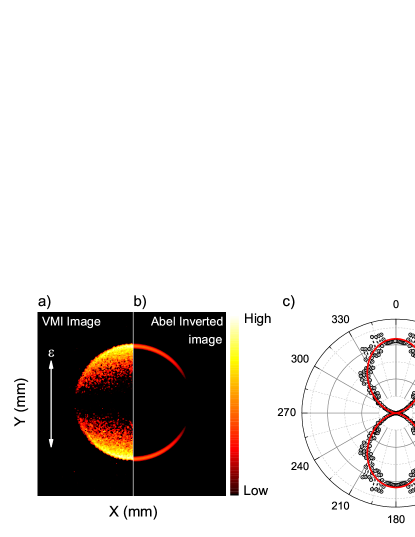
We implemented Abel inversions using the well-established program, MEVELER 36, to obtain the full 3D velocity distribution of photoelectrons from 2D projection images captured by the VMI spectrometer. We used known photoelectron energy distribution of \ceHe at different photon energies above the atomic \ceHe ionization energy ( eV) to calibrate VMI spectrometer. The average energy resolution () achieved by the spectrometer is about . For one-photon ionization by linearly polarized light, under dipole approximation, the differential cross section can be expressed as:
| (1) |
Since, the photoelectron velocity () has the cylindrical symmetry along the polarization axis (), the differential cross section has no azimuthal () dependence. is the second order Legendre polynomial and is the angle between and . The photoelectron angular distribution (PAD) is characterized by the asymmetry parameter, .
In the current study, to obtain the value of specific to different ionic states, we used the following scheme: Multiple Gaussian functions are fitted to the PES to determine different ionic states and their full-width-at-half-maximum (FWHM). Then, we obtain the PAD for each state by integrating the angular photoelectron counts over the FWHM limit of each state from the Abel-inverted distribution. Finally, we fitted eq.(1) on the PAD to get the asymmetry parameter, . For example, fig.2 a), b) show the experimental VMI distribution and the Abel-inverted distribution of the photoelectron emitted due to photoionization of effusive \ceHe at eV, respectively. Fig.2 c) presents the PAD of the observed \ceHe ionization, where the value of obtained from fitting eq.(1) is which correctly correlates to the PAD of - partial wave resulting from one-photon ionization 37.
3 Results and discussion
Acetylene in its neutral ground state () has the following electronic configuration: (1σ_g)^2(1σ_u)^2(2σ_g)^2(2σ_u)^2(3σ_g)^2(1π_u)^4, with , , and being the lowest lying unoccupied orbitals. In the spectral range from eV to below double ionization energy ( eV), electrons are predominantly excited or ionized from the valence orbitals, , , and . Considering the independent particle model, ionization from the , , and orbitals leads to , , , and states in \ceC2H2^+, respectively. Along with these direct ionization channels, there exists several indirect autoionizing resonances in \ceC2H2, where electrons are excited from the valence orbitals to the virtual orbitals upon photoabsorption. As these excitations decay to the ionic states, and , the corresponding kinetic energies of photoelectrons remain same irrespective of the ionization mechanism. However, the ionization cross sections of these states and the associated photoelectron angular distributions are greatly influenced by the involved ionization processes38, 23, 35, 31, 32, 39. Here, we will discuss the photon energy dependent photoionization cross sections and the photoelectron angular distributions associated with different cationic states of \ceC2H2+ both for the photoionization and for different photodissociation channels. The remainder of this article is organized as follows: First we discuss photoion mass spectra which enable us to identify distinct ionization channels characterized by the dissociation pathways of the \ceC2H2+ ion. The mainstay of this article, photoelectron energy spectra (PES) specific to these ionization channels, as well as the photoelectron angular distributions (PADs) and the asymmetry parameters () particular to each ionization channel and ionic state are presented. We compare our work with existing studies wherever it is relevant to underscore new findings.
3.1 Photoion mass spectra and dissociation channels
| (eV) | (arb. u.) | (arb. u.) | |||||||||
|---|---|---|---|---|---|---|---|---|---|---|---|
| \ceC2H2+ | \ceC2H+ | \ceC2+ | \ceCH2+ | \ceCH+ | |||||||
| Current | Previous38 | Current | Previous38 | Current | Previous38 | Current | Previous38 | Current | Previous38 | Current | |
| 19.0 | 0.777 | 0.777 | 0.105 | 0.112 | 0.006 | 0.004 | 0.004 | 0.002 | 0.007 | 0.000 | 0.904 |
| 21.6 | 0.739 | 0.734 | 0.183 | 0.191 | 0.014 | 0.008 | 0.008 | 0.011 | 0.029 | 0.004 | 0.988 |
| 23.9 | 0.651 | 0.628 | 0.148 | 0.149 | 0.016 | 0.024 | 0.008 | 0.026 | 0.028 | 0.019 | 0.864 |
| 26.0 | 0.588 | 0.511 | 0.137 | 0.119 | 0.019 | 0.025 | 0.007 | 0.016 | 0.024 | 0.025 | 0.784 |
| 28.0 | 0.377 | 0.412 | 0.090 | 0.087 | 0.014 | 0.021 | 0.005 | 0.012 | 0.017 | 0.023 | 0.509 |
| 36.0 | 0.283 | — | 0.073 | — | 0.015 | — | 0.005 | — | 0.027 | — | 0.416 |
| 40.0 | 0.209 | — | 0.061 | — | 0.014 | — | 0.005 | — | 0.029 | — | 0.331 |
To identify \ceC2H2 photoionization channels, we recorded the photoion ToF mass spectra, presented in fig.3, at different photon energies. We observe several fragmented ions, \ceC2H+, \ceC2+, \ceCH2+, \ceCH+ and \ceC+ as well as unfragmented parent molecular ion, \ceC2H2+. Each of these fragmented ions represents a distinct photodissociation channel, where the respective ionic fragment is accompanied by undetected neutrals. Among these ionic products, \ceC2H2+ and \ceC2H+ ions are the most abundant ionic species, constituting of total ion-yield, while the other fragments comprise the remaining fraction. Notably, in fig.3 the ion-yields of the photoions (), where represents \ceC2H2+, \ceC2H+, \ceC2+, \ceCH2+, \ceCH+ and \ceC+, vary with photon energy, evidencing the corresponding dependence of the relative ionization efficiencies () of the channels involved on the same parameter.

Hayaishi et al.38 extensively studied the photoionization dynamics of \ceC2H2 by measuring the photoion-yields of \ceC2H2+, \ceC2H+, \ceC2+, \ceCH2+ and \ceCH+ as a function of photon energy. They discussed the appearance energies of these ions as well as assigned electronic excitations that result in these photoions from ab initio theoretical calculations. Here, the relative ionization efficiencies () are calculated from the integral area of different photoion () peaks in the TOF mass spectra as a function of photon energy, shown in fig.3. Herein, the photoion ToF mass spectra are normalized such that the total ion-yields of background \ceN2+ ions at different photon energies are proportional to the respective partial ionization cross section of \ceN2+ from \ceN2 photoionization40. Since, we kept the data acquisition time and the spectrometer chamber pressure at the same values for all the measurements at different photon energies, assuming the identical detection efficiencies of different photoions, the relative ionization efficiencies calculated here are proportional to the respective partial photoionization cross sections of \ceC2H2 photoionization 41. Table.1 shows the comparison of the observed relative ionization efficiencies ( of \ceC2H2+, \ceC2H+, \ceC2+, \ceCH2+ and \ceCH+ ions with the results obtained by Hayaishi et al.38. The reported relative ionization efficiencies () scaled suitably so that the ionization efficiency of \ceC2H2+ at eV photon energy, are matched with that of Hayaishi et al.38. In this context, it is important to note that, in the work of Hayaishi et al.38 at eV the relative ionization efficiency of \ceC2H2+ is equal to arb. u.. In table.1, represents the total relative ionization efficiency of cumulative all \ceC2H2 photoions shown in fig.3.
It is encouraging to note that there is a good agreement between our results and corresponding values from earlier studies for \ceC2H2+ and \ceC2H+ ions: The reported photoionization threshold of \ceC2H2 is eV and appearance energy of \ceC2H+ is eV 38, 42 which can be associated with the \ceC2H2+ states, and , respectively. For photoions whose appearance energies are higher than that of \ceC2H2+ and \ceC2H+, , their yield and photoionization efficiencies are also relatively lower (cf. table.1). We identify \ceC2+ ion originating from two photodissociation channels:
| (2) |
, and
| (3) |
with appearance energies of eV and eV, respectively38. We infer these mechanisms noting that the observed difference between these two \ceC2+ appearance energies matches the dissociation energy of the \ceH2 molecule38. Similarly, for \ceCH+ ion, there are two distinct appearance energies at eV and eV arising due to the following photoionization channels:
| (4) |
, and
| (5) |
, respectively38. The appearance energies of the \ceCH2+ \ceC and \ceC+ \ceCH2 photodissociation channels are eV38 and eV41, respectively. However, previous electron impact ionization study on \ceC2H2 reported the appearance energy of \ceC+ ion at a lower energy of eV43. Table.1 is a concise summary of the measured relative ionization efficiencies () of these photoion compared with literature 38, corresponding to the aforementioned ionization channels, affirming the reliability of our measurements. We are now in a position to obtain insights into these processes taking advantage of the photoelectron imaging correlated to each of these photoions. This enables us to derive insights into state-selective photo-fragmentation dynamics.
3.2 Photoelectron energy spectra and state-specific dissociation dynamics
To understand the mechanisms underlying the photoionization of \ceC2H2, here we present the photoelectron energy spectra (PES) and photoelectron angular distributions (PADs) of the photoelectrons correlated to all the ionic products of \ceC2H2 photoionization. Then, PES and PADs in coincidence with each of the product ions are presented to investigate the ionization channels leading to these product ions. This allows us to compare our work with earlier reports, whereas the ionization channel specific investigation is a particular specialty of this work. We first discuss the \ceC2H2 photoionization and the ionization channels that produce most abundant ions, \ceC2H2+ and \ceC2H+. In the latter part, we discuss rest of the photodissociation channels.
| (eV) | BE (eV) | |||||||||
|---|---|---|---|---|---|---|---|---|---|---|
| All \ceC2H2 photoions | \ceC2H2+ | \ceC2H+ | ||||||||
| 19.0 | 11.79 0.48 | 16.95 0.34 | 17.49 0.28 | — | 11.79 0.48 | 16.92 0.35 | — | 17.62 0.27 | 18.54 0.11 | — |
| 21.6 | 11.72 0.61 | 17.09 0.45 | 18.76 0.40 | — | 11.72 0.61 | 17.01 0.45 | 18.46 0.42 | 17.67 0.44 | 18.86 0.40 | — |
| 23.9 | 11.78 0.84 | 17.14 0.48 | 17.49 0.28 | 23.29 0.14 | 11.78 0.84 | 17.09 0.48 | 18.96 0.46 | 17.72 0.47 | 19.00 0.46 | 23.08 0.18 |
| 26.0 | 11.83 1.09 | 17.16 0.54 | 17.49 0.28 | 23.92 0.35 | 11.83 1.09 | 17.12 0.55 | 18.87 0.48 | 17.78 0.52 | 19.10 0.48 | 23.44 0.38 |
| 28.0 | 12.01 1.28 | 17.27 0.69 | 18.76 0.40 | 24.24 0.44 | 12.01 1.28 | 17.22 0.69 | 18.98 0.55 | 17.88 0.63 | 19.23 0.54 | 23.60 0.45 |
| (eV) | (Mb) | |||||||
|---|---|---|---|---|---|---|---|---|
| Current | TDDFT31 | Current | TDDFT31 | Current | TDDFT31 | Current | TDDFT31 | |
| 19.0 | 12.72 0.32 | 13.45 | 8.94 0.23 | 15.57 | 4.90 0.12 | 4.40 | — | — |
| 21.6 | 12.36 0.31 | 12.12 | 11.59 0.29 | 9.86 | 5.09 0.13 | 5.50 | — | — |
| 23.9 | 11.64 0.29 | 8.85 | 9.08 0.23 | 8.23 | 4.17 0.10 | 4.44 | 0.49 0.01 | 0.89 |
| 26.0 | 10.20 0.26 | 7.68 | 7.09 0.18 | 7.02 | 4.70 0.12 | 3.74 | 1.03 0.03 | 1.15 |
| 28.0 | 5.31 0.13 | 6.87 | 4.79 0.12 | 6.04 | 3.49 0.09 | 3.38 | 1.38 0.03 | 1.18 |
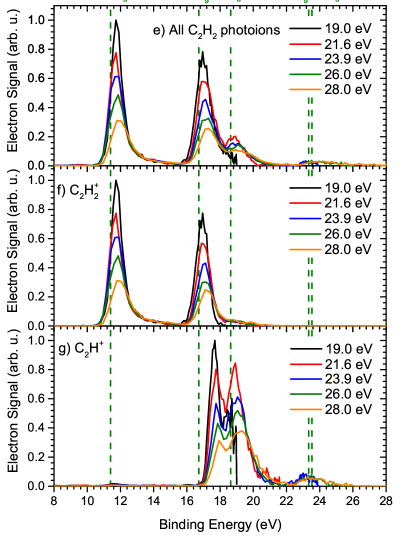
In fig.4, panels a) and c) show the photoelectron VMI distributions and panels b) and d) show the Abel-inverted distributions correlated to \ceC2H2+ and \ceC2H+ ions, respectively, at eV photon energy. Fig.4 e) shows the cumulative PES summed over all the photoelectrons associated to all the photoions resulting from \ceC2H2 photoionization. There are four distinct peak-structures in the PES centered at and eV representing different ionized states of \ceC2H2. The vertical green dashed lines in fig.4 e) present the known ionization energies of first five cationic states , , , and at , , , and eV, respectively32. Therefore, in this photon energy range ( eV), these five states are mainly populated upon photoionization of \ceC2H2. Interestingly, PES correlated to the unfragmented \ceC2H2^+ ion (cf. fig.4 f)) do not have the fourth peak corresponding to the and states, evidencing that the unfragmented \ceC2H2^+ ion is only produced from first three states. In contrast, PES correlated to \ceC2H^+ ion (cf. fig.4 g)) indicate that only the higher excited states, excluding , lead to the \ceC2H+ fragment, which in addition release a neutral \ceH. This observation reveals the mechanism underlying the previously reported appearance energy of \ceC2H+ at eV38, 42. Coincident photoelectron imaging in forthcoming discussions will reveal further details of the dynamics in this channel and others.
In order to determine the binding energies (BE), multiple Gaussian functions are fitted to the PES; peak positions and relative intensities associated with different maxima are determined. Owing to the finite energy resolution of the VMI spectrometer, we are not able to distinguish between the closely spaced and states. Therefore, we address the properties of this peak by labelling it as . Table.2 presents the binding energies corresponding to different \ceC2H2+ states obtained from the fitting of PES correlated to cumulative all \ceC2H2 photoions as well as spectra in coincidence with specific photoions, \ceC2H2^+ and \ceC2H^+, respectively.
In fig. 4 e)- g), we note upward shifts in PES peaks corresponding to the ionic state, , compared to its ground vibrational level shown by the vertical green dashed line at eV. This upward shift in BE of the state can be attributed to the photoionization of \ceC2H2 into the higher vibrational levels, and , belonging to the ground ionized state () with energies and eV, respectively44. However, it should be noted that, the finite energy resolution of the spectrometer leads to significant widths in the reported binding energies, cf. table.2. From table.2, we see that the PES peaks in the spectra in coincidence with cumulative all \ceC2H2 photoions, and those correlated to \ceC2H2+ are nearly at the same positions for and states, whereas maxima in spectra correlated to and states in \ceC2H+ are significantly shifted towards higher binding energies by eV and eV, respectively, as compared to the same in \ceC2H2+, also evident in panel g) of fig. 4. Thus, the additional binding energy is expended in climbing up the vibrational manifold of the and states of the \ceC2H2^+ ion leading up to the dissociation into the \ceC2H^+ ion and the neutral \ceH 45. For this dissociative ionization channel, the contributions of the higher excited states () are also significantly enhanced.

Furthermore, even though we are able to decipher the electronic states resulting from \ceC2H2 photoionization, particularly in the case of \ceC2H2+ and \ceC2H+ product ions, it is difficult to discern the exact ionization process for the following reasons without additional knowledge: Both the direct photoionization and indirect autoionization processes lead to the same final electronic state; photoelectron kinetic energies emerging from the final state remain identical irrespective of the ionization mechanisms. However, the partial ionization cross sections of the final states and the associated photoelectron angular distributions will depend on the details of the ionization processes. At photon energies near the autoionization resonances, we may expect to see the impact of resonances both in the partial ionization cross sections of these states and in the associated photoelectron angular distributions (PADs). Therefore, to discern the \ceC2H2 photoionization processes, we will discuss photon energy dependent partial ionization cross sections in terms of state-selective branching ratios and photoelectron asymmetry parameter of these states in detail. To the best of our knowledge, state-selective branching ratios and photoelectron asymmetries for different photoionization channels of \ceC2H2 as a function of photon energy are reported for the first time.
To determine the state-selective branching ratios () as a function of photon energy for different photoionization channels, we use the following method: First, the PES correlated to a specific photoionization channel for a given photon energy, , is fitted with the following multiple Gaussian functions, , of the form:
| (6) |
where, , and represent the binding energy (BE), standard deviation and intensity of the state in the fitted PES, respectively. Now, the branching ratios () of different ionic states () for the concerned photoionization channel at the photon energy, , can be written as:
| (7) |
These state-selective branching ratios () provide a normalized scaling for the relative intensities of individual ionic states () in a specific photoionization channel at a particular incident photon energy, where the total intensity summed over all the ionic states, , is equal to .
The state-selective branching ratios as a function of photon energy producing all \ceC2H2 photoions are presented in fig.5 a). As a trend, with increasing photon energy, the population of decreases while that of higher excited states increase. And, these ratios in the case of and states, respectively, show moderate photon energy dependence. These decreasing nature of relative intensities of and states can be attributed to the involved atomic orbital. On the other hand, increasing state-selective branching ratios of and states are due to the involved atomic orbital 35. In addition, a weak local maximum is observed in the state around eV. A comparison between the equivalent state-selective ionization cross sections () of different states () obtained from our study with the same from theoretical time dependent density functional (TDDFT) calculation31 as a function of photon energy is reported in table.3. To calculate the equivalent state-selective ionization cross sections, we implement the following method: First, the state-selective relative ionization efficiencies () of different ionic states () for \ceC2H2 photoionization at a particular photon energy are calculated as,
| (8) |
where, and are the total relative ionization efficiency and the branching ratio of the corresponding ionic state (). is related to cumulative efficiency of all photoions resulting from \ceC2H2 ionization at the corresponding photon energy (cf. table.1). We take advantage of previously reported partial photoionization cross sections of \ceC2H2 in the work of Cooper et al.41, to determine the state-selective ionization cross sections, which are a fraction of the total cross section. Implementing this scheme, we calculated these state-selective ionization cross-sections () from using the relation, . The success of the measurements and this procedure is vindicated by the agreement of these experimental state-selective ionization cross sections with the theoretical calculation.
To our advantage, the PEPICO technique enables the measurement of state-selective branching ratios associated with the photoionization channels producing \ceC2H2+ and \ceC2H+ ions as a function of photon energy, see fig.5 b) and c). This leads to a comprehensive picture of ionization and dissociation in the photo-fragmentation process examining the PES correlated to \ceC2H2+ and \ceC2H+ ions. As observed from the PES (cf. fig.4) the higher excited ionic states, , do not leave behind unfragmented \ceC2H2+ ions, the lowest ionized state, , does not participate in the dissociation process to produce \ceC2H+. For the \ceC2H2+ ion, the state-selective branching ratio of state dominates over the same of and states. The state-selective branching ratios of the and states slightly decrease with increasing photon energy and are significantly higher than that of the state which slightly increases with increasing photon energy. On the other hand, for \ceC2H+ ion, the contributions of states are dominant over the and states. Beyond the photon energy of eV, the state-selective branching ratio of largely remain independent of photon energy. On the other hand, opposite behaviors are seen for and states, in which the branching ratio of decreases and the same of increases with increasing photon energy.
3.3 Photoelectron angular distributions: fragment- and state-selected
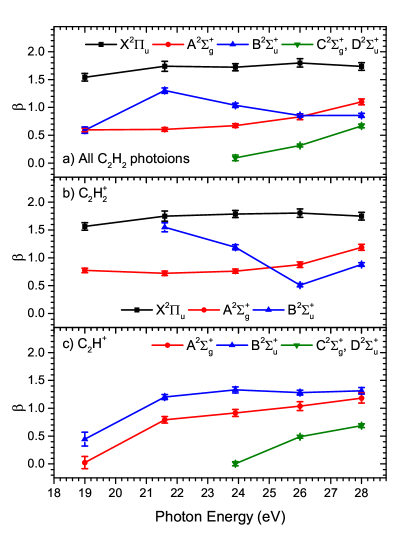
The most significant aspect of correlated photoelectron imaging is the opportunity it provides to examine photoion- and state-specific PADs. This immediately reveals the variations of the asymmetry parameters () of the photoelectron angular distributions correlated to different electronic states. Fig.6 a), b) and c) depict as a function of photon energy; these are determined for the cases of photoelectrons in coincidence with cumulative all \ceC2H2 photoions as well as PADs correlated to \ceC2H2+ and \ceC2H+ ions, respectively. Since the -electron usually leads to a higher degree of asymmetry than that of electron ejection34, the observed large value of for state originating from the ionization of the HOMO () is justified. Considering the low relative photoionization efficiencies of some of the channels, the VMI technique plays an important role in the measurement of parameters in which photoelectrons are collected over the entire solid angle. In this case, the measured () for states is higher than the corresponding values obtained from the previous experimental studies where angle-resolved spectra were recorded using hemispherical electron analyzers 34, 35.
Two significant trends underscore the behaviour and physics of the dependence of the asymmetry parameter () as a function of photon energy: i) For the and states, the absence of autoionizing resonances in the chosen photon energy region, eV, underlies the observation of a weak dependence of the , the asymmetry parameter on , cf. the black and red lines in fig.6. It is well known that autoionizing resonances influence PADs; there are no such channels decaying to the lower ionized states, and , for eV 46, consistent with earlier results35, 47. ii) The higher ionized state shows considerable variations in the parameter with photon energy in the PADs of the cumulative all photoion distribution and those correlated with the \ceC2H2+ ion, cf. the blue line in fig.6 panels a) and b). We observe a local maximum around eV in the vs. curve for photoelectrons in coincidence with cumulative all photoions and a minimum at eV in the photon energy dependence of correlated to the \ceC2H2+ ion. In previous works, a minimum was observed at eV for the state and reasoned as occurring due to interplay between and transitions, where represents a state in the continuum 47, 35, 31. Therefore, it is surprising that we do not observe the minimum corresponding to the state curve for the dissociation product, \ceC2H+ ion; there is no such structure in the vs. curve. Rather, we only observe a nearly constant with increasing photon energy, cf. the blue line in fig.6 c). This leads us to the conclusion that the observed local minimum around eV in the vs. curve for \ceC2H2+ ion is related autoionizing resonances which play a prominent role in the formation of \ceC2H2+ upon photoionization of the parent molecule. While \ceC2H+ is formed by the dissociation of \ceC2H2+, the absence of this minimum (at eV) in the associated with the former indicates formation \ceC2H+ ion from non-autoionizing states. A fraction of the population of \ceC2H2 participates in the aforementioned autoionizing resonance which is left undissociated when it decays, very likely, to lower vibrational states. However, \ceC2H+ is formed by dissociation from a competing channel which proceeds through a population of the higher vibrational states of \ceC2H2+ upon direct ionization. This observation motivates further theoretical investigations including multichannel interactions considering autoionizing states and nuclear dynamics. Finally, for the states, the value of increases steadily with increasing photon energy for cumulative all ions and \ceC2H+ ions (green line in fig.6 a), c)). Since these states do not produce unfragmented \ceC2H2+, autoionizing channels play no role.
| (eV) | ||||||||||||
|---|---|---|---|---|---|---|---|---|---|---|---|---|
| Current | TDDFT31 | MCSCF32 | Current | TDDFT31 | MCSCF32 | Current | TDDFT31 | MCSCF32 | Current | TDDFT31 | MCSCF32 | |
| 19.0 | 1.54 | 0.88 | 0.74 | 0.60 | 0.31 | 0.02 | 0.59 | 0.67 | 0.59 | — | — | — |
| 21.6 | 1.74 | 1.03 | 0.79 | 0.61 | 0.32 | 0.15 | 1.30 | 1.16 | 0.82 | — | — | — |
| 23.9 | 1.72 | 1.19 | 1.06 | 0.67 | 0.36 | 0.22 | 1.04 | 1.17 | 1.22 | 0.10 | 1.06 | 0.01 |
| 26.0 | 1.80 | 1.26 | — | 0.83 | 0.41 | 0.30 | 0.86 | 1.13 | 1.25 | 0.32 | 1.47 | -0.31 |
| 28.0 | 1.74 | 1.32 | — | 1.10 | 0.46 | 0.41 | 0.86 | 1.08 | 1.23 | 0.67 | 1.43 | -0.13 |
Several theoretical studies performed hitherto32, 31 addressed the variation of electronic state specific asymmetry parameter by considering multichannel interaction of electronic excitations in this photon energy range. Wells and Lucchese32 implemented multichannel scattering methodology (MCSCF) where the partial cross sections and corresponding parameters of different ionic final states were calculated for different autoionization resonances. Fronzoni et al.31 used time dependent density functional method on a fixed nuclei geometry to calculated the autoionization channels and the asymmetry parameters. Table.4 shows the comparison of the parameter obtained in our experiment with the previous theoretical studies 32, 35. Only for the state, reasonable agreement between our experimental result and the theoretical calculation is observed. While for other ionized states our values are quite different from the same calculated from theory. It should be noted that both the theoretical studies estimate different values of for the and states, with reasonable agreement only for state.
3.4 Higher-excited states: binding energies and dissociation channels
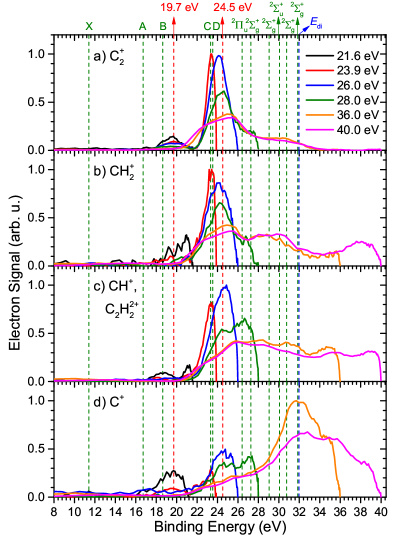
Before concluding this article, we discuss the photoionization channels that produce low ion-yields at and in the photoion ToF mass spectra. Here, both the single and double ionization regimes of \ceC2H2 are covered in the photon energy range, eV, to access the higher excited electronic states of \ceC2H2+ leading to these low-yield ions. However, the previous sections, only the single ionization pathways of \ceC2H2 were discussed by presenting the PES and PADs correlated to cumulative all \ceC2H2 photoions and the high yield ions, \ceC2H2+ and \ceC2H+. PES corresponding to these photoions are plotted in fig.7 as a function of binding energy (BE), where BE is calculated by subtracting the kinetic energy of the detected electron from the incident photon energy. Since we detect only one emitted electron both for single and double ionization events, a correct assignment of electronic states is only possible for the cationic states (BE ) which result from single ionization events. To assign dicationic states (BE ) relevant to double ionization, it would be necessary to take into account the total kinetic energy carried by both the emitted electrons. In fig.7, the vertical green dashed lines show cationic states leading up to the blue dashed line showing the double ionization energy ( eV) of \ceC2H2.
| \ceC2H2^+ state | |||||||||||||||||||||
|---|---|---|---|---|---|---|---|---|---|---|---|---|---|---|---|---|---|---|---|---|---|
| eV | eV | eV | eV | eV | |||||||||||||||||
| state | BI (eV) | \ceC2+ | \ceCH2+ | \ceCH+ | \ceC+ | \ceC2+ | \ceCH2+ | \ceCH+ | \ceC+ | \ceC2+ | \ceCH2+ | \ceCH+ | \ceC+ | \ceC2+ | \ceCH2+ | \ceCH+ | \ceC+ | \ceC2+ | \ceCH2+ | \ceCH+ | \ceC+ |
| 23.33 | 1.33 | 1.12 | 1.15 | 0.89 | 1.14 | 0.84 | 1.08 | 0.41 | 0.70 | 0.38 | 0.63 | 0.37 | 0.33 | 0.18 | 0.27 | 0.36 | 0.25 | 0.19 | 0.02 | -0.03 | |
| 26.40 | 0.47 | 0.63 | 1.02 | 0.70 | 0.04 | 0.09 | 0.96 | 0.60 | 0.07 | -0.01 | 0.13 | 0.22 | — | — | — | — | — | — | — | — | |
| 27.27 | 0.19 | 0.13 | 0.91 | 1.12 | 0.02 | 0.04 | 0.74 | 0.68 | 0.14 | -0.27 | 0.03 | 0.16 | — | — | — | — | — | — | — | — | |
| 29.04 | 0.29 | 1.09 | 0.61 | 0.83 | 0.29 | 0.20 | 0.40 | 0.36 | — | — | — | — | — | — | — | — | — | — | — | — | |
| 30.06 | 0.44 | 0.38 | 0.55 | 0.73 | 0.34 | 0.67 | 0.43 | 0.63 | — | — | — | — | — | — | — | — | — | — | — | — | |
| 30.77 | 0.36 | 0.08 | 0.54 | 0.82 | 0.29 | 0.03 | 0.59 | 0.43 | — | — | — | — | — | — | — | — | — | — | — | — | |
| 31.85 | 0.25 | -0.08 | 0.36 | 0.60 | 0.45 | 0.17 | 0.23 | 0.36 | — | — | — | — | — | — | — | — | — | — | — | — | |
| 24.5 eV | 24.50 | 0.67 | -0.33 | 0.75 | 0.84 | 0.68 | 0.21 | 0.73 | 0.60 | 0.27 | 0.79 | 0.60 | 1.06 | 0.08 | 0.19 | 0.02 | 0.11 | — | — | — | — |
Since, the studied photon energies cover the spectral range both below and above the , we discuss these two regimes separately. For , only single ionization of \ceC2H2 molecule is possible. Therefore, photoion ToF mass peaks at and correspond to \ceC2+, \ceCH2+, \ceCH+ and \ceC+ ions, respectively, which result from different fragmentation channels of \ceC2H2+ ion. In fig.7, the PES correlated to all these ions have onset around the which show intense peak structures around eV BE. This implies that the low-yield ions are produced from the higher excited states, and beyond, whereas the high-yield \ceC2H2+ and \ceC2H+ ions are found to be predominantly produced from the lower-lying and states. For eV, we observe small PES peaks at BE around state. For \ceC2+, \ceCH2+ and \ceC+ ions, the corresponding PES peaks are centered at BE eV, whereas for \ceCH+ ion, the associated peak is coinciding with state (cf. fig.7 c)). At eV, PES correlated to all these photoions (red line in fig.7) have similar maxima around a binding energy of eV corresponding to the state. However, the associated photoelectron asymmetry parameters () for these ions are quite different (cf. table.5). The observed decreases from for \ceC2+ ion to for \ceC+ ion. Similar peaks around eV are observed for photoionization at and eV (blue and green line in fig.7), along with two additional peak structures centered around (BE = eV) and (BE = eV) states for eV. The peak around eV (vertical red dashed line in fig.7) cannot be associated with any reported cationic state, though. For \ceC2+ and \ceCH2+ ions, the eV peak dominates over the other two peaks assigned to and states, while for \ceCH+ and \ceC+ ion all the three peaks are almost at equal intensity. For (BE = eV) state, the observed photoelectron angular distributions are isotropic, which resulted in values close to zero. This is in contrast to the observed asymmetry () for state where we observe higher degree of asymmetry (). However, the new peak around eV shows higher degree of asymmetry which increases from for \ceC2+ to for \ceC+ at eV.
For , both single and double ionization of \ceC2H2 are possible. Therefore, the mass peaks at and correspond to fragment ions from both single and double ionization events. However, the contributions of single and double ionization events can be distinguished from the BE scale in the PES. For BE , all the events are from single ionization processes which are discussed earlier. The relevant state-selective asymmetry parameters () are shown in table.5 for and eV. For BE , the PES correspond to the detection of one of the two emitted electrons from double ionization of \ceC2H2. The assignment of electronic states is not feasible, as stated earlier. Fig.7 a) shows the PES correlated to \ceC2+ ion produced from the \ceC2H2^2+ \ceC2^+ \ceH+ \ceH dissociation process49. Fig.7 b) and d) show the PES corresponding to \ceCH2^+ and \ceC+ which result from the same photo-fragmentation channel \ceC2H2^2+ \ceC+ \ceCH2+; this channel involves the characteristic isomerization of acetylene 50. For \ceC2H2^2+ and \ceCH^+ photoions produced by non-dissociative and the dissociative (\ceC2H2^2+ \ceCH+ \ceCH+) double ionization channels, respectively, the corresponding PES are shown in fig.7 c) 50.
For all the cationic states, we determine fragmentation channel specific photoelectron asymmetry parameters () from the angular distributions obtained by integrating photoelectron counts in Abel-inverted distributions considering a eV energy-window centered at the BE of each state. Table.5 presents the details of the asymmetry parameter along with the BE of each state. This includes state-selective values which are distinct to photoionization channels with relatively low cross sections, producing \ceC2+ , \ceCH2+, \ceCH+ and \ceC+ ions, contributing new knowledge about this important molecular system.
4 Conclusion
Several intriguing dynamics of the acetylene-vinylidene system which play a central role in our understanding of proton migration and isomerization in the extreme ultraviolet, eV are uncovered. State-selective ionization pathways are identified for \ceC2H2 photoionization. We observe that the unfragemented \ceC2H2+ ion mainly results from the lower-lying and states, while photodissociation of \ceC2H2+ from and states leads to \ceC2H+ ion and neutral \ceH. Less abundant ions (\ceC2+, \ceCH2+, \ceCH+ and \ceC+) are predominantly produced from even higher excited states, and beyond. For photoionization above the double ionization energy (), these ions are produced due to fragmentation of \ceC2H2^2+. Below , the isomerization of acetylene is addressed by presenting the PES and PAD in coincidence with \ceCH^2+ ion. State-selective branching ratios and photoelectron asymmetry parameters () correlated to the relevant cationic states are reported as a function of photon energy for all the \ceC2H2 ionization channels. Photon energy dependent photoelectron asymmetry parameter shows distinct patterns for the photoionizations leading to \ceC2H2+ and \ceC2H+ ions. Previously reported autoionizing resonance around eV decaying to state is found to be selective to the ionization pathway it proceeds. We observe this autoionization signature in the parameter only for unfragmented \ceC2H2+ ion. Whereas photo-fragmentation channel producing \ceC2H+ does not indicate such autoionization in the variation of its photoelectron angular distribution with photon energy. To understand the photoelectron dynamics in this system, particularly theoretical explorations combining both the nuclear and the electron dynamics are required. Finally, these results open avenues urging time-resolved studies of this important molecular system using table-top high-harmonic and free-electron laser pulses.
Conflicts of interest
Authors confirm that there are no conflicts of interest to declare.
Author contributions
VS, RG and SRK proposed and designed this research. SM, RG, HS, AD, RR, MC, MM, VS and SRK performed the experiment. SM, RG, RR, MM, VS and SRK contributed to analysis of the experimental data. SM, RG, RR, BB, AS, SS, MM, VS and SRK worked on the interpretation and phenomenology. SM, RG, RR, MC, SS, BB, MM, VS and SRK were involved in preparing the manuscript. BB, MM, RR, MC, VS and SRK contributed with scientific resources and funding towards the experimental realization and beamtime.
Acknowledgements
VS, RG and SRK are grateful to DST, India and ICTP, Trieste, for support (proposal # 20165468) to carry out this campaign at the Elettra Synchrotron facility. VS and SRK acknowledge financial support from the IMPRINT and DAE-BRNS scheme. SRK thanks the Max Planck Society for supporting this research via the Partner group. MM acknowledges support from the Carlsberg Foundation, and with SRK and VS for the funding from the SPARC programme, MHRD, India.
Notes and references
- Stolow 2003 A. Stolow, Annual Review of Physical Chemistry, 2003, 54, 89–119.
- Stolow et al. 2004 A. Stolow, A. E. Bragg and D. M. Neumark, Chemical Reviews, 2004, 104, 1719–1758.
- Zewail 2000 A. H. Zewail, The Journal of Physical Chemistry A, 2000, 104, 5660–5694.
- Cederbaum 2008 L. S. Cederbaum, The Journal of Chemical Physics, 2008, 128, 124101.
- Worth and Cederbaum 2004 G. A. Worth and L. S. Cederbaum, Annual Review of Physical Chemistry, 2004, 55, 127–158.
- Nandi et al. 2020 S. Nandi, E. Plésiat, S. Zhong, A. Palacios, D. Busto, M. Isinger, L. Neoričić, C. L. Arnold, R. J. Squibb, R. Feifel, P. Decleva, A. L’Huillier, F. Martín and M. Gisselbrecht, Science Advances, 2020, 6, .
- Jiang et al. 2010 Y. H. Jiang, A. Rudenko, O. Herrwerth, L. Foucar, M. Kurka, K. U. Kühnel, M. Lezius, M. F. Kling, J. van Tilborg, A. Belkacem, K. Ueda, S. Düsterer, R. Treusch, C. D. Schröter, R. Moshammer and J. Ullrich, Physical Review Letters, 2010, 105, 263002.
- Liekhus-Schmaltz et al. 2015 C. E. Liekhus-Schmaltz, I. Tenney, T. Osipov, A. Sanchez-Gonzalez, N. Berrah, R. Boll, C. Bomme, C. Bostedt, J. D. Bozek, S. Carron, R. Coffee, J. Devin, B. Erk, K. R. Ferguson, R. W. Field, L. Foucar, L. J. Frasinski, J. M. Glownia, M. Gühr, A. Kamalov, J. Krzywinski, H. Li, J. P. Marangos, T. J. Martinez, B. K. McFarland, S. Miyabe, B. Murphy, A. Natan, D. Rolles, A. Rudenko, M. Siano, E. R. Simpson, L. Spector, M. Swiggers, D. Walke, S. Wang, T. Weber, P. H. Bucksbaum and V. S. Petrovic, Nature Communications, 2015, 6, 8199.
- Galbraith et al. 2017 M. C. E. Galbraith, C. T. L. Smeenk, G. Reitsma, A. Marciniak, V. Despré, J. Mikosch, N. Zhavoronkov, M. J. J. Vrakking, O. Kornilov and F. Lépine, Physical Chemistry Chemical Physics, 2017, 19, 19822–19828.
- Schoenlein et al. 1991 R. Schoenlein, L. Peteanu, R. Mathies and C. Shank, Science, 1991, 254, 412–415.
- Kreutz 01 Jan. 1970 W. Kreutz, Zeitschrift für Naturforschung B, 01 Jan. 1970, 25, 88 – 94.
- Löwdin 1963 P.-O. Löwdin, Reviews of Modern Physics, 1963, 35, 724–732.
- Rein and Harris 1964 R. Rein and F. E. Harris, Science, 1964, 146, 649–650.
- Burger et al. 2018 C. Burger, A. Atia-Tul-Noor, T. Schnappinger, H. Xu, P. Rosenberger, N. Haram, S. Beaulieu, F. Légaré, A. S. Alnaser, R. Moshammer, R. T. Sang, B. Bergues, M. S. Schuurman, R. de Vivie-Riedle, I. V. Litvinyuk and M. F. Kling, Structural Dynamics, 2018, 5, 044302.
- Li et al. 2017 Z. Li, L. Inhester, C. Liekhus-Schmaltz, B. F. E. Curchod, J. W. Snyder, N. Medvedev, J. Cryan, T. Osipov, S. Pabst, O. Vendrell, P. Bucksbaum and T. J. Martinez, Nature Communications, 2017, 8, 453.
- Boyé-Péronne et al. 2006 S. Boyé-Péronne, D. Gauyacq and J. Liévin, The Journal of Chemical Physics, 2006, 124, 214305.
- Zyubina et al. 2005 T. S. Zyubina, Y. A. Dyakov, S. H. Lin, A. D. Bandrauk and A. M. Mebel, The Journal of Chemical Physics, 2005, 123, 134320.
- Alagia et al. 2012 M. Alagia, C. Callegari, P. Candori, S. Falcinelli, F. Pirani, R. Richter, S. Stranges and F. Vecchiocattivi, The Journal of Chemical Physics, 2012, 136, 204302.
- Krishnan et al. 1981 R. Krishnan, M. J. Frisch, J. A. Pople and P. von R. Schleyer, Chemical Physics Letters, 1981, 79, 408 – 411.
- Vilčiauskas et al. 2012 L. Vilčiauskas, M. E. Tuckerman, G. Bester, S. J. Paddison and K.-D. Kreuer, Nature Chemistry, 2012, 4, 461–466.
- Brändén et al. 2006 M. Brändén, T. Sandén, P. Brzezinski and J. Widengren, Proceedings of the National Academy of Sciences, 2006, 103, 19766–19770.
- Mandal et al. 2020 S. Mandal, R. Gopal, M. Shcherbinin, A. D’Elia, H. Srinivas, R. Richter, M. Coreno, B. Bapat, M. Mudrich, S. R. Krishnan and V. Sharma, Physical Chemistry Chemical Physics, 2020, 22, 10149–10157.
- Parr et al. 1982 A. C. Parr, D. L. Ederer, J. B. West, D. M. P. Holland and J. L. Dehmer, The Journal of Chemical Physics, 1982, 76, 4349–4355.
- Parr et al. 1981 A. C. Parr, D. L. Ederer, B. E. Cole, J. B. West, R. Stockbauer, K. Codling and J. L. Dehmer, Physical Review Letters, 1981, 46, 22–25.
- Codling et al. 1981 K. Codling, A. C. Parr, D. L. Ederer, R. Stockbauer, J. B. West, B. E. Cole and J. L. Dehmer, Journal of Physics B: Atomic and Molecular Physics, 1981, 14, 657–666.
- West et al. 1981 J. B. West, K. Codling, A. C. Parr, D. L. Ederer, B. E. Cole, R. Stockbauer and J. L. Dehmer, Journal of Physics B: Atomic and Molecular Physics, 1981, 14, 1791–1801.
- Kreibich et al. 2001 T. Kreibich, M. Lein, V. Engel and E. K. U. Gross, Physical Review Letters, 2001, 87, 103901.
- Mauritsson et al. 2010 J. Mauritsson, T. Remetter, M. Swoboda, K. Klünder, A. L’Huillier, K. J. Schafer, O. Ghafur, F. Kelkensberg, W. Siu, P. Johnsson, M. J. J. Vrakking, I. Znakovskaya, T. Uphues, S. Zherebtsov, M. F. Kling, F. Lépine, E. Benedetti, F. Ferrari, G. Sansone and M. Nisoli, Physical Review Letters, 2010, 105, 053001.
- Kelkensberg et al. 2011 F. Kelkensberg, W. Siu, J. F. Pérez-Torres, F. Morales, G. Gademann, A. Rouzée, P. Johnsson, M. Lucchini, F. Calegari, J. L. Sanz-Vicario, F. Martín and M. J. J. Vrakking, Physical Review Letters, 2011, 107, 043002.
- Sansone et al. 2010 G. Sansone, F. Kelkensberg, J. F. Pérez-Torres, F. Morales, M. F. Kling, W. Siu, O. Ghafur, P. Johnsson, M. Swoboda, E. Benedetti, F. Ferrari, F. Lépine, J. L. Sanz-Vicario, S. Zherebtsov, I. Znakovskaya, A. L’Huillier, M. Y. Ivanov, M. Nisoli, F. Martín and M. J. J. Vrakking, Nature, 2010, 465, 763–766.
- Fronzoni et al. 2004 G. Fronzoni, M. Stener and P. Decleva, Chemical Physics, 2004, 298, 141 – 153.
- Wells and Lucchese 1999 M. C. Wells and R. R. Lucchese, The Journal of Chemical Physics, 1999, 111, 6290–6299.
- O’Keeffe et al. 2011 P. O’Keeffe, P. Bolognesi, M. Coreno, A. Moise, R. Richter, G. Cautero, L. Stebel, R. Sergo, L. Pravica, Y. Ovcharenko and L. Avaldi, Review of Scientific Instruments, 2011, 82, 033109.
- Kreile and Schweig 1980 J. Kreile and A. Schweig, Chemical Physics Letters, 1980, 69, 71 – 74.
- Holland et al. 1998 D. Holland, M. MacDonald, M. Hayes, L. Karlsson and B. Wannberg, Journal of Electron Spectroscopy and Related Phenomena, 1998, 97, 253 – 263.
- Dick 2014 B. Dick, Physical Chemistry Chemical Physics, 2014, 16, 570–580.
- O'Keeffe et al. 2010 P. O'Keeffe, P. Bolognesi, R. Richter, A. Moise, E. Ovcharenko, L. Pravica, R. Sergo, L. Stebel, G. Cautero and L. Avaldi, Journal of Physics: Conference Series, 2010, 235, 012006.
- Hayaishi et al. 1982 T. Hayaishi, S. Iwata, M. Sasanuma, E. Ishiguro, Y. Morioka, Y. Iida and M. Nakamura, Journal of Physics B: Atomic and Molecular Physics, 1982, 15, 79–92.
- Langhoff et al. 1981 P. Langhoff, B. McKoy, R. Unwin and A. Bradshaw, Chemical Physics Letters, 1981, 83, 270 – 275.
- Fennelly and Torr 1992 J. Fennelly and D. Torr, Atomic Data and Nuclear Data Tables, 1992, 51, 321 – 363.
- Cooper et al. 1988 G. Cooper, T. Ibuki, Y. Iida and C. Brion, Chemical Physics, 1988, 125, 307 – 320.
- Ono and Ng 1981 Y. Ono and C. Y. Ng, The Journal of Chemical Physics, 1981, 74, 6985–6986.
- Plessis and Marmet 1986 P. Plessis and P. Marmet, International Journal of Mass Spectrometry and Ion Processes, 1986, 70, 23 – 44.
- Avaldi et al. 1995 L. Avaldi, G. Dawber, R. Hall, G. King, A. McConkey, M. MacDonald and G. Stefani, Journal of Electron Spectroscopy and Related Phenomena, 1995, 71, 93 – 105.
- Servais and Locht 1995 C. Servais and R. Locht, Chemical Physics Letters, 1995, 236, 96 – 102.
- Levine and Soven 1983 Z. H. Levine and P. Soven, Physical Review Letters, 1983, 50, 2074–2077.
- Lynch et al. 1984 D. Lynch, M. Lee, R. R. Lucchese and V. McKoy, The Journal of Chemical Physics, 1984, 80, 1907–1916.
- Wells and Lucchese 1999 M. Wells and R. R. Lucchese, The Journal of Chemical Physics, 1999, 110, 6365–6380.
- Thissen et al. 1993 R. Thissen, J. Delwiche, J. M. Robbe, D. Duflot, J. P. Flament and J. H. D. Eland, The Journal of Chemical Physics, 1993, 99, 6590–6599.
- Gaire et al. 2014 B. Gaire, S. Y. Lee, D. J. Haxton, P. M. Pelz, I. Bocharova, F. P. Sturm, N. Gehrken, M. Honig, M. Pitzer, D. Metz, H.-K. Kim, M. Schöffler, R. Dörner, H. Gassert, S. Zeller, J. Voigtsberger, W. Cao, M. Zohrabi, J. Williams, A. Gatton, D. Reedy, C. Nook, T. Müller, A. L. Landers, C. L. Cocke, I. Ben-Itzhak, T. Jahnke, A. Belkacem and T. Weber, Physical Review A, 2014, 89, 013403.