An ALMA Survey of Protoplanetary Disks in Lynds 1641
Abstract
We present ALMA observations of 101 protoplanetary disks within the star-forming region Lynds 1641 in the Orion Molecular Cloud A. Our observations include 1.33 mm continuum emission and spectral windows covering the J=2-1 transition of 12CO, 13CO, and C18O. We detect 89 protoplanetary disks in the dust continuum at the 4 level (88% detection rate) and 31 in 12CO, 13 in 13CO, and 4 in C18O. Our sample contains 23 transitional disks, 20 of which are detected in the continuum. We target infrared-bright Class II objects, which biases our sample towards massive disks. We determine dust masses or upper limits for all sources in our sample and compare our sample to protostars in this region. We find a decrease in dust mass with evolutionary state. We also compare this sample to other regions surveyed in the (sub-)millimeter and find that Lynds 1641 has a relatively massive dust disk population compared to regions of similar and older ages, with a median dust mass of 11.1 and 27% with dust masses equal to or greater than the minimum solar nebula dust mass value of 30 . We analyze the disk mass-accretion rate relationship in this sample and find that the viscous disk lifetimes are similar to the age of the region, however with a large spread. One object, [MGM2012] 512, shows large-scale (5000 AU) structure in both the dust continuum and the three gas lines. We discuss potential origins for this emission, including an accretion streamer with large dust grains.
1 Introduction
Protoplanetary disks contain the reservoirs of dust and gas that go into assembling planets. To build planets, a disk must contain enough mass to form planetary cores, and the planet formation process must take place before the disk is depleted of material. Disk evolution proceeds relatively rapidly; by 10 Myr, disks are found around only 20% of low-mass stars and no high-mass stars (Hernández et al., 2007; Ribas et al., 2015). Dust is a critical component to this evolution and it is a necessary ingredient in forming planetesimals, which are precursors to terrestrial planets and the cores of giant planets. The evolution of dust thus has a large impact on planet formation.
Millimeter and sub-millimeter wavelengths trace both dust continuum emission and important chemical signatures. Surveys of protoplanetary disks in the (sub-) millimeter have provided great insight into protoplanetary disk properties and evolution. These surveys include NGC 2024 (0.5 Myr, 414 pc, van Terwisga et al. 2020), ONC (1 Myr, 400 pc, Eisner et al. 2018), OMC1 (1 Myr, 400 pc, Eisner et al. 2016), OMC2 (1 Myr, 414 pc, van Terwisga et al. 2019), Lupus (1-3 Myr, 150-200 pc, Ansdell et al. 2016), Corona Australis (1-3 Myr, 160 pc, Cazzoletti et al. 2019), Ophiuchus (1 Myr, 140 pc, Cieza et al. 2019; Williams et al. 2019), Chamaeleon I (2 Myr, 160 pc, Pascucci et al. 2016), Taurus (2 Myr, 140 pc, Andrews et al. 2013), IC 348 (2-3 Myr, 310 pc, Ruíz-Rodríguez et al. 2018), Orionis (3-5 Myr, 385 pc, Ansdell et al. 2017), Orionis (5 Myr, 400 pc, Ansdell et al. 2020), and Upper Scorpius (5-11 Myr, 145 pc, Barenfeld et al. 2016). The results of these works have shown that there is a dependence of disk mass on stellar mass (e.g., Andrews et al. 2013; Pascucci et al. 2016; Ansdell et al. 2017; Eisner et al. 2018), the age of the region (e.g., Barenfeld et al. 2016), and the evolutionary state (Tobin et al., 2020), and that the star-forming environment has an impact on disk evolution (Eisner et al., 2018). However, some star-forming regions show dust masses that are inconsistent with a simple monotonic decrease with age. The Ophiuchus (Williams et al., 2019) and Corona Australis (Cazzoletti et al., 2019) regions have lower disk masses than slightly older counterparts, indicating that our understanding of disk evolution is not yet complete.
To tease out the effects of environment and protoplanetary disk phase on disk evolution, it is beneficial to look at a single star-forming region with large populations of disks at a range of evolutionary stages. Lynds 1641 (L1641) provides such a laboratory. L1641 is a 1.5 Myr star-forming region within the Orion A molecular cloud (with declinations from -6∘ to -9∘), the nearest giant molecular cloud complex. Kounkel et al. (2017) used the Very Long Baseline Array to determine that the Southern end of L1641 lies at a distance of 428 10 pc, although the filament has a distance gradient such that the northern end lies closer. This was also found using Gaia DR2 data by Großschedl et al. (2018). The Megeath et al. (2012, 2016) Spitzer survey of Orion identified over 700 young stars with disks in L1641. L1641 also contains 165 protostars that were recently observed as part of the Orion VLA/ALMA Nascent Disk and Multiplicity (VANDAM) survey (Tobin et al., 2020). Additionally, L1641’s distance from the Orion Nebula Cluster means that it lacks nearby massive irradiating OB stars, making it comparable to surveys of low-density regions like Taurus and Lupus. However, it can also complement other regions in Orion, including dense, irradiated environments like the ONC and OMC1, dense but low-irradiation environments like OMC2, and low-density, irradiated environments like Ori. The stellar population in L1641 has also been well-studied, including the determination of spectral types, accretion rates, and the analysis of X-ray observations (Fang et al., 2009, 2013; Hsu et al., 2012; Pillitteri et al., 2013). L1641 offers a large population of disks spanning a range of evolutionary states in a single region, making it an ideal laboratory for testing disk evolution theories.
Here we present ALMA observations of 101 young disks observed in L1641. This large sample of Class II objects (i.e., a pre-main sequence star surrounded by a disk with a spectral index of , where loglog, e.g., Furlan et al. 2016) complements previous (sub-)millimeter surveys of star-forming regions due to its young age and proximity to a large number of objects in younger evolutionary states for comparison. The L1641 sample presented here was selected from the Grant et al. (2018) sample of far-infrared-bright targets observed by Herschel that lie along the dense L1641 filament. L1641 has been well-characterized out to the far-infrared wavelengths and it already shows signs of dust evolution and has a large fraction (23%) of transitional disks (disks with gaps or cavities, Grant et al. 2018). This work seeks to characterize these disks at radio wavelengths.
In Section 2 we discuss the sample and in Section 3 we present the ALMA observations. In Section 4 we describe the continuum fluxes, gas fluxes, and compare the dust masses derived from the continuum fluxes to other surveys done in the (sub-)mm. Additionally, in Section 4, we present observations of one object that shows large-scale structure in the dust continuum and gas lines. We discuss our results in Section 5. A summary is provided in Section 6.
2 Sample
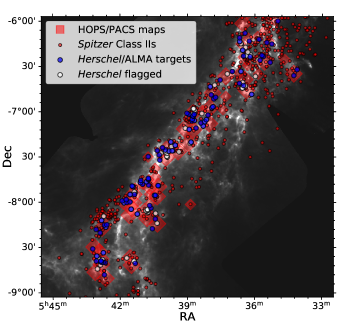
Megeath et al. (2012) surveyed the entire Orion A Molecular Cloud with Spitzer and identified 724 young stars with disks and 165 protostars in L1641 with declinations between -6.0∘ and -9.0∘. This region was observed as part of the Herschel Orion Protostar Survey (HOPS; Fischer et al. 2010; Manoj et al. 2013; Stutz et al. 2013; Furlan et al. 2016; Fischer et al. 2017, 2020). The HOPS survey targeted Spitzer-identified protostars in Orion using the Photodetector Array Camera and Spectrometer (PACS; Poglitsch et al. 2010). The survey consisted of 5’5’ or 8’8’ maps targeting the protostars with expected 70 m flux densities greater than 42 mJy. These protostars lie largely in the dense filament of L1641. Grant et al. (2018) discussed the Class II sample that was serendipitously observed in the HOPS fields in L1641. We focus on the HOPS maps that covered L1641 (i.e., below -6∘; red squares Figure 1). Of the 724 Class IIs below -6∘ identified by Megeath et al. (2012), 581 fall into the HOPS maps and of those, only 180 targets were detected at 70 m (see white and blue points in Figure 1). Additionally, objects that had Herschel fluxes that were flagged in Grant et al. (2018) are not included in the observations for this work. Objects were flagged due to 1) close sources or nebulosity in their Herschel maps, 2) visual extinctions, AV, equal to or greater than 15, or 3) colors uncharacteristic of classical T Tauri stars.
The final Grant et al. (2018) sample contained 104 disks. Of those, only four are known binaries ([MGM2012] 250, 561, 579, and 980), although only 15% of the sample had been surveyed for binarity. The majority of the existing binary coverage comes from the Hubble Space Telescope survey by Kounkel et al. (2016), which searched for companions between 100 and 1000 AU. For our ALMA observations, we remove binaries with either unknown separations or separations less than 800 AU ([MGM2012] 250, 579, and 980). Thus the ALMA sample of 101 disks contains no known binaries with small separations, although with the limited coverage, we cannot rule out that some objects are multiples.
As noted above, for our ALMA sample we only include those 101 disks that were not flagged (blue points in Figure 1), representing 14% of the Class IIs in L1641 and 17% of the Class IIs in L1641 that were covered by the HOPS maps. This leads to a bias in our sample selection, namely that the disks lie along the L1641 filament. Megeath et al. (2016) find that the protostar/pre-main-sequence star ratio decreases from clustered to distributed regions in L1641. Thus, it is likely that the clustered objects are younger than the distributed young stellar objects. This sample then likely contains younger objects than Class II sources that have dispersed outward from the filament and/or this sample lacks Class IIs that are formed in more isolated environments. Additionally, within the HOPS fields, not all Class IIs were detected by Herschel and thus are not included in the ALMA sample we present here. With this in mind, the findings we present should be interpreted with caution. While the results may not be representative of L1641 as a whole, the sample is sizable and represents an interesting subset of objects: young, infrared-bright, and likely massive disks at the beginning of their Class II phases.
3 ALMA Observations
Our sample of 101 protoplanetary disks in L1641 was observed on 2019 December 12, 13, and 16 as part of Cycle 7 (Project ID: 2019.1.00951.S; PI: Grant). Calibration was done by the NAASC/ALMA staff with ALMA pipeline and CASA version 5.6.1-8. These observations were carried out in Band 6 with 43-44 antennas and baselines from 15 to 313 m. The time on each source was 24 seconds per observation date, adding up to a total of 72 seconds for each target for an average rms of 0.12 mJy beam-1. Two continuum windows are included, each with a bandwidth of 1.875 GHz, centered at 231.986 and 216.987 GHz. Three spectral windows are included to observe the 12CO, 13CO, and C18O J=2-1 transitions, each with a bandwidth of 0.117 GHz and centered at 230.524, 220.385, and 219.547 GHz, respectively. J0725-0054 was used as a bandpass and flux calibrator and J0542-0913 was used as a phase calibrator. All three observations were combined to improve signal-to-noise.
Continuum images were cleaned in CASA version 5.6.1 using the tclean task using Briggs weighting with a robust parameter of +0.5 and the mtmfs deconvolver. The resulting images typically had beam sizes of 1.3”1.0” and a background rms of 0.12 mJy beam-1. The line data were first averaged by combining two adjacent channels to increase signal-to-noise. Then, the data were continuum-subtracted using the task uvcontsub. Next, the data were cleaned and imaged using the tclean task, using Briggs weighting and a robust parameter of +0.5. Zero-moment maps for our targets were constructed using the task immoments, clipping the data below 1, where 1 is equal to the rms of 20 emission-free channels on either end of the continuum-subtracted cube. The velocity range used for integration varied from target to target, depending on the range in which line emission was present. The rms was typically about 13, 13, and 11 Jy/beam for 12CO, 13CO, and C18O, respectively.
In addition to the planned targets, an additional 10 Class II objects from the Megeath et al. (2012) Spitzer catalog fell into the ALMA maps we present here. These 10 objects have Megeath et al. (2012) ID numbers 234, 379, 412, 573, 591, 596, 731, 793, 918, and 995. Only one of these objects, [MGM2012] 918, was included in the Herschel survey of Grant et al. (2018), however, the object is flagged in that work for having nearby sources and/or bright nebulosity at 70 m, and therefore is not included in this ALMA sample. Of these 10 objects from Megeath et al. (2012), four are detected in the continuum and these are listed in Table 2 (#2, 4, 5, and 8). An additional four objects are detected in the continuum, we list the coordinates of these additional objects in Table 2 as well (#1, 3, 6, and 7). Additional object #6 (very near [MGM2012] 673) is also detected in the 12CO and 13CO. We do not include these additional objects in our analysis.
| [MGM2012] ID | RA | Dec | SpT | Dist | F | Mdust | Major | Ratio | PA |
|---|---|---|---|---|---|---|---|---|---|
| (J2000) | (J2000) | (pc) | (mJy) | (M⊕) | (arcsec) | (∘) | |||
| 198 | 05:42:42.4 | -08:48:13.8 | M2 | 42810a | 0.48 | 2.64 | - | - | - |
| 217 | 05:41:19.6 | -08:40:38.7 | - | 52090 | 0.480.10 | 41 | - | - | - |
| 223 | 05:42:40.8 | -08:40:08.6 | M2.5 | 42020 | 4.350.10 | 232 | - | - | - |
| 225 | 05:42:46.1 | -08:40:00.8 | K4 | 42810a | 0.580.10 | 3.20.6 | - | - | - |
| 227 | 05:42:50.5 | -08:39:57.5 | K0 | 40040 | 2.950.10 | 143 | - | - | - |
| 228 | 05:42:52.5 | -08:39:16.6 | - | 42020 | 5.500.10 | 293 | - | - | - |
| 231 | 05:43:03.9 | -08:39:09.2 | M1.5 | 42810a | 1.090.10 | 6.00.6 | - | - | - |
| 232 | 05:42:50.0 | -08:39:02.8 | - | 42810a | 0.560.10 | 3.10.6 | - | - | - |
| 233 | 05:42:51.4 | -08:39:01.9 | - | 42810a | 0.48 | 2.64 | - | - | - |
| 256 | 05:43:02.6 | -08:35:48.8 | - | 42810a | 2.500.10 | 13.80.8 | - | - | - |
| 263 | 05:42:45.0 | -08:33:36.3 | M2.5 | 39040 | 0.48 | 2.15 | - | - | - |
| 269 | 05:43:13.5 | -08:31:00.5 | M3 | 600300 | 13.40.1 | 100200 | 0.220.04 | 1.00.3 | 070 |
| 278 | 05:42:53.6 | -08:20:22.6 | K6 | 42020 | 0.48 | 2.49 | - | - | - |
| 282 | 05:43:04.4 | -08:18:10.8 | M2.5 | 46040 | 0.610.10 | 3.90.9 | - | - | - |
| 284 | 05:40:33.7 | -08:17:43.4 | - | 7001000 | 5.370.10 | 100200 | - | - | - |
| 291 | 05:42:38.2 | -08:16:35.4 | - | 600200 | 0.48 | 4.38 | - | - | - |
| 294 | 05:42:42.1 | -08:15:15.1 | M3 | 43030 | 0.840.10 | 4.60.9 | - | - | - |
| 296 | 05:42:35.6 | -08:15:01.8 | M2 | 40020 | 3.400.10 | 162 | - | - | - |
| 307 | 05:42:49.8 | -08:12:10.3 | K7 | 44030 | 23.30.1 | 13020 | 0.350.02 | 0.50.1 | -65 |
| 313 | 05:40:25.7 | -08:11:16.8 | M3 | 40040 | 1.400.10 | 71 | - | - | - |
| 342 | 05:41:14.0 | -08:07:57.4 | M2 | 42010 | 0.620.10 | 3.30.5 | - | - | - |
| 378 | 05:41:30.6 | -08:04:47.9 | K7 | 42020 | 29.10.1 | 15020 | 0.120.04 | 1.00.5 | 7070 |
| 383 | 05:40:37.3 | -08:04:03.0 | F0 | 4305 | 9.210.10 | 511 | - | - | - |
| 387 | 05:40:41.0 | -08:02:18.6 | M0 | 47090 | 2.380.10 | 166 | - | - | - |
| 399 | 05:41:49.7 | -08:00:32.1 | K5 | 3966 | 36.40.1 | 1715 | 0.260.01 | 1.000.09 | 070 |
| 400 | 05:41:41.7 | -08:00:18.4 | M0 | 400200 | 2.140.10 | 1110 | - | - | - |
| 402 | 05:41:33.4 | -07:59:56.2 | M1.5 | 31050 | 5.130.10 | 155 | - | - | - |
| 403 | 05:41:54.6 | -07:59:12.4 | K3.5 | 41030 | 1.680.10 | 91 | - | - | - |
| 411 | 05:41:43.7 | -07:58:22.4 | M7.5 | 42810a | 0.630.10 | 3.50.6 | - | - | - |
| 428 | 05:40:27.8 | -07:55:36.3 | - | 400100 | 13.70.1 | 6040 | 0.440.03 | 1.000.09 | 8070 |
| 429 | 05:40:24.9 | -07:55:35.4 | M3 | 39020 | 7.190.10 | 343 | - | - | - |
| 434 | 05:41:33.2 | -07:55:02.1 | K7 | 42010 | 4.100.10 | 221 | - | - | - |
| 435 | 05:41:21.4 | -07:55:01.1 | - | 42810a | 0.48 | 2.64 | - | - | - |
| 463 | 05:41:25.9 | -07:49:50.6 | K7 | 43040 | 0.990.10 | 61 | - | - | - |
| 466 | 05:41:28.0 | -07:49:22.4 | M4 | 28040 | 2.530.10 | 62 | - | - | - |
| 468 | 05:40:17.1 | -07:49:14.4 | - | 45040 | 18.460.10 | 11020 | - | - | - |
| 471 | 05:40:18.5 | -07:49:06.7 | - | 42810a | 1.120.10 | 6.20.6 | - | - | - |
| 474 | 05:40:43.6 | -07:48:47.8 | - | 42810a | 0.540.10 | 3.00.6 | - | - | - |
| 476 | 05:40:59.9 | -07:48:16.0 | M3 | 43070 | 1.910.10 | 114 | - | - | - |
| 477 | 05:40:57.5 | -07:48:08.8 | M1.5 | 42810a | 2.640.10 | 14.50.9 | - | - | - |
| 483 | 05:41:05.5 | -07:47:07.6 | G1 | 40030 | 9.20.1 | 446 | 0.420.04 | 0.80.2 | 1020 |
| 485 | 05:40:49.3 | -07:46:32.5 | M0 | 500100 | 1.270.10 | 94 | - | - | - |
| 487 | 05:41:04.6 | -07:45:40.1 | M0.5 | 42810a | 2.920.10 | 16.10.9 | - | - | - |
| 488 | 05:40:44.1 | -07:45:09.7 | - | 41050 | 5.850.10 | 307 | - | - | - |
| 491 | 05:40:44.2 | -07:44:43.5 | - | 42810a | 8.840.10 | 492 | - | - | - |
| 494 | 05:40:44.4 | -07:44:16.7 | - | 42810a | 0.48 | 2.64 | - | - | - |
| 512 | 05:40:13.8 | -07:32:16.1 | M5.5 | 41040 | 15.90.1 | 8020 | 0.240.03 | 1.00.3 | 070 |
| 525 | 05:40:44.7 | -07:29:54.5 | M1.5 | 45050 | 11.130.10 | 7020 | - | - | - |
| 530 | 05:40:15.3 | -07:28:46.8 | - | 40050 | 15.90.1 | 8020 | 0.220.04 | 1.00.2 | -4070 |
| 546 | 05:39:49.1 | -07:26:17.2 | - | 42810a | 1.650.10 | 9.10.7 | - | - | - |
| 553 | 05:39:40.5 | -07:26:03.5 | - | 42810a | 0.840.10 | 4.60.6 | - | - | - |
| 556 | 05:40:20.4 | -07:25:54.0 | M1.5 | 41010 | 8.860.10 | 453 | - | - | - |
| 561 | 05:39:58.9 | -07:25:33.5 | - | 42810a | 11.960.10 | 663 | - | - | - |
| 574 | 05:40:06.5 | -07:23:58.7 | M3 | 41080 | 3.720.10 | 197 | - | - | - |
| 582 | 05:39:32.3 | -07:22:24.2 | K3 | 34030 | 0.48 | 1.66 | - | - | - |
| 597 | 05:38:50.0 | -07:20:18.5 | - | 3849 | 2.750.10 | 12.20.7 | - | - | - |
| 598 | 05:39:44.3 | -07:20:10.5 | - | 42810a | 1.060.10 | 5.80.6 | - | - | - |
| 619 | 05:38:55.0 | -07:11:53.7 | - | 800900 | 1.970.10 | 4090 | - | - | - |
| 626 | 05:38:36.6 | -07:11:00.2 | M4 | 37030 | 2.390.10 | 101 | - | - | - |
| 633 | 05:38:17.4 | -07:09:39.5 | M3 | 39020 | 1.190.10 | 5.30.7 | - | - | - |
| 637 | 05:38:23.9 | -07:07:38.9 | K8 | 42810a | 2.070.10 | 11.40.8 | - | - | - |
| 641 | 05:38:13.4 | -07:06:43.4 | K4.5 | 37060 | 1.680.10 | 72 | - | - | - |
| 644 | 05:38:47.7 | -07:06:14.8 | M1.5 | 400100 | 2.730.10 | 139 | - | - | - |
| 645 | 05:38:41.5 | -07:05:59.3 | - | 42810a | 14.50.1 | 804 | 0.340.03 | 0.80.1 | 3020 |
| 653 | 05:38:09.1 | -07:05:25.8 | K2 | 42810a | 0.850.10 | 4.70.6 | - | - | - |
| 654 | 05:38:46.8 | -07:05:09.1 | M0.5 | 39050 | 2.40.1 | 113 | - | - | - |
| 663 | 05:38:44.0 | -07:03:09.5 | - | 42810a | 0.60.1 | 3.10.6 | - | - | - |
| 666 | 05:38:44.8 | -07:02:47.0 | - | 300100 | 0.90.1 | 32 | - | - | - |
| 673 | 05:38:04.8 | -07:02:21.7 | M5 | 34040 | 0.48 | 1.64 | - | - | - |
| 677 | 05:38:56.5 | -07:01:55.4 | - | 400200 | 4.10.1 | 2020 | - | - | - |
| 680 | 05:38:41.5 | -07:01:52.5 | M2 | 39050 | 1.90.1 | 92 | - | - | - |
| 689 | 05:39:01.2 | -07:01:09.5 | M3 | 42050 | 3.10.1 | 164 | - | - | - |
| 729 | 05:37:54.5 | -06:57:31.1 | K7 | 42810a | 0.70.1 | 3.90.6 | - | - | - |
| 734 | 05:37:51.7 | -06:56:51.8 | M2.4 | 42810a | 0.60.1 | 3.40.6 | - | - | - |
| 751 | 05:37:49.3 | -06:51:37.4 | M3.5 | 39010 | 4.10.1 | 191 | - | - | - |
| 755 | 05:37:44.5 | -06:50:36.8 | M1 | 3908 | 1.40.1 | 6.60.5 | - | - | - |
| 761 | 05:37:56.0 | -06:48:54.9 | M0 | 44070 | 9.10.1 | 5020 | - | - | - |
| 762 | 05:36:08.3 | -06:48:36.3 | M2.5 | 39010 | 20.60.1 | 956 | 0.280.03 | 0.90.1 | -3060 |
| 792 | 05:37:58.8 | -06:43:33.7 | - | 38020 | 1.70.1 | 7.20.8 | - | - | - |
| 798 | 05:36:30.2 | -06:42:46.3 | M1.5 | 43040 | 0.60.1 | 3.50.9 | - | - | - |
| 811 | 05:36:41.0 | -06:41:17.8 | M5 | 39020 | 3.80.1 | 171 | - | - | - |
| 818 | 05:37:32.4 | -06:39:05.1 | M3 | 3568 | 0.60.1 | 2.40.4 | - | - | - |
| 832 | 05:34:15.8 | -06:36:04.5 | G8 | 42810a | 7.60.1 | 422 | - | - | - |
| 847 | 05:37:00.1 | -06:33:27.4 | G3 | 42810a | 0.90.1 | 5.00.6 | - | - | - |
| 848 | 05:36:36.9 | -06:33:24.2 | K7.5 | 38010 | 5.80.1 | 252 | - | - | - |
| 853 | 05:34:06.9 | -06:32:08.0 | M0 | 39020 | 0.48 | 2.23 | - | - | - |
| 874 | 05:35:18.9 | -06:27:25.3 | M4 | 36210 | 1.50.1 | 5.70.5 | - | - | - |
| 887 | 05:35:45.9 | -06:25:59.1 | G0.5 | 40020 | 0.48 | 2.29 | - | - | - |
| 914 | 05:36:12.6 | -06:23:39.4 | M5 | 36010 | 1.50.1 | 5.90.6 | - | - | - |
| 920 | 05:35:37.3 | -06:23:26.7 | M2.5 | 37910 | 1.60.1 | 7.10.6 | - | - | - |
| 926 | 05:36:30.1 | -06:23:10.1 | K6.5 | 42810a | 6.00.1 | 332 | - | - | - |
| 930 | 05:35:41.0 | -06:22:45.4 | M0 | 42810a | 3.20.1 | 17.71.0 | - | - | - |
| 971 | 05:36:32.3 | -06:19:19.9 | G8 | 3875 | 6.50.1 | 29.10.8 | - | - | - |
| 994 | 05:35:14.6 | -06:15:12.5 | M1 | 39020 | 1.80.1 | 8.10.8 | - | - | - |
| 1001 | 05:35:27.9 | -06:14:15.0 | K8 | 40010 | 6.80.1 | 322 | - | - | - |
| 1006 | 05:36:40.4 | -06:13:33.3 | M0.5 | 3858 | 5.00.1 | 22.11.0 | - | - | - |
| 1007 | 05:36:14.7 | -06:13:16.9 | M1.5 | 3697 | 10.20.1 | 422 | 0.270.07 | 1.00.3 | -8070 |
| 1011 | 05:35:48.9 | -06:12:07.7 | K4 | 3995 | 10.50.1 | 501 | - | - | - |
| 1020 | 05:36:40.8 | -06:11:08.2 | K2 | 41020 | 1.00.1 | 5.20.7 | - | - | - |
| 1039 | 05:36:26.1 | -06:08:03.7 | M0 | 3807 | 20.70.1 | 903 | 0.300.03 | 0.90.1 | -7040 |
| 1086 | 05:34:58.5 | -06:00:00.5 | M0 | 42810a | 17.90.1 | 995 | 0.250.03 | 0.60.3 | 1010 |
Note. — a Objects either without distances in the Bailer-Jones et al. (2020) catalogue or with a Renormalized Unit Weight Error greater than 1.4; these are listed with the distance of 42810 pc from Kounkel et al. (2017). Spectral types were collected from the literature and are listed with references in Grant et al. (2018). Dust masses are determined using the distances listed for each target. Columns 8-10 are from deconvolved fits to the continuum images (see Section 4.1).
| Num. | [MGM2012] ID | RA | Dec | F | Major | Ratio | PA |
|---|---|---|---|---|---|---|---|
| (J2000) | (J2000) | (mJy) | (arcsec) | (∘) | |||
| 1 | 05:42:50.3 | -08.39.54.2 | 3.250.10 | - | - | - | |
| 2 | 379 | 05:41:30.3 | -08.04.42.4 | 1.20.2a | - | - | - |
| 3 | 05:40:42.8 | -07.48.40.3 | 0.70.1a | - | - | - | |
| 4 | 591 | 05:38:50.5 | -07.20.29.8 | 1.050.10 | - | - | - |
| 5 | 596 | 05:39:43.4 | -07.20.21.0 | 2.110.10 | - | - | - |
| 6 | 05:38:04.6 | -07.02.23.6 | 6.60.1 | 0.320.07 | 1.00.4 | 070 | |
| 7 | 05:38:42.1 | -07.01.52.8 | 1.50.1 | - | - | - | |
| 8 | 995 | 05:35:14.6 | -06.15.07.4 | 0.60.1 | - | - | - |
Note. — a Objects where the uvmodelfit point source and Gaussian fits did not converge in the same location, making these objects very marginally detected. For these objects we report fluxes from imfit instead.
4 Results
4.1 1.33 mm Continuum Results
Here, we discuss the continuum observations for our sample. First, we present the criteria for detection in the continuum and the continuum fluxes. Second, we compute the dust masses of the sources in our sample. Finally, we compare the dust mass distribution of our sample to Class II surveys in other star-forming regions and to the VANDAM protostellar disks in L1641.
4.1.1 Continuum Detections and Fluxes
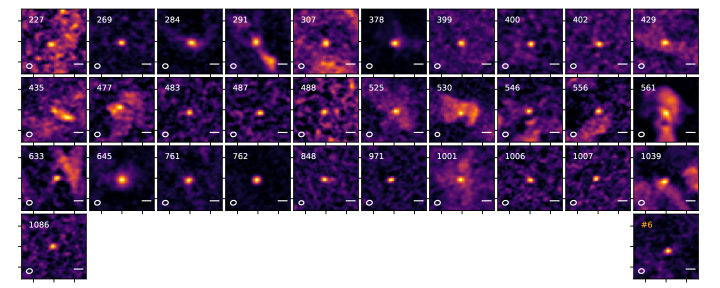
We use the CASA imfit, imstat and uvmodelfit tasks to determine continuum properties for each target in our sample. For imfit and imstat, we use a box region located at the image center (except in the case of [MGM2012] 673 which is slightly off-center to avoid a nearby source, #6 in Table 2) with a width and height of 3.8”x3.8” or 1630x1630 AU at a distance of 428 pc. We also use the average rms value of the observations of 0.12 mJy beam-1 as an input into imfit. If the Gaussian fit converges, then imfit provides, among other properties, the flux of the Gaussian fit and the peak flux. We use imstat to determine the maximum flux in the same boxed region. We consider objects detected if the maximum flux value found with imstat is greater than four times the average rms of the observations. In our sample, 89 of 101 disks are detected given this criterion (88%). We use uvmodelfit point source models to determine the source fluxes and off-sets from phase center. Additionally, we fit the sources with a Gaussian in uvmodelfit which also provides the FWHM along the major axis, the aspect ratio between the major and minor axes, and the position angle. The uvmodelfit continuum fluxes are given in Table 1 and used for the rest of the analysis. The typical of the uvmodelfit Gaussian and point source fits is 1.302. The flux uncertainties have been multiplied by the factor needed to reduce the value to 1. We show the continuum images in Figure 2. For the additional sources detected in our observations that are not in our sample (Table 2), we performed the same steps and provide the fluxes for these objects in Table 2 and show their continuum images in the bottom row of Figure 2. For two of the additionally detected objects, the uvmodelfit point source and Gaussian fits converge at slightly different locations, likely due to the low signal-to-noise, therefore we report the fluxes from imfit.
As stated in Section 3, the beam size of our observations has a major axis of 1.2-1.4 arcseconds and a minor axis of 1.04-1.05 arcseconds. We use the criteria of Cieza et al. (2019) to determine what objects are suitable for radii determinations. Specifically, we determine an object to be resolved if it: 1) has an S/N30 (where S/N is the maximum pixel value in the source box from imstat divided by the average rms), and 2) has a Gaussian flux density from uvmodelfit that is greater than the uvmodelfit point source flux plus 3 the average rms. Doing this, we find that 13 targets are suitable for radial fits and we consider these objects to be resolved. Among the 13 disks that are resolved, three are transitional disks ([MGM2012] 269, 307, and 1086). We do not resolve cavities in any of the transitional disks, which is expected given our low angular resolution. The FWHM value for the major axis, the ratio between the axes, and position angle (PA) from uvmodelfit are provided for the resolved targets in Table 1. The uncertainties on these values have been treated the same as for the flux uncertainties discussed above. The uvmodelfit documentation cautions that the size uncertainties for the Gaussian fits may be underestimated. We suggest interpreting the size information with caution, especially given our limited spatial resolution. We note that only one of the additional targets detected in the ALMA fields (Table 2) meet the Cieza et al. (2019) criteria for reporting the Gaussian fit values.

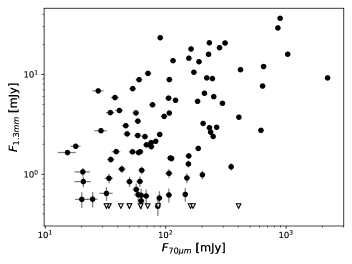
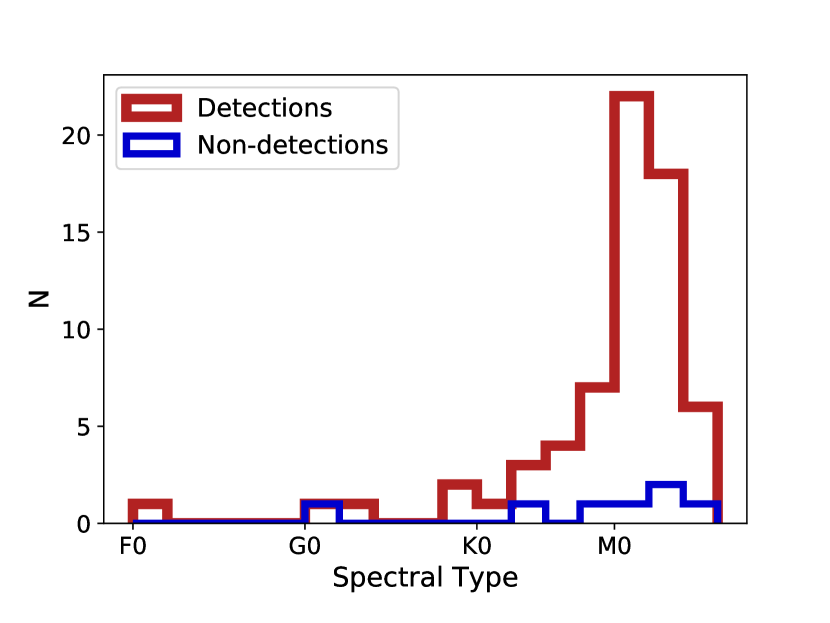
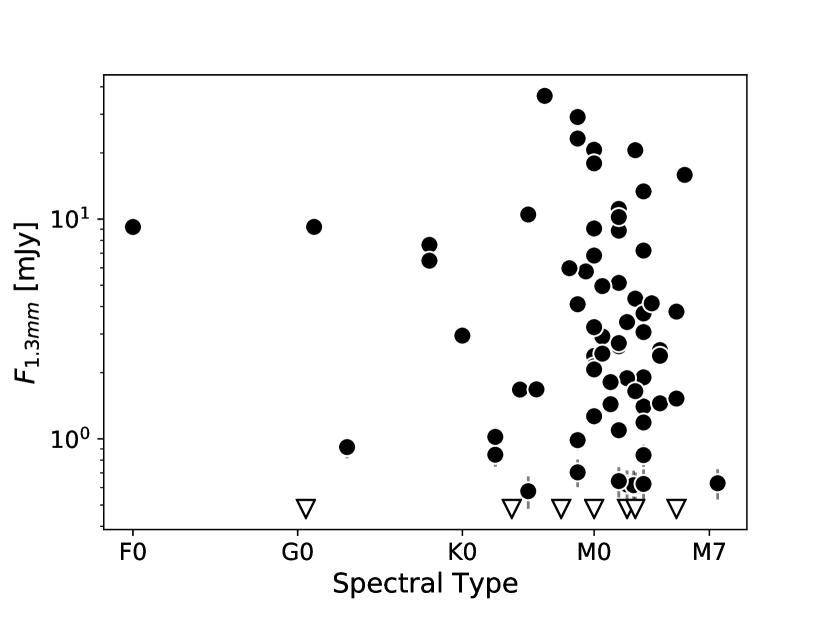
Figure 3 shows the 1.33 mm ALMA flux vs. the 70 m Herschel flux. There is a moderate correlation between the two with a Pearson coefficient of 0.45 using the scipy.stats.pearsonr function. Figure 4 shows the distribution of spectral types for continuum detections and non-detections (left). Spectral types are compiled from the literature, with over 75% coming from Hsu et al. (2012), and are provided in Table 1 (see Grant et al. 2018 for references). The most common spectral type in this sample, M1 (, Pecaut & Mamajek 2013), corresponds to a 0.4-0.5 pre-main-sequence star at 1 Myr (Baraffe et al., 2015). The L1641 spectral type distribution in Hsu et al. (2012) peaks at M4 with later spectral types incomplete due to extinction. Fang et al. (2013) finds a similar peak in the spectral types for L1641. Therefore, we are biased towards slightly earlier spectral types, and thus slightly higher stellar masses. Figure 4 also shows the flux as a function of the spectral type showing that there is no clear trend with spectral type in the L1641 ALMA observations (right).
4.1.2 Dust Masses
We determine the dust mass in the disk using the following relation that is appropriate for optically thin emission:
| (1) |
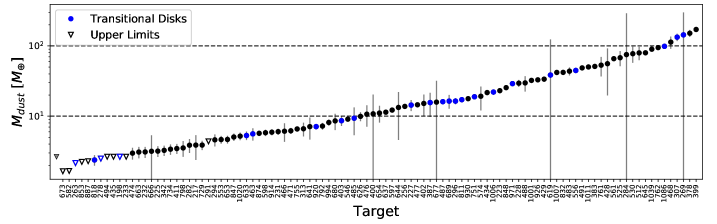
where is the distance to the source, is the flux density of the source, is the dust opacity given by GHz) cm2 g-1 at 1.33 mm (2.254 cm2 g-1, Beckwith et al. 1990 with a spectral index of 1), and is the Planck function given a uniform dust temperature of 20 K. We use Gaia distances from Bailer-Jones et al. (2020) for all sources where distances are available. For objects without distances in Bailer-Jones et al. (2020), or where the Renormalized Unit Weight Error (RUWE) is greater than 1.4, we adopt the distance to L1641 from Kounkel et al. (2017) of 42810 pc. For our undetected sources, we take an upper flux limit of 4 times the average rms (0.12 mJy beam-1) which we convert to a dust mass given the object’s distance. At 428 pc this corresponds to 2.6 using Equation 1. The median dust mass in the L1641 sample is 11.1 , including upper limits. The errors are the first and third quartiles of the distribution. Figure 5 shows the dust mass for each target.
Grant et al. (2018) used the spectral energy distributions of the L1641 targets to determine whether they were transitional (see Grant et al. 2018 for full details, but generally, the transitional disks are identified by a lack of emission in the Spitzer IRAC bands). Of the 23 transitional disks in our sample observed by ALMA, 20 are detected. The transitional disks have a median dust mass of 16.1 , including upper limits. The median of the transitional dust mass is larger than for the sample as a whole. However, the samples are statistically similar, with a two-sample Kolmogorov-Smirnov p-value of 0.72.
4.1.3 Dust Mass Comparison
In order to compare L1641 to targets of different evolutionary states and regions, we gather dust masses for the L1641 protostars in the VANDAM survey (Tobin et al., 2020), as well as Class II objects in several other star-forming regions. In Tobin et al. (2020) the dust masses for the protostellar disks are determined primarily using = 1.84 and a dust temperature of 43 K that is scaled based on the protostar bolometric luminosity. To compare to the Class II sample in this work, we redetermine the dust masses using a dust temperature of 20 K and a dust opacity of = /100 GHz, corresponding to 3.45 cm2 g-1 at the observed wavelength of 0.87 mm. We note that Tobin et al. (2020) analyzed L1641 and the Southern ISF together as one population, however, we only analyze protostellar disks below -6∘ to match our sample. We also determine the dust masses of other regions surveyed in the millimeter in the same way as our ALMA sample. These regions include ONC (1 Myr, 400 pc, Eisner et al. 2018), OMC1 (1 Myr, 400 pc, Eisner et al. 2016), OMC2 (1 Myr, 414 pc, van Terwisga et al. 2019), Lupus (1-3 Myr, 150-200 pc, Ansdell et al. 2016), Corona Australis (1-3 Myr, 160 pc, Cazzoletti et al. 2019), Ophiuchus (1 Myr, 140 pc, Cieza et al. 2019; Williams et al. 2019), Chamaeleon I (2 Myr, 160 pc, Pascucci et al. 2016), Taurus (2 Myr, 140 pc, Andrews et al. 2013), IC 348 (2-3 Myr, 310 pc, Ruíz-Rodríguez et al. 2018), Orionis (3-5 Myr, 385 pc, Ansdell et al. 2017), and Upper Scorpius (5-11 Myr, 145 pc, Barenfeld et al. 2016).
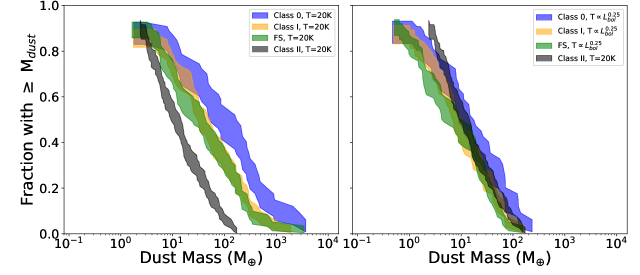
To compare our L1641 sample to other regions/surveys, we make dust mass cumulative distributions using a Kaplan-Meier estimator from the lifelines package (Davidson-Pilon et al., 2020)111https://zenodo.org/record/3629409#.XkMMaBNKhsM. This estimator takes the non-detection upper limits into account for each sample with the fit_left_censoring function for left-censored data. In Figure 6 we show our Class II sample compared to the VANDAM L1641 protostellar disks, separated by evolutionary stage, with both the recalculated dust masses (=20 K, =3.45 cm2 g-1, assuming a spectral index of 1 for our adopted dust opacity) and those with a dust temperature that depends on each source’s bolometric luminosity, as in Tobin et al. (2020). The dust masses are lower when the dust temperature is varied with the bolometric luminosity. The uniform temperature increases the dust mass by negating the inverse proportionality of dust mass and temperature. The distribution shifts to lower dust masses with increasing evolutionary classification from Class 0 to Flat Spectrum, regardless of the dust mass input parameters, although the range of protostellar disk masses is more narrow when the dust temperature is varied depending on bolometric luminosity.
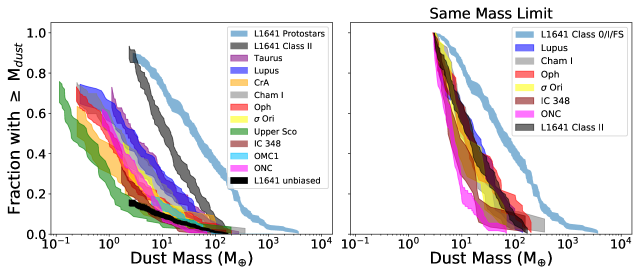
Figure 7 (left) shows the cumulative dust mass distributions for some of the comparison regions and surveys. The height of the distribution corresponds to the detection rate of the survey. Some comparison surveys give very low or negative dust masses for some upper limit targets, thus we cut the distribution at the lowest detected dust mass for readability. We note that for this plot, the L1641 Class 0, I, and Flat Spectrum sources are combined into the L1641 Protostars distribution. The oldest star-forming region that we compare to, Upper Scorpius, is the lowest mass distribution while the highest mass distribution is the young VANDAM protostellar disks in L1641. Our L1641 Class II sample is quite distinct from the rest of the Class II surveys. This is due to the high detection rate in this survey and the massive disks that we find. Both of these factors are affected by the bias in our sample selection.
In Figure 7 (left) we also show the distribution when we correct for the Herschel bias discussed in Section 2 (L1641 unbiased, black). Specifically, we take the additional 480 Class IIs that fell into the HOPS fields (but were not detected at 70 m and not included in our ALMA sample) and turn them into upper limits in the lifelines function. The moderate correlation between 70 m flux and the flux at 1.33 mm, shown in Figure 3, indicates that objects that were not detected by Herschel would have lower dust masses than our detection threshold, and therefore, would not be detected in our ALMA observations. However, as the correlation between the fluxes at 70 m and 1.33 mm is moderate, some of the sources not detected by Herschel may be able to be detected by ALMA given the same flux limit, making this a conservative estimate. Making these additional 480 objects into upper limits makes our detection rate go from 87% to 14%. This shows the importance of taking the completeness of a sample and sample biases into account. This is an estimate and a complete, unbiased survey of this region will be necessary to determine where the region as a whole lies on this distribution.
Not all surveys used for comparison have the same sensitivity limits and because many of the comparison regions are closer than L1641, this impacts what objects are detectable. To determine how this affects the results, we determine the minimum dust mass detected by each comparison survey. By choosing a minimum mass as a lower limit, we can compare detected sources above that limit and reduce differences due to sensitivity, although this does not take into account biases in the target selection. The cumulative distribution is shown in Figure 7 (right) when the lower limit is taken to be the 2.8 limit of the L1641 protostars in the VANDAM survey. This comparison shows that L1641 lies with the other regions in a tightly packed distribution, with ONC disks at lower values than the other surveys.
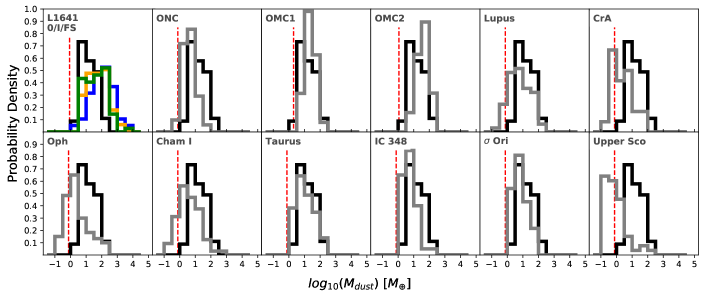
In Figure 8 we show the distribution of dust masses for the L1641 Class II sample compared to other surveyed regions. We include only the detected objects here. In general, we find that the dust mass distribution shifts to lower masses with increasing age of the sample. The L1641 Class II sample is biased towards more massive disks, indicating that a complete sample of the Class IIs in L1641 may have a distribution also shifted to lower dust masses and thus the comparisons here are limited by the detection limits in each sample. We determine the lowest detected mass in each comparison survey. The red-dashed lines in Figure 8 correspond to the lowest detected dust mass in the distribution with the lower sensitivity. Below this limit, the surveys are not comparable. We find that the dust mass distribution for the L1641 Class IIs is comparable to the distributions of OMC1, OMC2, and Taurus, while the peaks of distributions of Upper Scorpius and Corona Australis are shifted to an order of magnitude or more lower in mass.
| [MGM2012] ID | F12CO | F13CO | FC18O |
|---|---|---|---|
| (Jy km s-1) | (Jy km s-1) | (Jy km s-1) | |
| 198 | - | 0.740.03 | - |
| 227 | 0.150.03 | - | - |
| 269 | 0.610.03 | 0.090.02 | - |
| 284 | 0.820.02 | - | - |
| 291 | 1.190.03 | - | - |
| 307 | 0.370.04 | 0.210.04 | - |
| 378 | 2.930.04 | 0.620.04 | 0.150.03 |
| 399 | 1.320.06 | 0.160.02 | - |
| 400 | 0.380.03 | - | - |
| 402 | 0.520.04 | - | - |
| 428 | - | 0.180.02 | - |
| 429 | 0.600.04 | - | - |
| 435 | 0.650.05 | - | - |
| 477 | 0.260.03 | - | - |
| 483 | 0.180.02 | - | - |
| 487 | 0.20.2 | - | - |
| 488 | 0.100.02 | - | - |
| 512 | - | 0.950.03 | 0.450.03 |
| 525 | 0.670.04 | 0.260.03 | - |
| 530 | 1.580.04 | - | - |
| 546 | 0.300.03 | - | - |
| 556 | 0.290.03 | 0.240.03 | 0.080.02 |
| 561 | 2.290.03 | - | 0.130.02 |
| 633 | 0.230.02 | - | - |
| 645 | 1.660.03 | 0.260.03 | - |
| 761 | 1.010.04 | - | - |
| 762 | 1.570.03 | 0.370.03 | - |
| 848 | 0.450.04 | - | - |
| 971 | 0.410.04 | 0.200.03 | - |
| 1001 | 0.830.05 | - | - |
| 1006 | 0.180.03 | - | - |
| 1007 | 0.280.03 | - | - |
| 1039 | 0.930.04 | 0.190.02 | - |
| 1086 | 0.260.03 | - | - |
4.2 CO Gas Detections and Fluxes
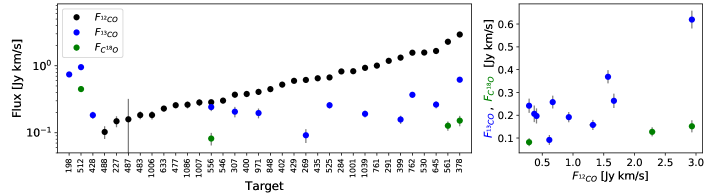
Gas fluxes in the 12CO, 13CO, and C18O line data were obtained via a Gaussian fit to a 3”3” circular region centered on the compact source of emission, if present. Because the surrounding cloud sometimes led to contamination, we primarily determine whether a source is detected upon visual inspection. Doing this, we find that 31 targets are detected in 12CO, 13 in 13CO, and 4 in C18O. Gas is the main component of the disk mass and one way to determine the gas mass is the combination of 13CO and C18O gas lines (e.g., Williams & Best 2014). In this sample only three objects have both 13CO and C18O detections, thus we do not report gas masses for this small subset. The gas fluxes are presented in Table 3.
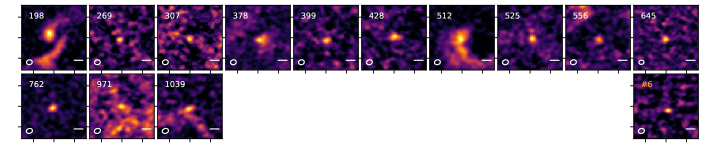
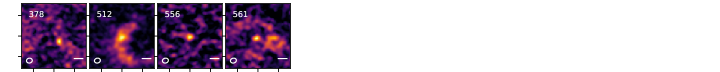
In Figure 9 we show the gas fluxes for each detected target in order of increasing 12CO flux (left). In the right panel of Figure 9, we show the 13CO and few C18O fluxes as a function of the 12CO flux. We find a Pearson correlation coefficient of 0.82 between the 12CO and 13CO flux, indicating a strong correlation. Between the 12CO and C18O flux, we find a coefficient of 0.99, indicating a strong correlation, however there are too few C18O detections to determine if this is a real correlation. We find a moderate to strong correlation coefficient of 0.56 between the 12CO and continuum flux. There is no correlation between the 13CO and C18O fluxes and the continuum flux. The zero-moment maps of the detected sources are shown in Figures 10, 11, and 12. The gas shows extended emission for many objects, therefore we do not report gas radii. For some of these objects, the extended emission may be due to cloud contamination.
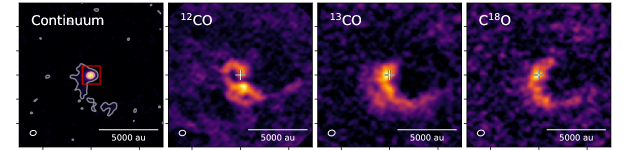
4.3 [MGM2012] 512
[MGM2012] 512 shows signs of large-scale structure in the continuum and 12CO, 13CO, and C18O data. [MGM2012] 512, an M5.50.9 (Hsu et al., 2012) object, shows a large arc extending from the disk to the south (Figure 13). In 12CO we also see a lack of emission near the disk location, perhaps due to self-absorption. In Figure 13, the red box in the continuum image is the region used to get the continuum flux reported in Table 1 which does not include the extended emission.
We determine continuum and 13CO and C18O fluxes for the extended emission. Using the same box used to determine the disk flux and a custom region drawn by eye around the extended emission (5” to the east, 9” to the south, and 6” to the west), the integrated continuum flux in those combined regions is 23.90.8 mJy. The background rms is 0.113 mJy beam-1. If we subtract the disk source (16.060.23 mJy), we get a flux of 7.80.8 mJy for the extended emission alone. In the 13CO and C18O zero-moment maps, we use similar apertures as for the continuum and find that the extended emission has a flux of 4.90.2 Jy km/s and 2.10.1 Jy km/s for the 13CO and C18O, respectively. Using Equation 1, the continuum flux results in a dust mass for the extended emission of 6532 , 50% of the disk mass. If this extended emission is envelope material, then the envelope-to-disk ratio is comparable to protostellar ratios and would put it in the Class I category found by Jørgensen et al. (2009). Of the seven VANDAM protostars that show substructure, Sheehan et al. (2020) find that four have envelope-to-disk mass ratios that are lower than what we find here. Thus, if this is envelope emission, it is still quite massive relative to the disk. However, we note that Equation 1 may not be appropriate for determining the dust mass within the arc. The disk mass may be underestimated because the disk may be optically thick, while the extended emission may have smaller grains, making the opacity used here too high, making the arc’s mass also a lower limit. In the future, radiative transfer modeling of this object may be necessary to characterize the extended emission more fully, similar to Sheehan et al. (2020). We discuss this large-scale emission and potential origins in Section 5.4.
5 Discussion
5.1 Comparing L1641 to the rest of Orion
Orion contains our nearest giant molecular cloud complex (Bally, 2008) and is the benchmark for understanding star formation in giant molecular clouds due to its proximity and stellar and environmental diversity. Orion is also likely representative of other star-forming regions in the Milky Way, while closer star-forming regions lack the massive stars that many regions contain. It contains older regions as well as very young regions, dense populations, and clusters as well as low-density regions, and it has massive stars, like those in the Trapezium, that have a great impact on the nearby disks. However, Orion is also large enough that there are populations far from irradiating massive stars. There are several (sub-)millimeter surveys of different regions in Orion. Eisner et al. (2018) find disks with low masses and truncated radii in the ONC while van Terwisga et al. (2019) find that the OMC2 region, north of the ONC with lower stellar densities, has disk populations that are indistinguishable from low-mass systems like Taurus and Lupus. L1641 is estimated to have over 1600 Class II and Class III objects, comparable in size to the ONC but in a less dense region and with a lower radiation background (Hsu et al., 2012; Pillitteri et al., 2013; Megeath et al., 2016). We find that L1641 has a dust mass distribution that lies at higher masses than the young ONC (Eisner et al., 2018) and older Ori (Ansdell et al., 2017), similar to that of OMC1 (Eisner et al., 2016), and slightly lower masses than OMC2 (van Terwisga et al., 2019). This is further evidence that the dust mass distributions depend on the age of the region, evolutionary state, and exposure to external photoevaporation and stellar densities. However, our survey does not represent L1641 as a whole due to our bias towards infrared-bright disks that lie along the L1641 filament. Therefore, a comparison to other regions should be viewed with caution.
Our L1641 sources represent some of the brightest, youngest, and most massive Class II objects in L1641 that may bridge the gap between protostars and more evolved Class II systems. Our targets lie largely along the dense L1641 filament in the protostar-rich environments that were targeted with HOPS. The protostar/pre-main-sequence star ratio decreases from clustered to isolated environments (Megeath et al., 2016) and our targets are largely in these clustered regions. Thus, it is likely that our sample is younger compared to a sample of disks that were either formed in isolation or have dispersed from higher density regions. The Orion VANDAM survey (Tobin et al., 2020) targeted protostars in Orion with VLA and ALMA. The L1641 protostars can then be compared to the more evolved Class IIs, with no environmental factors complicating the comparison.
The L1641 median dust mass (11.1 ) is lower than the median of the VANDAM protostellar disk sources in L1641 (85.1, 33.5, and 33.3 for the Class 0, I, and Flat Spectrum sources, respectively, using =20 K and =3.45 cm2 g-1). Using a luminosity dependent dust mass () as in Tobin et al. (2020), these median dust masses are 11.2, 7.4, and 7.5, for the Class 0, I, and Flat Spectrum sources, respectively, making the Class I and Flat Spectrum median dust masses lower than, but within the errors of, the Class II objects in this sample. This indicates that although the L1641 sample presented here may be biased towards massive disks, they still tend to have lower masses than their evolutionary predecessors, given a uniform temperature. This is also found for disks in Ophiuchus (Williams et al., 2019). However, for their evolutionary class, the L1641 Class II disks in our sample are quite massive with 27 out of 101 objects (27%) having dust masses equal to or greater than the 30 , the estimated amount needed to build the solar system (Weidenschilling, 1977). We note that the Class IIs in our sample and the protostars in the VANDAM survey were part of the HOPS observations and were originally identified by Megeath et al. (2012) based on spectral indices and photometry out to 24 m (see Megeath et al. 2012 for full details), therefore disk mass was not a factor in the classification. Additionally, these masses may be underestimated given that the disk emission is optically thick (e.g., Ribas et al. 2020; Macias et al. 2021).
Several ALMA surveys of younger systems, Class 0/I and embedded systems, suggest that the dust mass reservoir decreases significantly as the systems evolve to the Class II stage. Tychoniec et al. (2020) compares a survey of Class 0 and Class I disks in Perseus to exoplanet solid masses and determines that a planet formation efficiency of 15% is needed to form the observed planetary systems in the Class 0 phase and that efficiency increases to 30% in the Class I phase. Following this trend, it may be too difficult for planet formation to begin in the Class II phase. Grant et al. (2018) found that L1641 showed signs of significant dust evolution based on the Herschel fluxes in combination with irradiated accretion disk models (D’Alessio et al., 1998, 2006). Despite dust evolution, and likely dust growth, the L1641 dust masses are still high. In fact, the median dust mass of this sample, 11.1 , is within the range for the Class 0 and I disks in Perseus (Tychoniec et al. 2020, see their Figure 6). Therefore, it may be feasible for the massive disks in L1641 to still have the mass reservoir needed to form giant planets, even at a lower efficiency.
5.2 Transitional Disks in L1641
Transitional disks were initially thought to be the intermediate stage between Class II disks and the less massive Class III disks. The ALMA surveys of Lupus by Ansdell et al. (2016) and van der Marel et al. (2018) showed evidence that the transitional disk population is bright at millimeter wavelengths, indicating massive disks. van der Marel et al. (2018) suggest that there may be a different evolutionary pathway for these massive transitional disks: massive disks form rings due to planets and/or condensation fronts and large cavities form from those rings. Less massive disks may go through a similar process, just on smaller scales, but without the mass necessary to form giant planets, or may alternatively have another evolutionary process. We find that the transitional disks in this sample have a median dust mass higher than the sample as a whole (16.1 vs. 11.1 ), However, the samples are statistically similar. van der Marel et al. (2018) emphasize the need to account for the dust cavity when converting from millimeter flux to dust mass, as not doing so can lead to overestimates. Therefore, the masses derived here for the transitional disks may be overestimated. van der Marel et al. (2018) also find that four transitional disks in their sample would not be classified as such from their spectral energy distributions. The transitional disks in this sample were identified in Grant et al. (2018) using the spectral energy distributions, thus there are likely additional transitional disks in this sample. Surveys such as DSHARP (Andrews et al., 2018) have shown how ubiquitous annular substructures are in disks and likely many of the disks in this region would show substructure at high angular resolution. The transitional disks referred to in this work have significant dips in their spectral energy distributions, which may indicate that these gaps or cavities are radially large to manifest in such a dip. Future observations of L1641 with higher angular resolution will therefore be important to characterize the gaps in these disks and to search for additional transitional disks with smaller gaps and/or cavities.
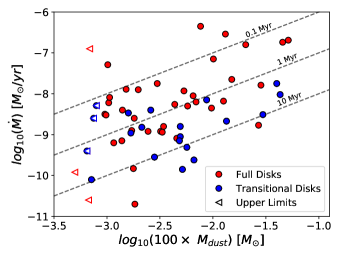
5.3 The Disk Mass-Accretion Rate Relationship
Recent ALMA surveys have provided dust masses for large samples of protoplanetary disks which have been combined with accretion rate surveys to constrain the disk mass-accretion rate relationship (e.g., Manara et al. 2016; Ansdell et al. 2017; Rosotti et al. 2017; Mulders et al. 2017; Lodato et al. 2017; Manara et al. 2020). For viscously evolving disks, the disk mass and accretion rate () are related (Hartmann et al., 1998). This relationship can then be used to determine the viscous lifetime of the disk, (e.g., Jones et al. 2012; Manara et al. 2016; Sellek et al. 2020). Figure 14 shows the disk mass (assuming a gas-to-dust mass ratio of 100) vs. accretion rate for our sample. The 58 accretion rates for our sample are obtained from Fang et al. (2009, 2013) and Kim et al. (2016). The full sample has a correlation (in log-log space) of 0.44 and the transitional disks are remarkably similar with a correlation of 0.42. Therefore, while there is considerable scatter, there is a moderate correlation between and in our sample. The dashed lines correspond to the viscous lifetimes of the disks given different ratios of . Overall, the viscous timescales for this sample are consistent with the age of the region (1.5 Myr), however with a large scatter. The scatter that we find is not consistent with a single from viscous evolution. There are several explanations for this scatter, including accretion variability, distance uncertainties (which would affect both and , however different distances were used to obtain these two quantities), the effects of photoevaporation and planet formation on accretion, and potentially, the effects of infall from any remaining envelope material. Additionally, if the gas-to-dust ratio deviates from 100, the disk mass will be different, affecting the derived disk lifetime.
5.4 Structure Around [MGM2012] 512
Here, we discuss potential origins of the large-scale structure that we observe coming off of the disk of [MGM2012] 512. These include emission from an envelope/accretion streamer or outflow cavity, or perturbations by an unseen companion. This arc is similar to the streamer that is feeding material from the local environment onto Per-emb-2 (Pineda et al., 2020), [BHB2007] 1 (Alves et al., 2020), SU Aur (Ginski et al., 2021), and, on a smaller scale, HL Tau (Yen et al., 2019). However, what is unique about the emission around [MGM2012] 512 is that it is detected in the continuum. This means that the dust grains are at least 100 m, larger than would be expected in the interstellar medium. If this emission is an accretion streamer, this could mean that the dust grains are able to grow as the material infalls onto the envelope and/or disk.
This arc is qualitatively similar to the hydrodynamic modeling of Dullemond et al. (2019) and Kuffmeier et al. (2017, 2020) wherein low mass cloud fragments interact with a young stellar object. In some cases this cloud material may be accreted or may fly-by and interact only if the impact parameter is small enough. If this is the case, the accretion of this arc material may lead to an accretion outburst. It is also qualitatively similar to the dusty non-ideal magnetohydrodynamic model of Lebreuilly et al. (2020). These authors find that dust grains settle efficiently, even in the pseudo-disk of inflowing streamers, agreeing with the presence of large grains that we observe in our ALMA observations.
One potential source of the spiral formation could be due to an interaction with a nearby stellar system, however, no close companion to [MGM2012] 512 is visible in the 2MASS images. One object (2MASS 05401404-0731262) is 50 arcseconds to the north. If 2MASS 05401404-0731262 is at the same distance as [MGM2012] 512 (410 pc) then it would be 20,500 AU away, likely too far to be interacting. Additionally, there could be an unseen companion that is either perturbing from the outside or is being ejected from the system and disrupting the material as it moves outward from the system.
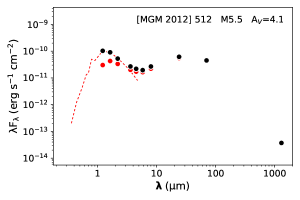
The spectral energy distribution of this target (Figure 15, with auxiliary data from the Two Micron All-Sky Survey, Spitzer IRAC and MIPS, and Herschel PACS, Skrutskie et al. 2006; Megeath et al. 2012; Grant et al. 2018) shows photospheric emission out to 3.6 m, after which it rises to have a large excess at mid- and far-IR wavelengths. This could be indicative of an envelope around this object, however we cannot rule out cloud contamination. In particular, this spectral energy distribution resembles the late Class I model in Whitney et al. (2003) (Figure 3 in that work), indicating that this may be a protostar that is viewed pole-on, with the near-infrared data tracing the photosphere and the mid- and far-infrared tracing the combined disk and envelope emission. Although this is considered a young star with a disk (as opposed to a protostar) in Megeath et al. (2012), Caratti o Garatti et al. (2012) classifies this target as being a Class I object using the spectral index between 2.2 and 24 m. These authors classify objects as Class I if the spectral index is 0.3 and this object (ID 12 in their sample) has an index of 0.33. Megeath et al. (2012) apply the criteria of Kryukova et al. (2012), and require a spectral index greater than -0.3 between 4.5 and 24 m and between 3.6 and 4.5 m. Due to the more negative slope between 3.6 and 4.5 m for this source, Megeath et al. (2012) classified this source as a pre-main-sequence star with a disk. One issue is that the 2.2-24 m slope used by Caratti o Garatti et al. (2012) is sensitive to the effects of foreground extinction. Nevertheless, both criteria show that this source is very close to the dividing lines used to distinguish between protostars and pre-main-sequence stars with disks. Special cases, such as protostars with face-on inclinations, or transitional phases between protostars and pre-main-sequence stars, may give discrepant results using these criteria. This object clearly shows interesting behavior that is outside of the scope of this work. We leave additional analysis to follow-up efforts.
6 Summary and Conclusions
We present an ALMA survey of protoplanetary disks in Lynds 1641. The 101 disks studied here represent some of the far-infrared-brightest Class II objects in the region, making it a valuable sample to compare to other star-forming regions and to the protostellar sample that co-exists in L1641. These observations are taken in Band 6 which covers the continuum at 1.33 mm and the 12CO, 13CO, and C18O J=2-1 lines. Our sample is biased by the requirement that these objects were observed and detected at 70 m as part of the Herschel Orion Protostar Survey. This survey focused on detecting far-infrared-bright protostars and our Class II sample was serendipitously observed. This indicates that our sample is biased towards the brightest disks that lie along the dense L1641 filament. Our results include the following:
-
1.
We detect 89/101 (88%) in continuum at the 4 level. We use the continuum fluxes to get dust masses or upper limits for all 101 disks in our sample. In the CO gas data, we detect 31 in 12CO, 13 in 13CO, and 4 in C18O.
-
2.
A fraction (27%) of our sample has a dust mass equal to or greater than the minimum mass solar nebula dust mass value of 30 . We find a median dust mass of 11.1 for the L1641 Class II disks.
-
3.
The Orion VANDAM survey (Tobin et al., 2020) allows for comparison between our Class II sample to Class 0/I/Flat Spectrum protostars in the same region. We find that the median dust mass of our sample is lower than those found for the protostars. Thus, L1641 Class II objects follow the trend of having lower dust masses than their younger counterparts, even with our bias to far-infrared-bright disks.
-
4.
We observe 23 transitional disks (identified by their spectral energy distributions in Grant et al. 2018), 20 of which are detected in the continuum, which have a median dust mass of 16.1 . Of the 36 disks detected in the gas, 10 are transitional disks.
-
5.
The disk mass-accretion rate relationship in our sample is largely consistent with viscous accretion timescales, however, there is a large scatter in the relationship. This may be due to accretion variability, systematics, and/or photoevaporation and disk evolution effects.
-
6.
One object, [MGM2012] 512, shows large-scale structure in the dust continuum and all three gas lines. If this material is remnant envelope material, then the envelope-to-disk dust mass ratio is 50%, on par with protostellar systems. This could be an accretion streamer connecting the local environment and the disk. The fact that this structure is detected in the continuum indicates relatively massive dust grains.
This survey introduces a sample of protoplanetary disks at a crucial stage of evolution. A complete ALMA survey of L1641 in the future will help determine how this subset fits into the region as a whole. Paired with the complete sample of protostellar disks in L1641 in the Orion VANDAM survey, this region has great potential to test disk evolution theories.
References
- Alves et al. (2020) Alves, F. O., Cleeves, L. I., Girart, J. M., et al. 2020, ApJ, 904, L6
- Andrews et al. (2013) Andrews, S. M., Rosenfeld, K. A., Kraus, A. L., & Wilner, D. J. 2013, ApJ, 771, 129
- Andrews et al. (2018) Andrews, S. M., Huang, J., Pérez, L. M., et al. 2018, ApJ, 869, L41
- Ansdell et al. (2017) Ansdell, M., Williams, J. P., Manara, C. F., et al. 2017, AJ, 153, 240
- Ansdell et al. (2016) Ansdell, M., Williams, J. P., van der Marel, N., et al. 2016, ApJ, 828, 46
- Ansdell et al. (2020) Ansdell, M., Haworth, T. J., Williams, J. P., et al. 2020, AJ, 160, 248
- Bailer-Jones et al. (2020) Bailer-Jones, C. A. L., Rybizki, J., Fouesneau, M., Demleitner, M., & Andrae, R. 2020, arXiv e-prints, arXiv:2012.05220
- Bally (2008) Bally, J. 2008, Overview of the Orion Complex, ed. B. Reipurth, Vol. 4, 459
- Baraffe et al. (2015) Baraffe, I., Homeier, D., Allard, F., & Chabrier, G. 2015, A&A, 577, A42
- Barenfeld et al. (2016) Barenfeld, S. A., Carpenter, J. M., Ricci, L., & Isella, A. 2016, ApJ, 827, 142
- Beckwith et al. (1990) Beckwith, S. V. W., Sargent, A. I., Chini, R. S., & Guesten, R. 1990, AJ, 99, 924
- Caratti o Garatti et al. (2012) Caratti o Garatti, A., Garcia Lopez, R., Antoniucci, S., et al. 2012, A&A, 538, A64
- Cazzoletti et al. (2019) Cazzoletti, P., Manara, C. F., Baobab Liu, H., et al. 2019, A&A, 626, A11
- Cieza et al. (2019) Cieza, L. A., Ruíz-Rodríguez, D., Hales, A., et al. 2019, MNRAS, 482, 698
- D’Alessio et al. (2006) D’Alessio, P., Calvet, N., Hartmann, L., Franco-Hernández, R., & Servín, H. 2006, ApJ, 638, 314
- D’Alessio et al. (1998) D’Alessio, P., Cantö, J., Calvet, N., & Lizano, S. 1998, ApJ, 500, 411
- Davidson-Pilon et al. (2020) Davidson-Pilon, C., Kalderstam, J., Zivich, P., et al. 2020, doi:10.5281/zenodo.3629409
- Dullemond et al. (2019) Dullemond, C. P., Küffmeier, M., Goicovic, F., et al. 2019, A&A, 628, A20
- Eisner et al. (2016) Eisner, J. A., Bally, J. M., Ginsburg, A., & Sheehan, P. D. 2016, ApJ, 826, 16
- Eisner et al. (2018) Eisner, J. A., Arce, H. G., Ballering, N. P., et al. 2018, ApJ, 860, 77
- Fang et al. (2013) Fang, M., Kim, J. S., van Boekel, R., et al. 2013, ApJS, 207, 5
- Fang et al. (2009) Fang, M., van Boekel, R., Wang, W., et al. 2009, A&A, 504, 461
- Fischer et al. (2010) Fischer, W. J., Megeath, S. T., Ali, B., et al. 2010, A&A, 518, L122
- Fischer et al. (2017) Fischer, W. J., Megeath, S. T., Furlan, E., et al. 2017, ApJ, 840, 69
- Fischer et al. (2020) —. 2020, arXiv e-prints, arXiv:2011.03552
- Furlan et al. (2016) Furlan, E., Fischer, W. J., Ali, B., et al. 2016, ApJS, 224, 5
- Ginski et al. (2021) Ginski, C., Facchini, S., Huang, J., et al. 2021, ApJ, 908, L25
- Grant et al. (2018) Grant, S. L., Espaillat, C. C., Megeath, S. T., et al. 2018, ApJ, 863, 13
- Großschedl et al. (2018) Großschedl, J. E., Alves, J., Meingast, S., et al. 2018, A&A, 619, A106
- Hartmann et al. (1998) Hartmann, L., Calvet, N., Gullbring, E., & D’Alessio, P. 1998, ApJ, 495, 385
- Hernández et al. (2007) Hernández, J., Hartmann, L., Megeath, T., et al. 2007, ApJ, 662, 1067
- Hsu et al. (2012) Hsu, W.-H., Hartmann, L., Allen, L., et al. 2012, ApJ, 752, 59
- Jones et al. (2012) Jones, M. G., Pringle, J. E., & Alexander, R. D. 2012, MNRAS, 419, 925
- Jørgensen et al. (2009) Jørgensen, J. K., van Dishoeck, E. F., Visser, R., et al. 2009, A&A, 507, 861
- Kenyon & Hartmann (1995) Kenyon, S. J., & Hartmann, L. 1995, ApJS, 101, 117
- Kim et al. (2016) Kim, K. H., Watson, D. M., Manoj, P., et al. 2016, ApJS, 226, 8
- Kounkel et al. (2016) Kounkel, M., Megeath, S. T., Poteet, C. A., Fischer, W. J., & Hartmann, L. 2016, ApJ, 821, 52
- Kounkel et al. (2017) Kounkel, M., Hartmann, L., Loinard, L., et al. 2017, ApJ, 834, 142
- Kryukova et al. (2012) Kryukova, E., Megeath, S. T., Gutermuth, R. A., et al. 2012, AJ, 144, 31
- Kuffmeier et al. (2020) Kuffmeier, M., Goicovic, F. G., & Dullemond, C. P. 2020, A&A, 633, A3
- Kuffmeier et al. (2017) Kuffmeier, M., Haugbølle, T., & Nordlund, Å. 2017, ApJ, 846, 7
- Lebreuilly et al. (2020) Lebreuilly, U., Commerçon, B., & Laibe, G. 2020, A&A, 641, A112
- Lodato et al. (2017) Lodato, G., Scardoni, C. E., Manara, C. F., & Testi, L. 2017, MNRAS, 472, 4700
- Macias et al. (2021) Macias, E., Guerra-Alvarado, O., Carrasco-Gonzalez, C., et al. 2021, arXiv e-prints, arXiv:2102.04648
- Manara et al. (2016) Manara, C. F., Rosotti, G., Testi, L., et al. 2016, A&A, 591, L3
- Manara et al. (2020) Manara, C. F., Natta, A., Rosotti, G. P., et al. 2020, A&A, 639, A58
- Manoj et al. (2013) Manoj, P., Watson, D. M., Neufeld, D. A., et al. 2013, ApJ, 763, 83
- Megeath et al. (2012) Megeath, S. T., Gutermuth, R., Muzerolle, J., et al. 2012, AJ, 144, 192
- Megeath et al. (2016) —. 2016, AJ, 151, 5
- Mulders et al. (2017) Mulders, G. D., Pascucci, I., Manara, C. F., et al. 2017, ApJ, 847, 31
- Pascucci et al. (2016) Pascucci, I., Testi, L., Herczeg, G. J., et al. 2016, ApJ, 831, 125
- Pecaut & Mamajek (2013) Pecaut, M. J., & Mamajek, E. E. 2013, ApJS, 208, 9
- Pillitteri et al. (2013) Pillitteri, I., Wolk, S. J., Megeath, S. T., et al. 2013, ApJ, 768, 99
- Pineda et al. (2020) Pineda, J. E., Segura-Cox, D., Caselli, P., et al. 2020, Nature Astronomy, arXiv:2007.13430
- Poglitsch et al. (2010) Poglitsch, A., Waelkens, C., Geis, N., et al. 2010, A&A, 518, L2
- Ribas et al. (2015) Ribas, Á., Bouy, H., & Merín, B. 2015, A&A, 576, A52
- Ribas et al. (2020) Ribas, Á., Espaillat, C. C., Macías, E., & Sarro, L. M. 2020, A&A, 642, A171
- Rosotti et al. (2017) Rosotti, G. P., Clarke, C. J., Manara, C. F., & Facchini, S. 2017, MNRAS, 468, 1631
- Ruíz-Rodríguez et al. (2018) Ruíz-Rodríguez, D., Cieza, L. A., Williams, J. P., et al. 2018, MNRAS, 478, 3674
- Sellek et al. (2020) Sellek, A. D., Booth, R. A., & Clarke, C. J. 2020, MNRAS, 498, 2845
- Sheehan et al. (2020) Sheehan, P. D., Tobin, J. J., Federman, S., Megeath, S. T., & Looney, L. W. 2020, ApJ, 902, 141
- Skrutskie et al. (2006) Skrutskie, M. F., Cutri, R. M., Stiening, R., et al. 2006, AJ, 131, 1163
- Stutz & Gould (2016) Stutz, A. M., & Gould, A. 2016, A&A, 590, A2
- Stutz & Kainulainen (2015) Stutz, A. M., & Kainulainen, J. 2015, A&A, 577, L6
- Stutz et al. (2013) Stutz, A. M., Tobin, J. J., Stanke, T., et al. 2013, ApJ, 767, 36
- Tobin et al. (2020) Tobin, J. J., Sheehan, P. D., Megeath, S. T., et al. 2020, ApJ, 890, 130
- Tychoniec et al. (2020) Tychoniec, Ł., Manara, C. F., Rosotti, G. P., et al. 2020, arXiv e-prints, arXiv:2006.02812
- van der Marel et al. (2018) van der Marel, N., Williams, J. P., Ansdell, M., et al. 2018, ApJ, 854, 177
- van Terwisga et al. (2019) van Terwisga, S. E., Hacar, A., & van Dishoeck, E. F. 2019, A&A, 628, A85
- van Terwisga et al. (2020) van Terwisga, S. E., van Dishoeck, E. F., Mann, R. K., et al. 2020, A&A, 640, A27
- Weidenschilling (1977) Weidenschilling, S. J. 1977, Ap&SS, 51, 153
- Whitney et al. (2003) Whitney, B. A., Wood, K., Bjorkman, J. E., & Cohen, M. 2003, ApJ, 598, 1079
- Williams & Best (2014) Williams, J. P., & Best, W. M. J. 2014, ApJ, 788, 59
- Williams et al. (2019) Williams, J. P., Cieza, L., Hales, A., et al. 2019, ApJ, 875, L9
- Yen et al. (2019) Yen, H.-W., Gu, P.-G., Hirano, N., et al. 2019, ApJ, 880, 69