Detecting informative higher-order interactions in statistically validated hypergraphs
Abstract
Recent empirical evidence has shown that in many real-world systems, successfully represented as networks, interactions are not limited to dyads, but often involve three or more agents at a time. These data are better described by hypergraphs, where hyperlinks encode higher-order interactions among a group of nodes. In spite of the large number of works on networks, highlighting informative hyperlinks in hypergraphs obtained from real world data is still an open problem. Here we propose an analytic approach to filter hypergraphs by identifying those hyperlinks that are over-expressed with respect to a random null hypothesis, and represent the most relevant higher-order connections. We apply our method to a class of synthetic benchmarks and to several datasets. For all cases, the method highlights hyperlinks that are more informative than those extracted with pairwise approaches. Our method provides a first way to obtain statistically validated hypergraphs, separating informative connections from redundant and noisy ones.
Introduction
Over the last years, advances in technology have made available a deluge of new data on biological and socio-technical systems, which have helped scientists build more efficient and precise data-informed models of the world we live in. Most of these data sources, from online social networks to the world trade web and the human brain have been fruitfully represented as graphs, where nodes describe the units of the systems, and links encode their pairwise interactions [1]. Yet, prompted by new empirical evidence, it is now clear that in most real-world systems interactions are not limited to pairs, but often involve three or more agents at the same time [2]. In our brain, neurons communicate through complex signals involving multiple partners at the same time [3, 4]. In nature, species co-exist and compete following an intricate web of relationships which can not be understood by considering pairwise interactions only [5]. In science, most advances are achieved by combining the expertise of multiple individuals in the same team [6].
To fully keep into account the higher-order organization of real networks, new mathematical frameworks have been proposed, rapidly becoming widespread in the last few years. Computational techniques from algebraic topology have made possible to extract the “shape” of the data, investigating the topological features associated to the existence of higher-order interactions from social networks to the brain [7, 8]. In parallel, traditional network measures have been generalised to account for the existence of non-pairwise interactions. This includes new proposals for centrality measures [9, 10], community structure [11], and simplicial closure, that is a generalisation of clustering coefficient to higher-order interactions [12]. The temporal evolution of higher-order social networks has been investigated, showing the presence of non-trivial correlations and burstiness at all orders of interactions [13]. Besides, explicitly considering the higher-order structure of real-world systems has led to the discovery of new collective phenomena and dynamical behavior, from social contagion [14, 15] and human cooperation [16] to models of diffusion [17, 11] and synchronization [18, 19, 20, 21].
Among the several frameworks, hypergraphs, collections of nodes and hyperlinks encoding interactions among any number of units, represent the most natural generalisation of traditional networked structures to explicitly consider systems beyond pairwise interactions [2, 22]. However, mapping data and mathematical frameworks presents us with some new challenges. For instance, for some systems higher-order interactions might be difficult to observe, or only be recorded as a collection of pairwise data. To overcome this limitation, recent work has developed a bayesian framework to reconstruct higher-order connections from simple pairwise interactions following a principle of parsimony [23].
In spite of the explosion of new methods to analyse systems interacting at higher orders, a filtering technique working for hypergraphs is not yet available. Filtering techniques are a relatively recent addition to network analysis. Extracting the filtered elements of a network allows to focus on relevant connections that are highly representative of the system, discarding all the redundant and/or noisy information carried by those nodes and connections that can be described by an appropriate statistical null hypothesis (for example the configuration model of the system). Different names have been proposed so far to address this approach. The first name used was backbone of a network [24]. In this case the stress was on the links of nodes that were not compatible with a null hypothesis of equally distributed strength. Another proposal was statistically validated network [25]. A statistically validated network is a subgraph of an original graph where the selected links are those associated with a pair node activity which is not compatible with the one estimated under a random null hypothesis taking into account the heterogeneity of activity of nodes. Statistically based filtering of real networks has been investigated in studies focusing on classic examples of networks such as airports [24] and actor/movies [25] networks, trading decisions of investors [26, 27, 28, 29], mobile phone calls of large set of users [30, 31], financial credit transactions occurring in an Interbank market [32], intraday lead-lag relationships of returns of financial assets traded in major financial markets [33], the Japanese credit market [34], international trade networks [35], social networks of news consumption [36] and rating networks of e-commerce platforms [37]. The procedure of filtering nodes and links in a real network is not unique both in terms of methodology and in terms of null hypothesis. Examples of different approaches have been recently proposed in the literature [38, 39, 40, 41, 42]. Several of these techniques have been reviewed and discussed in [43, 44, 45, 46].
All works available so far have performed network filtering at the level of pair of nodes. In this work we introduce a new methodology filtering complex systems with interactions of various possible orders. Our approach explicitly takes into account the heterogeneity of the system and therefore it is able to highlight over-expression of hyperlinks of different size and weight. In particular, by mapping each layer of hyperlinks of a specific size in a bipartite system, our method identifies those hyperlinks that are over-expressed with respect to a random null hypothesis. To show the informativeness of our new filtering method, through a synthetic benchmark we show that our approach detects real hyperlinks with higher sensitivity and accuracy than other traditional filtering techniques. We then apply our method to three different empirical social datasets. We show that the results obtained with our analysis are able to highlight information that is not obtainable neither from the unfiltered hypergraphs nor with a pairwise statistically validated analysis of the same system.
Results
Traditional network filtering approaches, such as the disparity filter [24] or the SVN approach [25], are not suited for higher-order data, since by design they mistreat all the information on connections beyond pairwise interactions. This implies that cliques of size highlighted with a pairwise approach might not correspond to genuinely statistically validated hyperlinks, possibly producing both false positive and false negative. Consider, for example, the collaboration network between three authors that have strongly interacted in pairs in their research but have never published a paper altogether. The pairwise analysis might detect a clique of 3 nodes whereas the hyperlink with 3 nodes would not exist, thus generating a false positive. Similarly, false negatives might emerge in the case of an over-expressed hyperlink of size that is not matched by a clique of validated pairwise links. Figure 1a illustrates the different possibilities of pairwise validation and hyperlink validation for .
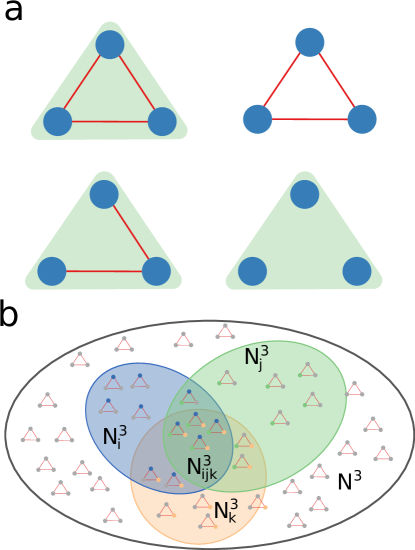
Here we propose an analytical filtering technique designed to detect over-expressed hyperlinks of various size. Our method works with weighted hypergraphs, where groups of nodes are connected through interactions (hyperlinks) of any size that are not limited to pairwise links. In particular, we model the weight of an hyperlink composed by nodes as the intersection of sets, where each set represents all the hyperlinks in which each node is active (see Figure 1b for a schematic illustration of the method for ). We are interested in evaluating if the weight of a hyperlink is compatible with a null model in which all nodes are selecting randomly their partners. By using the approach developed in Ref. [47], we are able to solve this problem analytically (see Methods), associating a p-value to each hyperlink. Our null model preserves the heterogeneity of degree of all nodes. This is particularly relevant in the case of hypergraphs whose higher-order degree distribution is strongly heterogeneous. This an ubiquitous characteristic of real systems. Finally, the Statistically Validated Hypergraph (SVH) is obtained by putting together all hyperlinks at different sizes that are validated against our null hypothesis.
.1 Benchmark
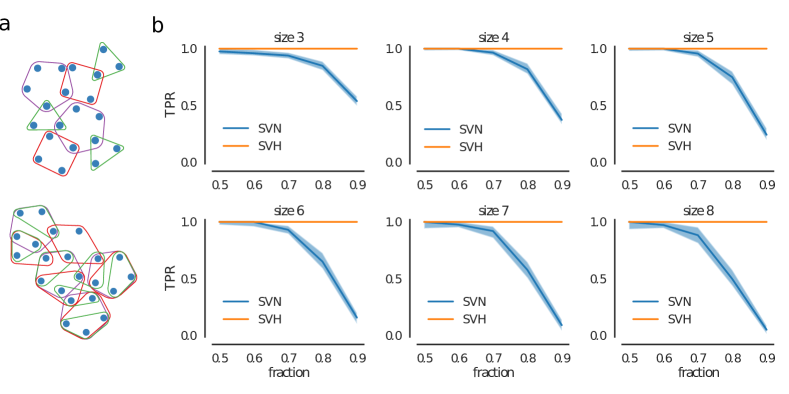
We generate hypergraphs that we will use as benchmark in the following way. We select nodes and a set of sizes for hyperlinks, . For each size , we select a fraction of the nodes, split them in groups of size and connect each group with hyperlinks, which in the bipartite representation of hypergraphs correspond to common neighbors in the set B. Thus, our benchmark is defined by the parameters . Here we fix , but the following results are not affected by the specific values of and and hold also for larger values of . On the benchmark, we look at the groups of different size that are identified by the SVH (i.e. by our new methodology) and SVN (i.e. inferred by pairwise statistically validated links) approaches when changes. We choose the SVN as a pairwise approach because it is specifically tailored to work with bipartite networks, that represent the lowest order representation of hypergraphs. In our comparison, for SVH we select the groups of size defined by validated hyperlinks, whereas for SVN we extract the maximal cliques of size from the validated projected network. The parameter affects the probability that a node participates in interactions at different sizes (Figure 2a), thus the higher the more challenging it is to correctly identify all over-expressed hyperlinks. Indeed, for large each node is active in groups of different sizes and a filtering method that works only at the pairwise level is likely to produce over-expressed cliques in the SVNs that overestimate the real size of an over-expressed hyperlink because pairwise analysis can merge groups of nodes of different size. The true positive rate (TPR) quantifies the fraction of true groups that the two methods are able to identify. To show the performances of the two methods we compute TPR= of validated hyperlinks at different sizes as a function of the parameter (Figure 2b). For each value of and each size we generate 1000 realizations of the benchmark and take the median of TPR on all realizations. While the SVH approach is always able to correctly identify all groups of any size without detecting any false negative no matter the value of , the SVN starts to fail when grows. Specifically, the rate of false negatives detected by the SVN approach increases with because SVN tends to merge together groups of different sizes in which the same nodes are active.
To complement this result we also look at the False Discovery Rate (FDR), defined as , that quantifies the fraction of false positives on the total number of detected groups (See Figure S1 of the Supplementary Information (SI)). By investigating the benchmark, we find that SVH never detects a False Positive, while the SVN has different performances depending on the value of . The behavior observed with the pairwise SVN approach worsens its FDR when increases because SVN detects groups that are obtained through the aggregation of over-expressed pairwise links even if they are not directly interacting at the considered size.
Our benchmark can be perturbed by adding some noise, that simulates random fluctuations or errors in the collection of the data. Specifically, in our simulations we include an additional parameter that represent the probability that each of the interactions that define a group is randomly assigned to another group of the same size. We study the performance of the two methods as a function of the two parameters and we report the results observed in Figures S2-S3 of the SI. The matrices in the Figures represent the median of the difference in TPR (Figure S2) and FDR (Figure S3) between SVH and SVN as a function of both and . The first column of each matrix represents the difference of the curves plotted in Figures 2 and S1. Although the introduction of noise affects the performance of both methods, for all values of and of the noise parameter the SVH always performs better than the estimation of hyperlinks through the detection of pairwise over-expressed relations with SVN.
.2 US Supreme Court
In this section we apply the SVH methodology to a dataset that records all votes expressed by the justices of the Supreme Court in the US from 1946 to 2019 case by case [48]. This dataset has been extensively investigated in political science to understand and try to predict the patterns of justices’ decision by looking at their political alignment during the period in which they were active [49, 50]. Similar research ideas have started to percolate also the complex systems’ community, as shown by a recent work that proposes a link prediction model to forecast the evolution of the citation network spanned by cases ruled by the twin European institution, the Court of Justice [51].
We start noting that such a system naturally fits the framework of hypergraphs, with hyperlinks of size representing groups of justices that voted in a case in the same way. As the Supreme Court is made of 9 justices, can vary from 1 to 9 (in the case of unanimous decisions). In the investigated period we observe 38 different justices judging 8915 cases. We find that the most frequent decisions are the unanimous ones (2600), while all the other possible grouping of justices are present with at least 1000 entries (See Table S1 and Figure S4a of the SI). Moreover, we find that the median of the number of decisions that a justice has taken in a group of size increases with the size of the group (Figure S4b of the SI), signaling that justices are more likely to vote as part of a large majority than in a small minority. This evidence suggests that an approach that does not take into account interactions beyond the pairwise level is suboptimal to identify groups of justices that show over-expression of voting together, since each justice typically voted in groups of different sizes. In fact, this observed behavior is analog to the behavior seen in the benchmark when we set a large value of . Indeed, in this system when we use both SVH and SVN to detect over-expressed groups at different size (Figure S4c), we find that SVN is unable to find groups at smaller sizes because it is impossible to discriminate groups different from the majority and minority when a pairwise analysis is performed. Moreover, justices vote in the same way in a large number of cases (all the unanimous or almost unanimous ones). Even if we remove the unanimous votes, the situation does not change (See Figure S4d of the SI). Conversely, the SVH detects a much larger number of over-expressed groups at all possible sizes of interaction. A summary of the numbers of validated groups at different values of is given in Table S1 of the SI.
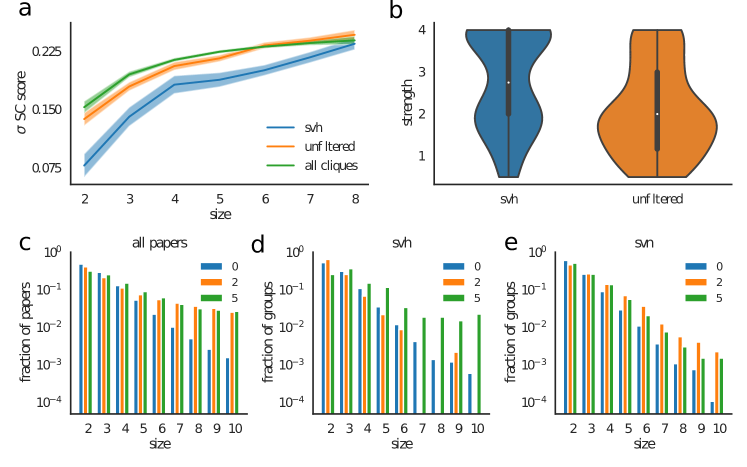
An analysis of groups detected by the SVH provides informative insights on the activity of justices. Indeed, we can characterize each justice with the Segal-Cover (SC) score [49], that represents the level of judicial liberalism of each justice throughout her activity in the Supreme Court. There is a general SC score and several other scores focusing on specialized categories of legal decisions. When we compute the standard deviation of the SC score for the groups highlighted by the SVH and we compare it with that computed (i) on all the groups of justices observed to vote together at least once and (ii) on all possible groups of justices (to extract the latter we only consider justices that were contemporarily active in the Supreme Court), we find that the groups of justices detected by the SVH have the lowest diversity in liberalism SC score (Figure 3a). This means that, with respect to their level of liberalism the groups of justices of size that present an over-expressed number of joint votes were more similar among them than the set of possible groups of justices. It is worth to note that the SC score is computed exclusively looking at the individual activity of justices case by case, while with the SVH method we are validating groups exclusively looking at their common decisions.
However, the SC liberalism score reduces to a mono-dimensional quantity a piece of information that can be more nuanced. Indeed, the Supreme Court has jurisdiction on cases of different legal areas, ranging from civil rights and criminal procedures to economic decisions. For this reason, the SC score is specialized in a number of distinct scores that capture the attitude of a justice on the different areas [48]. Table S2 reports the justices’ scores for the three main areas of criminal procedures, civil rights and economic. As the area of each case is reported in our data, we are able to separately validate groups of justices for the different legal areas. This gives additional insights on the activity of justices. On one side, we find cases as that of justice Antonin Scalia, that was consistently voting with a conservative attitude in all areas, and all the validated groups of size in which he is validated are always composed by other conservative justices. On the other side we find more nuanced cases as that of justice Byron White, that was appointed by US president John F. Kennedy. White was progressive on economic issues, and indeed he is present in validated groups of size 3 with two other progressive justices, Thurgood Marshall and William Brennan. Conversely, he had a much more conservative attitude on issues related to civil rights and criminal procedures, and this is detected by our approach: in cases related to these areas he is validated in groups of size 3 with the conservative justices Warren Burger, William Rehnquist and John Marshall Harlan. A summary of the hyperlinks validated in the SVHs of the different areas is reported in Tables S3, S4 and S5.
.3 High School data
In this section we detect the over-expressed hyperlinks of social interactions observed between students during their stay at a French high school [52]. This data is part of the SocioPatterns project, that aimed at integrating social network analysis traditionally performed on surveys with actual contact data tracked through radio-frequency identification sensors. The contacts are detected and stored when pairs of students are physically located nearby at a given time . Recording was occuring with a temporal resolution of 20. The data contains also information about self-reported contacts and friendship and Facebook networks that were present among students. These data have already been analysed to understand the overlap between network and contact data [52]. Here we focus on the detection of higher-order interactions from the tracked contacts. In fact, it is important to track the presence of higher-order interactions in a social system as it has an impact on the dynamical processes that can occur on top of it [14, 16, 20]. In order to build a hypergraph, we extract the higher-order interactions from the raw data. To do so, for each time step we build the graph of interactions occurring at time and we extract the maximal cliques of any size. Indeed, if students are tracked in a fully connected clique at time , it means that they had a collective interaction at that time. We find that on top of pairwise interactions the network contains hyperlinks that involve up to 5 students interacting at the same time (Figure S5a). After extracting the over-expressed hyperlinks with both SVH and SVN, we find that, as in the case of US justices, the two methods have a different distribution of validated groups (Figur S5b). Specifically, SVH detects much more groups than SVN at lower size but signicantly less at higher size. We verify that most of the groups detected by SVN at higher size are spurious (Figure S5c), which means that with SVN we validate groups of size even if the corresponding students were never simultaneously interacting altogether in a group of that size. In this system, the cliques detected by the SVN do not represent a reliable proxy of the over-expressed hyperlinks.
In order to understand the nature of the hyperlinks validated by the SVH, we analyze the validated groups using the available metadata. We use the contact diaries that were filled by the students at the end of a specific day of data collection. This additional information stores contacts that were self reported by students themselves and can be seen as robust information about the system, since it contains interactions that were strong enough to be remembered by the students. We use the diaries to extract cliques at different sizes of interacting students, and we compare this information with the hyperlinks present in the unfiltered dataset and with those validated with the SVH approach. To maintain consistency across the two datasets, we drop contact data that do not contain students that filled the diaries surveys and drop from the diaries contacts that were not tracked by the sensors. Furthermore, we limit contact data to that recorded in the same day of the diaries survey. We find that the SVH is very precise in retrieving the self reported cliques (it contains less ”spurious“ hyperlinks that do not correspond to diaries cliques) but it is not highly accurate (i.e. it contains only a smaller fraction of diaries cliques) (Table S6 of the SI).
The reported contacts come with a discrete weight provided by the students themselves that represents the duration of each reported interaction ((i) at most 5 min if , (ii) between 5 and 15 min if , (iii) between 15 min and 1 h if , (iv) more than 1 h if ). For each clique in the contact diaries that is also detected in the unfiltered hypergraph or in the SVH we compute the overall strength by averaging the strengths of the links that constitute it. We find that the distribution of the average strength of SVH hyperlinks is higher than the one of unfiltered groups (Figure 3b), showing that the SVH hyperlinks detect the most persistent groups. The difference in the distribution of average strength is statistically significant according to a non-parametric Kruskal-Wallis test with score and . It is worth to stress that the hyperlinks present in the SVH do not necessarily correspond exclusively to the interactions with the highest weight. Indeed, we find that hyperlinks of the same weight can be present or absent in the SVH, depending on the heterogenous activity of the involved nodes (Figure S6). In fact, for less active nodes hyperlinks with a small weight are more likely to be validated, while hyperlinks that involve more active nodes need a higher weight in order to be validated.
.4 Physics authors
In this section we analyse the hypergraph of scientific collaborations among Physics authors. To do so, we investigate the APS dataset, that contains authorship data on papers published on journals of the APS group from 1893 to 2015. This dataset has already been extensively investigated to characterize structural and dynamical properties of scientific collaborations, with respect to both authors’ careers and topics’ evolution [53, 54, 55]. Here we match the papers present in APS dataset with the Web of Science database using the doi and identify the authors with the ID curated by WoS to maximize disambiguation, which is a well known issue that affects the accuracy of the dataset. Since we are interested in interactions among authors, we limit our investigation to papers with at maximum number of 10 authors to avoid larger collaborations for which direct interaction between all authors are less likely. From the APS dataset we retrieve the PACS of each paper. This allows us to split the set of papers in 10 subfields of physics by using the highest hierarchical level of PACS classification. We focus on the papers published from 1985 onwards as from this year reporting one of more PACS per paper became compulsory. This leaves us with 269,887 papers and 114,856 authors.
First, we look at the distribution of papers of different size for each subfield (Figure 3c). Here we focus on the categories of General Physics (PACS hierarchical integer number 0), Nuclear Physics (PACS number 2) and Physics of Gases and Plasma (PACS number 5) but the CDFs for all PACS categories are shown in Figure S7 of the SI . As expected, we find that PACS have different distributions of team size that highlight different publication habits of the researchers publishing in different PACS categories. In our selection, we find that the subfield with higher percentages of smaller groups is General Physics. On the other side, in Nuclear Physics and Physics of Gases and Plasma there are higher percentages of larger research groups (in Figure 3c all percentages sum to 1 because we are cutting from the distributions all papers that are written by groups larger than 10).
We then apply to the dataset both SVH and SVN methodologies, and extract the distribution of the validated groups with the two methods (Figure 3d and Figure 3e respectively). At first sight, we find that the distributions of the groups validated with the SVH show relevant differences with the original ones, while with the SVN we obtain similar trends. Specifically, we find that for Nuclear Physics the fraction of over-expressed groups in the SVH goes rapidly to 0 when the size increases, showing an opposite trend if compared to the distribution of the number of authors per paper. This means that the size of most of the SVH validated groups for this PACS is relatively small, in spite of the fact that there are many papers written by larger numbers of authors. In the case of over-expressed groups of the SVN, the distribution for this category of PACS is similar to that of Figure 3c. Conversely, PACS 5 (Physics of Gases and Plasma) maintains a similar profile across the different distributions.
In order to understand this finding we looked, for each size, at the relationship across PACS between the fraction of validated groups and the average number of papers written by a group of that size (Figures S8 for SVH and Figures S9 for SVN). We find that in the case of SVH these two quantities are strongly correlated, with Pearson coefficient ranging from 0.84 to 0.99 and being always statistically significant. This means that with the SVH we validate more groups of authors when these groups are writing on average more papers together. This is a result showing the reliability of SVH results. It is interesting to note that PACS 5 has among the highest average numbers of papers per group at higher sizes, making it clear why the SVH validates more groups at these sizes. On the other hand, in Nuclear Physics most (for some sizes even all) of the detected groups at higher sizes wrote only one paper altogether, so the number of validated groups is much lower. Conversely, with the SVN approach the fraction of detected groups is not related to the average activity of groups of that size (in the scatter plots of Figure S9, all correlations between the fraction of detected groups and teh average number of papers per group are not statistically different from zero). Due to the fact that with the pairwise SVN approach all groups are obtained through aggregation of pairwise over-expressed links, the details of higher-order interactions are missed.
Summing up, the SVH approach gives us an insight that is not evident in the raw data or with methods that are limited to the characterization of pairwise interactions: we find that research areas like Nuclear Physics and Physics of Gases and Plasma are similar with respect to the distribution of papers that are written by research groups of different sizes, but the research groups in the two PACS have different publication habits. In Physics of Gases and Plasma it is more likely that exactly the same group publishes more papers together (and with SVH we identify the groups that do so in a significant way), while in Nuclear Physics most of the medium size collaborations produce a paper just in a single occurrence.
Discussion
In the last decade, a deluge of new data on biological and socio-technical systems has become available, showing the importance of filtering techniques able to highlight potentially informative network structures. Recently, hypergraphs have emerged as a fundamental tool to map real-world interacting systems. Yet, extracting the relevant interactions from higher-order data is still an open problem. In this work we proposed Statistically Validated Hypergraphs (SVH) as a method to identify the most meaningful relations between entities of a higher-order system, reducing the complexity carried by noisy and/or spurious interactions.
Our method is able to quantify the probability that an observed hyperlink is compatible with a process in which all involved nodes were randomly selecting their counterparts, reducing the detection of false negatives and false positives occurring with basic pairwise filters. Besides, the null model that we developed naturally reproduces the heterogeneous activity of each node, a crucial feature that overcomes the limitations of a threshold based filtering approach. We have showcased the application of our method to three different systems: the US Supreme Court, the social connections of students interacting in a French high school and the scientific collaborations of Physics authors publishing in journal of the American Physical Society. In all cases, statistically validated groups carry more coherent information than that observed in the unfiltered hypergraphs. For the US Supreme Court, groups of justices with more similar SC profiles are highlighted. For the students of a French high school, groups of students characterized by an intense social interaction are detected, and for the authors of physics papers, the analysis of the SVH unveils a difference in publication habits across subfields that is not evident when looking at the complete system.
A foreseeable development of our methodology is a generalization capable to take into account the temporal dynamics leading to the emergence of a hypergraph, similarly to what was proposed in Ref. [41] for pairwise interactions only. Taken together, we believe that our method, separating meaningful connections from less informative node interactions, is a powerful tool capable to capture the different nuances of higher-order interacting systems.
I Methods
In a SVH, each hyperlink of size represents a group of nodes that is over-expressed by comparing its occurrence with that of a null hypothesis that reproduces random group interactions. To extract the p-value of a hyperlink of size , we select a subset of the hypergraph considering only hyperlinks of size , and we compute the weighted degree of each node with respect to this subgraph, . We then extract the weight of the hyperlink connecting all nodes, and the total number of hyperlinks of size , . We can then assess the probability of being compatible with a null model where each of the nodes in the group randomly selects its hyperlinks from the whole set of hyperlinks of size . To illustrate the method we start with the simplest case, , with three nodes , and being active respectively in , and interactions of size 3 (Figure 1b). The probability of having the three nodes interacting together times under a random null model is written as
| (1) |
where is the hypergeometric distribution that computes the probability of having an intersection of size between two sets and of size and given total elements.
The probability in Eq. 1 is obtained through the convolution of two instances of the hypergeometric distribution. Indeed, to compute we start from the probability of having an intersection of size between nodes and and multiply it with the probability of having an intersection of size between node and the intersection set of size between and . This product is then summed over all possible values of , i.e. all possible intersections between and which are compatible with the observed number of interactions between all the three nodes. Starting from Eq. 1 we then compute a p-value for the hyperlink connecting , and through the survival function,
| (2) |
The p-value provides the probability of observing or more occurrences of the hyperlink composed by . Once all the p-values for all observed hyperlinks are computed, they are tested against a threshold of statistical significance . In all the results presented in this paper we use . The statistical test is performed by using the control for the False Discovery Rate [56] as a multiple hypothesis test correction. The total number of test considered is which is the number of all possible triplets of the elements that are active in hyperlinks of size 3. Thus, when applying the control for the False Discovery Rate method we start from a Bonferroni threshold computed as .
For an hyperlink of generic size , Eq. 1 becomes
| (3) |
As in the case with 3 nodes, the main idea of Eq. 3 is to write the overall probability of having an intersection of size between the activity of nodes as the product of multiple probabilities of hierarchical pairwise intersections, summed over all the possible configurations compatible with . The specific order of the nodes in the hierarchical intersections does not affect the value of . From Eq. 3 we extract a p-value as in Eq. 2. The number of tests to consider when correcting for multiple testing is . In our numerical computation we use the approach developed in Ref. [47]. The approach is analytic but require heavy combinatorial computation, and it might be of difficult application when the hyperlinks are of size larger than about fifteen nodes. The code to use our method is available upon request and will be uploaded on a public repository when the paper is published.
References
- Boccaletti et al. [Fervier 2006] S. Boccaletti, V. Latora, Y. Moreno, M. Chavez, and D-U. Hwang. Complex networks : Structure and dynamics. Phys. Rep., 424(4-5):175–308, Fervier 2006.
- Battiston et al. [2020] Federico Battiston, Giulia Cencetti, Iacopo Iacopini, Vito Latora, Maxime Lucas, Alice Patania, Jean-Gabriel Young, and Giovanni Petri. Networks beyond pairwise interactions: structure and dynamics. Physics Reports, 2020.
- Petri et al. [2014] Giovanni Petri, Paul Expert, Federico Turkheimer, Robin Carhart-Harris, David Nutt, Peter J Hellyer, and Francesco Vaccarino. Homological scaffolds of brain functional networks. J. R. Soc. Interface, 11(101):20140873, 2014.
- Giusti et al. [2016] Chad Giusti, Robert Ghrist, and Danielle S Bassett. Two’s company, three (or more) is a simplex. J. Comput. Neurosci., 41(1):1–14, 2016.
- Grilli et al. [2017] Jacopo Grilli, György Barabás, Matthew J Michalska-Smith, and Stefano Allesina. Higher-order interactions stabilize dynamics in competitive network models. Nature, 548(7666):210, 2017.
- Patania et al. [2017a] Alice Patania, Giovanni Petri, and Francesco Vaccarino. The shape of collaborations. EPJ Data Sci., 6(1):18, 2017a.
- Patania et al. [2017b] Alice Patania, Francesco Vaccarino, and Giovanni Petri. Topological analysis of data. EPJ Data Sci., 6(1):7, 2017b.
- Sizemore et al. [2019] Ann E Sizemore, Jennifer E Phillips-Cremins, Robert Ghrist, and Danielle S Bassett. The importance of the whole: Topological data analysis for the network neuroscientist. Netw. Neurosci., 3(3):656–673, 2019.
- Estrada and Rodríguez-Velázquez [2006] Ernesto Estrada and Juan A Rodríguez-Velázquez. Subgraph centrality and clustering in complex hyper-networks. Phys. A, 364:581–594, 2006.
- Benson [2019] Austin R Benson. Three hypergraph eigenvector centralities. SIAM J. Math. Data Sci., 1(2):293–312, 2019.
- Carletti et al. [2020] Timoteo Carletti, Federico Battiston, Giulia Cencetti, and Duccio Fanelli. Random walks on hypergraphs. Phys. Rev. E, 101(2):022308, 2020.
- Benson et al. [2018] Austin R Benson, Rediet Abebe, Michael T Schaub, Ali Jadbabaie, and Jon Kleinberg. Simplicial closure and higher-order link prediction. Proc. Natl. Acad. Sci. U.S.A., 115(48):E11221–E11230, 2018.
- Cencetti et al. [2021] Giulia Cencetti, Federico Battiston, Bruno Lepri, and Márton Karsai. Temporal properties of higher-order interactions in social networks. Scientific Reports, 11:7028, 2021.
- Iacopini et al. [2019] Iacopo Iacopini, Giovanni Petri, Alain Barrat, and Vito Latora. Simplicial models of social contagion. Nat. Commun., 10(1):2485, 2019.
- Neuhäuser et al. [2020] Leonie Neuhäuser, Michael T Schaub, Andrew Mellor, and Renaud Lambiotte. Opinion dynamics with multi-body interactions. arXiv preprint arXiv:2004.00901, 2020.
- Alvarez-Rodriguez et al. [2021] Unai Alvarez-Rodriguez, Federico Battiston, Guilherme Ferraz de Arruda, Yamir Moreno, Matjaž Perc, and Vito Latora. Evolutionary dynamics of higher-order interactions in social networks. Nature Human Behaviour, pages 1–10, 2021.
- Schaub et al. [2020] Michael T Schaub, Austin R Benson, Paul Horn, Gabor Lippner, and Ali Jadbabaie. Random walks on simplicial complexes and the normalized Hodge Laplacian. SIAM Rev., 62(2):353–391, 2020.
- Skardal and Arenas [2020] Per Sebastian Skardal and Alex Arenas. Higher-order interactions in complex networks of phase oscillators promote abrupt synchronization switching. Communications Physics, 3(1), 2020.
- Millán et al. [2020] Ana P Millán, Joaquín J Torres, and Ginestra Bianconi. Explosive higher-order kuramoto dynamics on simplicial complexes. Physical Review Letters, 124(21):218301, 2020.
- Lucas et al. [2020] Maxime Lucas, Giulia Cencetti, and Federico Battiston. A multi-order Laplacian for synchronization in higher-order networks. Physical Review Research, 2(3):033410, 2020.
- Gambuzza et al. [2021] LV Gambuzza, F Di Patti, L Gallo, S Lepri, M Romance, R Criado, M Frasca, V Latora, and S Boccaletti. Stability of synchronization in simplicial complexes. Nature communications, 12(1):1–13, 2021.
- Berge [1973] Claude Berge. Graphs and hypergraphs. 1973.
- Young et al. [2020] Jean-Gabriel Young, Giovanni Petri, and Tiago P Peixoto. Hypergraph reconstruction from network data. arXiv preprint arXiv:2008.04948, 2020.
- Serrano et al. [2009] M Ángeles Serrano, Marián Boguná, and Alessandro Vespignani. Extracting the multiscale backbone of complex weighted networks. Proceedings of the national academy of sciences, 106(16):6483–6488, 2009.
- Tumminello et al. [2011] Michele Tumminello, Salvatore Micciche, Fabrizio Lillo, Jyrki Piilo, and Rosario N Mantegna. Statistically validated networks in bipartite complex systems. PloS one, 6(3):e17994, 2011.
- Tumminello et al. [2012] Michele Tumminello, Fabrizio Lillo, Jyrki Piilo, and Rosario N Mantegna. Identification of clusters of investors from their real trading activity in a financial market. New Journal of Physics, 14(1):013041, 2012.
- Musciotto et al. [2016] Federico Musciotto, Luca Marotta, Salvatore Miccichè, Jyrki Piilo, and Rosario N Mantegna. Patterns of trading profiles at the nordic stock exchange. a correlation-based approach. Chaos, Solitons & Fractals, 88:267–278, 2016.
- Musciotto et al. [2018] Federico Musciotto, Luca Marotta, Jyrki Piilo, and Rosario N Mantegna. Long-term ecology of investors in a financial market. Palgrave Communications, 4(1):1–12, 2018.
- Challet et al. [2018] Damien Challet, Rémy Chicheportiche, Mehdi Lallouache, and Serge Kassibrakis. Statistically validated lead-lag networks and inventory prediction in the foreign exchange market. Advances in Complex Systems, 21(08):1850019, 2018.
- Li et al. [2014a] Ming-Xia Li, Vasyl Palchykov, Zhi-Qiang Jiang, Kimmo Kaski, János Kertész, Salvatore Micciche, Michele Tumminello, Wei-Xing Zhou, and Rosario N Mantegna. Statistically validated mobile communication networks: the evolution of motifs in european and chinese data. New Journal of Physics, 16(8):083038, 2014a.
- Li et al. [2014b] Ming-Xia Li, Zhi-Qiang Jiang, Wen-Jie Xie, Salvatore Miccichè, Michele Tumminello, Wei-Xing Zhou, and Rosario N Mantegna. A comparative analysis of the statistical properties of large mobile phone calling networks. Scientific reports, 4(1):1–12, 2014b.
- Hatzopoulos et al. [2015] Vasilis Hatzopoulos, Giulia Iori, Rosario N Mantegna, Salvatore Miccichè, and Michele Tumminello. Quantifying preferential trading in the e-mid interbank market. Quantitative Finance, 15(4):693–710, 2015.
- Curme et al. [2015] Chester Curme, Michele Tumminello, Rosario N Mantegna, H Eugene Stanley, and Dror Y Kenett. Emergence of statistically validated financial intraday lead-lag relationships. Quantitative Finance, 15(8):1375–1386, 2015.
- Marotta et al. [2016] Luca Marotta, Salvatore Miccichè, Yoshi Fujiwara, Hiroshi Iyetomi, Hideaki Aoyama, Mauro Gallegati, and Rosario N Mantegna. Backbone of credit relationships in the japanese credit market. EPJ Data Science, 5:1–14, 2016.
- Straka et al. [2017] Mika J Straka, Guido Caldarelli, and Fabio Saracco. Grand canonical validation of the bipartite international trade network. Phys. Rev. E, 96(2):022306, 2017.
- Becatti et al. [2019a] Carolina Becatti, Guido Caldarelli, Renaud Lambiotte, and Fabio Saracco. Extracting significant signal of news consumption from social networks: the case of twitter in italian political elections. Palgrave Communications, 5(1):1–16, 2019a.
- Becatti et al. [2019b] Carolina Becatti, Guido Caldarelli, and Fabio Saracco. Entropy-based randomization of rating networks. Physical Review E, 99(2):022306, 2019b.
- Gemmetto et al. [2017] Valerio Gemmetto, Alessio Cardillo, and Diego Garlaschelli. Irreducible network backbones: unbiased graph filtering via maximum entropy. arXiv preprint arXiv:1706.00230, 2017.
- Coscia and Neffke [2017] Michele Coscia and Frank MH Neffke. Network backboning with noisy data. In 2017 IEEE 33rd International Conference on Data Engineering (ICDE), pages 425–436. IEEE, 2017.
- Saracco et al. [2017] Fabio Saracco, Mika J Straka, Riccardo Di Clemente, Andrea Gabrielli, Guido Caldarelli, and Tiziano Squartini. Inferring monopartite projections of bipartite networks: an entropy-based approach. New Journal of Physics, 19(5):053022, 2017.
- Kobayashi et al. [2019] Teruyoshi Kobayashi, Taro Takaguchi, and Alain Barrat. The structured backbone of temporal social ties. Nature communications, 10(1):1–11, 2019.
- Marcaccioli and Livan [2019] Riccardo Marcaccioli and Giacomo Livan. A pólya urn approach to information filtering in complex networks. Nature communications, 10(1):1–10, 2019.
- Iori and Mantegna [2018] Giulia Iori and Rosario N Mantegna. Empirical analyses of networks in finance. In Handbook of Computational Economics, volume 4, pages 637–685. Elsevier, 2018.
- Straka et al. [2018] Mika J Straka, Guido Caldarelli, Tiziano Squartini, and Fabio Saracco. From ecology to finance (and back?): A review on entropy-based null models for the analysis of bipartite networks. Journal of Statistical Physics, 173(3):1252–1285, 2018.
- Miccichè and Mantegna [2019] Salvatore Miccichè and Rosario N Mantegna. A primer on statistically validated networks. Computational Social Science and Complex Systems, 203:91, 2019.
- Cimini et al. [2019] Giulio Cimini, Tiziano Squartini, Fabio Saracco, Diego Garlaschelli, Andrea Gabrielli, and Guido Caldarelli. The statistical physics of real-world networks. Nature Reviews Physics, 1(1):58–71, 2019.
- Wang et al. [2015] Minghui Wang, Yongzhong Zhao, and Bin Zhang. Efficient test and visualization of multi-set intersections. Scientific Reports, (5):16923, 2015.
- Epstein et al. [2019] Lee Epstein, Thomas G. Walker, Nancy Staudtand Scott Hendrickson, and Jason Roberts. The U.S. Supreme Court Justices Database, 2019. URL http://epstein.wustl.edu/research/justicesdata.html.
- Segal and Cover [1989] Jeffrey A. Segal and Albert D. Cover. Ideological values and the votes of u.s. supreme court justices. The American Political Science Review, 83(2):557–565, 1989.
- Epstein [1994] Lee Epstein. The Supreme Court compendium : data, decisions, and developments / Lee Epstein … [et al.]. Congressional Quarterly Inc., 1994.
- Mones et al. [2021] E. Mones, P. Sapieżyński, S. Thordal, H. P. Olsen, and S. Lehmann. Emergence of network effects and predictability in the judicial system. Scientific Reports, 11:2045–2322, 2021.
- Mastrandrea et al. [2015] Rossana Mastrandrea, Julie Fournet, and Alain Barrat. Contact patterns in a high school: A comparison between data collected using wearable sensors, contact diaries and friendship surveys. PLOS ONE, 10(9):1–26, 2015.
- Radicchi and Castellano [2011] Filippo Radicchi and Claudio Castellano. Rescaling citations of publications in physics. Phys. Rev. E, 83:046116, 2011.
- Battiston et al. [2019] Federico Battiston, Federico Musciotto, Dashun Wang, Barabási Albert-László, Szell Michael, and Sinatra Roberta. Taking census of physics. Nature Reviews Physics, 1(1):89–97, 2019.
- Chinazzi et al. [2019] Matteo Chinazzi, Bruno Gonçalves, Qian Zhang, and Alessandro Vespignani. Mapping the physics research space: a machine learning approach. EPJ Data Science, 1(8), 2019.
- Benjamini and Hochberg [1995] Yoav Benjamini and Yosef Hochberg. Controlling the false discovery rate: A practical and powerful approach to multiple testing. J R Statist Soc B, 57(1):289–300, 1995.