Panchromatic HST/WFC3 Imaging Studies of Young, Rapidly Evolving Planetary Nebulae.
I. NGC 6302
Abstract
We present the results of a comprehensive, near-UV-to-near-IR Hubble Space Telescope WFC3 imaging study of the young planetary nebula (PN) NGC 6302, the archetype of the class of extreme bi-lobed, pinched-waist PNe that are rich in dust and molecular gas. The new WFC3 emission-line image suite clearly defines the dusty toroidal equatorial structure that bisects NGC 6302’s polar lobes, and the fine structures (clumps, knots, and filaments) within the lobes. The most striking aspect of the new WFC3 image suite is the bright, S-shaped 1.64 m [Fe ii] emission that traces the southern interior of the east lobe rim and the northern interior of the west lobe rim, in point-symmetric fashion. We interpret this [Fe ii] emitting region as a zone of shocks caused by ongoing, fast (100 km s-1), collimated, off-axis winds from NGC 6302’s central star(s). The [Fe ii] emission and a zone of dusty, N- and S-rich clumps near the nebular symmetry axis form wedge-shaped structures on opposite sides of the core, with boundaries marked by sharp azimuthal ionization gradients. Comparison of our new images with earlier HST/WFC3 imaging reveals that the object previously identified as NGC 6302’s central star is a foreground field star. Shell-like inner lobe features may instead pinpoint the obscured central star’s actual position within the nebula’s dusty central torus. The juxtaposition of structures revealed in this HST/WFC3 imaging study of NGC 6302 presents a daunting challenge for models of the origin and evolution of bipolar PNe.
1 Introduction
Planetary nebulae (PNe) are the near-endpoints of stellar evolution for intermediate-mass (1–8 ) stars. Each PN provides a snapshot of the brief ( yr duration) stage in which the outflowing, dusty circumstellar envelope of an asymptotic giant branch (AGB) star is ionized by its newly unveiled core, itself a future white dwarf (e.g., Schoenberner, 1986). PNe thereby offer our last and arguably best look at the products of intermediate-mass stellar nucleosynthesis, just before that material is incorporated into the ISM (Kwitter et al., 2014).
Though best known as photogenic, K optical emission line sources, a subset of PNe — those with pinched-waist, bipolar structures — retain significant masses of cold ( K), dense ( cm-3) molecular gas and dust that is irradiated, shocked, and continuously reshaped from within by UV and winds from hot (30–200 kK) central stars (e.g., Huggins et al., 1996; Kastner et al., 1996; Bachiller et al., 1997; Huggins et al., 2005; Bublitz et al., 2019, and refs. therein). As the descendants of relatively massive progenitor stars (Corradi & Schwarz, 1995), many of these dusty, molecule-rich, bipolar PNe are also the youngest and most morphologically and dynamically extreme objects (Kastner et al., 1996; Balick & Frank, 2002; Sahai et al., 2011).
An effective way to study PN-shaping stellar winds, and the rapid evolution of these winds, is to observe their impacts on the slower but denser post-AGB material downstream. Classical PN shaping theory implicitly or explicitly posits that the driving force of the active winds from the present-day central stars of PNe is isotropic radiative momentum (Kwok et al., 1978). However, the highly non-isotropic lobes of bipolar PNe must be formed in some other manner, via the ram pressure in collimated winds or jets of some sort (e.g., Bujarrabal et al., 2001; Akashi & Soker, 2018; Balick et al., 2019). Evidence has steadily accumulated that such collimated outflows are ultimately due to the influence of an (interacting) binary companion to the mass-losing central star (e.g., Jones & Boffin, 2017; De Marco & Izzard, 2017, and references therein), with processes such as common envelope (CE) evolution (e.g., Livio et al., 1979; Soker, 2004; García-Segura et al., 2018; Zou et al., 2020) or jets associated with a companion star’s accretion disk (e.g., Morris, 1987; Soker & Livio, 1994; Chen et al., 2017) providing the mass launching and collimation mechanisms.
Narrow-band imaging with the Hubble Space Telescope (HST) has long played a fundamental role in advancing our understanding of these and other potential PN shaping mechanisms (e.g., Sahai & Trauger, 1998). As HST neared the end of its third decade in operation, however, the community of PNe researchers had yet to take full advantage of the potential of its most capable imaging instrument, the Wide Field Camera 3 (WFC3). This changed in HST Cycle 27, when we used HST/WFC3 to obtain the first comprehensive, contemporaneous sets of near-UV through near-IR (243 nm to 1.6 m) emission-line images of two especially structurally rich PNe, NGC 7027 and NGC 6302 (see Kastner et al., 2020, for an initial overview of these HST/WFC3 imaging surveys). As we demonstrate in this paper, the broad, contemporaneous wavelength coverage of these WFC3 image suites yields full-nebula emission line image overlays and line ratio maps at 0.1” resolution that are free from distortions and artifacts caused by nebular proper motions or cross-instrument calibration uncertainties (among other potential pitfalls).
The subject of this paper, NGC 6302 (the Butterfly), is the archetype of the class of
extreme bi-lobed, pinched-waist PNe that are rich in dust and
molecular gas. As of this
writing, NGC 6302 had been featured or mentioned in more than 750 papers,
according to simbad. Its bipolar lobes are very bright and rich in emission lines,
spanning a remarkably broad range of ionization states, from the far-UV through the mid-IR (e.g., Casassus et al., 2000; Feibelman, 2001; Molster et al., 2001; Groves et al., 2002). Indeed,
NGC 6302 has long served as an exemplar for studies of
high-excitation PNe (e.g., Aller et al., 1981), with estimates of its central star
temperature ranging from 220–250 kK (Casassus et al., 2000; Wright et al., 2011) to as high as 400 kK
(Ashley & Hyland, 1988). Expansion
parallax distance estimates for NGC 6302 range from 0.81 kpc (Lago et al., 2019) to 1.17 kpc
(Meaburn et al., 2008), with a recent determination, adopted here, of 1.030.27 kpc (Gómez-Gordillo et al., 2020).
This proximity makes NGC 6302 a tempting subject for high-resolution
imaging studies aimed at understanding the origin and evolution of
bipolar structure in PNe. Indeed, prior to the comprehensive
Cycle 27 WFC3 survey described here, NGC 6302 had already been the subject of more
than two dozen HST images, including WFC3 imaging in several filters across the wavelength range
3700–6700 Å (e.g., Szyszka et al., 2009).
NGC 6302’s central pinched waist is so dusty and its bipolar symmetry axis so highly inclined (inclination of 75–78∘ with respect to the line of sight; Peretto et al., 2007; Santander-García et al., 2017), that, as dryly noted by Aller et al. (1981), “[no] central star has been detected; the object definitely is not a conventional planetary nebula.” The dusty central torus harbors “mixed” (C-rich and O-rich) chemistry, displaying a combination of PAH features in the range 5–12 m and crystalline silicate and H2O ice at longer IR wavelengths (Molster et al., 2001; Kemper et al., 2002). ALMA CO mapping has revealed potential connections between this dense, dusty molecular torus and the inner lobe regions near the waist of the nebula (Santander-García et al., 2017). The slowly (8 km s-1) expanding equatorial molecular torus has a dynamical age of 5000–7500 yr (Peretto et al., 2007; Santander-García et al., 2017). In contrast, the large, open-ended bipolar lobes, which extend to 1.5 pc (Kameswara Rao et al., 2018), display very high expansion velocities (600 km s-1; Meaburn et al., 2005) and, hence, appear to have been ejected more recently and over a shorter (2000 yr) timescale (Meaburn et al., 2008; Szyszka et al., 2011). Again quoting Aller et al. (1981), “The nebula is clearly the result of some explosive event; its whole appearance suggests violent motions with some bilateral symmetry.”
Our new panchromatic HST/WFC3 imaging study of NGC 6302 is designed to elucidate the structure and ionization patterns of the nebula on size scales from 100 au to 0.5 pc, so as to constrain models of the history of its central star and the evolution of its collimated outflows. In this paper, we present the full suite of HST/WFC3 images of NGC 6302, as well as selected line ratio images, and we highlight key results gleaned from these images thus far. In forthcoming companion papers, we will provide an analogous treatment of the HST/WFC3 imaging survey of NGC 7027 (Moraga et al., in prep.), and we will present an analysis of multi-epoch HST/WFC3 imaging of NGC 6302 aimed at understanding its detailed kinematics (Balick et al., in prep.). The present paper is structured as follows: we describe the HST/WFC3 observations in §2; we present the resulting image suite, and briefly describe the most notable features of the resulting image, in §3; we present and analyze line ratio images diagnostic of nebular extinction and excitation in §4; we discuss the overall structure of the nebula’s bipolar lobes, as revealed by the HST/WFC3 image and line ratio suite, in §5, while §6 consists of a discussion of what our images reveal (and can’t reveal) about the central star; finally, in §7, we present a summary and the main conclusions gleaned from this HST/WFC3 imaging study of NGC 6302.
2 Observations
| Filter | ()a | line targeted | date | exp. |
|---|---|---|---|---|
| (nm) | (s) | |||
| FQ243Nb | 246.8 (3.6) | [Ne iv] | 2019-10-06 | 1110 |
| F343N | 343.5 (25.0) | [Ne v] c | 2019-10-06 | 1110 |
| F487N | 487.1 (6.0) | H | 2019-10-06 | 1200 |
| F502N | 501.0 (6.5) | [O iii] | 2020-03-13d | 1200 |
| F656N | 656.1 (1.8) | H | 2019-10-06 | 1200 |
| F658N | 658.4 (2.8) | [N ii] | 2020-03-13 | 2600 |
| F673N | 676.6 (11.8) | [S ii] | 2020-03-13d | 1290 |
| F110W | 1153.4 (443.0) | “YJ band” | 2019-10-05 | 556 |
| F128N | 1283.2 (15.9) | Pa 1.28 m | 2019-10-05 | 506 |
| F130N | 1300.6 (15.6) | Pa continuum | 2019-10-05 | 506 |
| F160W | 1536.9 (268.3) | “H band” | 2019-10-05 | 456 |
| F164N | 1640.4 (20.9) | [Fe ii] 1.64 m | 2019-10-05 | 1306 |
| F167N | 1664.2 (21.0) | [Fe ii] continuum | 2019-10-05 | 1306 |
Notes: a) Filter pivot wavelength and bandwidth. b) Images in filter FQ243N yielded poor signal, so are not presented here. c) Contamination from continuum as well as O iii at the 10% percent level (Groves et al., 2002). d) Exposures with F502N and F673N in 2019 were unusable due to gyro lock failures.
The HST/WFC3 observations of NGC 6302 reported here were obtained during HST Cycle 27 in 2019 October and 2020 March. The UVIS (CCD) and IR (HgCdTe array) imaging modules of WFC3 provide fields of view of and at pixel scales of 0.04 arcsec/pixel and 0.13 arcsec/pixel, respectively. Table 1 provides a summary of the WFC3 filters used, lines targeted, observing dates, and exposure times. The UVIS images were obtained in 2-point GAP-LINE dither mode (DITHER-LINE for quad filter FQ243N), and the IR images were obtained in 2-point DITHERBLOB dither mode. Images obtained in 2019 October and 2020 March were obtained at orientations of and , respectively, as measured E of N with respect to the image Y axis.
Standard pipeline calibration and processing of the UVIS and IR exposure sets, using CALWF3 v3.5.0, was performed on all images111See https://hst-docs.stsci.edu/wfc3dhb/chapter-3-wfc3-data-calibration. For both UVIS and IR imaging, the calibrations include bias correction, dark current subtraction, flat field and shutter shading corrections, and cosmic-ray rejection; pipeline UVIS image processing also includes CTE correction. Following calibration, pipeline processing222https://hst-docs.stsci.edu/wfc3dhb/chapter-4-wfc3-images-distortion-correction-and-astrodrizzle consisted of geometric distortion corrections, World Coordinate System image alignment, additional cosmic-ray rejection, and merging of dithered exposure sequences. As a result of the simple two-point dither observing mode we employed, cosmic-ray rejection was inefficient in the inter-CCD “gap” region of the UVIS module, resulting in some small-scale image artifacts along this region of the UVIS images.
We used the AstroDrizzle software package333https://www.stsci.edu/scientific-community/software/drizzlepac.html to perform an additional round of post-pipeline processing of all images, so as to (a) correct the registration of dithered exposures that were poorly aligned in standard pipeline processing (as was the case for most of the IR images), and (b) to refine relative image-to-image pointing across filters, using common field stars as the positional references. We estimate that, after this post-pipeline processing, the relative pointing across all (UVIS and IR) images is accurate to 0.5 pixel. Absolute pointing was further calibrated for a reference (IR) image set using reference stars from the Gaia Space Astrometry mission, by adapting standard AstroDrizzle scripts.
The various emission
line and line ratio images
presented in this paper were generated from these astrometrically
calibrated images using appropriate
photometric calibrations and/or passband
responses, as obtained from the synphot software
package444https://www.stsci.edu/hst/instrumentation/reference-data-for-calibration-and-tools/synphot-throughput-tables.html. Additional
small ad hoc pointing refinements were performed to generate difference images from the
F164N-F167N and F128N-F130N image pairs, so as to obtain
continuum-subtracted 1.28 m
Pa and 1.64 m [Fe ii] images, respectively. These refinements
were verified via minimization of difference image residuals in
background sky regions and field star images.
3 The HST/WFC3 image suite
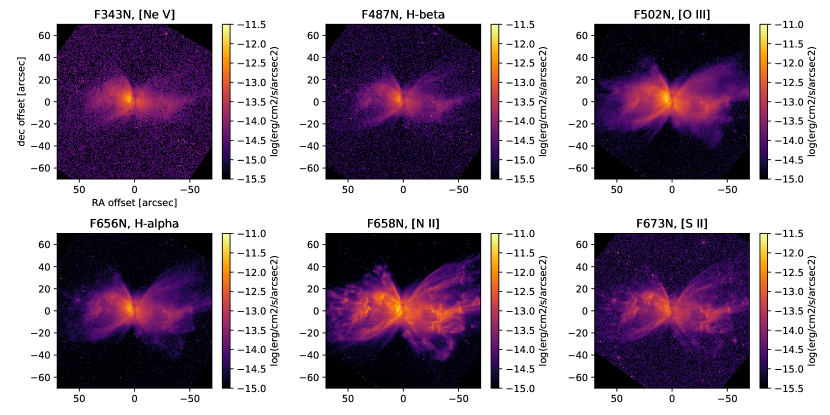
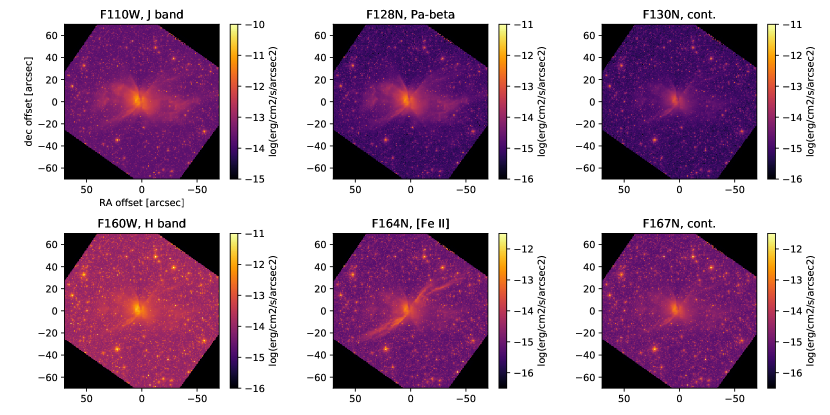
The suite of HST/WFC3 images obtained for NGC 6302 is presented in Fig. 1. Across this WFC3 image suite, as in the (WFPC2 and WFC3) images previously obtained by HST (Matsuura et al., 2005; Szyszka et al., 2009, 2011), NGC 6302 displays its classical, pinched-waist bipolar morphology, with its lobe-bisecting dark lane (the projection of its dusty torus against the sky) oriented very nearly N–S (see also Kameswara Rao et al., 2018). The new WFC3 image suite clearly defines the wavelength-dependent morphologies of the dusty toroidal equatorial structure (central dark lane) that bisects the polar lobes, as well as the fine structures (clumps, knots, and filaments) within the lobes. On large (60–90′′; 0.3–0.45 pc) scales, the two large, “major” lobes are oriented more or less E–W, i.e., orthogonally to the dusty equatorial torus. However, it also evident that the lobes contain a complex system of point-symmetric sets of knot and filament structures spanning a broad ranges in both size scale and position angle (i.e., PAs from 20∘ to 150∘), and that the relative strengths of these lobe features vary sharply with wavelength and from emission line to emission line.
Undoubtedly the most striking and unexpected aspect of the new WFC3 image suite is the bright, S-shaped 1.64 m [Fe ii] emission that traces the southern interior of the east lobe rim and the northern interior of the west lobe rim, in point-symmetric fashion (Fig. 2). Fainter [Fe ii] emission is also detected in the lobe interiors, especially to the northeast of the dark lane, as well as in the lobe “clump zones” (§ 5.1). This constitutes the first detection of 1.64 m [Fe ii] emission in NGC 6302; although the line is evidently very bright (peak surface brightness erg cm-2 s-1 ster-1), previous near-IR spectroscopy of NGC 6302 had not covered this (H band) spectral region (Ashley & Hyland, 1988; Casassus et al., 2000, 2002). The presence and morphology of 1.64 m [Fe ii] emission is indicative of the presence of off-axis shocks generated by fast ( km s-1), collimated winds from the central star(s) of NGC 6302, as is discussed in detail in later sections of this paper.
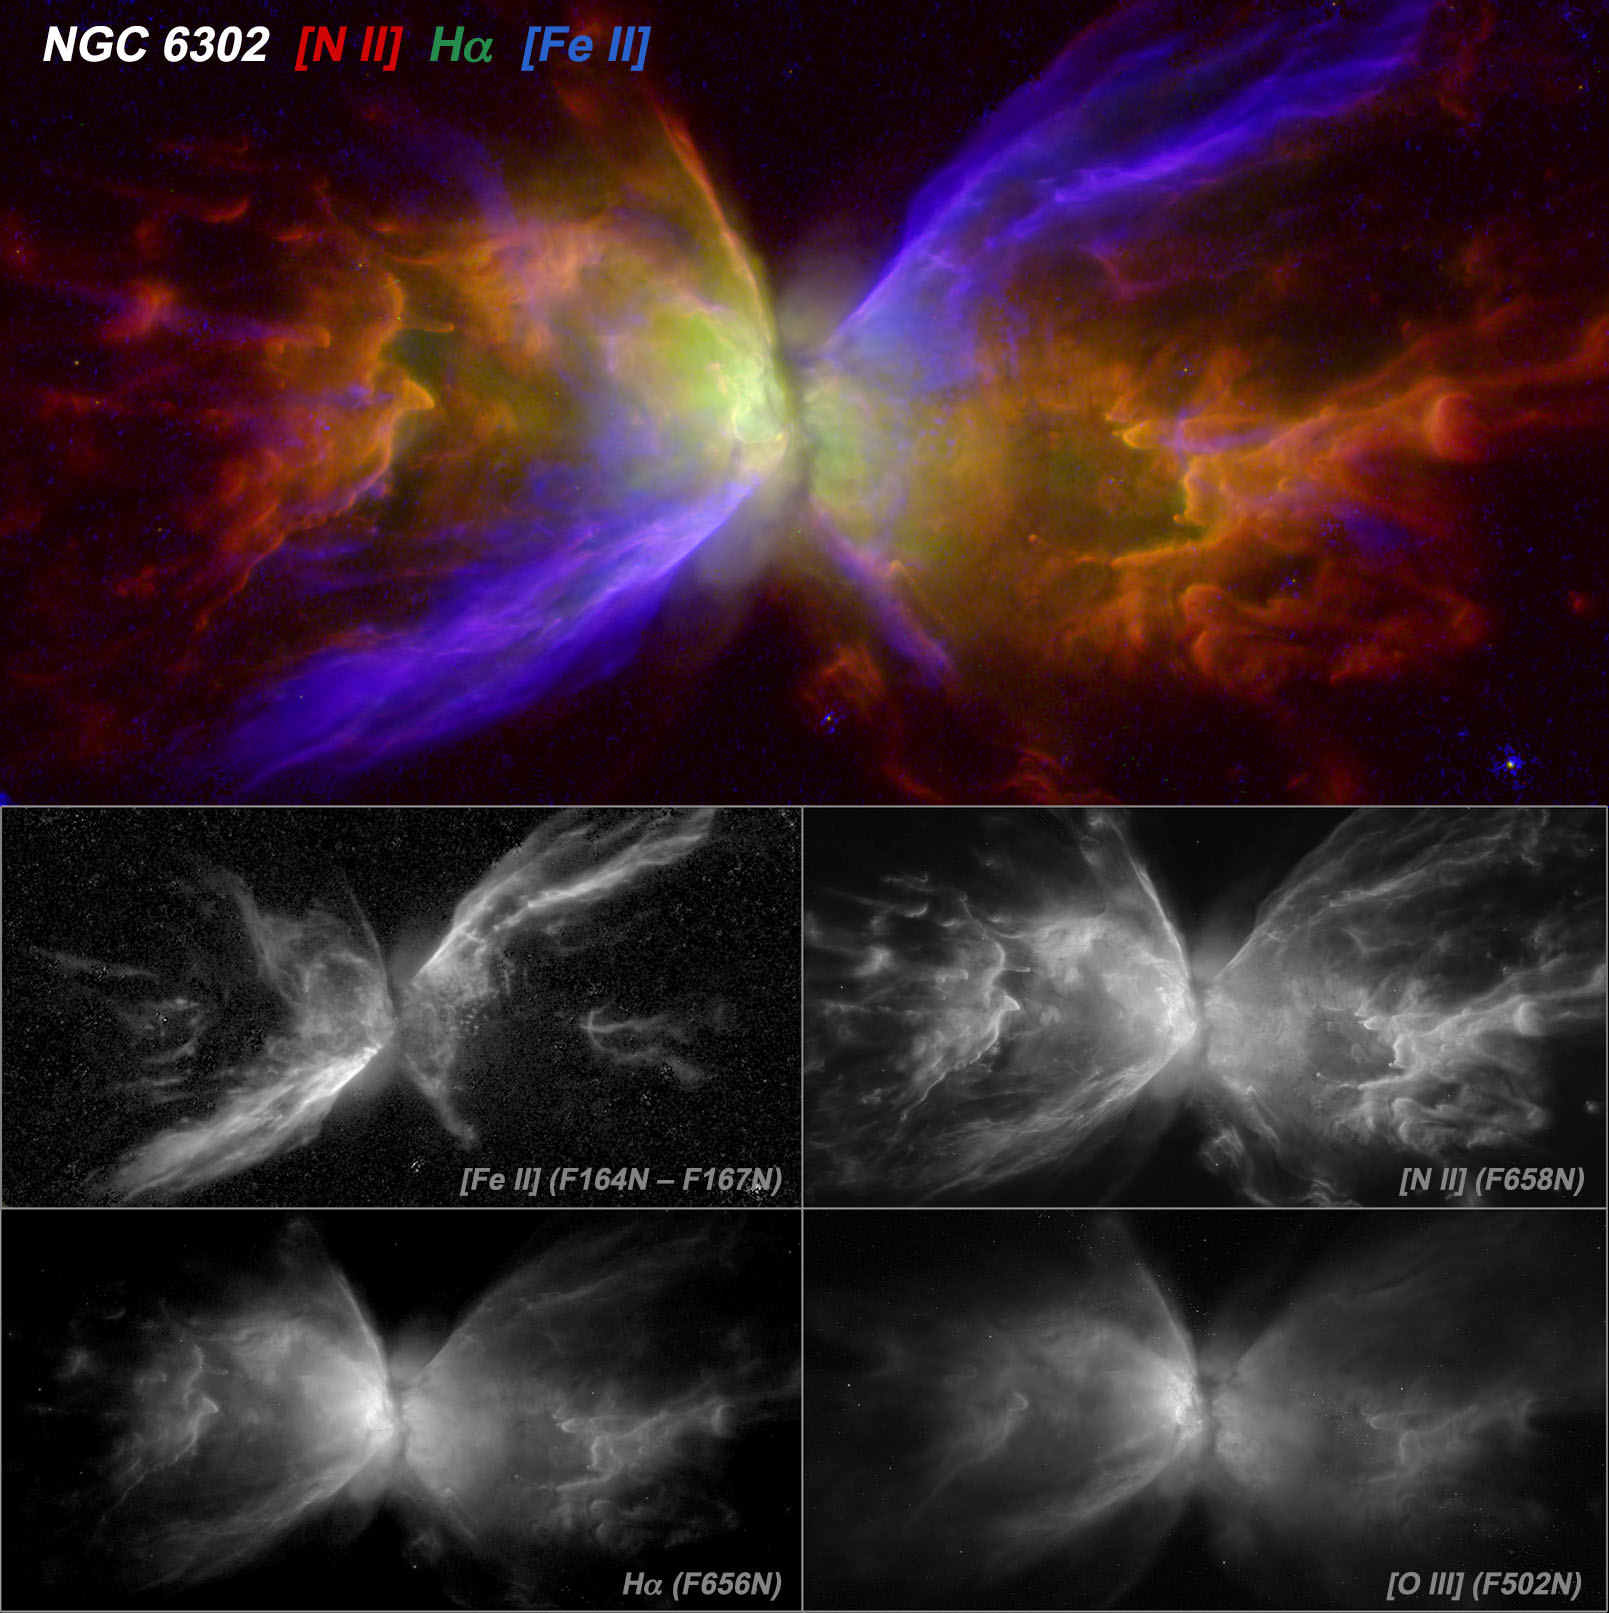
It is furthermore readily evident that the surface brightnesses of the high-excitation species [Ne v] and [O iii] and the H recombination lines (H, H, Pa) fall off more steeply with increasing displacement from the pinched waist than those of [N ii] and [S ii], with the latter, lower-excitation lines conspicuously bright in the nebula’s clump and knot structures and remaining bright out to large displacements (2′, i.e., 0.6 pc) in the polar lobes. These gradients in nebular ionization and excitation are illustrated in the form of RGB image overlays in Fig. 3, and are even more apparent in the line ratio images presented in §4.2. The top panel of this Figure shows that [Ne v] emission appears somewhat more compact than [O iii], with the caveat that the F343N [Ne v] filter is more susceptible than F502N [O iii] to contamination by scattered starlight in the dusty lobe interiors. This color overlay also reveals small-scale excitation gradients in the clump regions of the lobes (which are discussed in more detail in §5.1), illustrating in particular how the [O iii] follows the clump exteriors, while Pa emission effectively traces ionized regions that are highly dust-extincted. The bottom frame of Fig. 3 furthermore demonstrates the dramatically different extents of [Ne v] vs. [S ii] emission and the strikingly different morphologies of [S ii] and [Fe ii].
4 Line ratio images
4.1 H recombination lines: mapping extinction
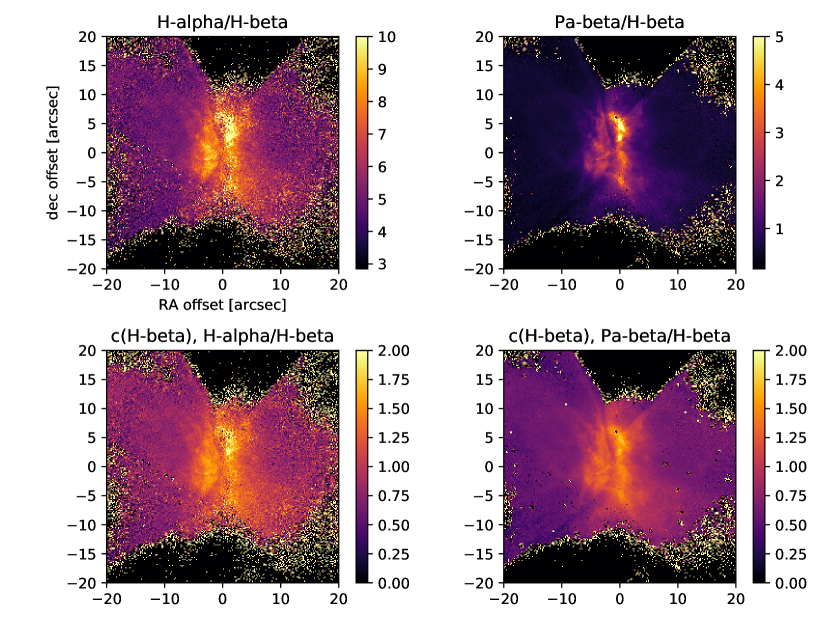
In Fig. 4 (top panels), we present H recombination line ratio images (H/H and Pa/H) of the central region of NGC 6302. In the regimes of electron temperature and density appropriate to NGC 6302 (i.e., 1.5 K and cm-3, respectively; Rauber et al., 2014), the theoretical (Case B) line ratios are H/H 2.85 and Pa/H 0.162 (Osterbrock & Ferland, 2006). It is readily apparent from Fig. 4 that the observed ratios in NGC 6302 are everywhere larger than the theoretical ratios, by factors ranging from 2 in the lobes to as large as 30, in the case of Pa/H in the central torus (dark lane) region. These large deviations are caused by reddening that, in turn, is due to a combination of foreground (ISM) and intranebular dust extinction. Whereas ISM reddening (estimated at toward NGC 6302; Lallement et al., 2019) likely dominates the (relatively smooth) extinction toward the lobe regions, intranebular extinction clearly becomes the dominant extinction source in the central torus region (similar conclusions were reached in previous studies of NGC 6302; e.g., Matsuura et al., 2005; Rauber et al., 2014). This contrast is perhaps best seen in the Pa/H image; the factor 3 wavelength range spanned by this ratio makes it a sensitive probe of the highly reddened central regions of NGC 6302.
Maps of the nebular extinction parameter obtained from the H/H and Pa/H line ratio images are presented in the bottom panels of Fig. 4. These maps were generated from the relation (e.g., Groves et al., 2002), where and are the theoretical and observed line ratios and are extinction values at the relevant wavelengths as given by a reddening law. Here, we adopted the ISM reddening law determined by Cardelli et al. (1989).
The detailed morphologies of the resulting maps in Fig. 4 are fully consistent. However, the values of in the map derived from Pa/H are systematically smaller than those derived from H/H; the map obtained from Pa/H ranges from (lobes) to a peak of within the central waist region, compared with the corresponding range of 0.8–2.0 for the map obtained from H/H. This discrepancy may reflect deviations from “standard” ISM dust extinction behavior as encoded in the reddening law from Cardelli et al. (1989).
We note that the ranges of we derive from our HST/WFC3 H recombination line ratio images (Fig. 4) are in reasonable agreement with previous determinations for in NGC 6302 as obtained from long-slit spectroscopy, aperture spectroscopy, and/or aperture photometry at wavelengths ranging from the visible to the radio, i.e., in the lobes and to 2.4 in the central torus region (Groves et al., 2002; Rauber et al., 2014, and references therein). At the same time it is readily apparent, given the very large range in observed in our extinction maps, that previous measurements would be tremendously sensitive to the specifics of aperture placement, wavelength span, and assumed reddening law. This of course has profound implications for determinations of line ratios and (hence) ionic abundances, temperatures, and densities within the nebula (see also Rauber et al., 2014).
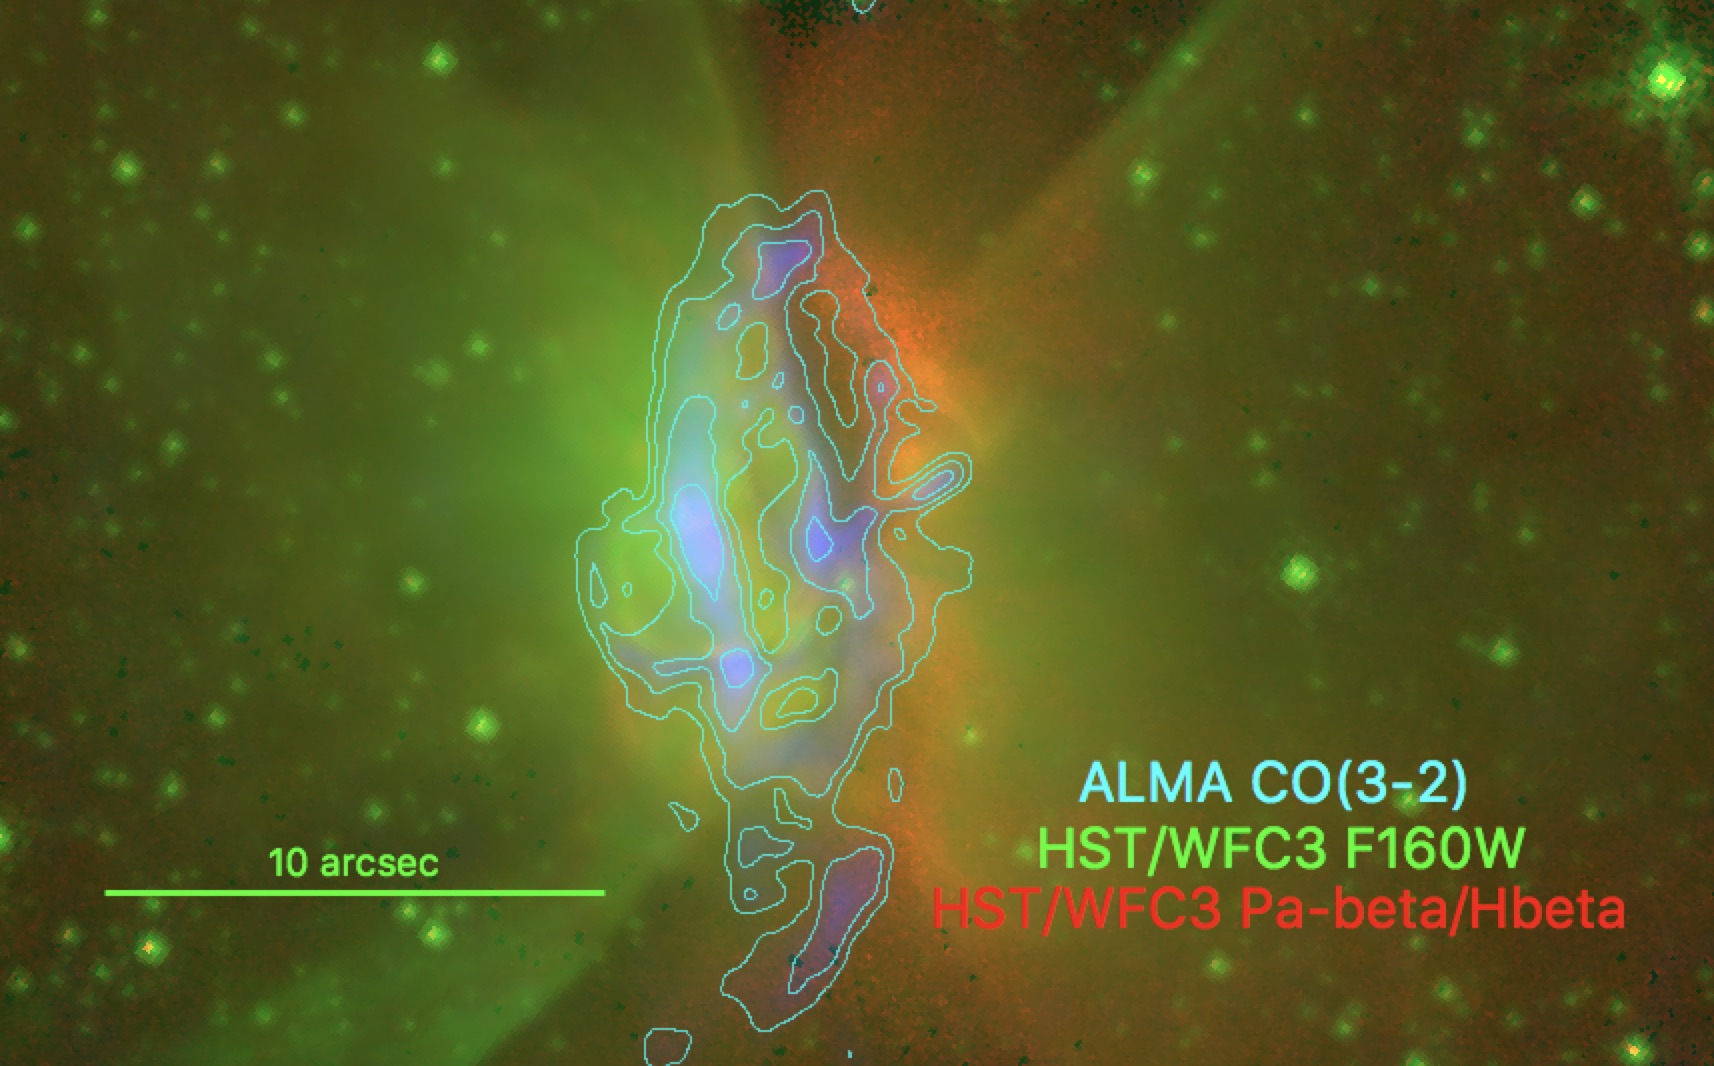
In Fig. 5 we present a color overlay of the ALMA integrated intensity map of 345 GHz CO emission from Santander-García et al. (2017) on our HST/WFC3 Pa/H line ratio and F160W (“H band”) images, zoomed in on the core region of the nebula. As described in detail in Santander-García et al. (2017), the main bright loop of CO traces the molecular gas within the central, expanding, dusty torus that obscures the CSPN of NGC 6302. While the overall correspondence between the surface brightness of CO emission and the distribution of dust extinction (as mapped by Pa/H) is apparent in Fig. 5, the CO and dust extinction morphologies clearly differ in detail. In particular, the western rim of the CO loop, which is blueshifted (Santander-García et al., 2017), precisely traces the sharp, narrow minimum in Pa/H that bisects this line ratio image. This spatial correspondence between blueshifted CO and the Pa/H “dark lane” indicates that the forward-facing portion of the expanding CO loop traces a large intervening column of dust — a dust column large enough that too few Pa line photons escape for the Pa/H ratio to serve as a probe of the dust extinction. The fact that the Pa/H ratio rises to its maximum value (2.0) at a displacement 2′′ west of this sharp minimum, before declining (a result generally consistent with that from long-slit optical spectral mapping; Rauber et al., 2014), then reveals the radial extent of the dusty torus as seen in projection toward the west lobe, i.e., 2000 au. In contrast, the bright eastern rim of the CO loop, which is redshifted (Santander-García et al., 2017), has no clear counterpart in the Pa/H line ratio image. This portion of the central molecular torus is projected behind the east lobe, such that its dust counterpart cannot be traced via extinction mapping.
4.2 High- and low-excitation forbidden lines: ionization gradients
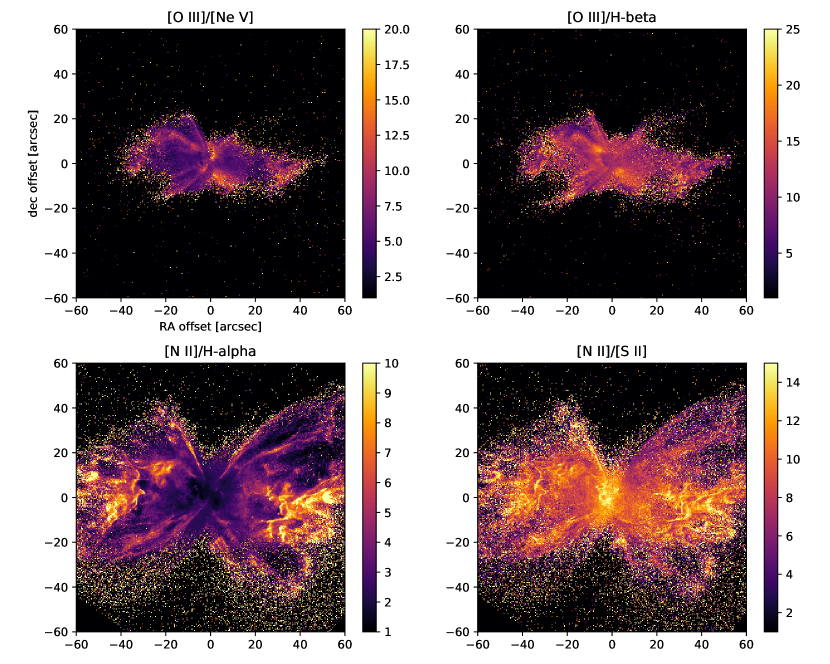
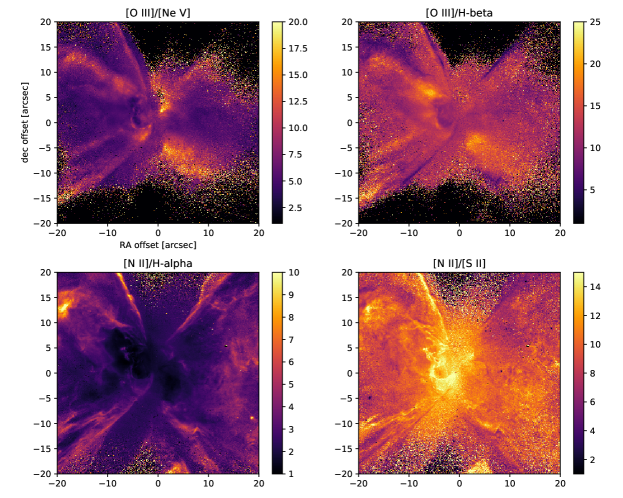


In Fig. 6, we present a series of line ratio images obtained from high-excitation forbidden lines ([Ne v], [O iii]) and low-excitation forbidden lines ([S ii], [N ii]) with respect to each other and to H recombination lines. Of these line ratio images, only [O iii]/[Ne v] should be sensitive to extinction. Given the results above (§ 4.1), however, this ratio should only be affected by extinction within the central torus region, where contamination of the F343N [Ne v] image by continuum and O iii Bowen fluorescence line emission is also likely most significant (see Groves et al., 2002, their Fig. 2). We note that the (relatively broad) F343N is the only UVIS filter that should be affected by such contamination due to continuum or line emission.
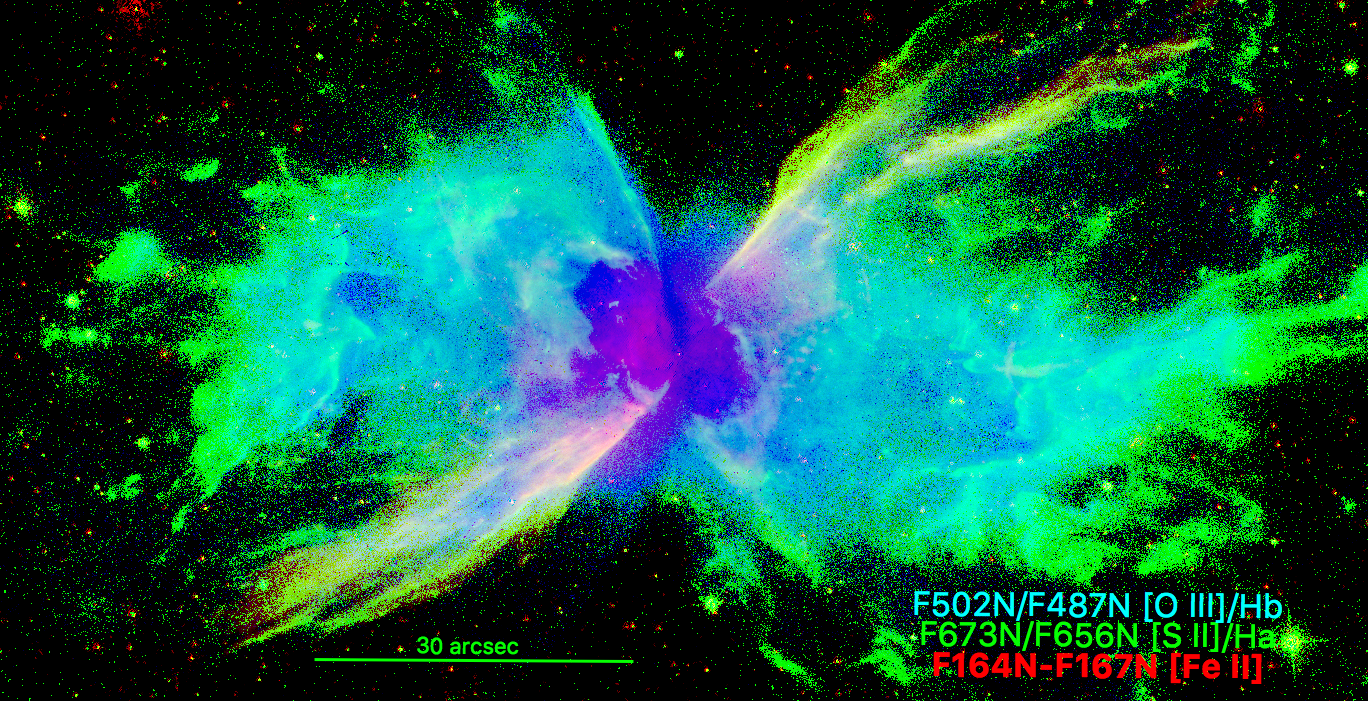
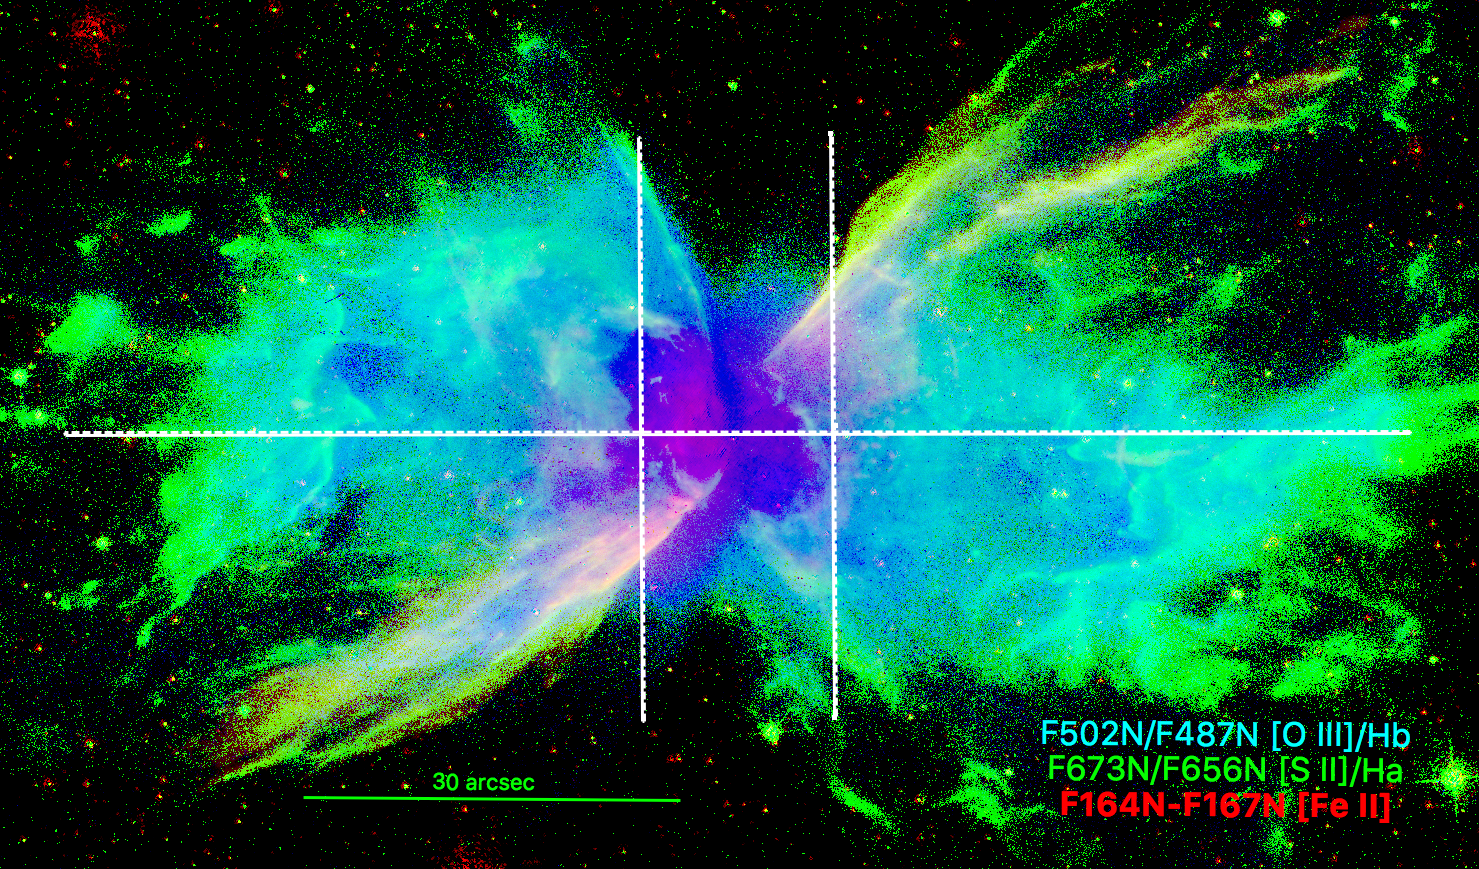
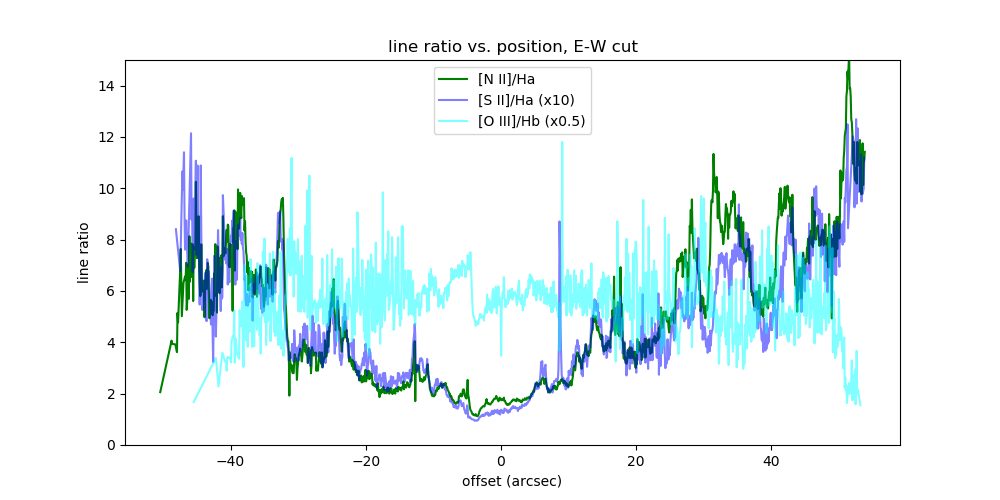
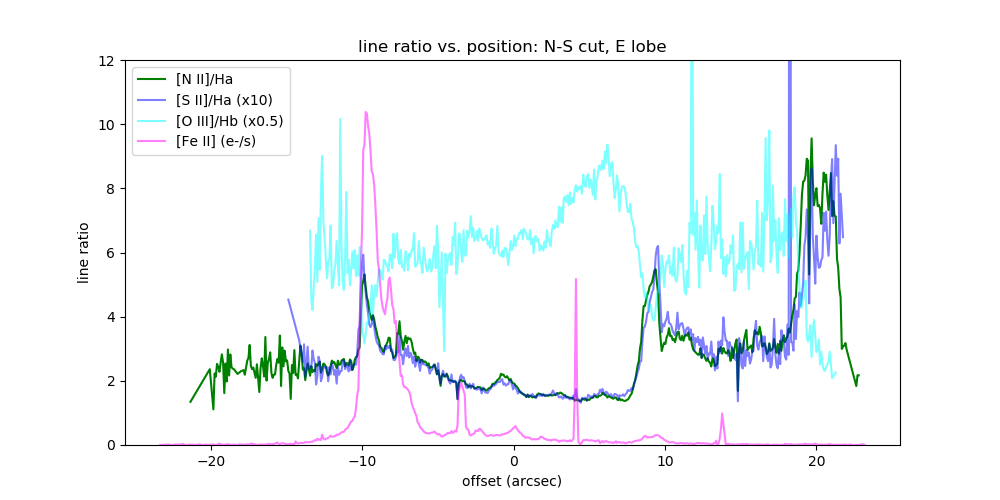
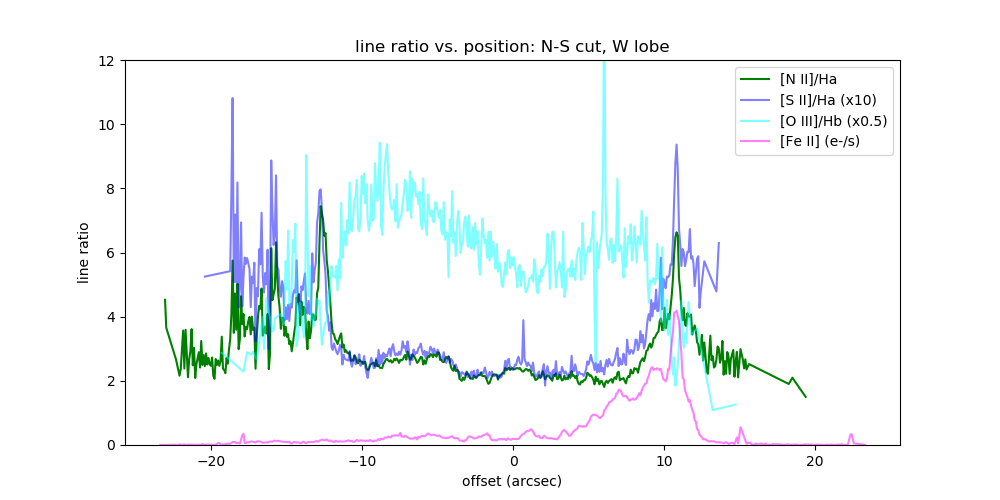
The [O iii]/H, [S ii]/H, and [N ii]/H line ratio images, along with Pa/H and [Fe ii] images (as nebular extinction and shock tracers, respectively; see § 4.1 and below), are also presented in the form of color overlays in Fig. 7. In Fig. 8, we display profiles of the values of the [O iii]/H, [S ii]/H, and [N ii]/H line ratios as measured along (three) selected linear cuts through the line ratio images — one cut along the E-W direction through the inferred position of the central star (see § 6), and two N-S cuts through the inner lobe regions — with the positions and lengths of these cuts indicated in the color overlays at the top of the Figure.
Broadly speaking, the ionization structure observed in these HST/WFC3 line ratio maps — wherein the higher ionization state species (Ne4+, O2+) are brightest in the lobe interiors, and the lower ionization species (singly ionized S and N) become most prominent in the outer reaches of the nebula, relative to H and H (respectively) — is consistent with the predictions of (e.g., CLOUDY) models of planetary nebulae with simple (spherical) geometries that are photoionized by hot central stars (e.g., Alexander & Balick, 1997). This ionization structure is readily apparent in Fig. 7, upper panel, and in the E-W cut through the polar lobes displayed in Fig. 8. However — even accounting for the likely additional contribution of shocks (Lago et al., 2019) — the line ratio images clearly deviate from such simple prescriptions in fundamental respects, which we highlight here.
The most striking aspect of the line ratio images involving the high-excitation lines is the series of radially directed, azimuthally alternating high/low ratio features, extending away from the central waist region. These features are most noticeable within the east lobe, where they more or less coincide with the boundaries of the distinct azimuthal regions (wedges) discussed in detail in Sec. 5. The [O iii]/H ratio lies in the range 10–15 across much of the lobe regions (Fig. 8), consistent with previous spectroscopic mapping within a strip oriented along the polar axis of NGC 6302 by Rauber et al. (2014), and as expected for high-excitation nebulae (e.g., Alexander & Balick, 1997). However, the [O iii]/H ratio is observed to climb to 15–20 in narrow strips oriented along PAs 60∘ and 120∘, and drops to distinct minima of [O iii]/H 6–8 along PAs 20∘, 45∘, and 150∘. These strips of elevated and depressed [O iii]/H ratio can be seen as peaks and valleys in the N-S cut through the east lobe displayed in Fig. 8. Radially aligned (azimuthally alternating) features of locally high and low [O iii]/H ratio are also seen in the west lobe, but are generally less distinct, with the exception of narrow radial strips of low [O iii]/H (5) along the lobe perimeters (PAs 200∘ and 315∘). The N-S profiles displayed in Fig. 8 (lower panels) furthermore demonstrate that the minima in [O iii]/H along the southern and northern perimeters of the east and west lobes, respectively, correspond to sharp peaks in [Fe ii] surface brightness.
The [O iii]/[Ne v] ratio image morphology closely follows that of [O iii]/H, wherein [O iii]/[Ne v] is somewhat elevated within the radial features that display larger [O iii]/H. Since the ionization potential of Ne3+ is much larger than that of O+ (97 eV vs. 35 eV), this suggests that the azimuthal regions characterized by low [O iii]/H and [O iii]/[Ne v] are in fact the highest-excitation regions of the nebula; i.e., in these regions, where [Ne v] is bright but [O iii] is relatively weak, O2+ is suppressed in favor of higher ionization states of O. The implied large azimuthal ionization gradients are impossible to reconcile with standard (Strömgren-sphere-based) ionization theory, and point instead to shadowing effects. That is, the lobe regions with supressed [O iii]/H and [O iii]/[Ne v] are likely directly exposed to EUV and soft X-ray radiation from NGC 6302’s exceedingly hot central star; whereas the radial zones of elevated [O iii]/H and [O iii]/[Ne v] mark regions where radiation from the central star is at least partially attenuated, perhaps by intervening dust.
The structures observed in the line ratio images constructed from [N ii] and [S ii] differ fundamentally from those of the high-excitation forbidden lines. In particular, as is evident from the profiles displayed in Fig. 8, these low-excitation lines are particularly bright (with respect to H) in the clump and “elephant trunk” structures within the lobe interiors at offsets of 30′′–60′′ from the core region. These regions are discussed in detail in § 5.1. In the core region, we find [N ii]/H , whereas within the clump regions of the lobe interiors, the [N ii]/H ratios climb to 10. The lobe perimeters, which are marked by very sharp gradients in [O iii]/H ratio, appear as narrow regions of enhanced [N ii]/H and [S ii]/H. The profiles in Fig. 8 also demonstrate that the [N ii]/[S ii] line ratio is 10 throughout much of the nebula, with the exception of the core region and the west lobe clumps and perimeter regions. The core region is both deficient in low-excitation forbidden line emission and relatively high in [N ii]/[S ii] line ratio ([N ii]/[S ii] 15). The clumps and perimeter regions in the west lobe also display [N ii]/[S ii] ratios of 15–20. As is the case for [O iii]/H, these [N ii]/H and [S ii]/H (hence [N ii]/[S ii]) line ratio mapping results are quite consistent with those presented in Rauber et al. (2014), but obviously our images expand the line ratio coverage to the entire surface area of both lobes, and at subarcsecond resolution.
As discussed in detail in Lago et al. (2019), the unusually large [N ii]/H ratios of 10 measured in the lobe clump regions are indicative of the influence of shocks on the observed ionization structure of NGC 6302. Indeed, there is ample evidence for the presence of relatively strong (100 km s-1) shocks in NGC 6302, both on the basis of large- and small-scale nebular morphology and in the form of the bright 1.64 m [Fe ii] emission discovered in our HST/WFC3 imaging (both aspects are discussed further in Sec. 5). Such fast shocks might explain the large observed [N ii]/H in the clumps as well as the elevated [N ii]/[S ii] ratios in both the clump and core regions, according to models describing Herbig-Haro objects associated with collimated outflows from pre-main sequence stars (Hartigan et al., 1994) — assuming such models might be applicable to the extreme UV irradiation environment that characterizes NGC 6302. However, the widely distributed lobe clump regions, where the most highly elevated [N ii]/H ratios are observed, do not spatially coincide with the (narrow) zones of bright 1.64 m [Fe ii] emission (Fig. 7, lower panel). Furthermore, models specifically formulated to describe shocked “cloudlets” in planetary nebulae do not achieve such large [N ii]/H ratios, although these models can reproduce the [N ii]/[S ii] ratios we measure in the clump and core regions of NGC 6302 (Raga et al., 2008).
5 The azimuthal lobe structures of NGC 6302
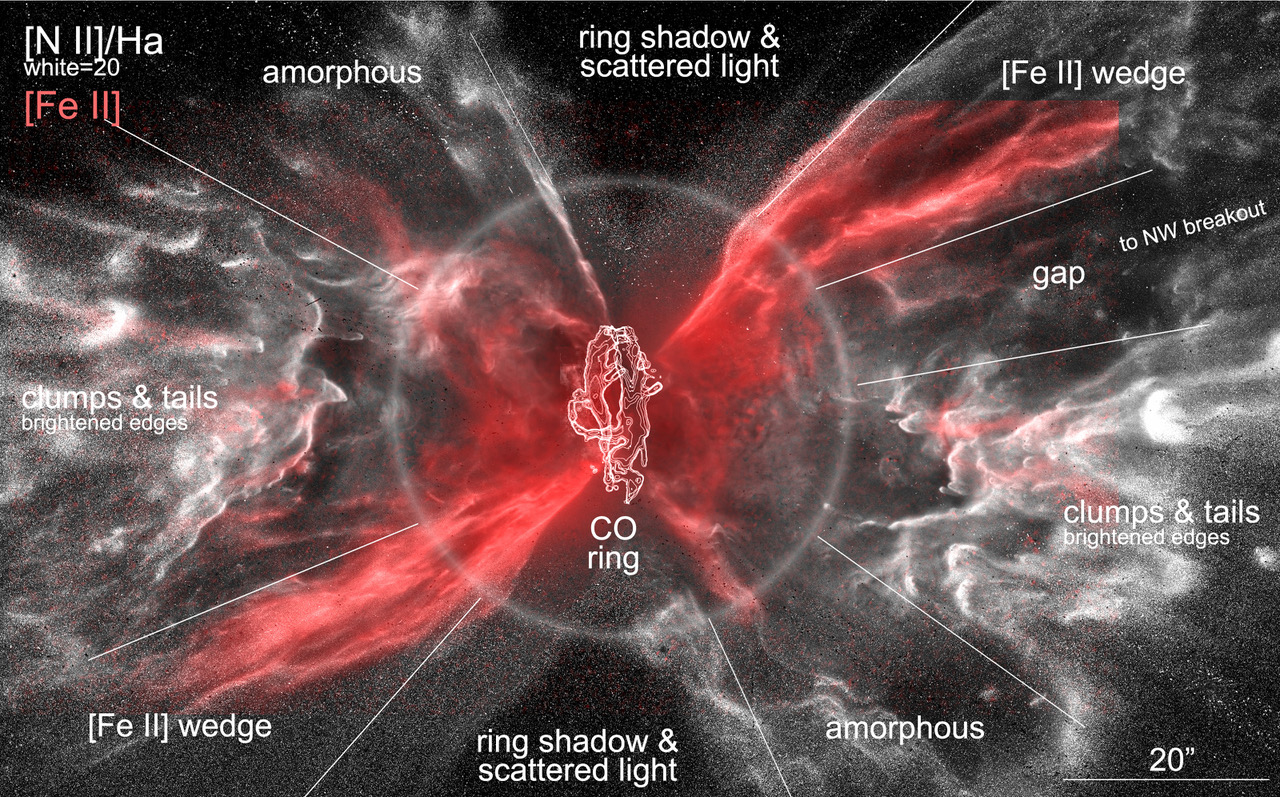
As illustrated in Fig. 9, the regions beyond the central nebular core region of NGC6302 (whose extent is roughly delineated by the white circle in the Figure) can be divided into distinct azimuthal wedges that extend radially outward from the core. As noted in § 4.2, the boundaries of these wedge-shaped regions (indicated in Fig. 9 as thin white lines extending radially away from the core region) are marked by strong azimuthal gradients in nebular ionization structure. Such a clear azimuthal segmentation of spatial structure and ionization in the lobe interiors is highly unusual in bipolar PNe, apart from certain multipolar PNe.
The general structure of the azimuthal lobe domains is as follows. Nearest the E-W nebular symmetry axis lie oppositely positioned wedge regions containing highly conspicuous clumps with radially-directed outward-pointing tails. Moving clockwise, we find opposing wedges, marked “amorphous” in Fig. 9, that display a paucity of structure relative to the adjacent E-W oriented clump zones. The next wedges, marked “ring shadow & scattered light,” are dark. These wedges mark azimuthal angles where the central dusty, equatorial torus evidently obscures the central star from the standpoint of any nebular material that may be present beyond a few arcsec from the central waist. This dark shadow zone is bordered by (what appears to be) faint dust-scattered scattered nebular emission. Continuing clockwise, the wedges containing the plumes of [Fe ii] are found next. An additional wedge at PA appears as a gap, and marks the inner regions of a pc-scale “breakout” lobe to the west, i.e., a region of the W lobe in which both the proper motions and the Doppler speed of lobe widening are extreme (e.g., Meaburn et al., 2005, 2008). (The breakout lobe will be explored in a second paper on nebular dynamics.)
5.1 The “clump” wedges

Figure 10 illustrates the ionization structure and selected line ratios for the E-W oriented “clump” wedges of the nebula, via blowups of the brightest clump regions, exploiting line ratios that are relatively insensitive to extinction. The line ratios are sensitive to both the degree of ionization and the local excitation temperature. The lobe clumps stand out in [N ii]/H and (to a lesser extent) [S ii]/H (yellow-green regions in color panels of Fig. 9) and are notably darkened in [O iii]/H (Fig. 9, see greyscale insets). The ratios of the optical forbidden lines to neighboring Balmer lines (at adjacent wavelengths) are all enhanced on the star-facing edges of the clumps, much like the clumps at the perimeters of most photoionized H ii regions and some wind-shocked clumps seen in H-H objects (Hartigan et al., 1994).
The “leeward” sides of the clumps (i.e., the sides facing away from the CSPN) uniformly display tails, with widths similar to the clump diameters, pointing away from the central star. These structures resemble (at least superficially) the dense, tail-bearing globules seen in dusty, molecule-rich PNe like NGC 6720 (the Ring; Speck et al., 2003) and NGC 7293 (the Helix; O’dell & Handron, 1996). As in those PNe, the clump tails in NGC 6302 suggest that radially directed CSPN winds with significant ram pressure are sweeping clump material outwards. That is, the tails resemble wakes that trail the clumps at their heads, indicating that they are immersed and entrained in a wind whose speed mildly exceeds the speed of the shock that strikes the heads. The fact that some of these head+tail features are traced by filamentary 1.64 m [Fe ii] emission (Fig. 2) supports this interpretation and, furthermore, suggests that the velocities of the entraining winds, relative to the clump/tail structures, well exceed 50 km s-1 (see §5.2).
Four of our WFC3 images were obtained in filters that were also used in previous (epoch 2009) HST/WFC3 imaging of NGC 6302 (specifically, F502N, F656N, F658N, and F673N). The AstroDrizzle image registration procedure described in § 2, which exploits field stars common to image pairs, was used to place these WFC3 images into the astrometric coordinate frame of the images in the 2019–2020 WFC3 image suite that were obtained through the corresponding filters. Detailed analysis of the nebular kinematics revealed in difference and ratio images contructed from these multi-epoch images is deferred to a subsequent paper (Balick et al., in preparation). Here we merely note that (a) the lobe clump/tail structures generally display the clearest signs of proper motion of any nebular structures, due to their well-defined head/tail structures; and (b) our difference-image-based analysis of the ballistic expansion of these structures, analogous to that described in Schönberner et al. (2018), indicates that their characteristic dynamical (ejection) timescale is 2000 yr. The latter result is consistent with previous multi-epoch imaging studies of the nebula (Meaburn et al., 2008; Szyszka et al., 2011). However, some inner lobe structures also clearly display proper motions that are of similar magnitude to those of the outer lobe structures, suggestive of more recent mass ejections (see §6).
Beyond the clumps’ bright edges and along the outer edges of their tails, the [O iii]/H ratio drops precipitously (see Fig. 8, E–W profile, and Fig. 10, greyscale insets). In contrast, the [N ii]/H and [S ii]/H ratios both significantly increase within the clumps (again see Fig. 8, E–W profile, and Fig. 10, color panels). On the one hand, this appears to rule out the possibility that the [N ii] and [S ii] in the clump shadows is produced by stellar UV, since we would expect the optical depths to 10-20 eV photons to be large within the clumps. Ionization behind the clumps may be the result of UV photons released by Lyman-series recombinations; however, such photons must originate in close proximity to the tails in order to penetrate deeply into the shadow zone. Alternatively, these regions may be exhibiting PDR-like behavior, wherein the layers of [N ii] and [S ii] emission are the result of significant N and S abundance enhancements driven by UV photodissociation of N- and S-bearing molecules along the surfaces of the dusty clumps. Radio interferometric imaging of such molecules (e.g., HCN, CN, SO, SO2) in the clump regions would test the latter hypothesis.
5.2 The [Fe ii] wedges
In each lobe, the region (wedge) of bright [Fe ii] lies on the opposite side of the clump wedge from the amorphous wedge (Fig. 9). The 1.64 m [Fe ii] emission line has an excitation temperature of K. As a consequence, 1.64 m [Fe ii] emission is typically a tracer of fast (J-type) shocks. The line has been detected and mapped in a diverse array of astrophysical environments, such as Herbig-Haro objects associated with jets from young stellar objects (e.g., McCoey et al., 2004), the Orion KL Nebula (e.g., Bally et al., 2015), supernova remnants (e.g., Keohane et al., 2007), and active galactic nuclei (e.g., Forbes & Ward, 1993); all of these systems feature shock speeds in excess of 50 km s-1 and often 100 km s-1. However, images of PNe in this line are few and far between (e.g., M2-9; Balick et al., 2018).
The intensity of the 1.64 m [Fe ii] emission peaks sharply along the edges of these point-symmetric lobe structures (see N-S intensity profiles in lower panels of Fig. 8), indicating that these particular surfaces of the PN lobes are being actively shaped by fast, collimated winds emanating from the immediate vicinity of its central star. The lack of detection of X-rays from NGC 6302 by Chandra (Kastner et al., 2012) suggests that the relative wind speed at these [Fe ii]-emitting interfaces cannot be much faster than necessary to excite the 1.64 m line (i.e., 50–150 km s-1). More sensitive soft X-ray imaging observations are clearly warranted, however, especially given the detection of emission lines of O vii and O viii in archival IUE spectra (Feibelman, 2001).
5.3 The “amorphous” wedges
In contrast to the “clump” and [Fe II] zones just described, the “amorphous” wedge zones appear less structured, and display weaker 1.64 m [Fe II] emission (Fig. 9). Dynamically, these amorphous wedges may be “quiet” dynamic zones, unlike the [Fe ii] wedge regions (see next). However, the azimuthal locations of the “amorphous” wedges closely coincide with faint, very extended, jet-like structures tentatively detected in wider-field UV imaging (Kameswara Rao et al., 2018). The combination of thin-walled interfaces along the edges of the amorphous zones and the possible UV detection of larger-scale structures along these same PAs (Kameswara Rao et al., 2018) indicates that fast winds fill these apparently hollow (and seemingly dynamically quiet) lobe interiors and generate shocks along the inner lobe walls.
Sensitive, high-resolution UV spectroscopy is required to confirm the apparent detection of pc-scale, low-surface-brightness UV emission along the amorphous wedge directions by Kameswara Rao et al. (2018) and, if confirmed, to ascertain whether this emission is in fact due to H2 fluorescence, as proposed by those investigators. If this emission is indeed due to lines of H2, such UV spectroscopic measurements might further yield the kinematic signatures of large-scale, collimated outflows. Regardless, if fast winds are indeed flowing through the amorphous wedge regions then — given the symmetry of the amorphous and [Fe ii] wedges with respect to the central torus — it stands to reason that these same winds cause the shocks that generate the bright, extended 1.64 m emission within the [Fe ii] wedges. This then begs the question as to why the 1.64 m [Fe ii] line is relatively faint and less extensive within the amorphous wedges. The implication is either that the density within the zone of fast wind flow within the amorphous wedges is lower than that in the [Fe ii] wedges, or that the interactions of the fast wind with the lobe walls are more energetic along the N (S) borders of the W (E) lobes, where the strongest [Fe ii] emission arises.
5.4 The “gap” wedge
The “gap” wedge is a narrow zone within the west lobe, between the [Fe ii] and clump wedges, that displays a lack of structure. The gap wedge seems to be an empty, perhaps jet-evacuated region that connects the inner west lobe to the larger “breakout lobe” structure to the NW (PA 300∘) that is seen in wide-field images of NGC 6302 (Meaburn et al., 2005; Kameswara Rao et al., 2018). This breakout lobe is expanding at an estimated deprojected 600 km s-1 in the plane of the sky at 7 from the nebular core (Meaburn et al., 2005). The breakout lobe is also seen to be expanding laterally at 200 km s-1 (López et al., 2012). This strongly implies that the same collimated flow that generates the “breakout lobe” is also producing the [Fe ii]-emitting shocks along the point-symmetric (ESE and WNW) lobe surfaces. The “gap” wedge to the NW of the core region hence may simply be a cowling through which invisible, supersonic, collimated winds flow into the NW breakout lobe. This general scenario has been validated via detailed hydrodynamic modeling of other bipolar pre-PNe and young PNe (Balick et al., 2019). Although both NW and SE breakout lobe structures are detected in far-UV imaging (Kameswara Rao et al., 2018), the SE counterpart to the “gap” wedge is harder to discern in the WFC3 images (Fig. 9).
6 The central star: deepening enigma
6.1 The imposter lurking near the core of NGC 6302
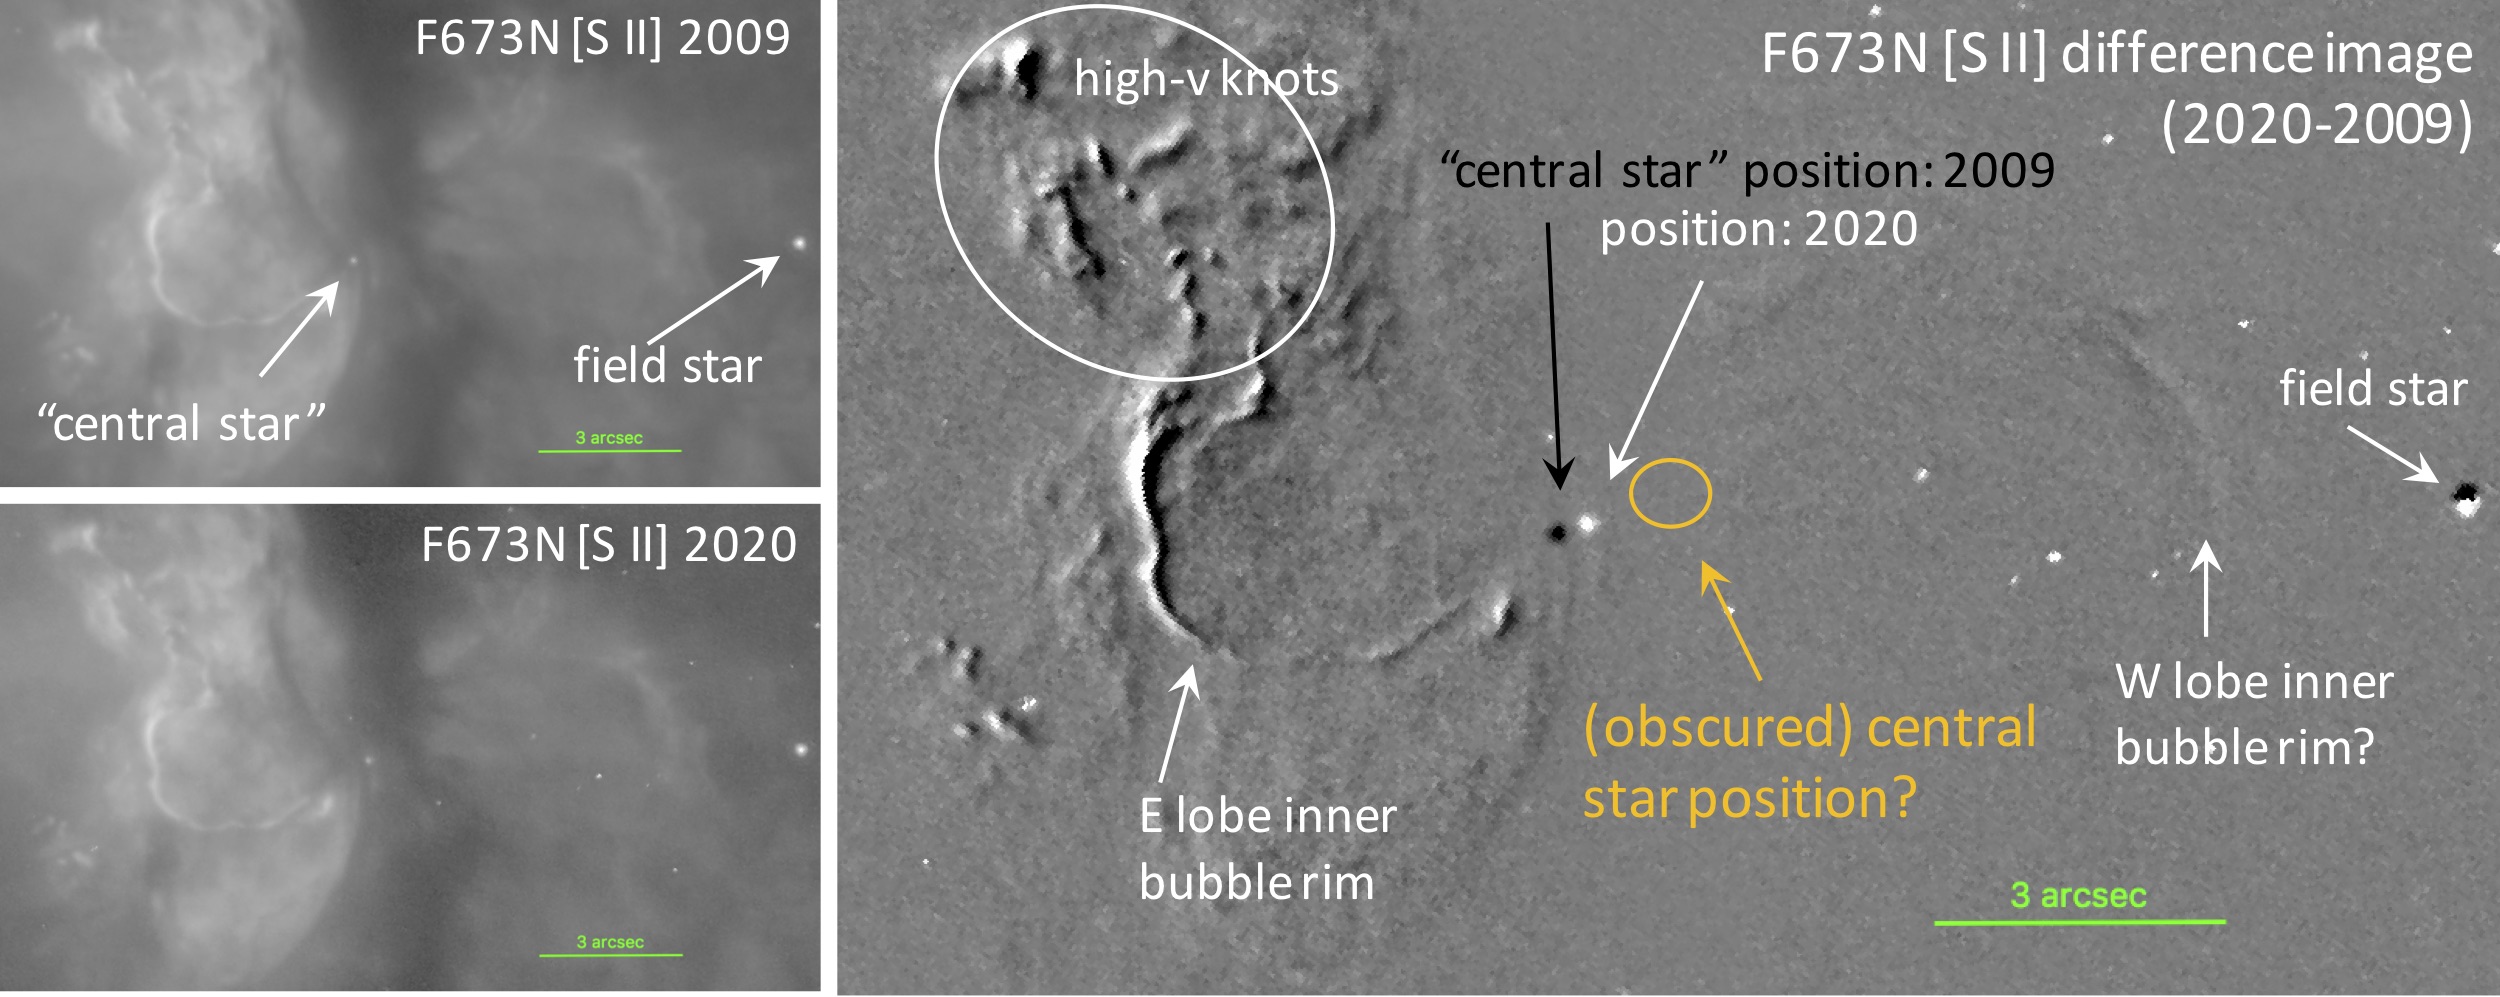
As previously noted, we defer analysis of difference images obtained from multi-epoch HST/WFC3 imaging to a future paper. However, we report here on a striking result that is immediately apparent from a difference image obtained from subtracting the previous (2009) F673N image from our new (2020) F673N image. The former WFC3 F673N image was used to identify a star, located near the intersection of the nebula’s waist and its symmetry axis, as the CSPN of NGC 6302 (Szyszka et al., 2009). The central region of the 2009 and 2020 F673N images and the 20202009 F673N difference image is presented in Fig. 11. It is immediately apparent that the star that was identified as the CSPN in the first-epoch (2009) WFC3 images in fact shows significant proper motion (PM). Specifically, we measure a position of (RA, dec) 17:13:44.3632, 37:06:12.774 for this star at the epoch of the 2020 March 13 HST/WFC3 imaging, vs. 17:13:44.3883, 37:06:12.874 on 2009 July 27. This offset (0.37′′) translates to a PM of 35 mas yr-1 at position angle 285∘. This PM is larger than that measured for any other field star in the F673N image; all other field stars have PMs 10 mas yr-1 (an example appears at the far right of the frame in Fig. 11). Furthermore, these small field star PMs are directed randomly, as expected for accurate astrometric alignment. At kpc, our adopted distance to NGC 6302, the PM measured for the putative central star identified by Szyszka et al. (2009) would translate to a projected velocity of nearly 200 km s-1 directed transverse to the equatorial plane of the system. This is a physically implausible velocity both for the CSPN of NGC 6302 or for a putative binary companion.
We conclude that the star previously identified as the central star of NGC 6302 is, in fact, unrelated to the nebula. Furthermore, while it is apparent from the prominence of this star in our near-IR WFC3 images that it is quite red, various lines of evidence indicate that this star is most likely a foreground, as opposed to background, field star (the star’s parallax cannot be determined by Gaia, due to NGC 6302’s bright core line emission). From our 0.67 m (F673N), 1.1 m (F110W), and 1.6 m (F160W) images, we obtain magnitudes of 19.670.07, 16.740.02, and 16.150.02, respectively. For distances between 250 pc and 1 kpc, the reddening along the line of sight to NGC 6302 is (Lallement et al., 2019), suggesting the dereddened F673N, F110W, and F160W magnitudes are approximately 18.9, 16.5, and 16.0, respectively (Cardelli et al., 1989). Assuming the field star is on the main sequence, these F673NF110W and F110WF160W colors (2.4 and 0.5 mag, respectively) indicate an early-M spectral type (Pecaut & Mamajek, 2013). We then (crudely) estimate a distance in the range 500–750 pc. The PM magnitude corresponds to a space velocity of 85 km s-1 at 500 pc, suggesting that the star may be a high-velocity (possibly Pop II) dwarf. While it is possible the star is instead a cool giant that lies well behind the nebula, and is hence reddened by the dust in the central torus region, this seems unlikely, given the space velocity would then be 200 km s-1. Furthermore, we measure the same flux for the star (to within 10%) in the two F673N images, despite its (projected) position deeper within the dark lane in the 2020 image. If this were a background star, one might have expected to observe a measureable change in brightness (most likely, a dimming).
6.2 Implications for the properties of the central star and its progenitor
It is truly an unfortunate coincidence that a foreground star displaying the largest PM of any field star in the F673N image field of view is seen projected so near the geometric center (waist) of the bipolar nebula NGC 6302. Obviously it is necessary to discard previous deductions concerning the properties of the central star of NGC 6302 that were based, directly or indirectly, on the properties of this interloping field star. In particular, conclusions concerning the extinction toward the CSPN and the present-day CSPN mass that were based on its apparent direct detection by HST (such as the estimates obtained by Szyszka et al., 2009; Wright et al., 2011) are certainly not reliable. Fortunately, however, most literature determinations of the central star’s luminosity and effective temperature — including those in Szyszka et al. (2009) and Wright et al. (2011) — are based on the total luminosity and excitation of the nebular emission, as opposed to the visible-wavelength photospheric properties of the field star that, we now know, is merely seen in projection toward the nebula’s dark lane.
The newly established absence of the central star in HST imaging also then begs the question: Where, in fact, is the central star of NGC 6302? Obviously it is essential to answer this question, given that all the available evidence points to the likelihood that this object is descended from a star that pushed the upper envelope of plausible PN progenitor masses. In particular, the HST/WFC3 images confirm, and further elaborate on, the findings of Rauber et al. (2014) that the [N ii]/H ratios of the lobe clumps are unusually high ([N ii]/H 10; §4.2). This supports previous abundance analyses establishing that both N/H and N/O are very large in NGC 6302 (i.e., super-solar by factors of 10 and 200, respectively; Milingo et al., 2010; Rauber et al., 2014), and strongly suggests that the clumps were ejected by a massive, N-enriched central AGB star (Karakas & Lugaro, 2016). This inference is consistent with the (large) estimated luminosity and effective temperature of the present-day central star (i.e., , adopting kpc, and kK; Wright et al., 2011). NGC 6302 is also among the most massive known PNe, with total gas mass estimates ranging from 0.5 (Dinh-V-Trung et al., 2008) to 3.5 (Wright et al., 2011, where this latter estimate has also been corrected for our adopted distance of kpc). Estimates of the gas mass in the central torus region alone range from 0.1 (Dinh-V-Trung et al., 2008; Santander-García et al., 2017) to as high as 3 (Matsuura et al., 2005, but see discussion in Dinh-V-Trung et al. 2008).
One potential clue to the location of the CSPN is offered by the F673N difference image (Fig. 11). Specifically, the east lobe shows a rapidly expanding inner arc or rim of length 20′′ that is suggestive of the leading edge of a bubble-like structure. There appears to be a faint counterpart to this expanding arc structure within the west lobe. If this pair of high-proper-motion, bubble-like features was produced by simultaneous, oppositely directed mass ejections, then the star could lie at their midpoint. As indicated in Fig. 11, these inner shell features thus suggest the central star is actually located well to the west of the foreground field star, right at the heart of the nebula’s central dark lane/torus, at a position of (RA, dec) 17:33:44.30, 37:06:12.2 (where this estimate of the midpoint of the rims of the bubble-like features has an uncertainty of 0.5′′). A system of high-PM knots, apparent in the F673N difference image (see Fig. 11), appears to emanate from near this same position. No point source is detected at this position in our HST/WFC3 images, however — even in the near-IR (at wavelengths as long as 1.6 m) — suggesting that (see discussion in Wright et al., 2011). In future work, we will test this predicted central star position, via determination of the expansion center of the nebula as well as analysis of archival ALMA data (Santander-García et al., 2017).
6.3 What happened at the core of NGC 6302?
All of the preceding lines of evidence — NGC 6302’s highly elevated N/H abundance ratio, the large luminosity and effective temperature of its central star, and its large inferred nebular mass — support the hypothesis that the present-day NGC 6302 nebula was generated by a star of initial mass 5–8 . Such a star represents the upper end of the progenitor mass range that can generate a PN, as opposed to exploding as a supernova. Apparently the bulk of the mass of this behemoth of a progenitor star was ejected over the past 2000–5000 yr (Meaburn et al., 2008; Santander-García et al., 2017), implying a mass loss rate exceeding yr-1. This would far surpass the mass loss rates typically observed for even the most luminous AGB stars (Höfner & Olofsson, 2018). Furthermore, models predict that the evolutionary timescales of PN central stars as massive, luminous, and hot as the CSPN of NGC 6302 are on the order of centuries (e.g., Miller Bertolami, 2016). It is hence clear that — as has been previously speculated by various investigators over the past four decades (e.g., Aller et al., 1981; Meaburn et al., 2008; Wright et al., 2011; Szyszka et al., 2011) — we are likely witnessing NGC 6302 at a key, highly transient evolutionary period immediately following a highly disruptive event, or perhaps series of events, in the recent history of its central star system. Use of the term “central star system” in this context is intentional (and essential) since, as noted in the Introduction, generation of pronounced bipolar structure, as observed in NGC 6302, most likely ultimately requires the presence of a close binary companion to the PN central star555Intriguingly, Feibelman (2001) identified excess UV continuum and Mg ii emission from the central region of NGC 6302, and commented that these emission sources were suggestive of the presence of a G-type companion to the central star..
Combining the qualitative analysis presented in §5 with the results of previous investigations of the structure and kinematics of NGC 6302, there is evidence that distinct episodes of such interacting-binary-influenced mass loss have led to the nebula we presently observe. Specifically, the dusty, molecule-rich torus that defines the equatorial plane of the system was evidently ejected, at low speed (10 km s-1), 5000–7500 years prior to the present observing epoch (Peretto et al., 2007; Santander-García et al., 2017). The N-rich clumps within the nebular lobes were then ejected in a dense but faster (100 km s-1) bipolar wind that was initiated some 3000 years after the ejection of the equatorial torus (Szyszka et al., 2011). The ejection of these lobe clump structures was accompanied or closely followed by much faster (600 km s-1) winds along the “gap” and (possibly) “amorphous” directions (see Fig. 9); the (2000–2500 yr) dynamical ages of these far larger lobe/jet structures (Meaburn et al., 2008)666Kameswara Rao et al. (2018) deduce dynamical ages of 10 kyr for the UV-imaged lobe/jet structures on the basis of an assumed outflow velocity of 160 km s-1, a factor 4 smaller than measured for the extended NW lobe structure of NGC 6302 (Meaburn et al., 2005). are similar to that of the ejection timescale of the lobe clumps. Our new HST/WFC3 imaging detection of extensive [Fe ii]-emitting shocks along the lobe walls and, to a lesser extent, within the “clump” and “amorphous” regions of the lobes has now revealed that this most recent stage of fast (100 km s-1) winds — i.e., collimated and, possibly, precessing outflows from the putative binary system at NGC 6302’s core region — is ongoing. Finally, we note that, according to models that simulate the formation of bipolar PNe, the foregoing episodes of directed mass loss likely would have been preceded by a sustained period of more or less isotropic AGB mass loss at lower rates (Lee & Sahai, 2003; Huarte-Espinosa et al., 2012; Balick et al., 2019). The extant data do not provide any direct evidence of this phase of quiescent mass loss, though they also do not rule out such a phase.
Development of a self-consistent physical model of the rapid evolution of NGC 6302 that can account for all of these structural and kinematic elements is beyond the scope of this paper. We instead briefly consider two models, both involving interacting binary systems, that have been proposed to lead to abruptly transformative episodes during late (AGB) evolutionary stages of the primary star (the first of which having been proposed to apply specifically to NGC 6302, among other nebulae): (1) a so-called intermediate luminosity optical transient (ILOT) event, and (2) onset of common envelope evolution.
Soker & Kashi (2012) have hypothesized that NGC 6302 and a handful of similarly extreme bipolar nebulae may have undergone ILOT events, during which much of the mass in their bipolar lobes was ejected. Such ILOTs, which are intermediate in luminosity between novae and supernovae, have been observed in a few extragalactic sources and luminous blue variables (LBVs). Soker & Kashi (2012) point out that the kinetic energy represented by the lobes of NGC 6302 is similar to the former class of eruptive object, whose members (collectively) lie along a “stripe” of energy-timescale parameter space connecting them to LBVs. In relating NGC 6302 to ILOT sources, they describe a scenario in which an AGB star with a main-sequence companion in a (possibly eccentric) few-au orbit undergoes short-lived, binary-interaction-driven phases of instability, during which the AGB star is prone to lose mass at high rates. Soker & Kashi (2012) speculate that, prior to the ILOT episode, an interaction of the AGB star and companion (involving no Roche Lobe overflow) resulted in the formation of the NGC 6302 equatorial torus. Subsequently — a few yr after torus formation, given the “timeline” of NGC 6302’s mass loss episodes described above — a second binary encounter, or series of encounters over a 100 yr period, led to Roche Lobe overflow. As a result, some fraction of the mass ejected during this second encounter was captured in an accretion disk around the companion, leading to the formation of transient, accretion-powered jets. The resulting ILOT then generated the bipolar lobes over this same relatively short period.
If this ILOT-based model indeed describes the formation of NGC 6302, then it would remain to explain the presence of the extensive (0.3 pc-scale), point-symmetric regions of active shocks in the nebula that have now been revealed by our 1.64 m [Fe ii] imaging (Fig 2). That is, if these [Fe ii]-emitting shocks and the many other point-symmetric features within this nebula that are apparent in our imaging and in various previous imaging studies of this nebula (e.g., Szyszka et al., 2011; Kameswara Rao et al., 2018) are generated by (possibly precessing) jets from a binary companion’s accretion disk, then clearly the resulting wind interactions that have shaped NGC 6302 are ongoing. Furthermore, the region of NGC 6302 within 20′′ of the central dark lane (faint circle in Fig. 9) features a system of nested bubbles and knots with large PMs, oriented at a range of PAs, that appear to emanate from the presumed position of the CSPN (Fig. 11). This (presumably) younger, “multipolar” core region somewhat resembles the complex cores of the bipolar nebulae Hubble 5 and NGC 2440 (Corradi & Schwarz, 1993; Lago & Costa, 2016). All of the above features of the nebula suggest that accretion processes are still active in the central binary system within NGC 6302.
Alternatively, it is possible that NGC 6302 is the result of the onset of a common envelope (CE) stage in the evolution of a close binary system, a scenario also considered by Kameswara Rao et al. (2018). Recent simulations have shown that such a CE event can result in formation of a dense toroidal structure, which can in turn serve as an effective collimator for a subsequent fast wind from the central, merged binary remnant (García-Segura et al., 2018; Zou et al., 2020). This configuration results in simulated bipolar nebulae with structural features (i.e., torus, lobes, shocks) that overall resemble those observed in NGC 6302. However, as noted, the generation of large outer lobe structures and point-symmetry that characterize NGC 6302 likely requires pre-existing and ongoing jet activity, respectively, which in turn points to the influence of binary interactions prior to and following the common envelope phase (see García-Segura et al., 2018).
7 Summary and Conclusions
We have presented the results of a comprehensive, near-UV-to-near-IR Hubble Space Telescope WFC3 imaging study of the young planetary nebula (PN) NGC 6302, the archetype of the class of extreme bi-lobed, pinched-waist PNe that are rich in dust and molecular gas. The new WFC3 emission-line image suite clearly defines the dusty toroidal equatorial structure that bisects NGC 6302’s polar lobes, and the fine structures (clumps, knots, and filaments) within the lobes. The most striking and unexpected aspect of the new WFC3 image suite is the bright, S-shaped 1.64 m [Fe ii] emission that traces the southern interior of the east lobe rim and the northern interior of the west lobe rim, in point-symmetric fashion, which we interpret as a zone of shocks caused by ongoing, fast (100 km s-1), collimated winds from NGC 6302’s central star(s).
The [Fe ii] emission zone represents one of a handful of regions beyond 20′′ from the central dark lane that appear as distinct azimuthal zones (wedges) within the nebula. In addition to the [Fe ii] zone, these wedges comprise a region featuring dense knots with outward facing features and tails along the nebular symmetry axis; a dark wedge with traces of dust-scattered light along the nebular minor axis; and a zone with radial streaks or amorphous structure in between. The boundaries between these wedge-shaped regions are marked by strong azimuthal gradients in nebular ionization structure.
These new (2019+2020) WFC3 images also reveal that the object previously identified as NGC 6302’s central star (on the basis of 2009 HST/WFC3 imaging) is in fact a foreground field star. We propose that a pair of bubble-like features in the nebula’s core region instead likely pinpoints the central star’s actual position within the nebula’s dusty central torus. The available evidence indicates that this star is descended from a progenitor near the upper end of the mass range that could generate a PN, as opposed to exploding as a supernova.
The features revealed by our panchromatic HST/WFC3 images of NGC 6302 — in particular, its distinct azimuthal structural zones and nested bubble system, and the surprising misalignment of the central engine’s present collimated fast wind direction (as traced by 1.64 m [Fe ii] emission) and the nebula’s main axis of symmetry (as defined by its dusty molecular torus, polar-axis clump system, and outer lobe walls) — presents an especially daunting challenge for models of the origin and evolution of bipolar structures in PNe. The presence of an interacting binary companion to the central former AGB star, leading to formation of a disk/jet system, appears to be a requirement of such a model. It may be impossible to establish whether one star or two stars now lie at the core of NGC 6302, given the enormous extinction to and luminosity of its central star system. Nonetheless, additional observations that can pinpoint the central star(s) are clearly warranted. In particular, subarcsecond-resolution observations in the mid-IR (JWST) and submm (ALMA) should lead to far more stringent constraints on both the position and energetics of the central powering source of this enigmatic nebula.
References
- Akashi & Soker (2018) Akashi, M., & Soker, N. 2018, MNRAS, 481, 2754
- Alexander & Balick (1997) Alexander, J., & Balick, B. 1997, AJ, 114, 713
- Aller et al. (1981) Aller, L. H., Ross, J. E., Omara, B. J., & Keyes, C. D. 1981, MNRAS, 197, 95
- Ashley & Hyland (1988) Ashley, M. C. B., & Hyland, A. R. 1988, ApJ, 331, 532
- Bachiller et al. (1997) Bachiller, R., Forveille, T., Huggins, P. J., & Cox, P. 1997, A&A, 324, 1123
- Balick & Frank (2002) Balick, B., & Frank, A. 2002, ARA&A, 40, 439
- Balick et al. (2019) Balick, B., Frank, A., & Liu, B. 2019, ApJ, 877, 30
- Balick et al. (2018) Balick, B., Frank, A., Liu, B., & Corradi, R. 2018, ApJ, 853, 168
- Bally et al. (2015) Bally, J., Ginsburg, A., Silvia, D., & Youngblood, A. 2015, A&A, 579, A130
- Bublitz et al. (2019) Bublitz, J., Kastner, J. H., Santander-García, M., et al. 2019, A&A, 625, A101
- Bujarrabal et al. (2001) Bujarrabal, V., Castro-Carrizo, A., Alcolea, J., & Sánchez Contreras, C. 2001, A&A, 377, 868
- Cardelli et al. (1989) Cardelli, J. A., Clayton, G. C., & Mathis, J. S. 1989, ApJ, 345, 245
- Casassus et al. (2000) Casassus, S., Roche, P. F., & Barlow, M. J. 2000, MNRAS, 314, 657
- Casassus et al. (2002) Casassus, S., Roche, P. F., Barlow, M. J., & Binette, L. 2002, in Revista Mexicana de Astronomia y Astrofisica Conference Series, Vol. 12, Revista Mexicana de Astronomia y Astrofisica Conference Series, ed. W. J. Henney, J. Franco, & M. Martos, 132–133
- Chen et al. (2017) Chen, Z., Frank, A., Blackman, E. G., Nordhaus, J., & Carroll-Nellenback, J. 2017, MNRAS, 468, 4465
- Corradi & Schwarz (1993) Corradi, R. L. M., & Schwarz, H. E. 1993, A&A, 269, 462
- Corradi & Schwarz (1995) Corradi, R. L. M., & Schwarz, H. E. 1995, A&A, 293, 871
- De Marco & Izzard (2017) De Marco, O., & Izzard, R. G. 2017, PASA, 34, e001
- Dinh-V-Trung et al. (2008) Dinh-V-Trung, Bujarrabal, V., Castro-Carrizo, A., Lim, J., & Kwok, S. 2008, ApJ, 673, 934
- Feibelman (2001) Feibelman, W. A. 2001, ApJ, 550, 785
- Forbes & Ward (1993) Forbes, D. A., & Ward, M. J. 1993, ApJ, 416, 150
- García-Segura et al. (2018) García-Segura, G., Ricker, P. M., & Taam, R. E. 2018, ApJ, 860, 19
- Gómez-Gordillo et al. (2020) Gómez-Gordillo, S., Akras, S., Gonçalves, D. R., & Steffen, W. 2020, MNRAS, 492, 4097
- Groves et al. (2002) Groves, B., Dopita, M. A., Williams, R. E., & Hua, C.-T. 2002, PASA, 19, 425
- Hartigan et al. (1994) Hartigan, P., Morse, J. A., & Raymond, J. 1994, ApJ, 436, 125
- Höfner & Olofsson (2018) Höfner, S., & Olofsson, H. 2018, A&A Rev., 26, 1
- Huarte-Espinosa et al. (2012) Huarte-Espinosa, M., Frank, A., Balick, B., et al. 2012, MNRAS, 424, 2055
- Huggins et al. (1996) Huggins, P. J., Bachiller, R., Cox, P., & Forveille, T. 1996, A&A, 315, 284
- Huggins et al. (2005) Huggins, P. J., Bachiller, R., Planesas, P., Forveille, T., & Cox, P. 2005, ApJS, 160, 272
- Jones & Boffin (2017) Jones, D., & Boffin, H. M. J. 2017, Nature Astronomy, 1, 0117
- Kameswara Rao et al. (2018) Kameswara Rao, N., De Marco, O., Krishna, S., et al. 2018, A&A, 620, A138
- Karakas & Lugaro (2016) Karakas, A. I., & Lugaro, M. 2016, ApJ, 825, 26
- Kastner et al. (2020) Kastner, J. H., Bublitz, J., Balick, B., et al. 2020, Galaxies, 8, 49
- Kastner et al. (1996) Kastner, J. H., Weintraub, D. A., Gately, I., Merrill, K. M., & Probst, R. G. 1996, ApJ, 462, 777
- Kastner et al. (2012) Kastner, J. H., Montez, R., J., Balick, B., et al. 2012, AJ, 144, 58
- Kemper et al. (2002) Kemper, F., Molster, F. J., Jäger, C., & Waters, L. B. F. M. 2002, A&A, 394, 679
- Keohane et al. (2007) Keohane, J. W., Reach, W. T., Rho, J., & Jarrett, T. H. 2007, ApJ, 654, 938
- Kwitter et al. (2014) Kwitter, K. B., Méndez, R. H., Peña, M., et al. 2014, Rev. Mexicana Astron. Astrofis., 50, 203
- Kwok et al. (1978) Kwok, S., Purton, C. R., & Fitzgerald, P. M. 1978, ApJ, 219, L125
- Lago & Costa (2016) Lago, P. J. A., & Costa, R. D. D. 2016, Rev. Mexicana Astron. Astrofis., 52, 329
- Lago et al. (2019) Lago, P. J. A., Costa, R. D. D., Faúndez-Abans, M., & Maciel, W. J. 2019, MNRAS, 489, 2923
- Lallement et al. (2019) Lallement, R., Babusiaux, C., Vergely, J. L., et al. 2019, A&A, 625, A135
- Lee & Sahai (2003) Lee, C.-F., & Sahai, R. 2003, ApJ, 586, 319
- Livio et al. (1979) Livio, M., Salzman, J., & Shaviv, G. 1979, MNRAS, 188, 1
- López et al. (2012) López, J. A., Richer, M. G., García-Díaz, M. T., et al. 2012, Rev. Mexicana Astron. Astrofis., 48, 3
- Matsuura et al. (2005) Matsuura, M., Zijlstra, A. A., Molster, F. J., et al. 2005, MNRAS, 359, 383
- McCoey et al. (2004) McCoey, C., Giannini, T., Flower, D. R., & Caratti o Garatti, A. 2004, MNRAS, 353, 813
- Meaburn et al. (2008) Meaburn, J., Lloyd, M., Vaytet, N. M. H., & López, J. A. 2008, MNRAS, 385, 269
- Meaburn et al. (2005) Meaburn, J., López, J. A., Steffen, W., Graham, M. F., & Holloway, A. J. 2005, AJ, 130, 2303
- Milingo et al. (2010) Milingo, J. B., Kwitter, K. B., Henry, R. B. C., & Souza, S. P. 2010, ApJ, 711, 619
- Miller Bertolami (2016) Miller Bertolami, M. M. 2016, A&A, 588, A25
- Molster et al. (2001) Molster, F. J., Lim, T. L., Sylvester, R. J., et al. 2001, A&A, 372, 165
- Morris (1987) Morris, M. 1987, PASP, 99, 1115
- O’dell & Handron (1996) O’dell, C. R., & Handron, K. D. 1996, AJ, 111, 1630
- Osterbrock & Ferland (2006) Osterbrock, D. E., & Ferland, G. J. 2006, Astrophysics of gaseous nebulae and active galactic nuclei
- Pecaut & Mamajek (2013) Pecaut, M. J., & Mamajek, E. E. 2013, ApJS, 208, 9
- Peretto et al. (2007) Peretto, N., Fuller, G., Zijlstra, A., & Patel, N. 2007, A&A, 473, 207
- Raga et al. (2008) Raga, A. C., Riera, A., Mellema, G., Esquivel, A., & Velázquez, P. F. 2008, A&A, 489, 1141
- Rauber et al. (2014) Rauber, A. B., Copetti, M. V. F., & Krabbe, A. C. 2014, A&A, 563, A42
- Sahai et al. (2011) Sahai, R., Morris, M. R., & Villar, G. G. 2011, ApJ, 141, 31
- Sahai & Trauger (1998) Sahai, R., & Trauger, J. T. 1998, AJ, 116, 1357
- Santander-García et al. (2017) Santander-García, M., Bujarrabal, V., Alcolea, J., et al. 2017, A&A, 597, A27
- Schoenberner (1986) Schoenberner, D. 1986, A&A, 169, 189
- Schönberner et al. (2018) Schönberner, D., Balick, B., & Jacob, R. 2018, A&A, 609, A126
- Soker (2004) Soker, N. 2004, New A, 9, 399
- Soker & Kashi (2012) Soker, N., & Kashi, A. 2012, ApJ, 746, 100
- Soker & Livio (1994) Soker, N., & Livio, M. 1994, ApJ, 421, 219
- Speck et al. (2003) Speck, A. K., Meixner, M., Jacoby, G. H., & Knezek, P. M. 2003, PASP, 115, 170
- Szyszka et al. (2009) Szyszka, C., Walsh, J. R., Zijlstra, A. A., & Tsamis, Y. G. 2009, ApJ, 707, L32
- Szyszka et al. (2011) Szyszka, C., Zijlstra, A. A., & Walsh, J. R. 2011, MNRAS, 416, 715
- Wright et al. (2011) Wright, N. J., Barlow, M. J., Ercolano, B., & Rauch, T. 2011, MNRAS, 418, 370
- Zou et al. (2020) Zou, Y., Frank, A., Chen, Z., et al. 2020, MNRAS, 497, 2855