Supplemental Material for “Intrinsic nature of spontaneous magnetic fields in superconductors with time-reversal symmetry breaking”
I Methods
I.1 Density functional theory
To identify the muon stopping sites and to evaluate the effect of the implanted muon on the host system, we carried out a suite of plane-wave basis-set density functional theory (DFT) calculations. Calculations on rhenium, LaNiC2 and Re6Zr were carried out using castep [1], whereas calculations on Sr2RuO4, SrPtAs and Zr3Ir were carried out using Quantum ESPRESSO [2, 3]. In all cases, we work within the generalized-gradient approximation (GGA) using the PBE functional [4]. The system is treated as non-spin-polarized, unless specified otherwise. In this section we outline the series of calculations that were applied to each of the materials in this study.
The first step of our procedure is to obtain the muon stopping sites using a structural relaxation approach. In this approach, initial structures comprising the material and an implanted muon (represented by a hydrogen pseudopotential) are allowed to relax until the changes in the total energy and forces are fall below a convergence threshold. For all of our calculation carried out using castep, structures are allowed to relax until forces on the atoms were all eV Å-1 and the total energy and atomic positions converged to eV per atom and Å, respectively. For calculations using quantum espresso the atomic relaxations through force and energy minimization were performed with the threshold for the forces and total energy set to 10-3 Ry/a.u and 10-4 Ry, respectively. This approach requires the use of supercells in order to minimise the spurious self-interaction of the muon that results from the periodic boundary conditions. Initial muon positions can be either inferred from the minima of the electrostatic potential for the host crystal (which is likely to be a stable position for the positive ) or obtained from by sampling the space within the unit cell. The symmetry of the host crystal can be used to reduce the number of initial positions that need to be sampled. Low-energy relaxed structures provide candidate muon stopping sites and also allow us to assess the significance of any structural distortions induced by the muon on its local environment.
After obtaining the muon site and assessing whether the presence of the muon leads to significant structural distortions we proceed to study its effect on the local electronic structure. We do this by calculating the projected density of states (PDOS) for the system for supercells with or without the muon. Projections were made onto each of the atoms, each of the angular momentum channels, and, in select cases, according to the magnetic quantum number. This allows us to see where the electronic state corresponding to the muon sits relative to the Fermi energy and also to assess the possible impact of the muon on the DOS of the other species near the Fermi energy.
I.2 Defect formation energies
Defect formation energies, , are commonly calculated for semiconductors using DFT [5, 6], as obtaining this quantity enables the calculation of important properties such as defect concentrations. Here, we use this formalism to compare the energetics of muon sites across the various materials included in our study. The defect formation energy of a defect of charge is given by
| (1) |
where and are the total energies of the host+defect supercells and host-only supercells respectively, is the Fermi energy of the host cell, and is the number of atoms of species removed, with reference chemical potential . We have calculated for the addition of , for which and . We take the reference state of to be muonium, which is chemically equivalent to a hydrogen atom. We therefore use eV, obtained from a castep calculation on an isolated hydrogen atom. The resulting values of for select sites are given in Table 1 in the main text. Note that, within each material, the differences in defect formation energies are solely due to differences in . However, the defect formation energy allows us to compare the energetics of sites belonging to different materials, which cannot be done using total energies of the host+defect supercells alone.
I.3 Van Vleck relaxation rates
To reconcile the calculated muon sites with the measured spectra we computed the expected relaxation rate for the site from the the van Vleck second moment in the limit of strong quadrupolar splitting [7]. In a zero-field experiment this formalism predicts a relaxation rate given by
| (2) |
with
| (3) |
where the nucleus at site at a distance from the muon site has nuclear spin and a nuclear gyromagnetic ratio . The nuclear gyromagnetic ratio , where is the nuclear magneton and the -factor is related to the nuclear magnetic moment via . The factor for integer spin , but for half-integer spin is instead given by
| (4) |
Because the expression for in Eq. (2) is a linear combination of the contributions from each of the nuclei in the system, we can include the effects of the muon-induced distortions on the relaxation rate due to changes in by calculating
| (5) |
The relaxation rate is obtained using the ionic positions from the relaxed cell including the muon, whereas is calculated from a cell of the same size that does not include a the distortions associated with the implanted muon. It is assumed that the significant displacements do not extend beyond the boundaries of the simulation cell and hence the contribution from nuclei at larger distances from the muon site are calculated from an undistorted structure comprising several unit cells in each direction to obtain . Note that this relaxation rate converges very quickly with system size due to the factor of in .
The linearity of Eq. (2) also allows us to straightforwardly deal with different isotopes. Consider a nucleus of species with multiple isotopes each having nuclear spins , moments , and natural abundances . Experimentally, each muon at a given crystallographically distinct site would see one of many possible configurations of isotopes. However, for an ensemble containing a large number of muons, the linearity of Eq. (2) makes the summation over all possible configurations very straightforward, yielding the result
| (6) |
II Calculations and muon site details
Below we give parameters and computational methods used in each of the computations discussed in the main paper. We also provide some further details of the muon position and computed electronic structure specific to each of the materials.
II.1 Rhenium
Rhenium crystallizes in the centrosymmetric hexagonal 63/ space group with Å and Å [8]. We used a plane-wave cutoff energy of 600 eV and a Monkhorst-Pack grid [9] for Brillouin zone integration, resulting in total energies that converge to 0.002 eV per cell. The unit cell was allowed to relax and we obtain optimised lattice parameters Å and Å, which are within 0.5% of the experimental values. We used the DFT-optimized lattice parameters and ionic positions in all subsequent calculations.
Structural relaxations were carried out on a supercell comprising conventional unit cells of Re to reduce the unphysical interaction of the muon and its periodic images. Due to the enlarged unit cell, we instead used a Monkhorst-Pack grid [9] for these calculations. Initial structures comprising a muon and the Re supercell were generated by requiring the muon to be at least 0.25 Å away from each of the muons in the other structures generated (including their symmetry equivalent positions) and at least 1.0 Å away from any of the atoms in the cell. This resulted in 19 structures which were subsequently allowed to relax.
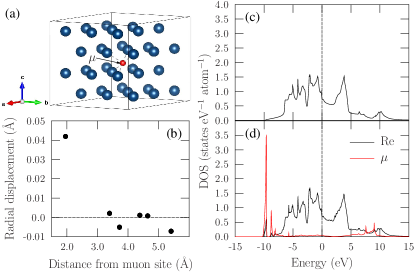
These structural relaxations yield two crystallographically distinct muon stopping sites, summarized in Table. 1 in the main text. In the lowest energy site [Fig. S1(a)] the muon is octahedrally coordinated by Re atoms, with Re– distances of 2.0 Å. The displacements due to this site are small, with Re atoms in the coordination octahedron each being repelled by around 0.04 Å away from the muon. We find a second crystallographically distinct site, 0.50 eV higher in energy, where the muon is instead tetrahedrally coordinated by Re atoms [see Fig. 1(a) in the main text]. The Re–Re distances along the edges of the base are 2.78 Å, whereas the distance between a vertex in the base and the apex is 2.75 Å. In the presence of a muon, the Re atoms in the base of the tetrahedron are repelled by 0.09 Å, whereas the Re atom at the apex is repelled by 0.15 Å. The muon is closer to the apical Re (1.77 Å) than it is to the Re atoms in the base of the tetrahedron (1.81 Å).
To investigate the possible effects of the implanted muon on the electronic structure of the system, we computed the density of states (DOS) with and without the muon, for both crystallographically distinct muon sites. We used a finer Monkhorst-Pack grid [9] for -point sampling in these calculations. For the octahedral site, we show the projected density of states (PDOS) for each of the species in the system for without and with an implanted muon in Figs. S1(c) and S1(d) respectively. We see that the DOS does not change significantly around the Fermi energy with the density of states due to the muon lying around eV below the Fermi energy. This is also true for the case of the tetrahedral site, as shown in Figs. 1(c) and 1(d) in the main text.
Finally, we examined the effect of the implanted muon on the charge states of the atoms in the host for both the octahedral and tetrahedral sites. This was done by integrating the charge (electron) density over spheres of various radii centered on a nearest-neighbour Re atom for the system with and without a muon. (For the tetrahedral site, the Re atom at the apex of the tetrahedron was chosen, as this is the closest to the muon.) The integral of the charge density for the pristine structure as a function of is shown in Fig. S2(a) and counts the number of valence electrons enclosed by the sphere (i.e. those electrons not removed through the use of pseudopotentials). The integrated difference in charge densities for each site , where is the electron density for the system containing a muon, is shown in Fig. S2(b). Each Re atom has 29 valence electrons, which are accounted for when using a radius of integration Å. At this radius, the sphere of integration for the system with a muon contains 0.02 more or 0.07 more electrons than for the case of the pristine system, for the octahedral and tetrahedral sites, respectively. This extra electron density is associated with the muon, rather than the Re atoms. A Mulliken population analysis instead shows that the nearest-neighbour Re atoms become slightly positive in both cases, with induced charges of +0.06 and +0.08 for the octahedral and tetrahedral sites, respectively. However, both approaches find that the magnitude of the change in the charge states is very small, as seen in Fig. S2(c), where the charge difference is expressed as a fraction of the total number of valence electrons enclosed by the sphere. The changes in the number of valence electrons are less than 0.4% of the initial number of electrons.
II.2
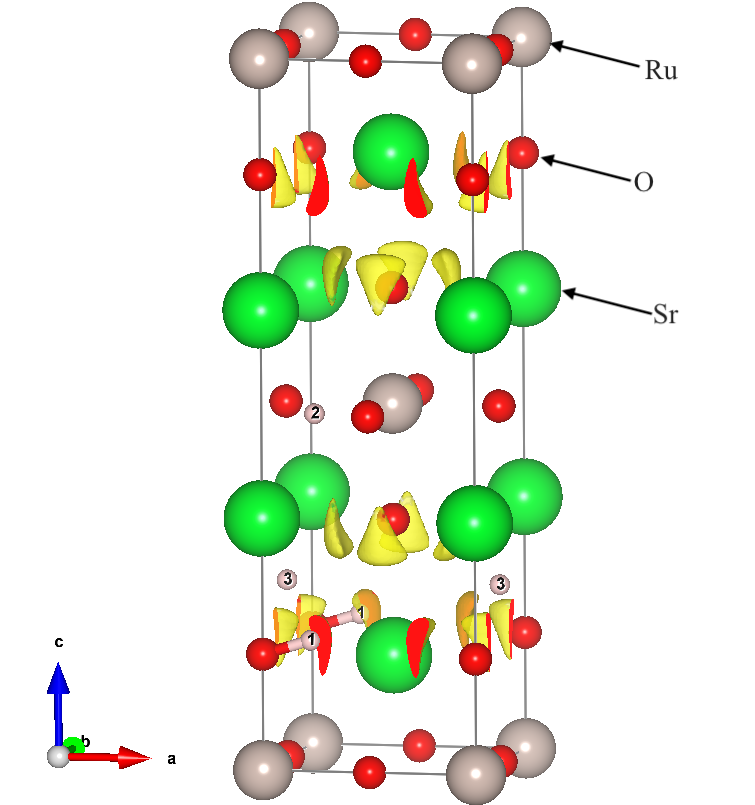
Sr2RuO4 crystallizes in the centrosymmetric space group. In this system, O4 atoms form an octahedral at the centre of a cube defined by Sr2 at the corners, while the Ru cation is at the center of the octahedral (see Fig. S3). The unit cell has lattice parameters 3.871 Å and Å, with Sr atoms occupying the 4e Wyckoff positions with fractional coordiantes (0, 0, 0.3538), Ru atoms at 2a with (0.0, 0.0, 0.0), one of the oxygen atoms (O1) at 4c with (0.0, 0.5, 0.0) and the other (O2) at 4e with (0.0, 0.0, 0.1630). In our calculations, the potential at the core was approximated using the optimized Norm-Conserving Vanderbilt (ONCV)[10] pseudopotential for Ru atoms and ultrasoft [11, 12] pseudopotential for the Sr and O atoms. The pseudopotential choices were made to allow for correct description of the 4 behaviour in Ru and to allow convergence of the self-consistent iteration. The cut-off for the plane waves and the charge density used are 70 Ry and 700 Ry respectively.
The trial starting positions for the muon are a grid of uniform positions, reduced by the space group symmetry to 24 inequivalent starting positions. Each of the trial starting muon position was modelled in a 331 supercell, containing 126 atoms. A Monkhorst-Pack grid of -points was used for the Brillouin zone sampling. The 24 final muon positions collapse into 3 inequivalent candidate positions when the total energies are considered, with all of the muon positions within each cluster being symmetry-equivalent. We report a representative candidate muon site belonging to each of the clusters in Table S1.
| Label | Site Position | (eV) |
|---|---|---|
| A | (0.225, 0.0, 0.184) | 0 |
| B | (0.233, 0.071, 0.5) | 0.97 |
| C | (0.0, 0.498, 0.249) | 1.61 |
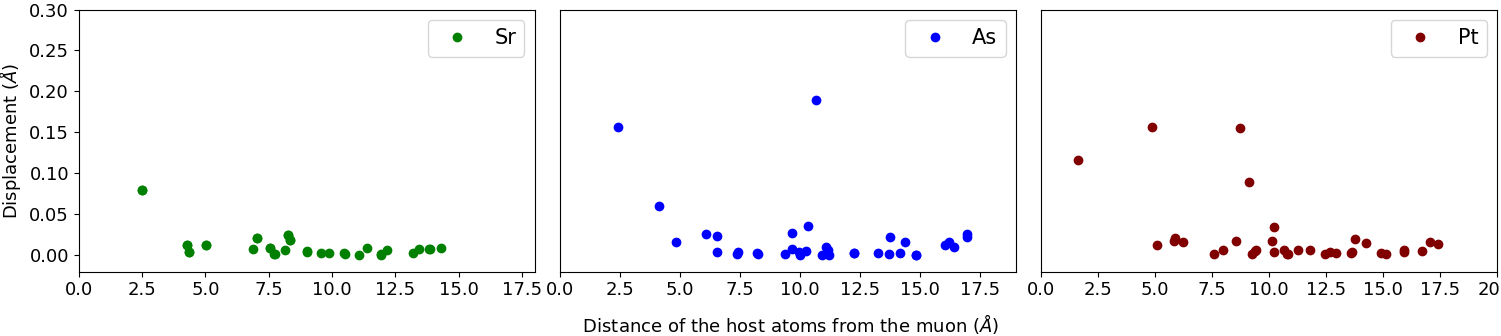
Muon site A is significantly lower in energy than sites B and C and is therefore likely the sole stopping site. The energy difference between A and B ( eV) is a conservative lower limit to the potential well depth for the muon in the A site. Since this is much larger that the typical muon zero point energy (0.5 eV), the quantum nature of the muon does not need to be considered here. Site A is shown in Fig. 2(a) in the main text, with the displacements of the Sr, Ru and O atoms as a function of their distance from the muon site shown in Fig. 2(b).
We considered further the effect of the implanted muon and its associated lattice distortion on the electronic structure by calculating its effect on the density of states (DOS). The DOS of Sr2RuO4 is that of a metal (similar to results in Ref. [14]) and the system remains metallic after the muon implantation [Fig. S4(a)]. To understand the orbital contribution to the DOS, a projection of the DOS to the different atomic orbitals was performed. Very close to the Fermi energy, the dominant contribution to the DOS are the Ru partial density of states (PDOS) with 4 character [see Fig. S4(a)], similar to LDA results in Ref. [15, 16]. We also see a hybridization between the Ru 4 states and O 2 states near the Fermi energy. These contributions are similar and do not show any significant changes after muon implantation.
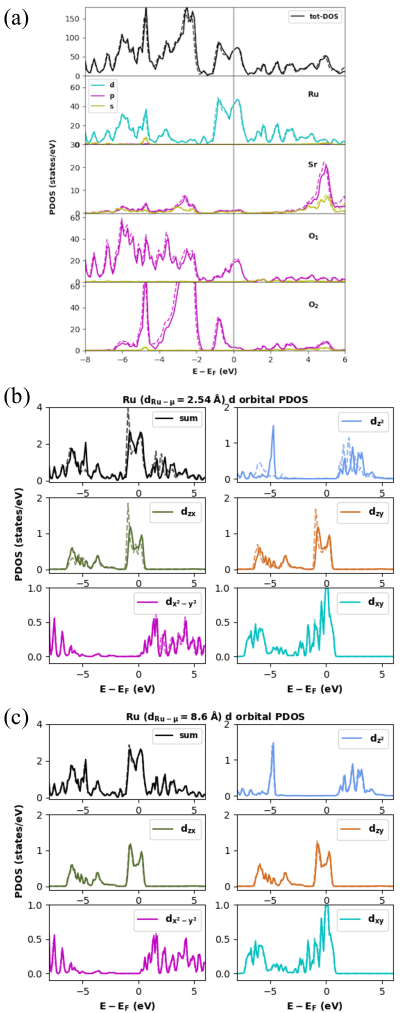
Further analysis of the 4 states show that the conduction holes are mostly contributed by the Ru 4, 4 and 4 PDOS [see Figs. S4(b) and S4(c)]. This is consistent with results obtained using the near-edge x-ray absorption and photoemission spectroscopy [17]. The effect of an implanted muon on the PDOS is demonstrated in Figs. S4(b) and S4(c), where the dotted lines represent the 4 states contributions due to Ru atoms closest to (2.54 Å) and far from (8.6 Å) the muon site, respectively. Small changes in the splitting of the states at the Fermi level are observed for the 4 and 4 states of the Ru atom close to the muon [Fig. S4(b)], but are not observed for the Ru atom far from the muon [Figs. S4(c)]. After summing all of the -state contributions of the Ru ions in the supercell, the small state splitting is no longer significant.
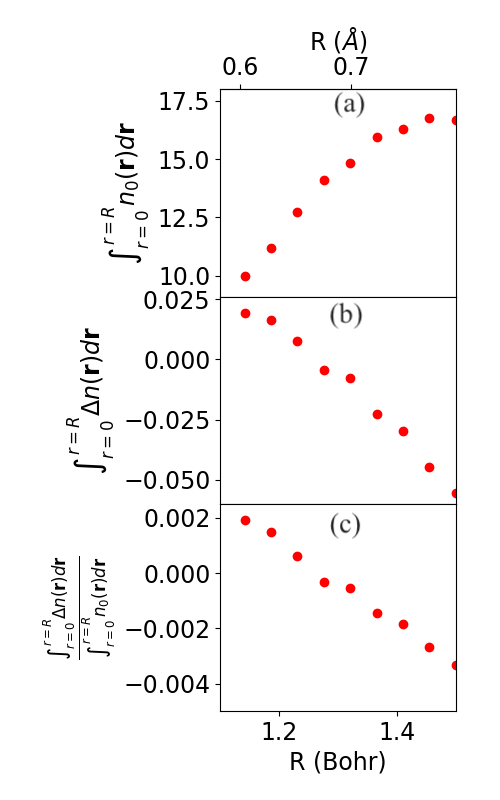
We investigated the effect of the implanted muon on the electron density in Sr2RuO4 using a similar approach as was used for rhenium. The spheres of integration were centered on Ru atom nearest the muon and the integrated charge densities as a function of radius are shown in Fig. S5. Ru has 16 valence electrons and, as seen in Fig. S5(a), these are accounted for by integrating over a sphere with a radius of around 1.4 Bohr. For a sphere of this radius, 0.03 fewer electrons are enclosed by the sphere for the system including a muon than for the system without, as shown in Fig. S5(b). The Ru atom is therefore slightly more positive due to the presence of an implanted muon. However, as seen in Fig. S5(c), this corresponds to a decrease of just 0.2% in the number of valence electrons in the vicinity of Ru.
II.3 LaNiC2
For LaNiC2 we used a plane-wave cutoff energy of 800 eV and a Monkhorst-Pack grid [9] for Brillouin zone integration, resulting in total energies that converge to 0.001 eV per cell. Using these parameters, the optimized cell parameters were found to be within 2.5% of those determined experimentally [18]. The lattice constants were therefore fixed to their experimental values for subsequent calculations. We first computed the electrostatic potential for the host crystal, as the minima in the electrostatic potential has previously been shown to be a good estimate for the muon stopping site [19] and show this in Fig. S6.
Structural relaxations were carried out on a supercell comprising conventional unit cells of LaNiC2; a supecell was used to reduce the interaction of the muon and its periodic images. Due to the enlarged unit cell, we instead used a Monkhorst-Pack grid [9] for these calculations. Initial structures comprising a muon and the LaNiC2 supercell were generated by requiring the muon to be at least 0.5 Å away from each of the muons in the previously generated structures (including their symmetry equivalent positions) and at least 1.0 Å away from any of the atoms in the cell. This resulted in 22 structures which were subsequently allowed to relax.
These structural relaxations yielded three crystallographically distinct muon stopping sites, summarized in Table S2. We note that sites 2 and 3 are 1.1 eV and 1.6 eV higher in energy than the lowest energy site and are therefore unlikely to be stable stopping sites. We therefore propose that there is a single crystallographically distinct muon stopping site in this material (site 1). In site 1, the muon is triangularly-coordinated by three La atoms in the plane and sits between two Ni atoms along the axis, with two equal Ni– distances of 1.86 Å. The Ni atoms are displaced by around 0.125 Å towards the muon. The La atoms are displaced radially outwards, though by a smaller distances (between 0.02 Å and 0.06 Å). As seen in Fig. S6, site 1 corresponds to the minimum of the electrostatic potential in LaNiC2.
| Site no. | Energy (eV) | Fractional coordinates | (MHz) |
|---|---|---|---|
| 1 | 0 | (0.00441, 0.49766, 0.11178) | 0.121 |
| 2 | 1.1 | (0.23966, 0.27547, 0.23176) | 0.130 |
| 3 | 1.6 | (0.49212, 0.26244, 0.45431) | 0.116 |
The muon site obtained here is distinct from the muon site with fractional coordinates (0.5, 0.5, 0) proposed in Ref. [18] on the basis of nuclear dipolar fields. We have calculated the relaxation rates corresponding to the Van Vleck second moments [7] for each of the candidate muon stopping sites and report these in the final column in Table S2. The nuclear relaxation rates for all three sites are very similar and not too different from the value MHz obtained experimentally [18].
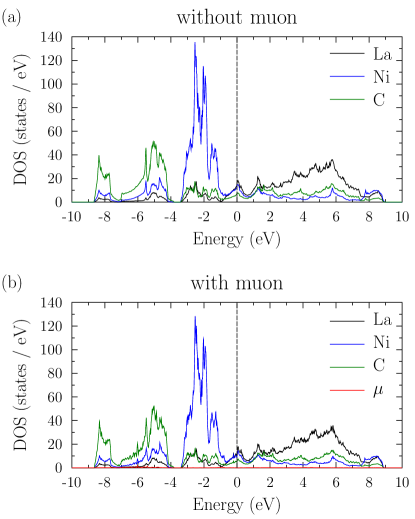
To investigate the possible effects of the implanted muon of the electronic structure of LaNiC2, we calculated the density of states (DOS) of the system with and without a muon and show this in Fig. S7. A finer Monkhorst-Pack grid [9] for was used for -point sampling when computing the DOS. The DOS has been projected onto each atomic species in the system and we see that the DOS associated with the muon is 6 eV below the Fermi energy and hence this defect state is not expected to affect the electronic properties of the system.
A possible source of a non-zero local magnetic field would be if the muon induced spin density in its local environment. We therefore carried out a series of spin-polarized calculations. However, these calculations found no appreciable spin density, both for the pristine system and for the system plus implanted muon. We also investigated the effect of introducing muonium (the bound state of and an electron) to the system, as this would introduce an additional () electron to the system. The muon sites for muonium are almost identical to those for . We find that the final charge of the muon is the same in both cases, with the additional electron density introduced by muonium being delocalized across the C atoms in the unit cell. It is interesting to note however that the largest changes in spin density occur at the positions of the Ni atoms. This results in a very small increase in spin density at the Ni atoms ( per Ni atom according to a Mulliken analysis). However, these effects do not appear to be localised in the vicinity of the muon and instead solely reflect a change in the number of electrons in the unit cell.
II.4 SrPtAs
For SrPtAs we used a 16168 Monkhorst-Pack grid [9] for Brillouin zone sampling and used Marzari-Vanderbilt smearing [20] with a width of 0.005 Ry to improve convergence. Structural relaxation of the unit cell results in optimized lattice parameters that are within 1.6% of those obtained from experiment [21]. The DFT-optimized lattice parameters and ionic positions were used for subsequent calculations. The DFT relaxed SrPtAs unit cell has space group and lattice parameters Å, Å. Sr, Pt and As atoms are at fractional coordinates (0.0, 0.0, 0.0), (0.33333, 0.66666,0.25) and (0.33333,0.66666, 0.75), respectively.
We first computed the electrostatic potential of the host crystal (shown in Fig. S8), as the minima of the electrostatic potential have been shown to provide good approximations to the muon site in a number of cases [22, 23, 24]. The minimum of the electrostatic potential, together with a grid of positions sampled 1 Å away from the host lattice atoms, form the initial guesses for the muon positions and results in 9 inital muon positions once the crystallographic symmetry is taken into account. Structural relaxations were carried out on a 332 supercell (108 host atoms and 1 muon) sampled using a 444 Monkhorst-Pack grid of -points. Calculations on and muonium yielded similar sites, and we therefore present only those sites calculated for .
| Site no. | Position | Energy (eV) |
|---|---|---|
| 1 | (0.33325, 0.66215, 0.03372) | 0.00 |
| 2 | (0.08752, 0.20680, 0.24999) | 0.29 |
| 3 | (0.03233, 0.51558, 0.24452) | 0.57 |
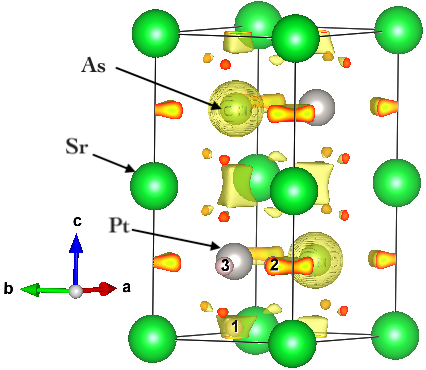
Structural relaxations result in three distinct symmetry-inequivalent muon stopping sites. Their positions and energy differences are reported in Table S3 and labeled sites 1 to 3. Site 1 has the lowest DFT energy. However, the energy difference of 0.29 eV with site 2 is not sufficiently large to rule it out as a possible stopping site and therefore sites 1 and 2 must both be considered as candidate muon sites. Sites 1 and 2 are situated at minima of the electrostatic potential (see Fig. S8), with the global minimum of the electrostatic potential corresponding to the relaxed position of site 1. Both sites 1 and 2 make shorter bond distances with Pt than with Sr and As atoms. In both materials, the nearest Pt atom to the muon is the most displaced from its equilibrium position with maximum displacement below 0.3 Å (see Fig. 3(b) and Fig. S9).
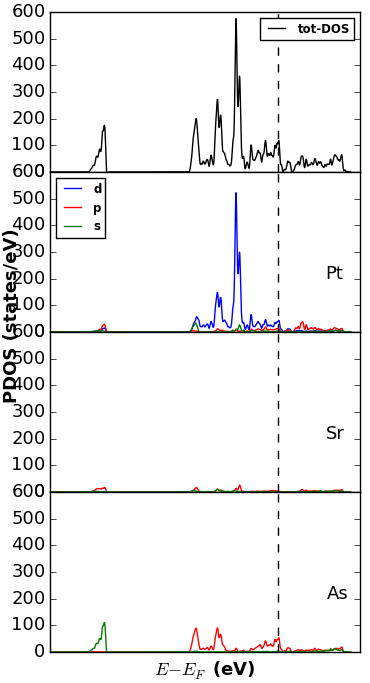
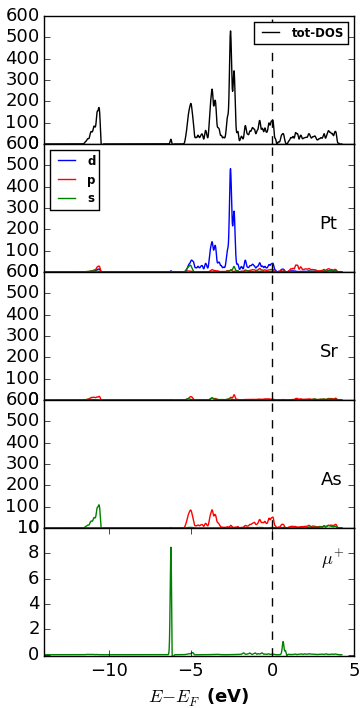
The implanted muon does not induce significant changes to the density of state (DOS) (See Fig. S10), with the projection of the DOS onto the atomic orbitals showing that the muon states are predominantly far away from the Fermi energy. Furthermore, subsequent spin-polarized calculations and Löwdin charge population [25] analysis do not indicated any muon-induced spin density either at the muon site or for any of the host atoms. This is also the case for muonium; the charge on the muon remains the same within numerical accuracy, while those from the extra electron are fractionally distributed among neighboring As atoms.
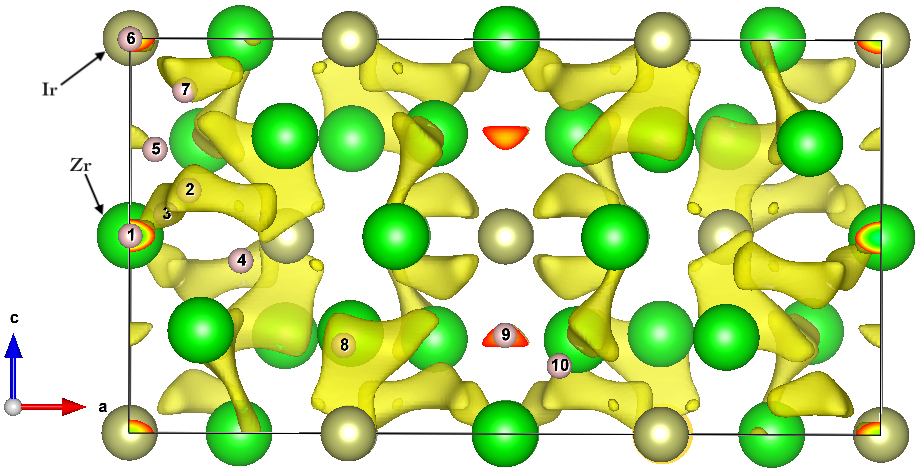
II.5 Zr3Ir
For calculations on the non-centrosymmetric system Zr3Ir, we used 16168 Monkhorst-Pack grid [9] for Brillouin zone sampling and used Marzari-Vanderbilt smearing [20] with a width of 0.005 Ry to improve convergence. The DFT-optimized lattice parameters were found to be within 1.1% of those obtained from experiment [26] and were therefore used for subsequent calculations. The DFT-relaxed Zr3Ir unit cell has space group and lattice parameters Åand Å. The three Zr and Ir atoms have fractional coordiantess (0.29403, 0.29403, 0.25209), (0.35440, 0.0, 0.5), (0.09572, 0.09572, 0.26267), and (0.29201,0.0, 0.0), respectively. We used the same approach as was used for SrPtAs to generate initial muon positions, obtaining 12 in this case. A 112 supercell (64 host atoms and 1 muon) and a 444 Monkhorst-Pack grid was used. The convergence of the supercell size was further confirmed with a 223 supercell (384 host atoms and 1 muon). Like for SrPtAs, calculations on and muonium yielded similar sites, so we present only those sites calculated for .
Stuctural relaxation result in 10 distinct muon sites. The positions and total DFT energy differences of these sites are listed in Table S4. These sites are further clustered in 4 groups labeled A, B, C and D by considering the proximity of their positions within the unit cell. As shown in Fig. S11, there are a number of distinct minima in the electrostatic potential and most of the calculated muon stopping sites are located at these positions. Despite occupying the global minimum of the electrostatic potential, site 8 does not correspond to the lowest energy relaxed structure, but is instead 0.62 eV higher in energy than the lowest energy site (site 1).
| Cluster | no. | Position | Energy | Distance (Å) |
| A | 1 | (0.0013, 0.0001, 0.5001) | 0.0 | 0.0 |
| 2 | (0.0787, 0.0787, 0.6156) | 0.01 | 1.4 | |
| 3 | (0.0480, 0.1733, 0.5548) | 0.14 | 2.0 | |
| 4 | (0.1478, 0.2371, 0.4371) | 0.21 | 3.0 | |
| 5 | (0.0332, 0.2198, 0.7186) | 0.67 | 2.7 | |
| B | 6 | (0.0003, 0.0003, 0.9984) | 0.35 | 0.0 |
| 7 | (0.0731, 0.0731, 0.8694) | 0.43 | 1.3 | |
| C | 8 | (0.2853, 0.1063, 0.2231) | 0.62 | 0.0 |
| D | 9 | (0.5001, 0.0007, 0.2501) | 0.64 | 0.0 |
| 10 | (0.5725, 0.0066, 0.1732) | 0.83 | 0.9 |
It is not straightforward to determine which of the site(s) is the stopping position for the muon by considering their energy differences and we therefore instead analyze the effects of the muon by considering a representative site in each of the clusters. The implantation of the muon does not lead to significant distortion of the host Zr and Ir atoms from their equilibrium position, as the maximum displacement remains below 0.1 Å (see Fig. 3(c) in the main text and Fig. S12). Furthermore, the muon does not distort the density of states in this system, as the muon states lie far away from the Fermi level (see Fig. S13).


II.6 Re6Zr
Re6Zr crystallizes in the noncentrosymmetric -Mn structure with cubic space group . The unit cell has 58 atoms that occupy four distinct crystallographic sites. The stoichiometric composition for the Re-Zr system is Re24Zr5, while other compositions have mixed occupancies at these sites [27]. This makes treating these systems using DFT difficult. The approach we have taken is as follows. Starting with the Re24Zr5 structure, we change the lattice parameter to Å appropriate for Re6Zr [27]. We then replace the Zr atom at the origin with Re, which has the effect of changing the symmetry of the unit cell from to . This gives a composition Re49Zr9 and therefore of Re-to-Zr ratio of 5.4:1. Obtaining a Re-to-Zr ratio of exactly 6:1 would require a minimum of 7 unit cells and is therefore computationally prohibitive. Alongside this Re-deficient composition (when compared to Re6Zr) we can also study the effect of being slightly too Re-rich by further substituting the Zr atom at the body-centre of the unit cell with Re. This gives a composition Re25Zr4 and therefore a Re:Zr ratio of 6.25:1. This additional substitution restores the symmetry to the space group symmetry possessed by Re24Zr5. The structures corresponding to each of these compositions were allowed to relax, while keeping the input cell fixed. The main difference in between the relaxed structure is that in Re49Zr9, that additional Zr atom at the centre of the cell (which is an Re atom for Re50Zr8) repels other nearby Zr atoms away from it. This leads to changes in the precise details of the coordination geometry for muons close to these Zr atoms. Input structures were generated from a single conventional cell of each of these compositions by requiring the muon to be at least 0.5 Å away from each of the muons in the previously generated structures (including their symmetry equivalent positions) and at least 1.0 Å away from any of the atoms in the cell, which resulted in 43 initial muon positions. For both compositions, we used a plane-wave cutoff energy of 1100 eV and a Monkhorst-Pack grid [9] for Brillouin zone integration, resulting in total energies that converge to 0.02 eV per cell.
| Site no. | site | nearest | Energy | |
| geometry | neighbours | (eV) | (MHz) | |
| Re49Zr9 | ||||
| A1 | tetrahedral | 3 Re, 1 Zr | 0 | 0.339 |
| A2 | octahedral | 6 Re | 0.07 | 0.341 |
| A3 | tetrahedral | 2 Re, 2 Zr | 0.16 | 0.311 |
| A4 | tetrahedral | 4 Re | 0.38 | 0.386 |
| Re50Zr8 | ||||
| B1 | tetrahedral | 3 Re, 1 Zr | 0 | 0.336 |
| B2 | octahedral | 6 Re | 0.07 | 0.338 |
| B4 | tetrahedral | 4 Re | 0.35 | 0.379 |
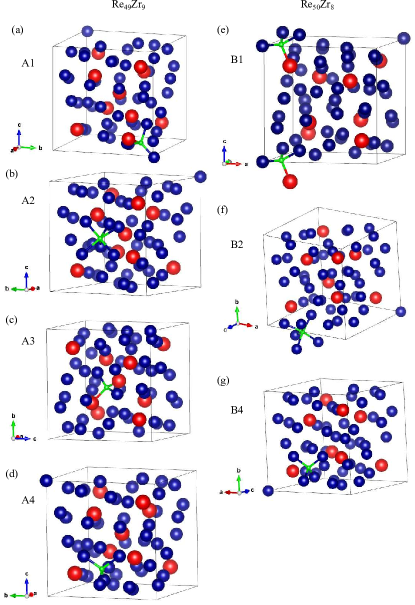
We obtain a large number of crystallographically distinct muon stopping sites after relaxing the initial structures and we summarise the distinct coordination geometries of the muon that we find in Table S5. The relaxed geometry for each site is shown in Fig. S14. We see that the muon sites in Re49Zr9 and Re50Zr8 are almost identical, with the main exception being that a site analogous to A3 in not found in the latter composition. This is due to the fact that this coordination geometry is no longer possible after replacing the Zr atom at the centre of the unit cell with Re. Note that the coordination tetrahedra of the muon in tetahedral sites are not regular (this is true even before the addition of the muon) and this affects the symmetry of the muon site and the muon-induced displacements. For example, for site A1 the muon sits closer to one of the Re atoms in the tetrahedron, which is repelled by 0.16 Å, compared to displacements of around 0.05 Å for the other atoms in the coordination tetrahron (for site B1, the maximum Re displacement is slightly larger at 0.19 Å). In sites where the sits in between four Re atoms (A4 and B4), the local environment of the muon is close to that of a regular tetrahedron; the coordinating Re atoms are repelled 0.08–0.10 Å away from the muon. For the octahedrally coordinated sites, the displacements are slightly smaller, between 0.02 and 0.06 Å for A2 and 0.02–0.07 Å for B2. For site A3 (for which no analogous site was found in Re50Zr8), the coordination tetrahedron of the muon is highly irregular, with –Re distances of 1.80 Å and –Zr distances of 1.96 Å and 1.96 Å. The muon-induced displacements for this site have similar magnitudes to those found for other tetrahedral sites, with the displacement of the nearest Zr atom of 0.10 Å being the largest Zr displacement found in our calculations. For all sites, the calculated relaxation rates are somewhat higher that the value MHz obtained experimentally [8].
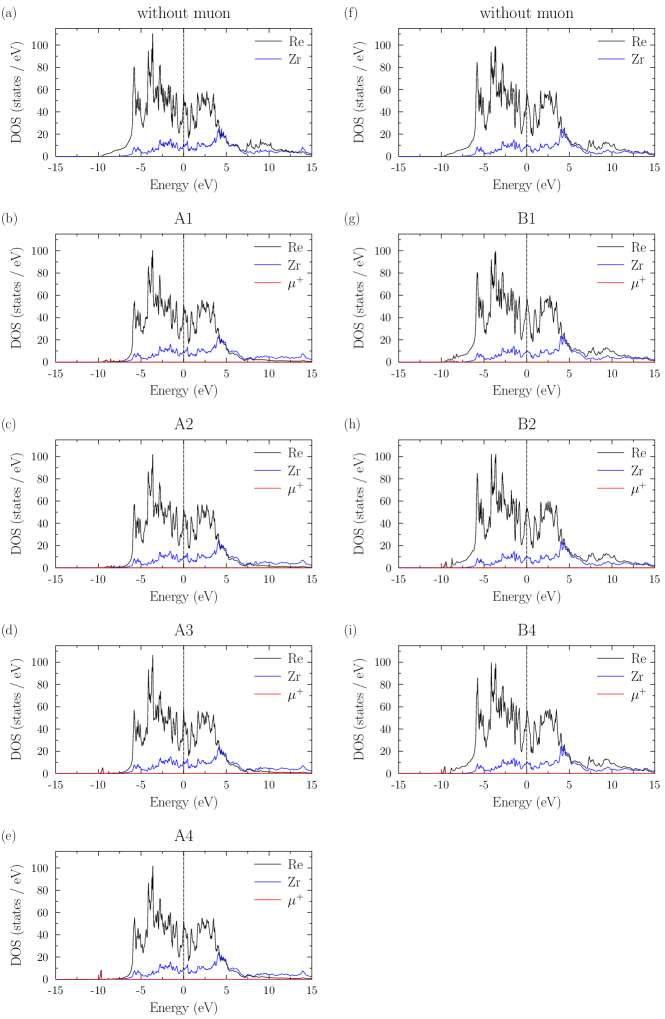
To investigate the effect of the implanted muon on the electronic structure, we have calculated the DOS, with and without the muon, for each of the compositions. The DOS for Re49Zr9 and Re50Zr8, shown in Fig. S15(a) and Fig. S15(h), respectively, are almost identical. We do not observe any significant changes in the DOS close to the Fermi energy. The significant muon DOS all lie at least 8 eV below the Fermi energy for all sites, where we see some hybridization between the muon and Re PDOS.
II.7 Niobium
Niobium crystallizes in the body-centered cubic (bcc) structure with Å. We used a plane-wave cutoff energy of 900 eV and a Monkhorst-Pack grid [9] for Brillouin zone integration, resulting in total energies that converge to 1 meV per cell. The unit cell was allowed to relax and we obtain an optimized lattice parameters Å, which are within 0.3% of the experimental values. We used the DFT-optimized lattice parameters and ionic positions in all subsequent calculations.
Structural relaxations were carried out on a supercell comprising conventional unit cells of Nb to reduce the unphysical interaction of the muon and its periodic images. Due to the enlarged unit cell, we used a Monkhorst-Pack grid [9] for these calculations. Initial structures comprising a muon and the Nb supercell were generated by requiring the muon to be at least 0.25 Å away from each of the muons in the other structures generated (including their symmetry equivalent positions) and at least 1.0 Å away from any of the atoms in the cell. This resulted in 11 structures which were subsequently allowed to relax.
These structural relaxations yield a single crystallographically distinct muon stopping sites, shown in Fig. S16(a). The muon occupies a tetrahedral interstitial site of the bcc structure of Nb, with Nb– distances of 1.92 Å. The displacements due to this site are small, with Nb atoms in the coordination octahedron each being repelled by around 0.07 Å away from the muon, and with these displacements rapidly decreasing with distance from the muon site, as shown in Fig. S16(b). We note that it is possible to stabilize a muon in an octrahedral interstice, but that this site wasn’t obtained from our random search and is 0.28 eV higher in energy than the tetrahedral site.
To investigate the possible effects of the implanted muon on the electronic structure of the system, we computed the density of states (DOS) with and without the muon, for both crystallographically distinct muon sites. We used a finer Monkhorst-Pack grid [9] for -point sampling in these calculations. We show the projected density of states (PDOS) for each of the species in the system, without and with an implanted muon, in Figs. S16(c) and S16(d) respectively. There is some hybridization between this state and the states belonging to the nearest neighbor Nb atoms. There are no significant changes to the DOS in the vicinity of the Fermi energy. The muon density of states take the form of an extremely sharp peak lying around 7 eV below the Fermi energy, reproducing the same muon condition encountered in the superconductors that are found to exhibit TRSB.
III Local moment formation
With each of the systems under study being metals, we can assess whether the implanted muon acquires an induced moment due to its interaction with the conduction electrons of the host. The phenomenon of magnetic impurities is often studied using the Anderson model in which the energy levels of the impurity (typically one with localized - or -electrons) are broadened into resonances by hybridization with -electrons in the solvent metal. This gives rise to a spectral density function with a Lorentzian form [28, 29]
| (7) |
where corresponds to the location of the peak in the muon density of states. The width of the Lorentzian increases with the strength of the interaction between -electrons and the impurity states with angular momentum .
The condition for a permanent magnetic moment on the impurity ion is given by [28]
| (8) |
where is the Coulomb repulsion. In dilute alloys of transition and rare earth elements, the broadening of the -state often leads to a reduction in the amplitude of the spectral density that means is too small to satisfy Eq. (8). However, in our case, the muon state is sufficiently far below the Fermi energy that a significant degree of broadening is required in order for any appreciable spectral weight to occur at the Fermi energy. We can evaluate the most favorable case for moment formation in which takes a value that maximizes the spectral weight of the muon state at the Fermi energy.
Maximizing with respect to , we find that the largest possible is achieved when for which we obtain
| (9) |
and hence for a local moment to form we require
| (10) |
We first consider Sr2RuO4. The Coulomb repulsion can be estimated by considering the exchange energy for a uniform electron gas [28], which has a magnitude of 0.916/ Ry per electron, where is the radius of a sphere containing one electron on average, measured in terms of the Bohr radius. We approximate the localized state as a ball with a radius equal to half the distance between the muon and the nearest-neighbor O atom, Å. The charging energy for occupation of such a state by two electrons is approximately 30 eV. Using the fact that the peak in muon DOS is around 8 eV below the Fermi energy, Eq. 10 tells us that for local moment formation is only possible for eV, which is significantly larger than our estimate for the Coulomb repulsion energy. The condition for local moment formation could be satisfied by our value of at higher values of . However, first-principles calculations on atoms in a uniform electron gas show that the Friedel sum is dominated by scattering from the channel for light elements such as the muon [30]. Furthermore, -wave scattering dominates the Kondo theory description of muon diffusion in metals [31, 32]. It is therefore highly unlikely that a local moment can form on the muon due to its resonance with the conduction elements. For Re, the peak in muon density of states is further below the Fermi energy, leading to a smaller , and the nearest-neighbor ions are further away, resulting in a smaller charging energy following the approach used for Sr2RuO4. Local moment formation is therefore even less likely for Re. We note that the same considerations would apply to Nb, for which the peak in the muon DOS lies 7 eV below the Fermi energy, and so local moment formation is similarly unlikely. Since Nb does not show TRSB and does not exhibit additional relaxation below in zero-field SR experiments [33], we conclude that the TRSB signal in SR experiments in these other superconductors is not connected with the defect level induced by the muon itself.
A further point to consider is that even in cases where local moments form, it is possible that they are screened out by the host metal Fermi sea. In the symmetric Anderson model the Kondo temperature is given by [29]
| (11) |
At temperatures below , any local moment on the muon will be screened by the conduction electrons. Strong hybridization between the impurity states and the conduction electrons gives rise to a large that will enhance . Indeed, our optimal width of eV for Sr2RuO4 together with eV results in an enormous Kondo temperature K. This shows that even if local moment formation were possible, the values of required to achieve a significant muon DOS at the Fermi energy would likely lead to a Kondo temperature that is significantly higher than the critical temperature for the onset of superconductivity. Therefore, at the temperatures relevant for superconductivity, the Fermi sea would screen out the local magnetic moment, leaving no residual magnetism.
References
- Clark et al. [2005] S. J. Clark, M. D. Segall, C. J. Pickard, P. J. Hasnip, M. I. J. Probert, K. Refson, and M. C. Payne, Z. Kristallogr. Cryst. Mater 220, 567 (2005).
- Giannozzi et al. [2009] P. Giannozzi, S. Baroni, N. Bonini, M. Calandra, R. Car, C. Cavazzoni, D. Ceresoli, G. L. Chiarotti, M. Cococcioni, I. Dabo, A. Dal Corso, S. de Gironcoli, S. Fabris, G. Fratesi, R. Gebauer, U. Gerstmann, C. Gougoussis, A. Kokalj, M. Lazzeri, L. Martin-Samos, N. Marzari, F. Mauri, R. Mazzarello, S. Paolini, A. Pasquarello, L. Paulatto, C. Sbraccia, S. Scandolo, G. Sclauzero, A. P. Seitsonen, A. Smogunov, P. Umari, and R. M. Wentzcovitch, J. Phys. Condens. Matter 21, 395502 (2009).
- Giannozzi et al. [2017] P. Giannozzi, O. Andreussi, T. Brumme, O. Bunau, M. B. Nardelli, M. Calandra, R. Car, C. Cavazzoni, D. Ceresoli, M. Cococcioni, N. Colonna, I. Carnimeo, A. D. Corso, S. de Gironcoli, P. Delugas, R. A. D. Jr, A. Ferretti, A. Floris, G. Fratesi, G. Fugallo, R. Gebauer, U. Gerstmann, F. Giustino, T. Gorni, J. Jia, M. Kawamura, H.-Y. Ko, A. Kokalj, E. Küçükbenli, M. Lazzeri, M. Marsili, N. Marzari, F. Mauri, N. L. Nguyen, H.-V. Nguyen, A. O. de-la Roza, L. Paulatto, S. Poncé, D. Rocca, R. Sabatini, B. Santra, M. Schlipf, A. P. Seitsonen, A. Smogunov, I. Timrov, T. Thonhauser, P. Umari, N. Vast, X. Wu, and S. Baroni, J. Phys. Condens. Matter 29, 465901 (2017).
- Perdew et al. [1996] J. P. Perdew, K. Burke, and M. Ernzerhof, Phys. Rev. Lett. 77, 3865 (1996).
- Lany and Zunger [2008] S. Lany and A. Zunger, Phys. Rev. B 78, 235104 (2008).
- Clark et al. [2010] S. J. Clark, J. Robertson, S. Lany, and A. Zunger, Phys. Rev. B 81, 115311 (2010).
- Hayano et al. [1979] R. S. Hayano, Y. J. Uemura, J. Imazato, N. Nishida, T. Yamazaki, and R. Kubo, Phys. Rev. B 20, 850 (1979).
- Shang et al. [2018] T. Shang, M. Smidman, S. K. Ghosh, C. Baines, L. J. Chang, D. J. Gawryluk, J. A. T. Barker, R. P. Singh, D. M. Paul, G. Balakrishnan, E. Pomjakushina, M. Shi, M. Medarde, A. D. Hillier, H. Q. Yuan, J. Quintanilla, J. Mesot, and T. Shiroka, Phys. Rev. Lett. 121, 257002 (2018).
- Monkhorst and Pack [1976] H. J. Monkhorst and J. D. Pack, Phys. Rev. B 13, 5188 (1976).
- Hamann [2013] D. R. Hamann, Phys. Rev. B 88, 085117 (2013).
- Vanderbilt [1990] D. Vanderbilt, Phys. Rev. B 41, 7892 (1990).
- Garrity et al. [2014] K. F. Garrity, J. W. Bennett, K. M. Rabe, and D. Vanderbilt, Comput. Mater. Sci. 81, 446 (2014).
- Momma and Izumi [2008] K. Momma and F. Izumi, J. Appl. Crystallogr. 41, 653 (2008).
- Hao et al. [2014] X.-P. Hao, H.-L. Cui, Z.-L. Lv, and G.-F. Ji, Physica B Condens. Matter 441, 62 (2014).
- Oguchi [1995] T. Oguchi, Phys. Rev. B 51, 1385 (1995).
- Singh [1995] D. J. Singh, Phys. Rev. B 52, 1358 (1995).
- Schmidt et al. [1996] M. Schmidt, T. R. Cummins, M. Bürk, D. H. Lu, N. Nücker, S. Schuppler, and F. Lichtenberg, Phys. Rev. B 53, R14761 (1996).
- Hillier et al. [2009] A. D. Hillier, J. Quintanilla, and R. Cywinski, Phys. Rev. Lett. 102, 117007 (2009).
- Möller et al. [2013] J. S. Möller, P. Bonfà, D. Ceresoli, F. Bernardini, S. J. Blundell, T. Lancaster, R. De Renzi, N. Marzari, I. Watanabe, S. Sulaiman, and M. I. Mohamed-Ibrahim, Phys. Scr. 88, 068510 (2013).
- Marzari et al. [1999] N. Marzari, D. Vanderbilt, A. De Vita, and M. C. Payne, Phys. Rev. Lett. 82, 3296 (1999).
- Wenski and Mewis [1986] G. Wenski and A. Mewis, Z. Anorg. Allg. Chem. 535, 110 (1986).
- Maeter et al. [2009] H. Maeter, H. Luetkens, Y. G. Pashkevich, A. Kwadrin, R. Khasanov, A. Amato, A. A. Gusev, K. V. Lamonova, D. A. Chervinskii, R. Klingeler, C. Hess, G. Behr, B. Büchner, and H.-H. Klauss, Phys. Rev. B 80, 094524 (2009).
- De Renzi et al. [2012] R. De Renzi, P. Bonfà, M. Mazzani, S. Sanna, G. Prando, P. Carretta, R. Khasanov, A. Amato, H. Luetkens, M. Bendele, F. Bernardini, S. Massidda, A. Palenzona, M. Tropeano, and M. Vignolo, Supercond. Sci. Technol. 25, 84009 (2012).
- Lamura et al. [2013] G. Lamura, T. Shiroka, P. Bonfà, S. Sanna, F. Bernardini, R. De Renzi, R. Viennois, E. Giannini, A. Piriou, N. Emery, M. R. Cimberle, and M. Putti, J. Phys.: Condens. Matter 25, 156004 (2013).
- Löwdin [1950] P. Löwdin, J. Chem. Phys. 18, 365 (1950).
- Cenzual and Parthé [1985] K. Cenzual and E. Parthé, Acta Crystallogr. Sect. C 41, 820 (1985).
- Matano et al. [2016] K. Matano, R. Yatagai, S. Maeda, and G.-q. Zheng, Phys. Rev. B 94, 214513 (2016).
- Ziman [1972] J. M. Ziman, Principles of the Theory of Solids, 2nd ed. (Cambridge University Press, 1972).
- Coleman [2015] P. Coleman, Introduction to Many-Body Physics (Cambridge University Press, 2015).
- Puska and Nieminen [1983] M. J. Puska and R. M. Nieminen, Phys. Rev. B 27, 6121 (1983).
- Hartmann et al. [1988] O. Hartmann, E. Karlsson, E. Wäckelgrd, R. Wäppling, D. Richter, R. Hempelmann, and T. O. Niinikoski, Phys. Rev. B 37, 4425 (1988).
- Luke et al. [1991] G. M. Luke, J. H. Brewer, S. R. Kreitzman, D. R. Noakes, M. Celio, R. Kadono, and E. J. Ansaldo, Phys. Rev. B 43, 3284 (1991).
- Gygax et al. [1984] F. Gygax, A. Hintermann, W. Rüegg, A. Schenck, W. Studer, A. Van Der Wal, and N. Kaplan, J. Less-Common Met. 101, 335 (1984).