Measurement of the sixth-order cumulant of net-proton multiplicity distributions
in Au+Au collisions at 27, 54.4, and 200 GeV at RHIC
M. S. Abdallah
American University of Cairo, New Cairo 11835, New Cairo, Egypt
J. Adam
Brookhaven National Laboratory, Upton, New York 11973
L. Adamczyk
AGH University of Science and Technology, FPACS, Cracow 30-059, Poland
J. R. Adams
Ohio State University, Columbus, Ohio 43210
J. K. Adkins
University of Kentucky, Lexington, Kentucky 40506-0055
G. Agakishiev
Joint Institute for Nuclear Research, Dubna 141 980, Russia
I. Aggarwal
Panjab University, Chandigarh 160014, India
M. M. Aggarwal
Panjab University, Chandigarh 160014, India
Z. Ahammed
Variable Energy Cyclotron Centre, Kolkata 700064, India
I. Alekseev
Alikhanov Institute for Theoretical and Experimental Physics NRC ”Kurchatov Institute”, Moscow 117218, Russia
National Research Nuclear University MEPhI, Moscow 115409, Russia
D. M. Anderson
Texas A&M University, College Station, Texas 77843
A. Aparin
Joint Institute for Nuclear Research, Dubna 141 980, Russia
E. C. Aschenauer
Brookhaven National Laboratory, Upton, New York 11973
M. U. Ashraf
Central China Normal University, Wuhan, Hubei 430079
F. G. Atetalla
Kent State University, Kent, Ohio 44242
A. Attri
Panjab University, Chandigarh 160014, India
G. S. Averichev
Joint Institute for Nuclear Research, Dubna 141 980, Russia
V. Bairathi
Instituto de Alta Investigación, Universidad de Tarapacá, Arica 1000000, Chile
W. Baker
University of California, Riverside, California 92521
J. G. Ball Cap
University of Houston, Houston, Texas 77204
K. Barish
University of California, Riverside, California 92521
A. Behera
State University of New York, Stony Brook, New York 11794
R. Bellwied
University of Houston, Houston, Texas 77204
P. Bhagat
University of Jammu, Jammu 180001, India
A. Bhasin
University of Jammu, Jammu 180001, India
J. Bielcik
Czech Technical University in Prague, FNSPE, Prague 115 19, Czech Republic
J. Bielcikova
Nuclear Physics Institute of the CAS, Rez 250 68, Czech Republic
I. G. Bordyuzhin
Alikhanov Institute for Theoretical and Experimental Physics NRC ”Kurchatov Institute”, Moscow 117218, Russia
J. D. Brandenburg
Brookhaven National Laboratory, Upton, New York 11973
A. V. Brandin
National Research Nuclear University MEPhI, Moscow 115409, Russia
I. Bunzarov
Joint Institute for Nuclear Research, Dubna 141 980, Russia
J. Butterworth
Rice University, Houston, Texas 77251
X. Z. Cai
Shanghai Institute of Applied Physics, Chinese Academy of Sciences, Shanghai 201800
H. Caines
Yale University, New Haven, Connecticut 06520
M. Calderón de la Barca Sánchez
University of California, Davis, California 95616
D. Cebra
University of California, Davis, California 95616
I. Chakaberia
Lawrence Berkeley National Laboratory, Berkeley, California 94720
Brookhaven National Laboratory, Upton, New York 11973
P. Chaloupka
Czech Technical University in Prague, FNSPE, Prague 115 19, Czech Republic
B. K. Chan
University of California, Los Angeles, California 90095
F-H. Chang
National Cheng Kung University, Tainan 70101
Z. Chang
Brookhaven National Laboratory, Upton, New York 11973
N. Chankova-Bunzarova
Joint Institute for Nuclear Research, Dubna 141 980, Russia
A. Chatterjee
Central China Normal University, Wuhan, Hubei 430079
S. Chattopadhyay
Variable Energy Cyclotron Centre, Kolkata 700064, India
D. Chen
University of California, Riverside, California 92521
J. Chen
Shandong University, Qingdao, Shandong 266237
J. H. Chen
Fudan University, Shanghai, 200433
X. Chen
University of Science and Technology of China, Hefei, Anhui 230026
Z. Chen
Shandong University, Qingdao, Shandong 266237
J. Cheng
Tsinghua University, Beijing 100084
M. Chevalier
University of California, Riverside, California 92521
S. Choudhury
Fudan University, Shanghai, 200433
W. Christie
Brookhaven National Laboratory, Upton, New York 11973
X. Chu
Brookhaven National Laboratory, Upton, New York 11973
H. J. Crawford
University of California, Berkeley, California 94720
M. Csanád
ELTE Eötvös Loránd University, Budapest, Hungary H-1117
M. Daugherity
Abilene Christian University, Abilene, Texas 79699
T. G. Dedovich
Joint Institute for Nuclear Research, Dubna 141 980, Russia
I. M. Deppner
University of Heidelberg, Heidelberg 69120, Germany
A. A. Derevschikov
NRC ”Kurchatov Institute”, Institute of High Energy Physics, Protvino 142281, Russia
A. Dhamija
Panjab University, Chandigarh 160014, India
L. Di Carlo
Wayne State University, Detroit, Michigan 48201
L. Didenko
Brookhaven National Laboratory, Upton, New York 11973
X. Dong
Lawrence Berkeley National Laboratory, Berkeley, California 94720
J. L. Drachenberg
Abilene Christian University, Abilene, Texas 79699
E. Duckworth
Kent State University, Kent, Ohio 44242
J. C. Dunlop
Brookhaven National Laboratory, Upton, New York 11973
N. Elsey
Wayne State University, Detroit, Michigan 48201
J. Engelage
University of California, Berkeley, California 94720
G. Eppley
Rice University, Houston, Texas 77251
S. Esumi
University of Tsukuba, Tsukuba, Ibaraki 305-8571, Japan
O. Evdokimov
University of Illinois at Chicago, Chicago, Illinois 60607
A. Ewigleben
Lehigh University, Bethlehem, Pennsylvania 18015
O. Eyser
Brookhaven National Laboratory, Upton, New York 11973
R. Fatemi
University of Kentucky, Lexington, Kentucky 40506-0055
F. M. Fawzi
American University of Cairo, New Cairo 11835, New Cairo, Egypt
S. Fazio
Brookhaven National Laboratory, Upton, New York 11973
P. Federic
Nuclear Physics Institute of the CAS, Rez 250 68, Czech Republic
J. Fedorisin
Joint Institute for Nuclear Research, Dubna 141 980, Russia
C. J. Feng
National Cheng Kung University, Tainan 70101
Y. Feng
Purdue University, West Lafayette, Indiana 47907
P. Filip
Joint Institute for Nuclear Research, Dubna 141 980, Russia
E. Finch
Southern Connecticut State University, New Haven, Connecticut 06515
Y. Fisyak
Brookhaven National Laboratory, Upton, New York 11973
A. Francisco
Yale University, New Haven, Connecticut 06520
C. Fu
Central China Normal University, Wuhan, Hubei 430079
L. Fulek
AGH University of Science and Technology, FPACS, Cracow 30-059, Poland
C. A. Gagliardi
Texas A&M University, College Station, Texas 77843
T. Galatyuk
Technische Universität Darmstadt, Darmstadt 64289, Germany
F. Geurts
Rice University, Houston, Texas 77251
N. Ghimire
Temple University, Philadelphia, Pennsylvania 19122
A. Gibson
Valparaiso University, Valparaiso, Indiana 46383
K. Gopal
Indian Institute of Science Education and Research (IISER) Tirupati, Tirupati 517507, India
X. Gou
Shandong University, Qingdao, Shandong 266237
D. Grosnick
Valparaiso University, Valparaiso, Indiana 46383
A. Gupta
University of Jammu, Jammu 180001, India
W. Guryn
Brookhaven National Laboratory, Upton, New York 11973
A. I. Hamad
Kent State University, Kent, Ohio 44242
A. Hamed
American University of Cairo, New Cairo 11835, New Cairo, Egypt
Y. Han
Rice University, Houston, Texas 77251
S. Harabasz
Technische Universität Darmstadt, Darmstadt 64289, Germany
M. D. Harasty
University of California, Davis, California 95616
J. W. Harris
Yale University, New Haven, Connecticut 06520
H. Harrison
University of Kentucky, Lexington, Kentucky 40506-0055
S. He
Central China Normal University, Wuhan, Hubei 430079
W. He
Fudan University, Shanghai, 200433
X. H. He
Institute of Modern Physics, Chinese Academy of Sciences, Lanzhou, Gansu 730000
Y. He
Shandong University, Qingdao, Shandong 266237
S. Heppelmann
University of California, Davis, California 95616
S. Heppelmann
Pennsylvania State University, University Park, Pennsylvania 16802
N. Herrmann
University of Heidelberg, Heidelberg 69120, Germany
E. Hoffman
University of Houston, Houston, Texas 77204
L. Holub
Czech Technical University in Prague, FNSPE, Prague 115 19, Czech Republic
Y. Hu
Fudan University, Shanghai, 200433
H. Huang
National Cheng Kung University, Tainan 70101
H. Z. Huang
University of California, Los Angeles, California 90095
S. L. Huang
State University of New York, Stony Brook, New York 11794
T. Huang
National Cheng Kung University, Tainan 70101
X. Huang
Tsinghua University, Beijing 100084
Y. Huang
Tsinghua University, Beijing 100084
T. J. Humanic
Ohio State University, Columbus, Ohio 43210
G. Igo
Deceased
University of California, Los Angeles, California 90095
D. Isenhower
Abilene Christian University, Abilene, Texas 79699
W. W. Jacobs
Indiana University, Bloomington, Indiana 47408
C. Jena
Indian Institute of Science Education and Research (IISER) Tirupati, Tirupati 517507, India
A. Jentsch
Brookhaven National Laboratory, Upton, New York 11973
Y. Ji
Lawrence Berkeley National Laboratory, Berkeley, California 94720
J. Jia
Brookhaven National Laboratory, Upton, New York 11973
State University of New York, Stony Brook, New York 11794
K. Jiang
University of Science and Technology of China, Hefei, Anhui 230026
X. Ju
University of Science and Technology of China, Hefei, Anhui 230026
E. G. Judd
University of California, Berkeley, California 94720
S. Kabana
Instituto de Alta Investigación, Universidad de Tarapacá, Arica 1000000, Chile
M. L. Kabir
University of California, Riverside, California 92521
S. Kagamaster
Lehigh University, Bethlehem, Pennsylvania 18015
D. Kalinkin
Indiana University, Bloomington, Indiana 47408
Brookhaven National Laboratory, Upton, New York 11973
K. Kang
Tsinghua University, Beijing 100084
D. Kapukchyan
University of California, Riverside, California 92521
K. Kauder
Brookhaven National Laboratory, Upton, New York 11973
H. W. Ke
Brookhaven National Laboratory, Upton, New York 11973
D. Keane
Kent State University, Kent, Ohio 44242
A. Kechechyan
Joint Institute for Nuclear Research, Dubna 141 980, Russia
Y. V. Khyzhniak
National Research Nuclear University MEPhI, Moscow 115409, Russia
D. P. Kikoła
Warsaw University of Technology, Warsaw 00-661, Poland
C. Kim
University of California, Riverside, California 92521
B. Kimelman
University of California, Davis, California 95616
D. Kincses
ELTE Eötvös Loránd University, Budapest, Hungary H-1117
I. Kisel
Frankfurt Institute for Advanced Studies FIAS, Frankfurt 60438, Germany
A. Kiselev
Brookhaven National Laboratory, Upton, New York 11973
A. G. Knospe
Lehigh University, Bethlehem, Pennsylvania 18015
L. Kochenda
National Research Nuclear University MEPhI, Moscow 115409, Russia
L. K. Kosarzewski
Czech Technical University in Prague, FNSPE, Prague 115 19, Czech Republic
L. Kramarik
Czech Technical University in Prague, FNSPE, Prague 115 19, Czech Republic
P. Kravtsov
National Research Nuclear University MEPhI, Moscow 115409, Russia
L. Kumar
Panjab University, Chandigarh 160014, India
S. Kumar
Institute of Modern Physics, Chinese Academy of Sciences, Lanzhou, Gansu 730000
R. Kunnawalkam Elayavalli
Yale University, New Haven, Connecticut 06520
J. H. Kwasizur
Indiana University, Bloomington, Indiana 47408
R. Lacey
State University of New York, Stony Brook, New York 11794
S. Lan
Central China Normal University, Wuhan, Hubei 430079
J. M. Landgraf
Brookhaven National Laboratory, Upton, New York 11973
J. Lauret
Brookhaven National Laboratory, Upton, New York 11973
A. Lebedev
Brookhaven National Laboratory, Upton, New York 11973
R. Lednicky
Joint Institute for Nuclear Research, Dubna 141 980, Russia
J. H. Lee
Brookhaven National Laboratory, Upton, New York 11973
Y. H. Leung
Lawrence Berkeley National Laboratory, Berkeley, California 94720
C. Li
Shandong University, Qingdao, Shandong 266237
C. Li
University of Science and Technology of China, Hefei, Anhui 230026
W. Li
Rice University, Houston, Texas 77251
X. Li
University of Science and Technology of China, Hefei, Anhui 230026
Y. Li
Tsinghua University, Beijing 100084
X. Liang
University of California, Riverside, California 92521
Y. Liang
Kent State University, Kent, Ohio 44242
R. Licenik
Nuclear Physics Institute of the CAS, Rez 250 68, Czech Republic
T. Lin
Texas A&M University, College Station, Texas 77843
Y. Lin
Central China Normal University, Wuhan, Hubei 430079
M. A. Lisa
Ohio State University, Columbus, Ohio 43210
F. Liu
Central China Normal University, Wuhan, Hubei 430079
H. Liu
Indiana University, Bloomington, Indiana 47408
H. Liu
Central China Normal University, Wuhan, Hubei 430079
P. Liu
State University of New York, Stony Brook, New York 11794
T. Liu
Yale University, New Haven, Connecticut 06520
X. Liu
Ohio State University, Columbus, Ohio 43210
Y. Liu
Texas A&M University, College Station, Texas 77843
Z. Liu
University of Science and Technology of China, Hefei, Anhui 230026
T. Ljubicic
Brookhaven National Laboratory, Upton, New York 11973
W. J. Llope
Wayne State University, Detroit, Michigan 48201
R. S. Longacre
Brookhaven National Laboratory, Upton, New York 11973
E. Loyd
University of California, Riverside, California 92521
N. S. Lukow
Temple University, Philadelphia, Pennsylvania 19122
X. Luo
Central China Normal University, Wuhan, Hubei 430079
L. Ma
Fudan University, Shanghai, 200433
R. Ma
Brookhaven National Laboratory, Upton, New York 11973
Y. G. Ma
Fudan University, Shanghai, 200433
N. Magdy
University of Illinois at Chicago, Chicago, Illinois 60607
R. Majka
Deceased
Yale University, New Haven, Connecticut 06520
D. Mallick
National Institute of Science Education and Research, HBNI, Jatni 752050, India
S. Margetis
Kent State University, Kent, Ohio 44242
C. Markert
University of Texas, Austin, Texas 78712
H. S. Matis
Lawrence Berkeley National Laboratory, Berkeley, California 94720
J. A. Mazer
Rutgers University, Piscataway, New Jersey 08854
N. G. Minaev
NRC ”Kurchatov Institute”, Institute of High Energy Physics, Protvino 142281, Russia
S. Mioduszewski
Texas A&M University, College Station, Texas 77843
B. Mohanty
National Institute of Science Education and Research, HBNI, Jatni 752050, India
M. M. Mondal
State University of New York, Stony Brook, New York 11794
I. Mooney
Wayne State University, Detroit, Michigan 48201
D. A. Morozov
NRC ”Kurchatov Institute”, Institute of High Energy Physics, Protvino 142281, Russia
A. Mukherjee
ELTE Eötvös Loránd University, Budapest, Hungary H-1117
M. Nagy
ELTE Eötvös Loránd University, Budapest, Hungary H-1117
J. D. Nam
Temple University, Philadelphia, Pennsylvania 19122
Md. Nasim
Indian Institute of Science Education and Research (IISER), Berhampur 760010 , India
K. Nayak
Central China Normal University, Wuhan, Hubei 430079
D. Neff
University of California, Los Angeles, California 90095
J. M. Nelson
University of California, Berkeley, California 94720
D. B. Nemes
Yale University, New Haven, Connecticut 06520
M. Nie
Shandong University, Qingdao, Shandong 266237
G. Nigmatkulov
National Research Nuclear University MEPhI, Moscow 115409, Russia
T. Niida
University of Tsukuba, Tsukuba, Ibaraki 305-8571, Japan
R. Nishitani
University of Tsukuba, Tsukuba, Ibaraki 305-8571, Japan
L. V. Nogach
NRC ”Kurchatov Institute”, Institute of High Energy Physics, Protvino 142281, Russia
T. Nonaka
University of Tsukuba, Tsukuba, Ibaraki 305-8571, Japan
A. S. Nunes
Brookhaven National Laboratory, Upton, New York 11973
G. Odyniec
Lawrence Berkeley National Laboratory, Berkeley, California 94720
A. Ogawa
Brookhaven National Laboratory, Upton, New York 11973
S. Oh
Lawrence Berkeley National Laboratory, Berkeley, California 94720
V. A. Okorokov
National Research Nuclear University MEPhI, Moscow 115409, Russia
B. S. Page
Brookhaven National Laboratory, Upton, New York 11973
R. Pak
Brookhaven National Laboratory, Upton, New York 11973
A. Pandav
National Institute of Science Education and Research, HBNI, Jatni 752050, India
A. K. Pandey
University of Tsukuba, Tsukuba, Ibaraki 305-8571, Japan
Y. Panebratsev
Joint Institute for Nuclear Research, Dubna 141 980, Russia
P. Parfenov
National Research Nuclear University MEPhI, Moscow 115409, Russia
B. Pawlik
Institute of Nuclear Physics PAN, Cracow 31-342, Poland
D. Pawlowska
Warsaw University of Technology, Warsaw 00-661, Poland
H. Pei
Central China Normal University, Wuhan, Hubei 430079
C. Perkins
University of California, Berkeley, California 94720
L. Pinsky
University of Houston, Houston, Texas 77204
R. L. Pintér
ELTE Eötvös Loránd University, Budapest, Hungary H-1117
J. Pluta
Warsaw University of Technology, Warsaw 00-661, Poland
B. R. Pokhrel
Temple University, Philadelphia, Pennsylvania 19122
G. Ponimatkin
Nuclear Physics Institute of the CAS, Rez 250 68, Czech Republic
J. Porter
Lawrence Berkeley National Laboratory, Berkeley, California 94720
M. Posik
Temple University, Philadelphia, Pennsylvania 19122
V. Prozorova
Czech Technical University in Prague, FNSPE, Prague 115 19, Czech Republic
N. K. Pruthi
Panjab University, Chandigarh 160014, India
M. Przybycien
AGH University of Science and Technology, FPACS, Cracow 30-059, Poland
J. Putschke
Wayne State University, Detroit, Michigan 48201
H. Qiu
Institute of Modern Physics, Chinese Academy of Sciences, Lanzhou, Gansu 730000
A. Quintero
Temple University, Philadelphia, Pennsylvania 19122
C. Racz
University of California, Riverside, California 92521
S. K. Radhakrishnan
Kent State University, Kent, Ohio 44242
N. Raha
Wayne State University, Detroit, Michigan 48201
R. L. Ray
University of Texas, Austin, Texas 78712
R. Reed
Lehigh University, Bethlehem, Pennsylvania 18015
H. G. Ritter
Lawrence Berkeley National Laboratory, Berkeley, California 94720
M. Robotkova
Nuclear Physics Institute of the CAS, Rez 250 68, Czech Republic
O. V. Rogachevskiy
Joint Institute for Nuclear Research, Dubna 141 980, Russia
J. L. Romero
University of California, Davis, California 95616
L. Ruan
Brookhaven National Laboratory, Upton, New York 11973
J. Rusnak
Nuclear Physics Institute of the CAS, Rez 250 68, Czech Republic
N. R. Sahoo
Shandong University, Qingdao, Shandong 266237
H. Sako
University of Tsukuba, Tsukuba, Ibaraki 305-8571, Japan
S. Salur
Rutgers University, Piscataway, New Jersey 08854
J. Sandweiss
Deceased
Yale University, New Haven, Connecticut 06520
S. Sato
University of Tsukuba, Tsukuba, Ibaraki 305-8571, Japan
W. B. Schmidke
Brookhaven National Laboratory, Upton, New York 11973
N. Schmitz
Max-Planck-Institut für Physik, Munich 80805, Germany
B. R. Schweid
State University of New York, Stony Brook, New York 11794
F. Seck
Technische Universität Darmstadt, Darmstadt 64289, Germany
J. Seger
Creighton University, Omaha, Nebraska 68178
M. Sergeeva
University of California, Los Angeles, California 90095
R. Seto
University of California, Riverside, California 92521
P. Seyboth
Max-Planck-Institut für Physik, Munich 80805, Germany
N. Shah
Indian Institute Technology, Patna, Bihar 801106, India
E. Shahaliev
Joint Institute for Nuclear Research, Dubna 141 980, Russia
P. V. Shanmuganathan
Brookhaven National Laboratory, Upton, New York 11973
M. Shao
University of Science and Technology of China, Hefei, Anhui 230026
T. Shao
Shanghai Institute of Applied Physics, Chinese Academy of Sciences, Shanghai 201800
A. I. Sheikh
Kent State University, Kent, Ohio 44242
D. Shen
Shanghai Institute of Applied Physics, Chinese Academy of Sciences, Shanghai 201800
S. S. Shi
Central China Normal University, Wuhan, Hubei 430079
Y. Shi
Shandong University, Qingdao, Shandong 266237
Q. Y. Shou
Fudan University, Shanghai, 200433
E. P. Sichtermann
Lawrence Berkeley National Laboratory, Berkeley, California 94720
R. Sikora
AGH University of Science and Technology, FPACS, Cracow 30-059, Poland
M. Simko
Nuclear Physics Institute of the CAS, Rez 250 68, Czech Republic
J. Singh
Panjab University, Chandigarh 160014, India
S. Singha
Institute of Modern Physics, Chinese Academy of Sciences, Lanzhou, Gansu 730000
M. J. Skoby
Purdue University, West Lafayette, Indiana 47907
N. Smirnov
Yale University, New Haven, Connecticut 06520
Y. Söhngen
University of Heidelberg, Heidelberg 69120, Germany
W. Solyst
Indiana University, Bloomington, Indiana 47408
P. Sorensen
Brookhaven National Laboratory, Upton, New York 11973
H. M. Spinka
Deceased
Argonne National Laboratory, Argonne, Illinois 60439
B. Srivastava
Purdue University, West Lafayette, Indiana 47907
T. D. S. Stanislaus
Valparaiso University, Valparaiso, Indiana 46383
M. Stefaniak
Warsaw University of Technology, Warsaw 00-661, Poland
D. J. Stewart
Yale University, New Haven, Connecticut 06520
M. Strikhanov
National Research Nuclear University MEPhI, Moscow 115409, Russia
B. Stringfellow
Purdue University, West Lafayette, Indiana 47907
A. A. P. Suaide
Universidade de São Paulo, São Paulo, Brazil 05314-970
M. Sumbera
Nuclear Physics Institute of the CAS, Rez 250 68, Czech Republic
B. Summa
Pennsylvania State University, University Park, Pennsylvania 16802
X. M. Sun
Central China Normal University, Wuhan, Hubei 430079
X. Sun
University of Illinois at Chicago, Chicago, Illinois 60607
Y. Sun
University of Science and Technology of China, Hefei, Anhui 230026
Y. Sun
Huzhou University, Huzhou, Zhejiang 313000
B. Surrow
Temple University, Philadelphia, Pennsylvania 19122
D. N. Svirida
Alikhanov Institute for Theoretical and Experimental Physics NRC ”Kurchatov Institute”, Moscow 117218, Russia
Z. W. Sweger
University of California, Davis, California 95616
P. Szymanski
Warsaw University of Technology, Warsaw 00-661, Poland
A. H. Tang
Brookhaven National Laboratory, Upton, New York 11973
Z. Tang
University of Science and Technology of China, Hefei, Anhui 230026
A. Taranenko
National Research Nuclear University MEPhI, Moscow 115409, Russia
T. Tarnowsky
Michigan State University, East Lansing, Michigan 48824
J. H. Thomas
Lawrence Berkeley National Laboratory, Berkeley, California 94720
A. R. Timmins
University of Houston, Houston, Texas 77204
D. Tlusty
Creighton University, Omaha, Nebraska 68178
T. Todoroki
University of Tsukuba, Tsukuba, Ibaraki 305-8571, Japan
M. Tokarev
Joint Institute for Nuclear Research, Dubna 141 980, Russia
C. A. Tomkiel
Lehigh University, Bethlehem, Pennsylvania 18015
S. Trentalange
University of California, Los Angeles, California 90095
R. E. Tribble
Texas A&M University, College Station, Texas 77843
P. Tribedy
Brookhaven National Laboratory, Upton, New York 11973
S. K. Tripathy
ELTE Eötvös Loránd University, Budapest, Hungary H-1117
T. Truhlar
Czech Technical University in Prague, FNSPE, Prague 115 19, Czech Republic
B. A. Trzeciak
Czech Technical University in Prague, FNSPE, Prague 115 19, Czech Republic
O. D. Tsai
University of California, Los Angeles, California 90095
Z. Tu
Brookhaven National Laboratory, Upton, New York 11973
T. Ullrich
Brookhaven National Laboratory, Upton, New York 11973
D. G. Underwood
Argonne National Laboratory, Argonne, Illinois 60439
I. Upsal
Shandong University, Qingdao, Shandong 266237
Brookhaven National Laboratory, Upton, New York 11973
G. Van Buren
Brookhaven National Laboratory, Upton, New York 11973
J. Vanek
Nuclear Physics Institute of the CAS, Rez 250 68, Czech Republic
A. N. Vasiliev
NRC ”Kurchatov Institute”, Institute of High Energy Physics, Protvino 142281, Russia
I. Vassiliev
Frankfurt Institute for Advanced Studies FIAS, Frankfurt 60438, Germany
V. Verkest
Wayne State University, Detroit, Michigan 48201
F. Videbæk
Brookhaven National Laboratory, Upton, New York 11973
S. Vokal
Joint Institute for Nuclear Research, Dubna 141 980, Russia
S. A. Voloshin
Wayne State University, Detroit, Michigan 48201
F. Wang
Purdue University, West Lafayette, Indiana 47907
G. Wang
University of California, Los Angeles, California 90095
J. S. Wang
Huzhou University, Huzhou, Zhejiang 313000
P. Wang
University of Science and Technology of China, Hefei, Anhui 230026
Y. Wang
Central China Normal University, Wuhan, Hubei 430079
Y. Wang
Tsinghua University, Beijing 100084
Z. Wang
Shandong University, Qingdao, Shandong 266237
J. C. Webb
Brookhaven National Laboratory, Upton, New York 11973
P. C. Weidenkaff
University of Heidelberg, Heidelberg 69120, Germany
L. Wen
University of California, Los Angeles, California 90095
G. D. Westfall
Michigan State University, East Lansing, Michigan 48824
H. Wieman
Lawrence Berkeley National Laboratory, Berkeley, California 94720
S. W. Wissink
Indiana University, Bloomington, Indiana 47408
J. Wu
Institute of Modern Physics, Chinese Academy of Sciences, Lanzhou, Gansu 730000
Y. Wu
University of California, Riverside, California 92521
B. Xi
Shanghai Institute of Applied Physics, Chinese Academy of Sciences, Shanghai 201800
Z. G. Xiao
Tsinghua University, Beijing 100084
G. Xie
Lawrence Berkeley National Laboratory, Berkeley, California 94720
W. Xie
Purdue University, West Lafayette, Indiana 47907
H. Xu
Huzhou University, Huzhou, Zhejiang 313000
N. Xu
Lawrence Berkeley National Laboratory, Berkeley, California 94720
Q. H. Xu
Shandong University, Qingdao, Shandong 266237
Y. Xu
Shandong University, Qingdao, Shandong 266237
Z. Xu
Brookhaven National Laboratory, Upton, New York 11973
Z. Xu
University of California, Los Angeles, California 90095
C. Yang
Shandong University, Qingdao, Shandong 266237
Q. Yang
Shandong University, Qingdao, Shandong 266237
S. Yang
Rice University, Houston, Texas 77251
Y. Yang
National Cheng Kung University, Tainan 70101
Z. Ye
Rice University, Houston, Texas 77251
Z. Ye
University of Illinois at Chicago, Chicago, Illinois 60607
L. Yi
Shandong University, Qingdao, Shandong 266237
K. Yip
Brookhaven National Laboratory, Upton, New York 11973
Y. Yu
Shandong University, Qingdao, Shandong 266237
H. Zbroszczyk
Warsaw University of Technology, Warsaw 00-661, Poland
W. Zha
University of Science and Technology of China, Hefei, Anhui 230026
C. Zhang
State University of New York, Stony Brook, New York 11794
D. Zhang
Central China Normal University, Wuhan, Hubei 430079
J. Zhang
Shandong University, Qingdao, Shandong 266237
S. Zhang
University of Illinois at Chicago, Chicago, Illinois 60607
S. Zhang
Fudan University, Shanghai, 200433
X. P. Zhang
Tsinghua University, Beijing 100084
Y. Zhang
Institute of Modern Physics, Chinese Academy of Sciences, Lanzhou, Gansu 730000
Y. Zhang
University of Science and Technology of China, Hefei, Anhui 230026
Y. Zhang
Central China Normal University, Wuhan, Hubei 430079
Z. J. Zhang
National Cheng Kung University, Tainan 70101
Z. Zhang
Brookhaven National Laboratory, Upton, New York 11973
Z. Zhang
University of Illinois at Chicago, Chicago, Illinois 60607
J. Zhao
Purdue University, West Lafayette, Indiana 47907
C. Zhou
Fudan University, Shanghai, 200433
X. Zhu
Tsinghua University, Beijing 100084
Z. Zhu
Shandong University, Qingdao, Shandong 266237
M. Zurek
Lawrence Berkeley National Laboratory, Berkeley, California 94720
M. Zyzak
Frankfurt Institute for Advanced Studies FIAS, Frankfurt 60438, Germany
Abstract
According to first principle Lattice QCD calculations,
the transition from quark-gluon plasma to hadronic matter is a smooth crossover
in the region .
In this range the ratio, , of net-baryon distributions are predicted to be negative.
In this paper, we report the first measurement of the midrapidity net-proton
from 27, 54.4 and 200 GeV Au+Au collisions at RHIC.
The dependence on collision centrality and kinematic acceptance in (, ) are analyzed.
While for 27 and 54.4 GeV collisions the values are close to zero within uncertainties,
it is observed that for 200 GeV collisions, the ratio becomes progressively
negative from peripheral to central collisions.
Transport model calculations without critical dynamics predict
mostly positive values except for the most central collisions within uncertainties.
These observations seem to favor a smooth crossover in the high energy nuclear collisions at top RHIC energy.
One of the main goals of high-energy nuclear physics is to understand
the phase diagram of the strongly interacting matter predicted by quantum chromo-dynamics (QCD),
with respect to temperature () and baryon chemical potential ().
At high and/or , the strongly interacting matter called
quark-gluon plasma (QGP) is predicted to exist, while the hadronic matter
appears at low Fukushima and Hatsuda (2011); Braun-Munzinger and Wambach (2009); Asakawa and Yazaki (1989).
The phase transition between QGP and hadronic matter
at was shown to be a smooth crossover,
based on first-principle lattice QCD calculations Aoki et al. (2006).
At finite , on the other hand, the phase transition
is predicted to be of the first order Ejiri (2008).
If this is true, a critical end point may also exist,
which is the connecting point between crossover and the
first-order phase transition Bowman and Kapusta (2009).
Experimentally, the QCD phase diagram can be explored by measuring heavy-ion collisions at various collision energies.
The beam energy scan (BES) program was carried out at the Relativistic Heavy-Ion
Collider (RHIC), and data sets for Au+Au collisions at 7.7,
11.5, 14.5, 19.6, 27, 39, 54.4, 62.4, and 200 GeV were collected by the STAR experiment.
The th-order cumulants () and their ratios up to the
fourth-order of net-charge, net-proton, and net-kaon multiplicity distributions
have been measured to search for the
critical point Aggarwal et al. (2010); Adamczyk et al. (2014a); Adam et al. (2021); Adamczyk et al. (2014b, 2018); Abdallah et al. (2021).
In particular, the ratio of the net-proton multiplicity distributions
with an extended coverage shows a non-monotonic beam energy dependence
in Au+Au central collisions Adam et al. (2021).
This is qualitatively consistent with a theoretical model
prediction which incorporates a critical point Stephanov et al. (1999); Stephanov (2011).
Since the results are dominated by large statistical uncertainties at low
collision energies, the beam energy scan phase II (BES-II)
and the fixed-target programs are being performed
to detect more definitive signatures of the critical point BES .
New findings on the QCD phase structure at large are thus
expected in the near future from the BES-II program.
There is no direct experimental
evidence of a smooth crossover at MeV as predicted by the lattice
QCD calculations.
This can be studied by measuring the ratio of the sixth to
second-order cumulant () of net-baryon and
net-charge multiplicity distributions.
According to the QCD model calculations,
the values of net-baryon distributions become negative at 60 GeV
if the freeze-out, where ratios of particle yields are fixed,
occurs near the chiral crossover temperature Friman et al. (2011), whereas the hadron resonance gas model
calculations yield a positive sign for Borsanyi et al. (2018).
Recent model studies predict a negative sign of at GeV
within large uncertainties Fu et al. (2021).
Furthermore, recent lattice QCD calculations also show a negative
sign of the ratio of the sixth-order to the second-order baryon number
susceptibilities, , at the
transition temperature for 39 GeV Borsanyi et al. (2018); Bazavov et al. (2020).
The susceptibility ratio can be compared to a corresponding ratio of experimentally measured cumulants.
This Letter reports of event-by-event net-proton
multiplicity () distributions
for Au+Au collisions at 27, 54.4, and 200 GeV.
These three collision energies correspond to 144, 83, and 28 MeV, respectively,
for the most central collisions Adamczyk et al. (2017).
The data sets for 54.4 and 27 GeV were taken in 2017 and 2018.
The data for 200 GeV were collected in 2010 and 2011.
The numbers of events analyzed for 0-80% centrality at 27, 54.4, and 200 GeV
are around , , and million, respectively.
All data were taken with a minimum bias trigger, except for
0-10% centrality of 200 GeV data in 2010, which was taken with a special trigger
with enhanced event samples for central collisions.
All data were taken with the time projection chamber (TPC) and the time of flight (TOF)
detector at the solenoid tracker at RHIC (STAR).
Events occurring within cm from the center
of the TPC along the beam line (-direction) are selected.
The transverse positions of the collisions are required
to be within cm to reject interactions between
the beam and the beam pipe Adamczyk et al. (2017).
Events from pileup, which is defined as the superposition of
several single-collision events occurring within a small space and time interval,
are rejected by cutting on the correlation between
the charged particle multiplicity measured by the TPC and extrapolated
tracks from the TPC to the hit positions in the TOF.
The collision centrality is defined using the charged particle multiplicities
measured by the TPC in .
Protons and antiprotons are excluded from the above centrality definition
in order to minimize self-correlation effects Luo and Xu (2017).
Event-by-event numbers of protons and antiprotons are measured
at midrapidity, , for the transverse momentum range .
Protons and antiprotons at are identified using ionization energy
loss distributions measured by the TPC (),
while at
they are identified using the mass squared () distributions measured by the TOF as well .
The lower limit of the range is chosen to reject the secondary protons
produced by interactions with the beam pipe.
Requiring the distance of closest approach to be less than
cm with respect to the collision vertex suppresses the effect from
the contribution of weak decay daughter protons.
Weak decay protons which passed this cut are all included in the analysis.
Up to the fourth order, the effect of the decay is found to be small Garg et al. (2013).
The purity of protons and antiprotons in the analyzed acceptance is
higher than % for 27, 54.4, and 200 GeV.
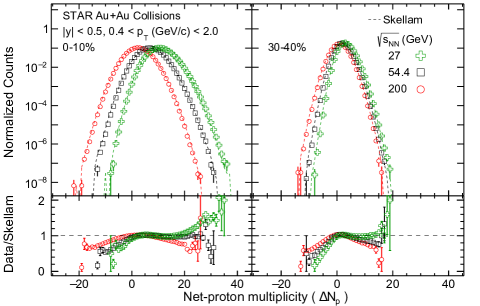
Event-by-event net-proton number () distributions for Au+Au collisions
at 27, 54.4, and 200 GeV for 0-10% and 30-40% centralities
are shown in Fig. 1.
The plotted distributions are normalized by the corresponding
total number of events and are not corrected for detector efficiencies.
The distributions for 0-10% are broader than for 30-40% as more
protons and antiprotons are produced in central collisions.
The shape of the distribution is characterized by various orders of cumulants Asakawa and Kitazawa (2016).
Definitions and formulas for cumulant calculations can be found in the Supplemental
Material.
Cumulants are extensive variables proportional to
the volume of the collision system Asakawa and Kitazawa (2016).
This undesired volume effect is canceled by taking the ratio of
different order cumulants.
Then the value can be compared with the ratio of baryon number susceptibilities
() from lattice QCD calculations,
keeping in mind the difference between net-baryon from theory calculations and net-proton from the data within
the limited experimental acceptance.
When multiplicities of protons and antiprotons follow Poisson distributions,
the resulting net-proton distribution is called a Skellam distribution.
The odd-order and even-order cumulants of the Skellam distribution are expressed
by the difference and sum of the mean values () of the Poisson distributions, respectively.
Hence, for the Skellam distribution.
The Skellam distributions determined from of protons and antiprotons
for each collision energy and centrality are shown by dashed lines in Fig. 1.
According to the ratio of data to the Skellam expectations, shown in the lower part of Fig. 1, deviations from
the Skellam distributions are seen especially at the tails of the distribution.
It is known that the statistical uncertainties
on higher-order cumulants become larger for broader
distributions Luo and Xu (2017).
A model study indicates that higher-order cumulants
suffer from larger statistical uncertainties.
The effect increases with increasing order of the cumulant Luo (2015).
Statistical uncertainties also depend on the detector efficiencies.
A lower efficiency gives larger statistical errors for cumulants
after efficiency corrections.
A centrality bin width correction is applied
for each centrality bin to suppress the effect from the initial volume
fluctuations Skokov et al. (2013); Luo and Xu (2017); Sugiura et al. (2019).
Statistical uncertainties are calculated
using a bootstrap method Luo and Xu (2017); Pandav et al. (2019).
All results of presented in this Letter are corrected for the detector efficiency
assuming that the detector efficiencies
follow the binomial distribution Kitazawa and Asakawa (2012); Bzdak and Koch (2012); Nonaka et al. (2016); Bzdak and Koch (2015); Luo (2015); Luo and Nonaka (2019); Kitazawa (2016); Nonaka et al. (2017).
Non-binomial efficiencies Bzdak et al. (2016) are also studied
through detector simulations in the STAR environment.
Cumulants are corrected for non-binomial efficiencies using the unfolding
and moment expansion approaches Esumi et al. (2021); Nonaka et al. (2018).
Results up to the sixth-order cumulant for Au+Au central collisions
at GeV are presented in the Supplemental Material.
It is concluded that the results corrected for non-binomial efficiencies
are consistent with the results from the binomial efficiency correction within
statistical uncertainties.
Systematic uncertainties are estimated by changing the following
variables used to select protons and antiprotons:
the distance of closest approach to the primary collision vertex and
number of hits in the TPC to reconstruct tracks for the track quality cut,
, and selections for (anti)proton identification criteria.
A Barlow check is done to remove the statistical effects from
being counted as part of systematic uncertainties Barlow (2002).
The contribution from track quality cuts is dominant for central collisions.
The systematic uncertainties from each source go down below 10% in peripheral collisions.
The uncertainties for each source are then added in quadrature.
The total systematic uncertainties are 87%, 70%, and 37% at 27, 54.4, and 200 GeV, respectively,
for 0-10% central collisions, and the corresponding totals decrease down to a few percent in peripheral collisions.
Figure 1:
Event by event net-proton multiplicity, , distributions for
Au+Au collisions at 27, 54.4, and 200 GeV in 0-10%(left) and 30-40%(right)
centralities at midrapidity () for the transverse
momentum range of . These distributions are normalized
by the corresponding numbers of events and are not corrected for detector efficiencies.
Statistical uncertainties are shown as vertical lines.
The dashed lines show the Skellam distributions for each collision energy and centrality.
The bottom panels show the ratio of the data to the Skellam expectations.
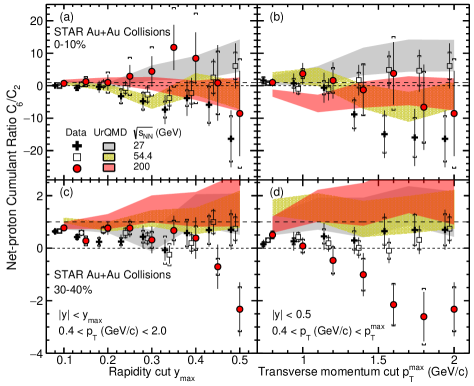
Figure 2 shows the net-proton for Au+Au collisions
for 0-10% and 30-40% centralities at 27, 54.4, and 200 GeV
as a function of rapidity and acceptance.
The values of approach the Skellam expectation,
, with narrow acceptance in and rapidity.
The reason is that multiplicity distributions of
protons and antiprotons are close to the Poisson distribution
because of lower particle multiplicity and thus less correlations,
and therefore the observed is dominated by statistical fluctuations.
The fraction of measured protons to total protons
integrated in whole region is 33%
for and 86% for
at 200 GeV.
Although the values at the smallest acceptance
of or
in Fig. 2 are still smaller than unity, we have checked that
the results are consistent with unity with further narrowed acceptance.
The values for 0-10% centrality decrease as the acceptance is increased
at 27 GeV, while is
nearly constant for 54.4 and 200 GeV within uncertainties.
On the other hand, the results for 30-40% centrality show a strong decrease with increasing acceptance at 200 GeV and
are almost flat for 27 and 54.4 GeV.
Results from the transport model UrQMD Bleicher et al. (1999), in which hadronic
interactions are dominant and there is no phase transition implemented, are shown
by shaded and hatched-bands in Fig. 2.
The event statistics used in the UrQMD calculations are 215, 100, and 95 million for 27, 54.4, and
200 GeV minimum bias Au+Au collisions, respectively. All experimental cuts
in terms of the collision centrality,
rapidity, and transverse momentum acceptance are applied in the calculations.
The values from UrQMD are flat as a function of rapidity and acceptance at 27 and 200 GeV, while
the sign changes for central collisions at 54.4 GeV albeit with large uncertainties.
Note that the thermal blurring in rapidity for conserved charges is discussed in Ref. Ohnishi et al. (2016).
More studies are necessary in order to understand the rapidity dependence as a function of collision energies.
Figure 2:
Net-proton as a function of rapidity (left)
and transverse momentum acceptance (right) from (crosses),
54.4 (open squares), and 200 GeV (filled circles) Au+Au collisions.
The upper and lower plots are for 0-10% and 30-40% centralities, respectively.
The error bars are statistical and caps are systematic errors.
Points for different beam energies are staggered horizontally to improve clarity.
UrQMD transport model results are shown as shaded and hatched bands.
The Skellam expectation () is shown as long-dashed lines.
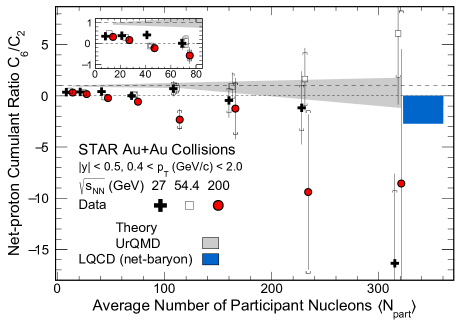
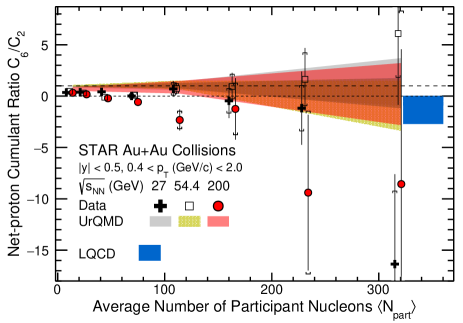
In Fig. 3, the centrality dependence of the net-proton at midrapidity
is shown for all three collision energies. The data with the largest number of
participant nucleons () corresponds to the top 0-10% central collisions
and the rest of the points are for 10-20%, 20-30%, 30-40%,… , and 70-80% centralities.
For 200 GeV collisions (filled circles), values are approaching the Skellam expectation ()
from central to peripheral collisions.
The values then start to be negative from 50-60% centrality, and stay negative systematically
in central collisions within large uncertainties.
Most measurements at 27 and 54.4 GeV are consistent with zero within uncertainties.
We find that the values are negative within sigma at 200 GeV 30-40% centrality
with statistical and systematic uncertainties added in quadrature.
QCD-inspired model calculations Friman et al. (2011) show that at vanishing baryon chemical potential,
the crossover transition from the QGP to hadronic phase and its
remnants will affect higher-order cumulant ratios.
The model further suggests that the value of of the net-baryon distribution should be positive and negative
for the emerging medium from hadronic and QGP phases, respectively.
All of the results from the UrQMD calculations are consistent
with the Skellam expectation () within large statistical fluctuations towards more central collisions.
Overall, the UrQMD calculations of the net-proton reproduce, within errors,
the measured centrality dependence for 27 and 54.4 GeV Au+Au collisions.
Experimental results for 200 GeV are below UrQMD calculations systematically from peripheral to central collisions.
First-principle lattice QCD calculations offer accurate information on the properties
of a thermalized system with zero baryon chemical potential. For example, see Ref. Aoki et al. (2006).
By a Taylor expansion at small , one could extend the predictions to finite
values of the baryon chemical potential. The lattice calculations with a temperature
of 160 MeV and baryon chemical potential up to MeV are shown as the blue band in Fig. 3 Bazavov et al. (2020); Borsanyi et al. (2018).
Lattice calculations also indicate that in the region of ,
the transition from QGP to hadronic matter is a smooth crossover Borsanyi et al. (2018).
The ratios are approximately 0.17, 0.55, and 0.93
for central Au+Au collisions at , 54, and 27 GeV, respectively.
Please note there are caveats
when comparing experimental data with lattice calculations. While the current experimental data are
midrapidity net-proton distributions from the kinematic region of and ,
the lattice results are for net-baryons and do not incorporate any of the experimental kinematic cuts Kitazawa and Asakawa (2012).
It is also known that the cumulants are affected by both baryon number conservation and baryon stopping Bzdak et al. (2013); Braun-Munzinger et al. (2017); Vovchenko and Koch (2021); Vovchenko et al. (2021)
which are expected to be more significant towards lower collision energies Braun-Munzinger et al. (2021); Mishra and Garg (2017).
Both effects are present in the results presented here.
In addition, the lattice simulates a thermalized system but without other dynamics such as
collective expansion in high-energy nuclear collisions.
These differences between experiments and lattice calculations
need to be carefully handled in the future for a quantitative comparison.
With these caveats in mind, the trend observed in Au+Au collisions at 200 GeV
that becomes negative with increasing centrality is potentially consistent
with the smooth crossover scenario.
Higher statistics data sets are necessary in order to establish trend in the finite range.
Figure 3:
Collision centrality dependence of net-proton
in Au+Au collisions for 27, 54.4, and 200 GeV
within and .
The error bars are statistical and caps are systematic errors.
Points for different beam energies are staggered horizontally to improve clarity.
A shaded band shows the results from UrQMD model calculations.
UrQMD calculations from the above three collision energies are consistent among them so they are merged in order to reduce statistical fluctuations.
Details on these calculations can be found in the Supplemental
Material.
The lattice QCD calculations on net-baryon number fluctuations Borsanyi et al. (2018); Bazavov et al. (2020)
for MeV and 110 MeV. are shown as a blue band at .
The inset shows the expanded region of 40-80% centrality.
In summary, we report the first measurements of the net-proton higher-order
cumulant ratio from 27, 54.4 and 200 GeV Au+Au collisions measured
by the STAR detector at RHIC. The data is taken from the kinematic region ( and ).
Data from 200 GeV collisions are found to be negative progressively
in more central collisions within the maximum acceptance, while the ratios
from 27 and 54.4 GeV collisions are found to be close to zero within uncertainties.
Without critical dynamics, the transport model UrQMD calculations predict the ratio
around a statistical baseline in all cases.
Lattice QCD calculations, with MeV and - MeV,
predict the negative value of , which is qualitatively consistent with the experimental
results of central Au+Au collisions at top RHIC energies.
These new measurements are statistics limited and seem to favor a smooth crossover for the QGP-hadronic matter transition.
Future measurements with high statistics will provide more detailed information
about the phase structure at the low baryon density region.
We thank the RHIC Operations Group and RCF at BNL, the NERSC Center at LBNL, and the Open Science Grid consortium for providing resources and support. This work was supported in part by the Office of Nuclear Physics within the U.S. DOE Office of Science, the U.S. National Science Foundation, the Ministry of Education and Science of the Russian Federation, National Natural Science Foundation of China, Chinese Academy of Science, the Ministry of Science and Technology of China and the Chinese Ministry of Education, the Higher Education Sprout Project by Ministry of Education at NCKU, the National Research Foundation of Korea, Czech Science Foundation and Ministry of Education, Youth and Sports of the Czech Republic, Hungarian National Research, Development and Innovation Office, New National Excellency Programme of the Hungarian Ministry of Human Capacities, Department of Atomic Energy and Department of Science and Technology of the Government of India, the National Science Centre of Poland, the Ministry of Science, Education and Sports of the Republic of Croatia, RosAtom of Russia and German Bundesministerium fur Bildung, Wissenschaft, Forschung and Technologie (BMBF), Helmholtz Association, Ministry of Education, Culture, Sports, Science, and Technology (MEXT) and Japan Society for the Promotion of Science (JSPS).
The shape of the distribution is characterized by th-order
moments which are defined as
(1)
where is the moment generating function,
and is the probability distribution function to find
particles Asakawa and Kitazawa (2016).
Similarly, the th-order cumulant, , is defined as
(2)
where is the cumulant generating function.
The th-order cumulant is then calculated recursively from lower-order moments as
(3)
In experiments, the measured cumulants have to be corrected for detector efficiencies.
The efficiency correction of the th-order cumulant, is performed with the
following formulas Nonaka et al. (2017); Luo and Nonaka (2019):
(4)
(5)
(6)
(7)
(8)
with
(10)
where angle brackets represent represents a cumulant, represents the number of efficiency bins,
and represent the electric charge and efficiency at the th efficiency bin,
and and are the powers of and , respectively.
.2 Efficiency distributions
In general, cumulants of net-particle distributions are corrected for
detector efficiencies, and are assumed to follow binomial distributions Kitazawa and Asakawa (2012); Bzdak and Koch (2012); Luo (2015); Nonaka et al. (2017).
However, it was pointed out that the correction method loses its validity once the binomial assumption
is broken Bzdak et al. (2016); Nonaka et al. (2018).
In order to check the efficiency distributions of the STAR detector,
Monte-Carlo simulations are employed in the STAR detector environment.
The number of reconstructed protons is used to study non-binomial
effect of the detector in the most severe environment
in terms of the particle multiplicity, MC tracks are embedded
in the data for Au+Au 0-5% central collisions at 200 GeV.
Efficiencies are also studied by varying the embedded number of protons and antiprotons to see
the dependence of non-binomial effects on the track density.
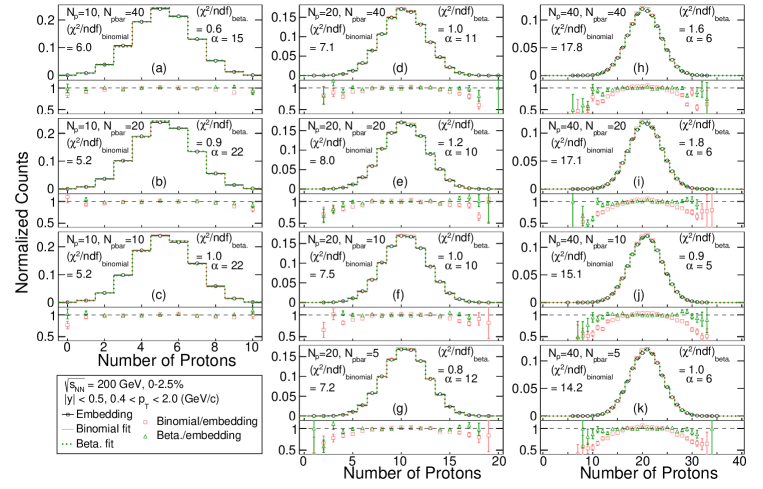
Figure 4 shows reconstructed protons as black circles.
Each panel represents a different number of embedded protons and antiprotons.
Embedding data is then fitted by the binomial distribution
as shown by red solid lines in Fig. 4.
The values can be found in each panel.
The ratio of the fitted function to the embedding data is shown in the lower panels.
It is found that the tail of the distributions in panel (e), (f),… (k) in Fig. 4
deviates from binomial distributions.
The beta-binomial distribution is employed to fit the embedding data in addition to the binomial distribution.
The beta-binomial distribution is defined as
(11)
with the beta distribution being
(12)
where is the beta function.
Each variable is defined through a model as follows.
It is known that the beta-binomial distribution is given by an urn model.
Let us consider white balls and black balls in the urn.
One draws a ball from the urn. If it is white (black),
return two white (black) balls to the urn.
This procedure is repeated times, then the resulting distribution
of (white balls) is given by the beta-binomial distributions as .
This is equivalent to ,
where with .
Smaller gives a broader distribution than the binomial,
while the distribution becomes close to the binomial distribution with larger .
The beta-binomial distributions are numerically generated using various values of .
They are compared to the embedding data to determine the best parameter to
fit the efficiency distributions.
The fitted function is shown by the green dotted lines in Fig. 4.
The values of are found to be around unity in most of .
This indicates that the STAR efficiency follows the beta-binomial distribution
in Au+Au collisions 0-2.5% centrality at 200 GeV.
Similar checks are done for 2.5-5.0% centrality. It is found that the efficiency distribution
follows the beta-binomial distribution also for 2.5-5.0% centrality.
Figure 4:
Distributions of reconstructed protons (black circles) from
embedding simulations in 200 GeV Au+Au collisions at 0-2.5% centrality. Red lines are
fits with the binomial distribution, and green dotted lines represent the
fit with the beta-binomial distributions using that gives the minimal .
Each panel shows the result from the given combinations of embedded
protons and antiprotons. The ratio of fits to the embedding data is shown for each panel.
(,)
values
binomial
beta-binomial ()
(10,10)
5.2
1.0 (22)
(10,20)
5.2
0.9 (22)
(10,40)
6.0
0.6 (15)
(20,5)
7.2
0.8 (12)
(20,10)
7.5
1.0 (10)
(20,20)
8.0
1.2 (10)
(20,40)
7.1
1.0 (11)
(40,5)
14.2
1.0 (6)
(40,10)
15.1
0.9 (5)
(40,20)
17.1
1.8 (6)
(40,40)
17.8
1.6 (6)
Table 1:
of fit results in Fig. 4
for the given combinations of embedded protons and antiprotons
from embedding simulations in 200 GeV Au+Au collisions at 0-2.5% centrality.
The non-binomial parameter is also shown for results using the beta-binomial distribution.
.3 Non-binomial efficiency correction
Two correction methods for non-binomial efficiency are employed.
One is the unfolding approach to reconstruct the distribution itself Esumi et al. (2021),
and the other one is the moment expansion to correct moments
in an analytic way Nonaka et al. (2018).
Both methods utilize knowledge of the detector response between
generated and reconstructed particles computed by detector simulations,
which is called response matrix.
From the embedding simulation discussed in Sec. .2,
and are parameterized as a function
of and . Using the parametrization, the
4-dimensional response matrices between generated/reconstructed coordinates for protons and antiprotons are
generated using 1 billion events.
Another two response matrices are also generated using
and , where is the statistical uncertainty on .
Furthermore, the response matrices of the binomial distribution are generated
with track density dependence of the efficiency implemented
111The track density here represents event-by-event (anti)protons
in the generated coordinate, which cannot be considered in the conventional
efficiency correction method. Note that the dependence of efficiency on
the total multiplicity is already taken into account in the centrality bin width correction (CBWC). Bzdak et al. (2016).
Those response matrices are utilized to correct for the detector effects.
We have checked that both the unfolding approach and the moment expansion method
Esumi et al. (2021); Nonaka et al. (2018) give consistent cumulant results.
Thus, we focus on the results of the unfolding approach in the rest of this section.
It should be noted that in Ref. Adam et al. (2021) the effect of non-binomial effects of up to the fourth-order cumulants and their ratios are discussed and found to be small within statistical uncertainties.
Therefore, we present the effects on the higher-order cumulants and ratios, , , , and
for Au+Au collisions at 200 GeV 0-5% centrality as
shown in Fig. 5.
For each column, the first two points are the results corrected for
the binomial detector response, and last three points are from
the unfolding with beta-binomial response using
different non-binomial parameters. The dependence of efficiency
on the track density ( and themselves) is taken into account for the last four points.
Those results are arbitrarily ordered from left to right
as response matrices have larger deviations compared
to the binomial distribution.
They are calculated for 0-2.5% and 2.5-5.0% centralities
separately and averaged to 0-5% centrality.
Table 2 summarizes the cumulant ratios and their errors.
Results corrected for beta-binomial response matrices with non-binomial
parameters being are considered as systematic
uncertainties.
Statistical and systematic uncertainties are added in quadrature to calculate total uncertainties.
The deviations of results corrected for non-binomial efficiencies
compared to the binomial efficiency correction is found to be
less than sigma for and .
Again, we note that these results are from 200 GeV Au+Au collisions at 0-5% centrality.
This is the highest Au+Au collision energy at RHIC,
where the high multiplicity is expected to result in the largest non-binomial detector effects.
It is noteworthy that the experimental data for 200 GeV has the
largest statistics among the studied datasets.
Therefore, we conclude that the non-binomial detector effects on higher-order
cumulants and their ratios would be within errors for all BES-I energies.
Figure 5:
Cumulants and their ratios up to the sixth order corrected for non-binomial efficiencies
for 200 GeV Au+Au collisions at 0-5% centrality. The CBWC is applied for
2.5% centrality bin width.
Results from the conventional efficiency correction are shown as black filled circles,
results from the unfolding with the binomial detector response are shown as black open circles,
and results from beta-binomial detector response with ,
and are shown in green triangles, red squares and blue triangles, respectively.
, , , and are scaled by constant shown
in each column.
Cumulant ratio
binomialstat.err
beta.stat.errsys.err
significance
Table 2:
Cumulant ratios and their statistical errors (second column) from the conventional
efficiency correction with the binomial detector response, and
(third column) from unfolding with the beta-binomial detector response.
Systematic errors are also shown for the beta-binomial case.
The last column shows the difference between the two results normalized by the total errors
mentioned above.
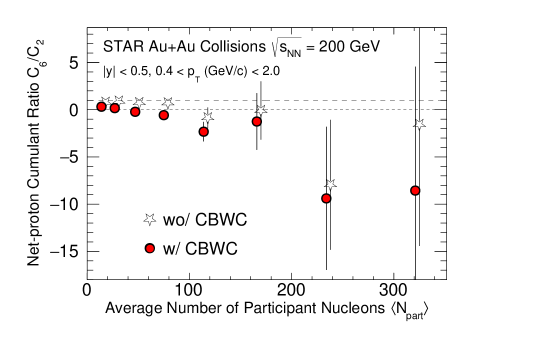
.4 Effect of centrality bin width correction (CBWC)
Figure 6 shows centrality dependence of net-proton from Au+Au GeV collisions.
The centrality bin width correction (CBWC) Luo and Xu (2017) is applied for the red markers to supress the effect from initial volume fluctuations.
No volume correction is applied for the star markers.
One can see that the volume fluctuations enhance the value of net-proton .
Note that there is no perfect solution to remove the volume fluctuations, hence the data driven approach, CBWC, is employed in the measurements.
Figure 6:
Collision centrality dependence of net-proton
in Au+Au collisions for 200 GeV
within and .
Results with and without the CBWC are overlaid.
The results are corrected for detector efficiencies.
Points for different calculation methods are staggered horizontally to improve clarity.
.5 UrQMD calculations
Figure 7 shows centrality dependence of net-proton from
experimental data and UrQMD calculations for 27, 54.4, and 200 GeV.
The UrQMD results are merged for 0-30%, 30-60%, and 60-80% centralities to reduce statistical uncertainties.
One can see that the values from three collision energies in UrQMD calculations are consistent with each other
within uncertainties, and therefore they are merged to reduce statistical fluctuations in the paper.
Figure 7:
Collision centrality dependence of net-proton
in Au+Au collisions for 27, 54.4, and 200 GeV
within and .
Points for different beam energies are staggered horizontally to improve clarity.
Shaded and hatched bands show the results from UrQMD model calculations
The lattice QCD calculations Borsanyi et al. (2018); Bazavov et al. (2020)
for MeV and 110 MeV. are shown as a blue band at .