Evidence for a single-layer van der Waals multiferroic
Abstract
Multiferroic materials have garnered wide interest for their exceptional static [1, 2, 3] and dynamical [4, 5, 6] magnetoelectric properties. In particular, type-II multiferroics exhibit an inversion-symmetry-breaking magnetic order which directly induces a ferroelectric polarization through various mechanisms, such as the spin-current or the inverse Dzyaloshinskii-Moriya effect [3, 7]. This intrinsic coupling between the magnetic and dipolar order parameters results in record-strength magnetoelectric effects [8, 3]. Two-dimensional materials possessing such intrinsic multiferroic properties have been long sought for harnessing magnetoelectric coupling in nanoelectronic devices [1, 9, 10]. Here, we report the discovery of type-II multiferroic order in a single atomic layer of the transition metal-based van der Waals material NiI2. The multiferroic state of NiI2 is characterized by a proper-screw spin helix with given handedness, which couples to the charge degrees of freedom to produce a chirality-controlled electrical polarization. We use circular dichroic Raman measurements to directly probe the magneto-chiral ground state and its electromagnon modes originating from dynamic magnetoelectric coupling. Using birefringence and second-harmonic generation measurements, we detect a highly anisotropic electronic state simultaneously breaking three-fold rotational and inversion symmetry, and supporting polar order. The evolution of the optical signatures as a function of temperature and layer number surprisingly reveals an ordered magnetic, polar state that persists down to the ultrathin limit of monolayer NiI2. These observations establish NiI2 and transition metal dihalides as a new platform for studying emergent multiferroic phenomena, chiral magnetic textures and ferroelectricity in the two-dimensional limit.
Main text
The recent discovery of intrinsic magnetic order in atomically-thin van der Waals (vdW) materials [11, 12] has created new opportunities for the study of collective spin phenomena in free-standing two-dimensional (2D) systems and nanoscale devices [13, 14]. In past years, significant efforts have been made to achieve direct electrical control and manipulation of magnetic properties in 2D [9, 10], but the mechanisms remain elusive. A more promising avenue towards realizing electrical control of 2D magnetism may be found in vdW materials with intrinsic type-II multiferroicity. In type-II multiferroics, the direct coupling between the magnetic and ferroelectric order parameters is enabled by the presence of a spin configuration lacking inversion symmetry [15, 16, 17], resulting in a large and robust magnetoelectric response [18, 3, 8].
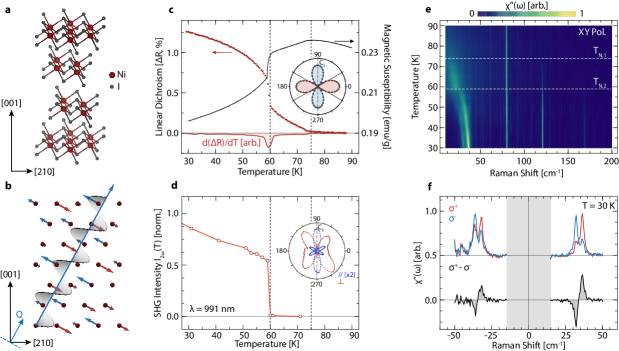
Among possible multiferroic vdW materials, several families have been identified [19, 14, 20], most prominently the transition metal dihalides (MH2, M = transition metal, H = halogen). Of particular promise is the magnetic semiconductor NiI2 [21, 22, 19, 23, 24], which is host to a rich phase diagram including a type-II multiferroic ground state [2, 25]. NiI2 crystallizes in the rhombohedral structure at room temperature, forming a triangular lattice of Ni2+ ions (, ) which are stacked along the -axis and held together by weak interlayer bonding (Fig. 1a). The 2D triangular lattice geometrically frustrates the intralayer magnetic exchange interactions that govern the long-range ordering of the local Ni spins [26, 22, 21]. This leads to a sequence of magnetic phase transitions in NiI2, first to an antiferromagnetic (AFM) state at K, and then to a proper-screw helimagnetic ground state below K. The latter exhibits long wavelength helical magnetic structure with propagation vector reciprocal lattice units (r.l.u.) [27] (Fig. 1b). The helimagnetic transition is concomitant with the appearance of an in-plane electrical polarization perpendicular to the ordering vector [2] as well as crystal symmetry lowering from rhombohedral to monoclinic [27].
Optical Characterization of Multiferroic Order in Bulk NiI2
In this study, we investigate the multiferroic states in bulk and few-layer NiI2 crystals[28]. Due to the complexity of the ground state, which simultaneously breaks mirror, rotational, and inversion symmetries, we employ a suite of complementary optical techniques to track the multiple signatures of the polar and magneto-chiral orders, as a function of temperature and layer number. Optical birefringence is found to originate from a lowering of the lattice symmetry at both the and transitions, and is consistent with a breaking of c-axis three-fold rotational symmetry () and a reduction to a single in-plane two-fold symmetry operation () [29]. We further use second harmonic generation (SHG) as a probe of inversion-symmetry breaking, which, together with lowering of rotational symmetry to , enables to track the presence of polar order down to the single-layer limit. To confirm the presence of magnetochiral order in the helimagnetic phase of NiI2, we perform Raman spectroscopy with circularly polarized light to resolve a coupled spin-lattice electromagnon excitation with strong optical activity as a signature of spin chirality. These experimental findings are supported by first-principles and Monte Carlo simulations, altogether providing robust evidence for the persistence of type-II multiferroic order down to single-layer NiI2.
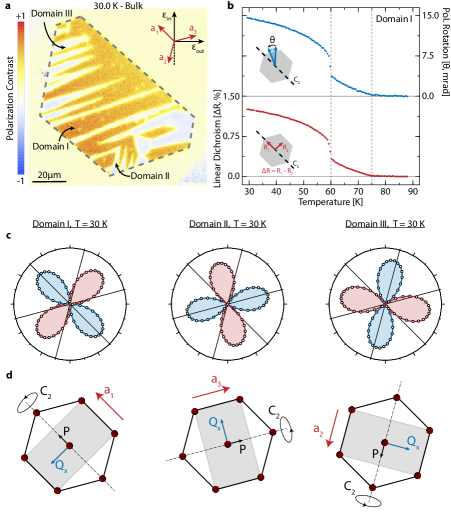
We first performed high-resolution, single-domain linear dichroism measurements on bulk NiI2 – representing the difference in reflectivity between two perpendicular, linear polarization states – across the two transitions at and (Fig. 1c). The appearance of optical birefringence indicates the breaking of the three-fold () rotational symmetry in the parent point group (see Extended Data Fig. 2 and Supplemental Information). The temperature dependence of bears a striking resemblance to the magnetic susceptibility (, Fig. 1c), with a kink at and a sharp jump at . Therefore, the reduction in the lattice rotational symmetry is a direct proxy for the change in the magnetic ground state. We further record the dependence of the linear dichroism signal on the angle of linear incident polarization with respect to the crystallographic axes, . These results (inset of Fig. 1c and Extended Data Fig. 2) display a maximum dichroism of positive sign (blue lobes) for polarization parallel to the crystallographic a-axis and display the expected two-fold rotational symmetry, confirming that the low-temperature phase is characterized by a local, unique axis.
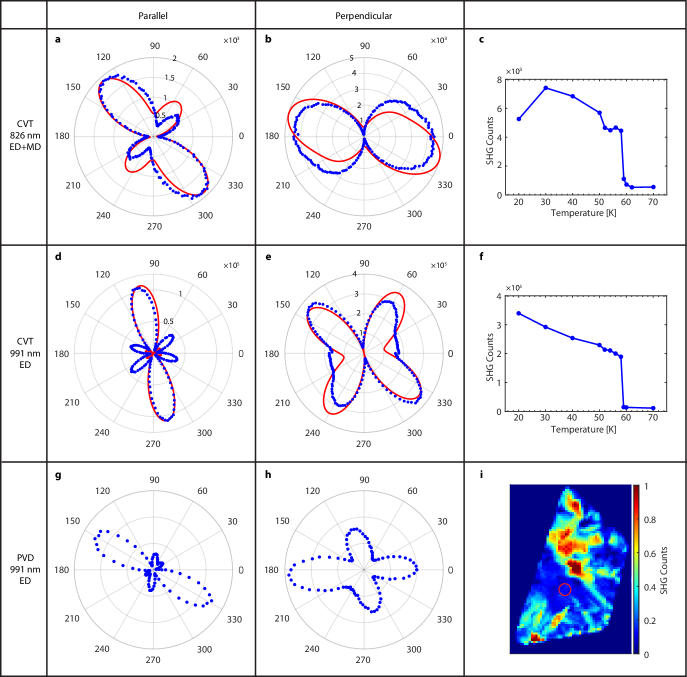
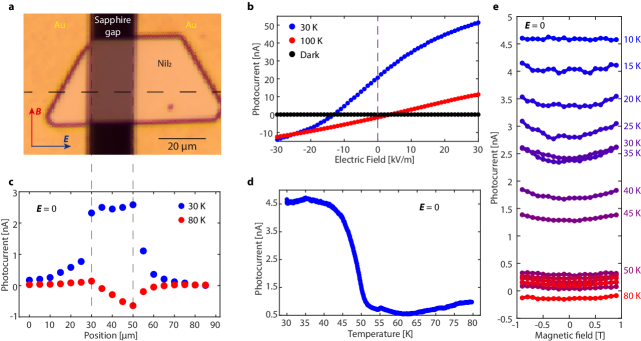
To confirm the polar nature of the low-temperature symmetry group, we measured SHG in bulk NiI2 from a mono-domain region identified through SHG imaging (Fig. 1d and Extended Data Fig. 3). Electric-dipole SHG (ED-SHG) is used as a direct probe of inversion-symmetry breaking [30]. Here, the pure electric-dipole SHG mechanism is ensured by tuning the energy of the fundamental beam to a wavelength nm that is below the optical band-gap and - transitions [29]. This is verified with rotational anisotropy SHG (RA-SHG) measurements, which agree well with the ED-SHG tensor elements predicted for the monoclinic point group in the helimagnetic phase (inset of Fig. 1c, Extended Data Fig. 3 and Supplemental Information). For wavelengths in the vicinity of the - transitions ( 780 and 826 nm), magnetic-dipole SHG originating purely from spin order, which does not necessitate inversion symmetry breaking, is also present (see Extended Data Fig. 3 and Supplemental Information). The combined observation of ED-SHG (lattice inversion-symmetry breaking) and optical birefringence (rotational-symmetry breaking) directly confirms the presence of a polar phase in NiI2 (see Supplemental Information) and an underlying single-Q, helical magnetic ground state. The resulting electrical polarization induces a bulk photovoltaic effect which was detected in photocurrent measurements on a thin NiI2 flake (Extended Data Fig. 6).
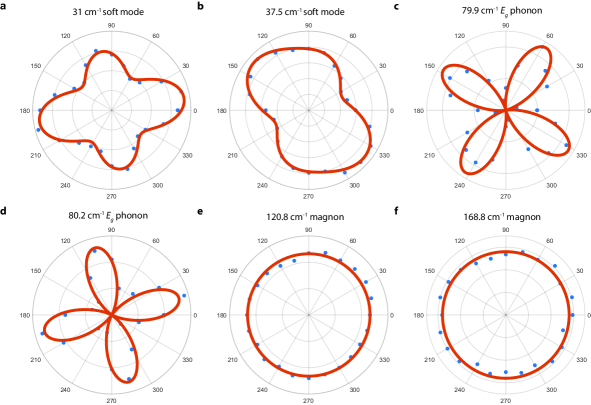
To underscore the connection between the optical signatures of polar order and the underlying magnetic state, we have performed Raman measurements ( nm) on bulk NiI2. Above , the cross-polarized (XY) Raman spectrum of NiI2 displays a single phonon at cm-1 of symmetry [28]. Our measurements reveal a major change in the Raman response in the magnetically-ordered phase, including the appearance of two new high-energy modes around , and cm-1 (Fig. 1e) which exhibit polarization selection rules corresponding to single magnon excitations [31, 32] (see Extended Data Fig. 4, 5). At low-energy transfer, a pronounced quasi-elastic signal (QES) develops on approaching [28] (Fig. 1e). Below , this broad excitation hardens into two sharp and distinct modes (Fig. 1e,f), which display a much more complex set of selection rules compared to the higher energy magnon and phonon excitations (see Extended Data Fig. 4, 5) suggesting they are electromagnons [4, 5, 6, 3, 7]. In support of this interpretation, circular polarized excitation reveals a large Raman optical activity (ROA) for the electromagnon peaks (Fig. 1f) that is absent for all other phonon and magnon excitations (Extended Data Fig. 4). The presence of large ROA for the electromagnon underscores it as a direct signature of magneto-chiral order. The reversal of the ROA between Stokes and anti-Stokes scattering (Fig. 1f) is in agreement with the optical selection rules observed for Raman-active magnetic excitations in previous studies [31].
Layer-Dependence of Multiferroicity
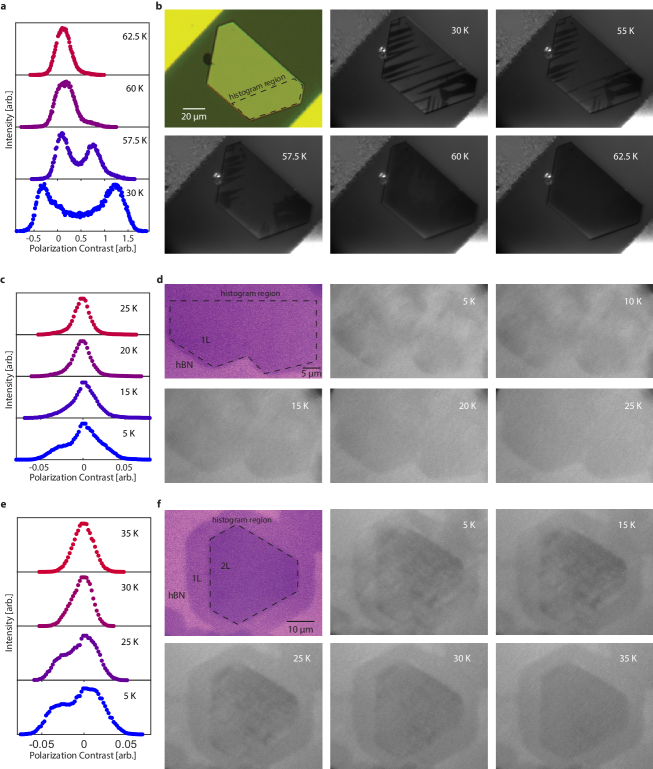
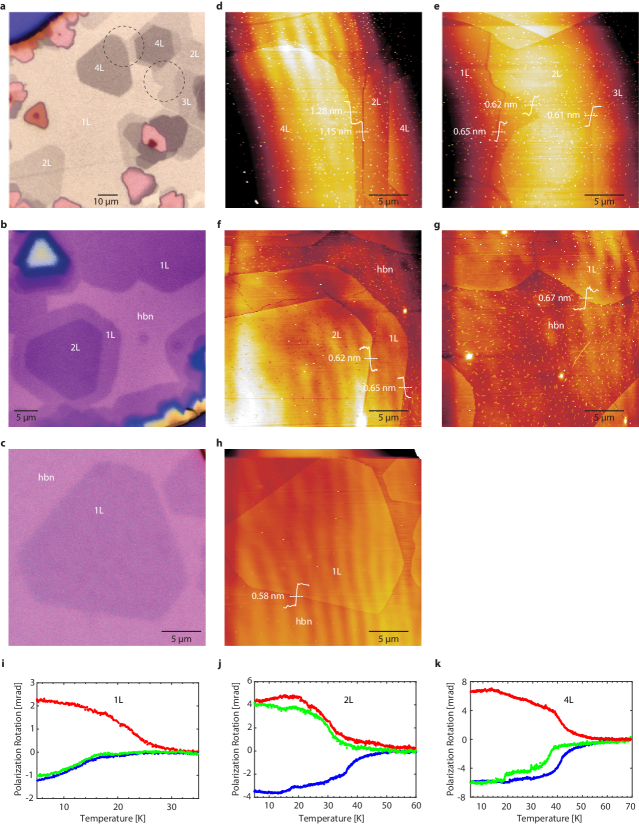
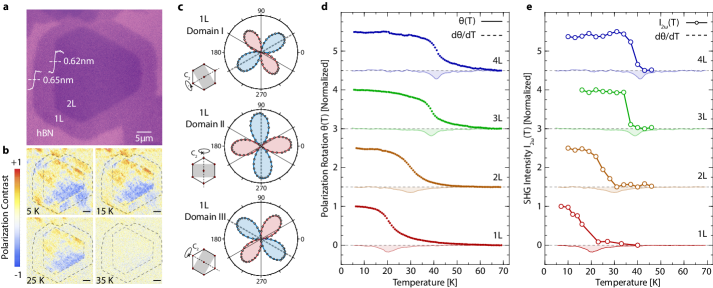
The baseline optical characterization of bulk samples serves as a blueprint for the exploration of the multiferroic state in few-layer NiI2 samples. Figure 2a shows an optical image of 1- and 2-layer NiI2 crystals grown by physical vapor deposition on hBN. The optical anisotropy of NiI2 is directly captured using cross-polarized microscopy (see Methods), signaling the presence of birefringent domains on both the 1- and 2-layer regions at K (Fig. 2b). As temperature is increased, the birefringent domains vanish from the 1-layer region between K, and from the 2-layer region between K (Fig. 2b). Crucially, a reduction of rotational symmetry from three-fold to two-fold is also observed in single-layer samples, as confirmed by angular dependent linear dichroism measurements (Fig. 2c). Angle dependent linear dichroism traces collected in different domains, determined from the cross-polarized images, show the presence of unique two-fold () axes (highlighted by dashed lines in Fig. 2c). The detailed layer dependence of the rotational symmetry breaking transition is obtained through birefringence-induced polarization rotation measurements (, see Methods) in Fig. 2d, which reveals a monotonic evolution of the transition temperatures from 1- to 4-layer samples. The transition temperatures are defined as the values of maximum slope of the polarization rotation signal (where is minimum), yielding K for single-layer, K for 2-layer, K for 3-layer and K for 4-layer flakes (see Extended Data Fig. 10 for 3- and 4-layer optical images and additional data for 1-, 2-, and 4-layer).
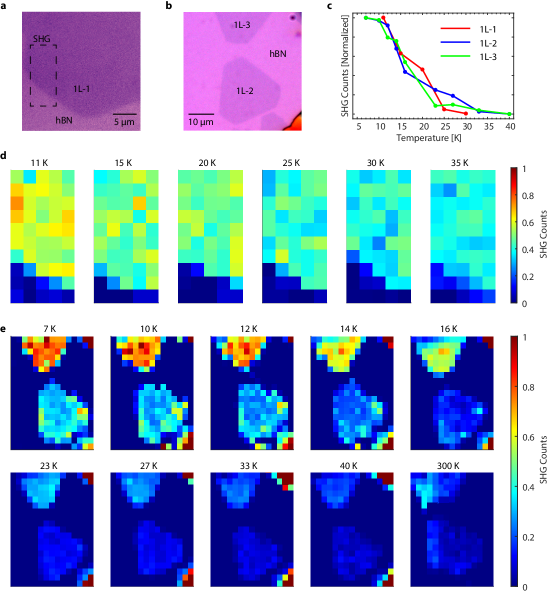
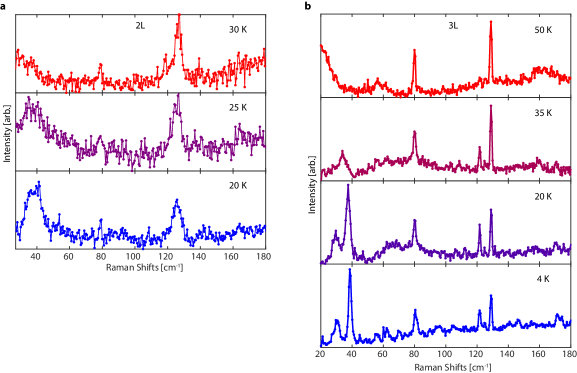
Temperature-dependent ED-SHG ( nm) measurements from 4-, to 1-layer NiI2 samples (Fig. 2e) provide complementary information on the breaking of inversion symmetry down to the single layer limit. For all samples, the SHG intensity displays a clear drop near the transition temperatures derived from the birefringence data. The SHG signal from single-layer samples is genuine as demonstrated by temperature-dependent SHG imaging of multiple monolayer regions (see Extended Data Fig. 8). For these SHG spatial maps, we note a temperature-independent residual SHG contrast from single-layer NiI2 samples which originates at the NiI2/hBN interface due to surface inversion symmetry breaking. The breaking of inversion symmetry demonstrated through SHG and the 3-fold rotational symmetry breaking observed in birefringence measurements (Fig. 2b) unequivocally establish the persistence of a polar ground state in few- and single-layer samples (see Supplemental Information). Concurrently, Raman measurements reveal the persistence of the magnetic soft modes down to the two-layer limit (see Extended Data Fig. 9). The quantitative agreement of the transition temperatures from these independent measurements, as well as the smooth trend of these optical signatures as layer number is reduced from bulk to the monolayer, thus offer strong evidence for the survival of the polar, helimagnetic phase down to the monolayer limit in NiI2.
Theoretical Basis for the multiferroic phase of few-layer NiI2
The observed reduction of the transition temperature as layer number is decreased is strongly indicative of the relevant role played by the interlayer exchange interaction, as also reported for other 2D magnets [12, 33, 32, 34, 35, 36], while the finite transition temperature detected in the monolayer sample points to a non-negligible magnetic anisotropy.
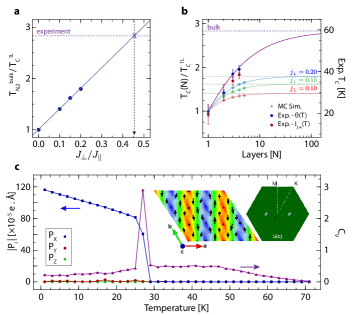
We performed Monte Carlo (MC) simulations to further investigate the role of the interlayer exchange interaction in affecting the helimagnetic transition temperature. Our starting model is the classical 2D anisotropic Heisenberg model recently introduced for NiI2 monolayer[22], supplemented by a nearest-neighbour antiferromagnetic interlayer exchange in order to describe the bulk phase. The presence of anisotropic interactions guarantees a finite-temperature transition to a long-range ordered magnetic phase even in the monolayer (Fig. 3c). On the other hand, the transition temperature of the bulk system is found to increase proportionally to (Fig. 3a). Experimentally, the helimagnetic transition temperature of the 1-layer sample is strongly reduced from its bulk value, being . A linear extrapolation of the MC estimates for transition temperatures as a function of allows to estimate a quite large interlayer exchange, , where is the dominant ferromagnetic intralayer interaction. Using meV[22], the estimated interlayer exchange is meV; this is in quite good agreement with the value we directly calculated by means of Density Functional Theory (DFT) calculations for 2-layer NiI2, that is meV. The evolution of transition temperatures as a function of the sample thickness has also been estimated with MC simulations for different number of layers ( ranging from 1 to 5) and at fixed . Remarkably, all MC estimates as well as the experimental data are well described by a simple empirical formula that depends only on the ratio of bulk and 1-layer transition temperatures, with no fitting parameters, as shown in Fig. 3b.
The possible onset of a magnetically induced electric polarization in 1-layer NiI2 has been further investigated in the framework of the generalized spin-current (or Katsura-Nagaosa-Balatsky, gKNB) model [37], where an electric dipole may be induced by spin pairs according to the general expression Pij = M Si Sj. The 33 M tensor has been evaluated from first-principles, and then used to estimate the polarization of NiI2 monolayer from MC simulations. As shown in Fig. 3d, a proper-screw spiral propagating along the lattice vector stabilizes below K, in reasonable agreement with the experimental value of 21 K. The corresponding magnetic point group is the polar group, with the twofold rotational axis and the electric polarization coinciding with the spiral propagation vector and hence with the a axis, in agreement with the optical measurements. Within the gKNB model, the handedness of the spin spiral uniquely determines if the electric polarization is parallel or antiparallel to the polar axis. We further notice that when the magnetic helix is slanted from the basal plane with a propagation vector Q = (0.138,0,1.457), as it occurs in bulk samples, the purely spin-induced polarization as evaluated from our estimated M-tensor is always parallel to the crystallographic a axis.
Discussion
NiI2, down to the 2D limit, is therefore an example of improper electronic ferroelectricity, where the electric polarization is driven by the emergence of an inversion-symmetry breaking magnetic order (such as the proper-screw spin helix) in an otherwise centrosymmetric lattice. The propensity for such spin-spiral ordering in the single-layer limit can be associated to the significant frustration of the intralayer exchange interactions on the underlying triangular lattice, along with crucial magnetic anisotropy effects [22]. Furthermore, NiI2 shows superexchange mediated by the extended states of the iodine ligands, the latter also introducing a significant spin-orbit coupling (SOC). As a result, non-negligible spin interactions beyond nearest neighbor Ni sites play a relevant role in the stabilization of the resulting proper-screw spin-helix, the latter giving rise to SOC-induced electric polarization, as described by the generalized KNB model[37]. In this framework, the observation of SHG and birefringence in monolayer NiI2 is consistent with the proposed theoretical picture, providing a direct indication of a non-centrosymmetric polar magnetic texture that develops below the identified Curie temperature of K. The observed suppression of the multiferroic transition temperature with reducing layer number further allowed us to clarify the role of the interlayer exchange interactions, which are known to contribute to the orientation of the spin-rotation plane and magnetic ordering vector in the bulk [27, 26].
Our results point to the crucial role of SOC and orbital extension of the ligands in modulating both the long-range magnetic interactions and the exchange anisotropy, ultimately determining the magnetic ground state among closely lying, competing phases [22]. This suggests that changing the ligand could be a powerful tuning knob to realize new exotic magnetic ground states in 2D, including helices, cycloids and skyrmions with unique topological and multiferroic properties [22, 21, 38]. In addition, our observations of a complex magnetic ground state in an atomically-thin vdW crystal introduces new avenues for exploring multiferroicity which are inherently unique to 2D systems. These include the robust and direct electrical control of magnetism through electrostatic doping or external fields and currents, or the realization of new interfacial multiferroic properties in artificial vdW heterostructures. Moreover, 2D materials with gate-tunable magnetoelectric coupling might offer a new platform for continuous tuning of multiferroic systems toward quantum critical behavior [39]. While our optical measurements establish the persistence of multiferroicity in NiI2 to the monolayer limit, further characterization through piezo-response force microscopy or high-sensitivity pyroelectric current measurements will be of great importance to confirm the electrical manifestations of multiferroicity and assess its potential for these future device applications.
Conclusion
In conclusion, our results represent the first observation of an intrinsic multiferroic phase in the single-layer limit. Multiple complementary optical signatures confirm the persistence of ferroelectricity and inversion-symmetry breaking magnetic order down to monolayer NiI2 with a transition temperature of K. These results usher the physics of type-II multiferroics into the playground of vdW materials. These findings open a new frontier for studying and optimizing the interplay of magnetic and dielectric properties in next-generation nanoscale devices.
References
- [1] Matsukura, F., Tokura, Y. & Ohno, H. Control of magnetism by electric fields. \JournalTitleNature Nanotechnology 10, 209–220, DOI: 10.1038/nnano.2015.22 (2015).
- [2] Kurumaji, T. et al. Magnetoelectric responses induced by domain rearrangement and spin structural change in triangular-lattice helimagnets NiI2 and CoI2. \JournalTitlePhysical Review B - Condensed Matter and Materials Physics 87, 1–9, DOI: 10.1103/PhysRevB.87.014429 (2013).
- [3] Tokura, Y., Seki, S. & Nagaosa, N. Multiferroics of spin origin. \JournalTitleReports on Progress in Physics 77, DOI: 10.1088/0034-4885/77/7/076501 (2014).
- [4] Pimenov, A. et al. Possible evidence for electromagnons in multiferroic manganites. \JournalTitleNature Physics 2, 97–100, DOI: 10.1038/nphys212 (2006).
- [5] Rovillain, P. et al. Magnetoelectric excitations in multiferroic TbMnO3 by Raman scattering. \JournalTitlePhysical Review B - Condensed Matter and Materials Physics 81, 1–5, DOI: 10.1103/PhysRevB.81.054428 (2010).
- [6] Kibayashi, S., Takahashi, Y., Seki, S. & Tokura, Y. Magnetochiral dichroism resonant with electromagnons in a helimagnet. \JournalTitleNature Communications 5, 1–7, DOI: 10.1038/ncomms5583 (2014).
- [7] Khomskii, D. Classifying multiferroics: mechanisms and effects. \JournalTitlePhysics 2, DOI: 10.1103/physics.2.20 (2009).
- [8] Spaldin, N. A. & Ramesh, R. Advances in magnetoelectric multiferroics. \JournalTitleNature Materials 18, 203–212, DOI: 10.1038/s41563-018-0275-2 (2019).
- [9] Huang, B. et al. Electrical control of 2d magnetism in bilayer CrI3. \JournalTitleNature Nanotechnology 13, 544–548, DOI: 10.1038/s41565-018-0121-3 (2018).
- [10] Jiang, S., Li, L., Wang, Z., Mak, K. F. & Shan, J. Controlling magnetism in 2d CrI3 by electrostatic doping. \JournalTitleNature Nanotechnology 13, 549–553, DOI: 10.1038/s41565-018-0135-x (2018).
- [11] Gong, C. et al. Discovery of intrinsic ferromagnetism in two-dimensional van der Waals crystals. \JournalTitleNature 546, 265–269, DOI: 10.1038/nature22060 (2017).
- [12] Huang, B. et al. Layer-dependent ferromagnetism in a van der Waals crystal down to the monolayer limit. \JournalTitleNature 546, 270–273, DOI: 10.1038/nature22391 (2017).
- [13] Burch, K. S., Mandrus, D. & Park, J. G. Magnetism in two-dimensional van der Waals materials. \JournalTitleNature 563, 47–52, DOI: 10.1038/s41586-018-0631-z (2018).
- [14] Mak, K. F., Shan, J. & Ralph, D. C. Probing and controlling magnetic states in 2d layered magnetic materials. \JournalTitleNature Reviews Physics 1, 646–661, DOI: 10.1038/s42254-019-0110-y (2019).
- [15] Astrov, D. N. The magnetoelectric effect in antiferromagnetics. \JournalTitleSov. Phys. – JETP 11, 708, DOI: 10.1063/1.1728630 (1960).
- [16] Rado, G. T. & Folen, V. J. Observation of the magnetically induced magnetoelectric effect and evidence for antiferromagnetic domains. \JournalTitlePhysical Review Letters 7, 310–311, DOI: 10.1103/PhysRevLett.7.310 (1961).
- [17] Newnham, R. E., Kramer, J. J., Schulze, W. A. & Cross, L. E. Magnetoferroelectricity in Cr2BeO4. \JournalTitleJournal of Applied Physics 49, 6088–6091, DOI: 10.1063/1.324527 (1978).
- [18] Kimura, T. et al. Magnetic control of ferroelectric polarization. \JournalTitleNature 426, 55–58, DOI: 10.1038/nature02018 (2003).
- [19] McGuire, M. A. Crystal and magnetic structures in layered, transition metal dihalides and trihalides. \JournalTitleCrystals 7, DOI: 10.3390/cryst7050121 (2017).
- [20] Lai, Y. et al. Two-dimensional ferromagnetism and driven ferroelectricity in van der Waals CuCrP2S6. \JournalTitleNanoscale 11, 5163–5170, DOI: 10.1039/C9NR00738E (2019).
- [21] Botana, A. S. & Norman, M. R. Electronic structure and magnetism of transition metal dihalides: bulk to monolayer. \JournalTitlePhysical Review Materials 3, 44001, DOI: 10.1103/PhysRevMaterials.3.044001 (2019).
- [22] Amoroso, D., Barone, P. & Picozzi, S. Spontaneous skyrmionic lattice from anisotropic symmetric exchange in a Ni-halide monolayer. \JournalTitleNature Communications 11, 1–9, DOI: 10.1038/s41467-020-19535-w (2020).
- [23] Pollini, I., Thomas, J. & Lenselink, A. Optical properties of layered transition-metal iodides. \JournalTitlePhysical Review B 30, 2140–2148, DOI: 10.1103/PhysRevB.30.2140 (1984).
- [24] Ju, H. et al. Possible persistence of multiferroic order down to bilayer limit of van der Waals material NiI2. \JournalTitleNano Letters DOI: 10.1021/acs.nanolett.1c01095 (2021).
- [25] Kurumaji, T. Spiral spin structures and skyrmions in multiferroics. \JournalTitlePhysical Sciences Reviews 5, DOI: 10.1515/psr-2019-0016 (2020).
- [26] Friedt, J. M., Sanchez, J. P. & Shenoy, G. K. Electronic and magnetic properties of metal diiodides MI2 (M=V, Cr, Mn, Fe, Co, Ni, and Cd) from 129I Mössbauer spectroscopy. \JournalTitleJournal of Chemical Physics 65, 5093–5102, DOI: 10.1063/1.433072 (1976).
- [27] Kuindersma, S., Sanchez, J. & Haas, C. Magnetic and structural investigations on NiI2 and CoI2. \JournalTitlePhysica B+C 111, 231–248, DOI: 10.1016/0378-4363(81)90100-5 (1981).
- [28] Liu, H. et al. Vapor deposition of magnetic van der Waals NiI2 crystals. \JournalTitleACS Nano 14, 10544–10551, DOI: 10.1021/acsnano.0c04499 (2020).
- [29] Kumdersma, S. R., Boudewijn, P. R. & Haas, C. Near infrared d-d transitions of NiI2, CdI2:Ni2+, and CoI2. \JournalTitlePhys. Stat.Sol. (b) 108, 187–194, DOI: 10.1002/pssb.2221080122 (1981).
- [30] Xiao, J. et al. Intrinsic two-dimensional ferroelectricity with dipole locking. \JournalTitlePhysical Review Letters 120, 227601, DOI: 10.1103/PhysRevLett.120.227601 (2018).
- [31] Cenker, J. et al. Direct observation of two-dimensional magnons in atomically thin CrI3. \JournalTitleNature Physics 17, 20–25, DOI: 10.1038/s41567-020-0999-1 (2021).
- [32] Jin, W. et al. Raman fingerprint of two terahertz spin wave branches in a two-dimensional honeycomb Ising ferromagnet. \JournalTitleNature Communications 9, 1–7, DOI: 10.1038/s41467-018-07547-6 (2018).
- [33] Deng, Y. et al. Gate-tunable room-temperature ferromagnetism in two-dimensional Fe3GeTe2. \JournalTitleNature 563, 94–99, DOI: 10.1038/s41586-018-0626-9 (2018).
- [34] Sivadas, N., Okamoto, S., Xu, X., Fennie, C. J. & Xiao, D. Stacking-dependent magnetism in bilayer CrI3. \JournalTitleNano Letters 18, 7658–7664, DOI: 10.1021/acs.nanolett.8b03321 (2018).
- [35] Akram, M. et al. Moiré skyrmions and chiral magnetic phases in twisted CrX3 (X = I, Br, and Cl) bilayers. \JournalTitleNano Letters 21, 6633–6639, DOI: 10.1021/acs.nanolett.1c02096 (2021).
- [36] Nguyen, T. P. T., Yamauchi, K., Oguchi, T., Amoroso, D. & Picozzi, S. Electric-field tuning of the magnetic properties of bilayer VI3: A first-principles study. \JournalTitlePhys. Rev. B 104, 014414, DOI: 10.1103/PhysRevB.104.014414 (2021).
- [37] Xiang, H. J., Kan, E. J., Zhang, Y., Whangbo, M.-H. & Gong, X. G. General theory for the ferroelectric polarization induced by spin-spiral order. \JournalTitlePhys. Rev. Lett. 107, 157202, DOI: 10.1103/PhysRevLett.107.157202 (2011).
- [38] Prayitno, T. B. Controlling phase transition in monolayer metal diiodides XI2 (X: Fe, Co, and Ni) by carrier doping. \JournalTitleJournal of Physics: Condensed Matter 33, 335803, DOI: 10.1088/1361-648X/ac0937 (2021).
- [39] Narayan, A., Cano, A., Balatsky, A. V. & Spaldin, N. A. Multiferroic quantum criticality. \JournalTitleNature Materials 18, 223–228, DOI: 10.1038/s41563-018-0255-6 (2019).
- [40] Zomer, P., Guimarães, M., Brant, J., Tombros, N. & Van Wees, B. Fast pick up technique for high quality heterostructures of bilayer graphene and hexagonal boron nitride. \JournalTitleApplied Physics Letters 105, 013101, DOI: 10.1063/1.4886096 (2014).
- [41] Kresse, G. & Furthmüller, J. Efficient iterative schemes for ab initio total-energy calculations using a plane-wave basis set. \JournalTitlePhys. Rev. B 54, 11169–11186, DOI: 10.1103/PhysRevB.54.11169 (1996).
- [42] Kresse, G. & Joubert, D. From ultrasoft pseudopotentials to the projector augmented-wave method. \JournalTitlePhys. Rev. B 59, 1758–1775, DOI: 10.1103/PhysRevB.59.1758 (1999).
- [43] Blaha, P. et al. WIEN2k: An APW+lo program for calculating the properties of solids. \JournalTitleJournal of Chemical Physics 152, 074101, DOI: 10.1063/1.5143061 (2020).
- [44] Perdew, J. P., Burke, K. & Ernzerhof, M. Generalized gradient approximation made simple. \JournalTitlePhys. Rev. Lett. 77, 3865–3868, DOI: 10.1103/PhysRevLett.77.3865 (1996).
- [45] Rohrbach, A., Hafner, J. & Kresse, G. Electronic correlation effects in transition-metal sulfides. \JournalTitleJournal of Physics: Condensed Matter 15, 979–996, DOI: 10.1088/0953-8984/15/6/325 (2003).
- [46] Liechtenstein, A. I., Anisimov, V. I. & Zaanen, J. Density-functional theory and strong interactions: Orbital ordering in mott-hubbard insulators. \JournalTitlePhys. Rev. B 52, R5467–R5470, DOI: 10.1103/PhysRevB.52.R5467 (1995).
- [47] Perdew, J. P. et al. Restoring the density-gradient expansion for exchange in solids and surfaces. \JournalTitlePhys. Rev. Lett. 100, 136406, DOI: 10.1103/PhysRevLett.100.136406 (2008).
- [48] Becke, A. D. On the large-gradient behavior of the density functional exchange energy. \JournalTitleJournal of Chemical Physics 85, 7184–7187, DOI: 10.1063/1.451353 (1986).
Methods
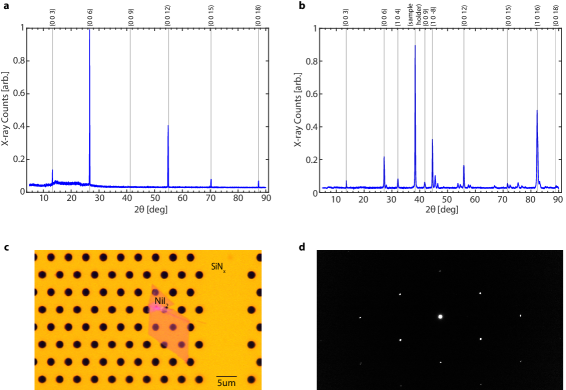
Growth and Characterization of Few-Layer NiI2 Crystals Bulk-like NiI2 crystals were grown on 300 nm SiO2/Si and few-layer crystals were grown on hexagonal boron nitride (hBN) substrates via physical vapor deposition (PVD) in a horizontal single-zone furnace equipped with a 0.5 in. diameter quartz tube at ambient pressure. hBN was mechanically exfoliated and transferred onto 300 nm SiO2/Si substrates, then annealed in vacuum at 700 °C for 1 h prior to the growth. In a typical synthesis, 0.1 g of NiI2 powder (99.5%, anhydrous, Alfa Aesar) was positioned at the center of the furnace as the source material and the SiO2/Si substrate was placed downstream at the maximum temperature gradient point. The furnace was purged by pumping the quartz tube below 0.1 Torr and then refilled with 99.99% Ar gas three times. When growing bulk-like NiI2 crystals, the furnace was heated to 450 in 15 minutes and held at that temperature for 10 minutes. For few-layer NiI2 samples, the furnace was heated to 380-420 in 15 minutes and then the SiO2/Si substrate was taken out immediately and stored inside a nitrogen-filled glove box (O2 < 0.5 ppm, H2O < 0.5 ppm). The sample thickness was determined by atomic force microscopy (AFMWorkshop HR), which was performed inside a separate nitrogen-filled glovebox (O2 < 100 ppm, H2O < 1 ppm), using a silicon probe in tapping mode. The electron diffraction (JEOL HRTEM) was performed on a 7 nm thick PVD grown NiI2 flake using a transmission electron microscope. The flake was picked up and dropped down using the dry transfer technique onto a SiNx membrane with 2 m pores (NORCADA)[40].
Growth and Characterization of Single Crystal NiI2 Single crystal NiI2 was grown by chemical vapor transport (CVT), from elemental precursors with molar ratio Ni:I=1:2, at a temperature gradient 700∘C to 500∘C. The magnetic susceptibility was measured during field cooling at 0.9 T applied out of plane, using a Magnetic Property Measurement System (MPMS-3, Quantum Design Inc.). X-ray diffraction of CVT grown crystals was performed in Bragg geometry using Cu Kα radiation (PANalytical), and the refined unit cell at room temperature is Å, Å.
Device fabrication for bulk photovoltaic effect measurements. The photocurrent device was fabricated by depositing two Ti(5nm)/Au(50 nm) electrodes on a sapphire substrate using a 20 m wide wire mask. A PVD-grown bulk-like NiI2 flake was then picked up and dropped down across the gap using a polymer-based dry transfer technique. To minimize the exposure to moisture, the polymer was dissolved in anhydrous chloroform inside the glovebox. To ensure a good and uniform electric contact, a carbon copy of the metal pads was created using the same dry transfer technique and stacked on top of the sample to provide a vertically symmetric contact. We used a 0.3 mW linearly-polarized 532 nm laser for the photocurrent measurement. The current was measured using a Keithley 2401 current meter, and the magnetic field was applied perpendicular to the electric field in plane using a 1 T electromagnet from Montana Instruments.
Raman Spectroscopy Measurements Polarized Raman experiments were performed in a back-scattering geometry using a confocal microscope spectrometer (Horiba LabRAM HR Evolution) with a 50x objective lens and 532 nm laser excitation at a power of W (W) for bulk (few-layer) samples, respectively. Scattered light was dispersed by a 1800 lines/mm grating and detected with a liquid nitrogen cooled charge-coupled device (CCD) camera. The spectrometer integration time was 30/60 minutes for bulk/few-layer samples, and each scan was taken twice and then averaged before analysis. Polarized Raman spectra were recorded with a linearly polarized incident beam. For angle-resolved polarized Raman spectroscopy (ARPRS) measurements, an achromatic half-wave plate was placed just before the objective and rotated in steps of 7.5° from 0° to 180°. An analyzer was placed in front of the spectrometer entrance and kept vertical/horizontal for parallel (XX)/perpendicular (XY) configurations, respectively. For circularly polarized measurements, an achromatic quarter-wave plate was placed in front of the objective with fast axis oriented at +/- 45 degrees with respect to the incident linear polarization for / circular incident polarization, respectively. For the reported circularly polarized spectra, no analyzing polarizer is used. Temperature-dependent measurements in the range K were performed using a Montana Instruments closed-cycle optical cryostat.
Birefringence Measurements A supercontinuum light source (NKT Photonics, Fianium) monochromatized to nm/ nm and a bandwidth of approximately nm was used as excitation for angular-dependent linear dichroism and birefringence-induced polarization rotation measurements, respectively. All measurements were performed at normal incidence in a Montana Instruments closed-cycle optical cryostat. Linear dichroism measurements were performed with a photo-elastic modulator (PEM-100, Hinds Instruments) on the incident path of the optical setup. The beam incident on the PEM is prepared in linear polarization making an angle of with the respect to the PEM fast axis and amplitude modulated with a mechanical chopper. The PEM retardance was set to 0.5 to modulate the incident polarization between linear polarization states. The light is then focused onto the sample using a 50x objective lens. The backscattered light is measured by an amplified photodiode (ThorLabs PDA100A2), whose output is connected to a lock-in amplifier (Stanford Instruments SR865A) referenced to the second harmonic of the fundamental PEM frequency kHz. The total reflectance of the sample, used as a normalization, is monitored by a second lock-in amplifier referenced to the chopping frequency Hz.
To perform angular-dependent linear dichroism measurements, the angle of the perpendicular linear polarization states created by the PEM is varied across the crystal using a zero-order half-wave plate placed just before the objective. In order to ensure the angular-dependence is recorded from a uniform, mono-domain region of the sample, polarized microscopy images were first recorded at the base temperature K. The sample was held at this temperature for the duration of the angular-dependent measurements in order to maintain the same distribution of birefringent domains. Birefringence-induced polarization rotation measurements on the few- and single-layer samples were performed with the PEM on the detection path of the optical setup with a retardance amplitude of 0.486, using a lock-in amplifier at the second harmonic of the fundamental PEM frequency for signal collection. The unrotated incident beam is kept parallel to the PEM fast-axis and analyzed by a polarizer at 45 deg. before being measured by the photodiode. This setup provided a sensitivity down to 10 rad.
Polarized microscopy was performed with a broadband visible LED light source, a standard CMOS-based monochrome camera and Glan-Thompson polarizers on both the input and output light paths in reflection geometry. A detuning of 0.5 (2.0) degrees from a cross-polarized configuration was used to maximize the contrast from birefringent domains and a 5 (2) second integration time was used for the images of few-layer (bulk) samples (Extended Data Fig. 7). Cross-polarized contrast images were obtained as a function of temperature by auto-correlating the images for different temperatures to overlap with a high-temperature () reference, and subtracting the low and high temperature images.
Layer-Dependent Second Harmonic Generation Microscopy. In second harmonic generation (SHG) microscopy, an objective lens (Olympus LMPlanFL-N 50x) focuses an ultrashort laser beam onto the sample located in a cryostat (Janis ST-500). For wavelength dependent SHG experiments, we used a optical parametric amplifier (ORPHEUS, Light Conversion) seeded with a regenerative amplifier (PHAROS SP-10-600-PP, Light Conversion) These allowed us to tune the output wavelength in a wide spectral range. The estimated spot size on the sample is . The laser fluence incident on the sample was set to 1 mJ/cm2. No sample damage or degradation was observed during the measurements. Upon reflection, the second harmonic component of the beam radiated from sample was selected out by a dichroic mirror and a monochromator with 2 nm spectral resolution. The second harmonic photons were detected and counted using a photomultiplier tube (Hamamatsu PMT) and a dual-channel gated photon-counter (Stanford Research SR400). To decrease the background and dark counts, the photon counter was synchronized and gated with laser pulses. To perform SHG imaging (Extended Data Fig. 8), we keep the sample location fixed and rotate a motorized mirror to scan the laser across the sample. The polarization angle of the pulses were controlled using a wire-grid polarizer and a half-waveplate respectively to obtain the polarization resolved second harmonic traces (Extended Data Fig. 7).
Spin model and Monte Carlo simulations. To describe the magnetic properties of the system we adopted the 2D anisotropic Heisenberg model derived for NiI2 monolayer[22] supplemented by a nearest-neighbour antiferromagnetic interlayer interaction accounting for the exchange between rhombohedral-stacked layers:
| (1) |
Here and label respectively even and odd layers perpendicular to the c axis, the first sum extends to third nearest neighbour within each plane while the last sum is restricted to nearest-neighbours belonging to different layers. We used the interlayer exchange Jij and single-site anisotropy Aij tensors evaluated from first principles for NiI2 monolayer[22]; the non-negligible anisotropic terms guarantee a finite-temperature long-range magnetic order, with a triple-Q topological phase competing with single-Q spiral configuration. The anisotropic part of the exchange tensor has been accordingly rescaled to 60% of the ab initio estimate, thus favouring the spin-spiral solution, in agreement with the breaking of the three-fold rotational symmetry experimentally detected. We set the energy scale as , the ferromagnetic nearest-neighbour interlayer interaction.
We performed Monte Carlo simulations using a standard Metropolis algorithm on rhombohedral-stacked triangular lattices (rhombohedral supercells in hexagonal setting) in slab geometry to simulate multilayer (bulk) NiI2. We used 105 MC steps for thermalization and 5105 MC steps for statistical averaging at each simulated temperature. Simulations have been performed on 2424 lattices in slab geometry comprising up to 5 layers of triangular NiI2 (and up to 2880 spins) with two-dimensional periodic boundary conditions (PBC), and on 888 hexagonal supercells (comprising 1536 spins) with three-dimensional PBC for bulk rhombohedral system. The transition temperature is identified by the peak in the specific heat of the spin model. All MC results for multilayer slabs at different values of interlayer exchange are well described by a simple empirical function:
| (2) |
where is the reduced temperature, is the number of layers and the coefficient has been obtained by fitting only the data points.
Generalised spin-current model for magnetically induced polarization. Within the generalised spin-current model gKNB [37], the total polarization is given by:
| (3) |
where is the number of magnetic sites, and we restricted the sum to interlayer nearest-neighbours. The M-tensor has been evaluated from first principles for a spin pair parallel to the a axis using the four-state method[37] (the tensor of equivalent bonds is readily obtained by enforcing crystalline symmetries). The dominant tensor components found are eÅ and eÅ, the other components being zero or smaller than eÅ. Assuming a proper-screw spiral with positive/negative handedness propagating along the a () axis with pitch , the gKNB model predicts , in agreement with numerical MC calculations. For the proper-screw spiral propagating along the Q = (0.138,0,1.457) direction, with the spins rotating in a plane making an angle as observed in bulk NiI2[27], the electric polarization predicted by the gKNB model lies in the plane and is perpendicular to the in-plane projection of Q, . In both cases, handedness determines the sign of P, that is always parallel to the crystallographic axis a.
First-principles calculations. We used Density Functional Theory (DFT) to estimate the interlayer exchange interaction and the M-tensor of the gKNB model. The interlayer coupling has been estimated from the energy difference between a ferromagnetic (FM) and antiferromagnetic (AFM) stacking of ferromagnetically ordered NiI2 layers, (E = EFM- EAFM). A rhombohedral-stacked bilayer has been constructed starting from the optimised NiI2 monolayer, with lattice parameter 3.96 Å and an interlayer distance of about 6.54 Å, in agreement with the previously reported bulk value [19]. A vacuum distance of about 18.45 Å was introduced between periodic copies of the free-standing bilayer along the c axis. To check the consistency of our results, we performed DFT calculations using both the projector-augmented wave (PAW) method as implemented in the VASP code [41, 42] and the all-electron, full potential code WIEN2k [43], based on the augmented plane wave plus local orbital (APW+lo) basis set. Ni , and , and I and have been treated as valence states in VASP calculations, with a plane-wave cutoff of 500 eV and a -points mesh for Brillouin-zone (BZ) integration. In the WIEN2k calculations, a muffin-tin radius of 2.5 Å was used for both Ni and I atoms, as well as an RKmax of 7.0. A k-mesh of was used for the BZ sampling. For consistency with previous monolayer calculations [22], we used the Perdew-Burke-Erzenhof (PBE) version of the generalized gradient approximation as the exchange-correlation functional [44] and further performed PBE+U calculations [45] employing eV and eV on the localized Ni- orbitals within the Liechtenstein approach [46]. The interlayer exchange defined as is meV within VASP and meV within WIEN2k. Similar results were also obtained by introducing the spin-orbit coupling (SOC) and by employing PBEsol [47] and optB86 [48] exchange-correlation functionals, that proves robustness of our results. A similar procedure applied to NiBr2 bilayer yields a much smaller interlayer AFM coupling of about meV, suggesting a non-trivial role of extended I-5 orbital states in mediating spin exchange across layers of NiI2.
The M-tensor has been evaluated following the no-substitution four-state method[37] performing DFT+U+SOC calculations with VASP on a supercell of NiI2 monolayer. We selected a pair of spins (S1 and S2) along the -axis (parallel to the lattice vector) and calculated the Berry-phase polarization arising from different sets of four noncollinear spin configurations, defining the M-tensor, in units of eÅ, as
| (4) |
The accuracy of polarization values has been checked by repeating calculations with a larger vacuum of about 32 Å and including dipole corrections.
Acknowledgements
This work was supported by the STC Center for Integrated Quantum Materials, NSF Grant No. DMR-1231319. E.E, B.I. and N.G acknowledge support from the US Department of Energy, BES DMSE (data taking and analysis) and Gordon and Betty Moore Foundation’s EPiQS Initiative grant GBMF9459 (instrumentation). J.K and A.S.B acknowledge NSF Grant No. DMR-1904716 and the ASU research computing center for HPC resources. D.A. and S.P. acknowledge support by the Nanoscience Foundries and Fine Analysis (NFFA-MIUR Italy) project. P.B. and S.P. acknowledge financial support from the Italian Ministry for Research and Education through PRIN-2017 projects “Tuning and understanding Quantum phases in 2D materials—Quantum 2D” (IT-MIUR Grant No. 2017Z8TS5B) and “TWEET: Towards Ferroelectricity in two dimensions” (IT-MIUR Grant No. 2017YCTB59), respectively. D.A., P.B. and S.P. also acknowledge high-performance computing (HPC) systems operated by CINECA (IsC72-2DFmF, IsC80-Em2DvdWd, IsC88-FeCoSMO, and IsB21-IRVISH projects) and computing resources at the Pharmacy Dept., Univ. Chieti-Pescara, and thank Loriano Storchi for his technical support.
Author contributions
Q.S. and R.C. conceived the project. Q.S. synthesized the NiI2 samples. Q.S. and C.A.O. performed Raman and birefringence measurements supervised by R.C.. E.E. and B.I. performed SHG measurements supervised by N.G. T.T. and K.W. provided and characterized bulk hBN crystals. D.A., A.S.B. and J.K. performed first-principles calculations. P.B. and D.A. performed Monte Carlo simulations, and discussed the results with S.P. All authors contributed to the writing of the manuscript. The authors declare no competing financial interests.
Additional Information
Supplementary Information is available for this paper. Correspondence and requests for materials should be addressed to R.C.(rcomin@mit.edu). Reprints and permissions information is available at www.nature.com/reprints
Data Availability
The datasets generated during and/or analysed during the current study are available from the corresponding author on reasonable request.