Extreme Relativistic Reflection in the Active Galaxy ESO 033–G002
Abstract
We present the first high signal-to-noise broadband X-ray spectrum of the radio-quiet type-2 Seyfert ESO 033–G002, combining data from XMM-Newton and NuSTAR. The nuclear X-ray spectrum is complex, showing evidence for both neutral and ionised absorption, as well as reflection from both the accretion disc and more distant material, but our broadband coverage allows us to disentangle all of these different components. The total neutral column during this epoch is , consistent with the optical classification of ESO 033–G002 as a type-2 Seyfert but not so large as to prevent us from robustly determining the properties of the innermost accretion flow. The ionised absorption – dominated by lines from Fe XXV and Fe XXVI – reveals a moderately rapid outflow ( ) which has a column comparable to the neutral absorption. We find the disc reflection from the innermost regions to be extreme, with a reflection fraction of 5. This requires strong gravitational lightbending and, in turn, both an extremely compact corona (within 2 of the black hole) and a rapidly rotating black hole (). Despite this tight size constraint, with a temperature of keV the X-ray corona in ESO 033–G002 appears similar to other AGN in terms of its placement in the compactness-temperature plane, consistent with sitting close to the limit determined by runaway pair production. Finally, combining X-ray spectroscopy, timing and updated optical spectroscopy, we also estimate the mass of the black hole to be .
keywords:
Galaxies: Active – Black Hole Physics – X-rays: individual (ESO 033–G002)1 Introduction
The primary source of X-ray emission in active galactic nuclei (AGN) is the corona, a hot plasma of electrons that is widely expected to Compton up-scatter thermal emission from the accretion disc – which typically peaks in the EUV band for AGN (e.g. Shakura & Sunyaev 1973; Elvis et al. 1994) – up to higher energies. This produces a powerlaw-like X-ray continuum with a high-energy cutoff set by the temperature of the coronal electrons (e.g. Haardt & Maraschi 1991). Although the fine details of the corona are still being explored, observations show that its emission can be highly and rapidly variable (e.g. Fabian et al. 2013), indicating it must be a fairly compact structure. Independent constraints on the size of the X-ray source from microlensing (e.g. Chartas et al. 2009; Dai et al. 2010; MacLeod et al. 2015), X-ray occultation events (e.g. Risaliti et al. 2009a; Gallo et al. 2021) and X-ray reverberation (e.g. Kara et al. 2016; Alston et al. 2020) confirm this, implying a typical size scale of 10 (where = is the gravitational radius, and is the black hole mass).
In addition to this Comptonised continuum, the X-ray spectra of AGN also typically reveal evidence for significant reprocessing of this emission. Most notably, the X-ray emission from the corona will irradiate the surface of the accretion disc, resulting in a series of emission lines (via fluorescence) and a characteristic backscattered continuum at high energies (peaking at 20–30 keV; e.g. George & Fabian 1991). Because of its high cosmic abundance and high fluorescent yield, the strongest line is typically iron K at 6.4–6.97 keV (depending on the ionisation state). Owing to the rapid orbital motions and the strong gravity close to the black hole, special and general relativistic effects will broaden and skew line emission from the inner disc into a characteristic ‘diskline’ profile which has a strongly extended red wing (e.g. Fabian et al. 1989; Laor 1991). This ‘reflected’ emission is of critical importance as it carries information on the innermost accretion geometry, including both the extent of the innermost accretion disc – which is in turn set by the spin of the black hole (Bardeen et al. 1972) – and the geometry of the corona (e.g. Martocchia et al. 2000; Miniutti & Fabian 2004; Wilkins & Fabian 2012). Spin measurements are of particular interest for AGN, as they provide a window into the (recent) growth history of the supermassive black holes that power them, revealing whether this likely occurred via accretion or mergers (e.g. King & Pringle 2006; Sesana et al. 2014; Fiacconi et al. 2018). Black hole spin may also be a key ingredient for powering the relativistic jets these systems can launch (e.g. Blandford & Znajek 1977).
Broadband spectroscopy is key to understanding all of these issues. For AGN, the best quantified method for constraining spin in individual AGN is via the study of the reflection from the inner disc, and the most robust constraints come when both the iron line and the reflected continuum can be studied simultaneously (e.g. Risaliti et al. 2013; Walton et al. 2014, 2020; Marinucci et al. 2014). This is also naturally the case for using this emission to place geometric constraints on the corona. Furthermore, sensitive hard X-ray coverage (i.e. keV) is necessary to provide robust constraints on the coronal temperature (e.g. Brenneman et al. 2014; Malizia et al. 2014; Matt et al. 2015; Baloković et al. 2015; Buisson et al. 2018) and understand its plasma properties.
ESO 033–G002 (aka IRAS 04575–7537) is a nearby ( = 0.0181) radio-quiet Seyfert-2 active galaxy (de Grijp et al. 1992; Vignali et al. 1998) that is X-ray bright, detected in the hard X-ray surveys (Tueller et al. 2008; Bird et al. 2007) undertaken by both the Neil Gehrels Swift Observatory (hereafter Swift; Gehrels et al. 2004) and INTEGRAL (Winkler et al. 2003). Despite this, however, it has received little dedicated observational attention to date. A fairly deep observation with ASCA (Tanaka et al. 1994) and snapshots with Ginga (Makino & ASTRO-C Team 1987) and Chandra (Weisskopf et al. 2002) revealed evidence for moderate X-ray obscuration ( ; Smith & Done 1996; Vignali et al. 1998; Marchesi et al. 2017), broadly consistent with its optical classification. In addition, a short observation performed with NuSTAR (Harrison et al. 2013) as part of its extragalactic survey campaign showed evidence for very strong contribution from reflected emission (reflection strength of ; Baloković 2017; Lanz et al. 2019; Panagiotou & Walter 2019). This is among the largest reflection contributions seen among local, Compton-thin AGN (Walton et al. 2013), and may imply an extreme accretion geometry in which strong lightbending suppresses the direct emission from the primary X-ray source, leaving a spectrum dominated by reflection from the innermost accretion disc (e.g. Miniutti & Fabian 2004; Fabian et al. 2012; Parker et al. 2014; Dauser et al. 2014).
Here we present new broadband X-ray observations of ESO 033–G002 taken with XMM-Newton (Jansen et al. 2001) and NuSTAR, from which we are able to place tight constraints on the geometry of the X-ray source via the reflected emission, providing the first constraints on the spin of this SMBH, as well as updated constraints on the coronal temperature in this source.
2 Observations and Data Reduction
We undertook a long coordinated observation of ESO 033–G002 with both XMM-Newton and NuSTAR in June 2020. The following sections describe our reduction of these data.
| Mission | OBSID | Start | Good |
|---|---|---|---|
| Date | Exposure\tmark[a] | ||
| XMM-Newton | 0863050201 | 2020-06-09 | 109/125 |
| NuSTAR | 60601002002 | 2020-06-09 | 172 |
a Exposures are given in ks, and for XMM-Newton are listed for the EPIC-pn/MOS detectors after periods of high background have been removed.
2.1 NuSTAR
The NuSTAR data for both focal plane modules (FPMA and FPMB) were reduced with the NuSTAR Data Analysis Software (nustardas) v1.9.2, and NuSTAR calibration database v20190627. The unfiltered event files were cleaned with nupipeline, using the standard depth correction to reduce the internal high-energy background. Passages through the South Atlantic Anomaly were excluded from consideration using the following settings: saa = optimized and tentacle = yes. Source products and their associated instrumental response files were then extracted from these cleaned event lists using nuproducts and a circular region of radius 90′′, while the background was estimated from a larger region of blank sky on the same chip as ESO 033–G002. Note that in this case, all of the on-source data is in the standard ‘science’ mode (mode 1), and there is no indication that this observation was affected by the recently identified tear in the thermal blanket (Madsen et al. 2020). We use the NuSTAR data over the 4–78 keV band, and the spectra are rebinned to a minimum signal-to-noise (S/N) of 5 per energy bin.
2.2 XMM-Newton
The XMM-Newton data were reduced using the XMM-Newton Science Analysis System (sas v18.0.0). Following standard procedures, the raw observation files were cleaned using epchain and emchain for the EPIC-pn and EPIC-MOS detectors, respectively (Strüder et al. 2001; Turner et al. 2001). Source products were extracted from the cleaned event files with xmmselect from a circular region of radius 35′′, using only single and double patterned events for EPIC-pn (PATTERN 4) and single to quadruple patterned events for EPIC-MOS (PATTERN 12). Periods of high background were filtered out, and similar to the NuSTAR data, the remaining background contribution was again estimated from a larger region of blank sky on the same chip as ESO 033–G002. Instrumental response files were generated using arfgen and rmfgen for each of the EPIC detectors. After performing the reduction separately for the EPIC-MOS1 and EPIC-MOS2 detectors, we produced a combined EPIC-MOS spectrum using addascaspec. We use the XMM-Newton data over the 0.3–10.0 keV band, and the spectra are again rebinned to a minimum S/N of 5 per energy bin.
3 Broadband Spectroscopy
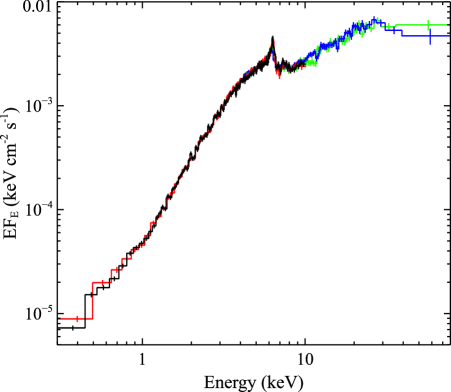
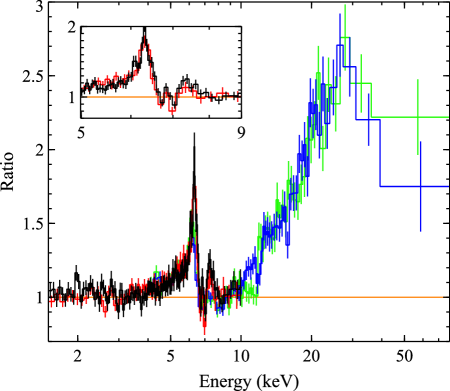
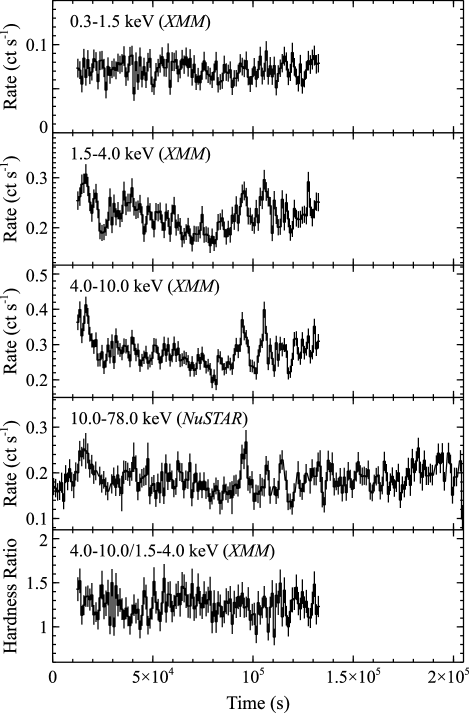
The time-averaged broadband spectrum of ESO 033–G002 is shown in Figure 1 (left panel). In a qualitative sense, these data confirm the moderately obscured nature of the source revealed by the archival Ginga, ASCA and Chandra data (Smith & Done 1996; Vignali et al. 1998; Marchesi et al. 2017), with the direct AGN emission dominating above 1.5 keV. In obscured AGN, the softest X-rays are typically dominated by scattered nuclear flux and diffuse plasma emission (e.g. Bianchi et al. 2005; Miniutti et al. 2007; Winter et al. 2008). In order to confirm that this is also the case in ESO 033–G002 as well, we extracted lightcurves in a variety of different energy bands. Flux variability associated with the central AGN is clearly seen above 1.5 keV, while the softer X-ray data do not show similar variations (see Figure 2), instead remaining roughly constant (as expected for scattered/plasma emission from large scales). Furthermore, although a detailed spatial analysis is beyond the scope of this work, we also note that the archival Chandra imaging does show potential hints of low-level extended X-ray emission around the nucleus.
As has become standard, in order to highlight the other key spectral features we also show the data/model ratio of the combined XMM-Newton+NuSTAR dataset to an absorbed powerlaw continuum in Figure 1 (right panel), fit to the 1.5–4, 7–10 and 50–78 keV bands where the primary AGN continuum would be expected to dominate; model fits are performed with xspec v12.10.1s (Arnaud 1996) using minimisation. We use the tbabs neutral absorption code (Wilms et al. 2000)111As recommended, we use the cross-sections of Verner et al. (1996) for the absorption. However, following our previous work (Walton et al. 2018, 2019, 2020), we combine these with the solar abundance set of Grevesse & Sauval (1998) for internal self-consistency with both the xillver reflection model (García & Kallman 2010) and the xstar photoionisation code (Kallman & Bautista 2001), which are heavily utilized throughout our analysis; see Section 3.1., and we allow for both fully and partially covering absorption. In addition to the absorbers associated with ESO 033–G002, all models presented in this work also include neutral absorption from the Galactic column (also using tbabs; , HI4PI Collaboration et al. 2016), As is standard, we also allow cross-normalisation constants to float between the different detectors throughout this work (taking EPIC-pn as our reference point), in order to account for both calibration differences and the fact that the NuSTAR observation spans a longer duration than XMM-Newton does; these are always within 15% of unity, broadly as expected given the current level of cross-calibration (e.g. Madsen et al. 2015) and the level of variability observed (see Figure 2). The column density of the fully covering absorber is , similar to the previous observations of ESO 033–G002 highlighted above, the column density and covering factor for the partially covering absorber are and , respectively, and the photon index is , fairly typical for AGN (e.g. Ricci et al. 2017). A strong, broad feature is clearly present in the iron K bandpass, along with a strong hard excess that peaks at 30 keV. Both features are key characteristics of strong reflection from the inner accretion disc.
A narrow core to the iron emission is also seen at 6.4 keV, indicating further reprocessing by more distant material, and a pair of absorption lines associated with highly ionised iron are also seen at 7 keV. ESO 033–G002 therefore shows similar spectral complexity to a number of other famous and well-studied AGN, e.g. NGC 1365 (Risaliti et al. 2005, 2009a, 2013; Walton et al. 2014; Rivers et al. 2015), IRAS 13197–1627 (Dadina & Cappi 2004; Miniutti et al. 2007; Walton et al. 2018), among others. Modelling the 1.5–10.0 keV band with the above continuum, three Gaussians for the narrow features, and a relline component (Dauser et al. 2010) for the broad iron emission, we find the latter has an extremely large equivalent width of eV, the narrow core has a much more modest equivalent width of eV (note that we quote parameter uncertainties at the 90% confidence level for one interesting parameter). For the relline component, we limit the line energy to 6.4–6.97 keV in the rest-frame of ESO 033–G002, corresponding to neutral and hydrogen-like iron, and find that the line energy can have any value in this range. Assuming the disc extends into the innermost stable circular orbit, the best-fit spin and inclination are and ∘. The relline model allows for a broken powerlaw emissivity profile, but we assume a single powerlaw for simplicity at this stage, i.e. , and find a fairly steep index of . However we stress that these values should only be considered very preliminary, as a proper characterisation of the relativistic blurring requires consideration of the full reflection spectrum (performed below), self-consistently treating both the iron emission and the corresponding iron edge at higher energies.
The ionised absorption lines both have eV (formally, eV and eV) and line widths of eV (assuming the two absorption lines have the same width). This width roughly corresponds to a velocity broadening of 3000 , fairly typical for such absorption in other systems (e.g. Risaliti et al. 2005; Walton et al. 2018). The line energies in the rest-frame of ESO 033–G002 are and keV, respectively, corresponding to a line-of-sight outflow velocity of 5500 .
3.1 General Model Setup
Although flux variability is clearly seen, there is limited evidence for significant spectral variability even above 2 keV (where the direct nuclear emission dominates; see Figure 2), and so we focus our detailed spectral analysis on modelling the time-averaged broadband XMM-Newton+NuSTAR spectrum shown above (Figure 1). We construct a spectral model for ESO 033–G002 that includes the intrinsic emission from the central AGN, which consists of the primary X-ray continuum and the associated relativistic reflection from the inner accretion disc, highly ionised absorption, a complex neutral absorber, and reprocessing by more distant material. Our approach to constructing this model is broadly similar to the recent broadband analyses of IRAS 13197-1627, IRAS 00521-7054 and IRAS 09149-6206 presented by Walton et al. (2018, 2019, 2020), respectively, all of which exhibit similarly complex spectra to ESO 033–G002.
Following these works, we model the disc reflection with the relxill family of models, (v1.3.10; García et al. 2014; Dauser et al. 2014). We assume a lamppost geometry for the disc reflection throughout our analysis. Although this is a somewhat simplistic geometry, as discussed in previous works it allows for a physical interpretation for the reflection fraction, (see Dauser et al. 2016), and also enables us to exclude non-physical regions of parameter space (e.g. a very steep radial emissivity profile and a non-rotating black hole). As discussed below (Section 3.2), we consider two of the available variants of the relxill model that are potentially relevant to ESO 033–G002 in our analysis. In these models, the ionising continuum is assumed to be an nthcomp thermal Comptonisation model (Zdziarski et al. 1996; Zycki et al. 1999), characterised by the photon index and electron temperature (; note that this emission is also included in the relxill models). The other key free parameters common to these models are the spin of the black hole (), the height (above the spin axis) of the X-ray source () and the inclination, ionisation state and iron abundance of the accretion disc (, and , respectively; the rest of the elements included in the xillver/relxill models are assumed to have solar abundances). The ionisation parameter follows the standard definition: , where is the ionising luminosity (integrated over the 0.1–1000 keV bandpass in relxill), is the density of the disc, and is the distance to the X-ray source; this is allowed to vary over the range = 0–4, as appropriate for AGN (e.g. Ballantyne et al. 2011; Walton et al. 2013). We assume that the accretion disc extends down to the innermost stable circular orbit (ISCO), and set the outer radius of the disk to the maximum value allowed by the model (1000 ).
We also consider two different models for the distant reflection: the xillver model, which assumes a simple slab geometry for the reprocessor, and the borus model, which assumes a torus-like geometry (formally the geometry is spherical with conical polar cutouts). As part of the same broad family of models, xillver naturally shares most of its parameters with relxill; for this component we assume the material is essentially neutral ( = 0, the lowest allowed value). For the borus model, we also use the variant that assumes an nthcomp continuum (borus12; Baloković et al. 2019). The additional free parameters in borus are the column density through the torus, and the solid angle it subtends; the reprocessing gas is assumed to be neutral in the borus model. Ultimately, though, we find consistent results regardless of which of these models we use, and the additional free parameters in borus are poorly constrained, so we present the results with the xillver model for simplicity
For the neutral absorption associated with ESO 033–G002, we again combine a partially covering absorber with a fully covering component, continuing to use the tbabs absorption code. The ionised absorption is instead modelled with xstar, using a grid of pre-calculated absorption models. These are computed assuming a generic ionising continuum of – roughly similar to a typical AGN continuum (Ricci et al. 2017) – to allow for broader applicability, and a velocity broadening of 3000 (as found above); the key free parameters are the ionisation parameter, column density, outflow velocity and iron abundance of the absorbing gas; all other elements are assumed to have solar abundances. Note that the bandpass for the ionising luminosity is defined to be 1–1000 Ry (i.e. 13.6 eV – 13.6 keV) in xstar. The assumed continuum is also similar to the simple fit discussed previously, but even if the true photon index differs slightly from this assumption, this will only result in mild differences in the ionisation parameter inferred (see e.g. Walton et al. 2020). We also investigated allowing the neutral absorber to be partially ionised, also using xstar, but find that this offers no improvement in the fit; the ionisation parameter tends towards neutral absorption and the rest of the results are unchanged.
Finally, for the softest emission, we approximate this with a combination of a second nthcomp continuum and a mekal plasma component (Mewe et al. 1986; Liedahl et al. 1995) to represent scattered nuclear flux and diffuse plasma emission, respectively, in order to allow for both possible contributions. The latter is an optically-thin plasma that is simply characterised by a plasma temperature, .
The model is set up such that the absorbers associated with ESO 033–G002 act only on the emission from the central regions (i.e. the relxill component); the distant reflection and the low-energy scattered/diffuse components are only subject to the Galactic column. For self-consistency, we assume the same iron abundance for all the different model components associated with the emission from the AGN in ESO 033–G002, and we also link all of the relevant continuum parameters among the different model components (, ), after accounting for the appropriate gravitational redshift () implied by and , since the lamppost variants of relxill evaluate the properties of the X-ray source in its rest frame. The full xspec expression for our basic model setup is as follows: tbabsGal mekal + nthcompscat + xillver + tbabsfull tbabspart xstar relxill.
| Model Component | Parameter | Model | ||||
|---|---|---|---|---|---|---|
| 1a | 1b | 2a | 2b | |||
| tbabsfull | [ cm-2] | |||||
| tbabspart | [ cm-2] | |||||
| [%] | ||||||
| xstar | [erg cm s-1] | |||||
| [ cm-2] | ||||||
| [] | ||||||
| relxilllp_ion_cp/ | ||||||
| relxilllp_d_cp | \tmark[a] | [keV] | ||||
| [∘] | ||||||
| [] | ||||||
| \tmark[b] | \tmark[b] | |||||
| \tmark[c] | [solar] | |||||
| [erg cm s-1] | ||||||
| 0\tmark[d] | 0\tmark[d] | |||||
| [cm-3] | 15\tmark[d] | 15\tmark[d] | ||||
| Norm | [] | |||||
| xillver_cp | Norm | [] | ||||
| mekal | [keV] | |||||
| Norm | [] | |||||
| nthcompscat | Norm | [] | ||||
| /DoF | 2509/2537 | 2510/2538 | 2509/2537 | 2510/2538 | ||
3.2 Results
The two variants of relxill we consider in this work are relxilllp_ion_cp and relxilllp_d_cp, which we refer to as models 1 and 2, respectively. The former assumes a typical density for reflection models available in the literature ( cm-3) and allows for an ionisation gradient across the disc, which we assume to have a powerlaw form (i.e. , where is a free parameter; in this case the ionisation parameter given is for the innermost disc). The latter assumes the disc has a constant ionisation (i.e. ), but includes its density as a free parameter.222Some aspects of this model are still in development, and as such it is not distributed with current versions of relxill as standard. In particular, the additional high-density plasma effects discussed in Kallman et al. (2021) are still being incorporated. However, for the density regime we are interested in here ( cm-3), the results should be reliable. The intention is to distribute relxilllp_d_cp with future versions of the relxill package once these updates are included. We use these models because recent work in the literature has found that both of these extensions to the standard reflection models typically used in the literature (which typically assume either or cm-3, or both) may be important for modelling the X-ray spectra of AGN under certain circumstances (e.g. Svoboda et al. 2012; Kammoun et al. 2019; Ingram et al. 2019; Jiang et al. 2018, 2019).
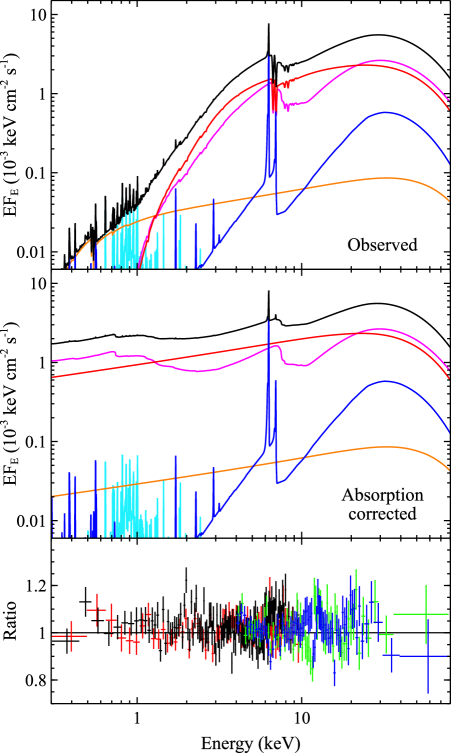
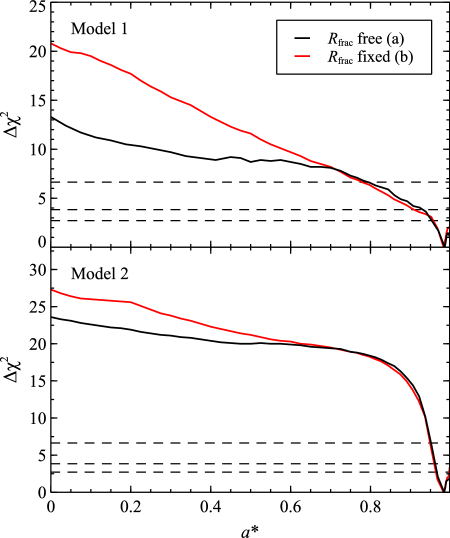
In both cases, we initially allow to vary as a free parameter (models 1a and 2a, respectively). Both of these models fit the data extremely well, with = 2509 for 2537 degrees of freedom (DoF), and both settle on essentially identical best fits; the parameter constraints are given in Table 2. For illustration, we show the relative contributions of the various model components for model 1a in Figure 3, both with and without the inferred line-of-sight absorption, along with the data/model ratio for this fit. Removal of any of the key model components significantly degrades the fit, by per degree of freedom. We note in particular that removing the disc reflection degrades the fit by for 6 fewer free parameters. Despite their similarity, we still present both models in order to explore how these different approaches influence the constraints on the best-fit geometric parameters of interest (i.e. and ). The best fits imply a rather extreme scenario, involving a rapidly rotating black hole () and an extremely compact X-ray source ( ) in both cases. We show the confidence contours for the spin constraints in Figure 4.
Such a combination would naturally predict a very large reflection fraction, as hinted at by the previous data (Baloković 2017; Lanz et al. 2019; Panagiotou & Walter 2019), owing to the strong gravitational lightbending associated with such a geometry. Indeed, the best-fit reflection fractions are = 3–7 in both cases, significantly in excess of the value expected for a standard accretion disc in the absence of lightbending (which should give 1). This combination would also imply the presence of a steep emissivity profile for the inner disc. Although we do not present these fits in full, we therefore also explored a model in which the emissivity profile is characterised by a broken powerlaw (i.e. for and for ) instead of a formal lamppost profile. Fixing (e.g. Reynolds & Begelman 1997), we find and , broadly consistent with the profile expected for a very compact lamppost geometry (e.g. Wilkins & Fabian 2011; Dauser et al. 2013; Gonzalez et al. 2017). The other key reflection parameters (e.g. the spin and inclination constraints) are all consistent with those presented for the lamppost models.
The strong disc reflection is primarily the reason that the exact choice of model for the distant reflection does not matter here. The different geometries assumed in these models result in differences in the relative strengths of the narrow iron emission and the Compton hump from the distant reprocessor, and some differences in the exact shape of the latter. While these differences can be important in some cases, particularly in extremely obscured cases where the distant reflection dominates the spectrum, when the spectrum is dominated by reflection from the disc then these differences have a negligible effect on the fit as the emission from the distant reflector makes only a small contribution to the overall flux (see also Walton et al. 2018). As noted above, this also means that the additional parameters relevant to borus are poorly constrained. We do not present the results in full for brevity, as they are consistent with those already presented in Table 2, but taking the relxilllp_ion_cp model as an example, we find the covering factor of the torus to be unconstrained above of 0.1 (the minimum value permitted by the model), and the column density through the torus is only constrained to . Interestingly, this extends comfortably into the Compton-thin regime, and is actually consistent with the line-of-sight column. In that situation, there would be no Compton-hump associated with the distant reprocessor at all, and all of the reflection continuum would be associated with the disc. With regards to estimating , adopting the xillver model for the distant reflector can therefore be considered a slightly conservative approach. Comparing the relative fluxes of the xillver and relxill components in the 20–40 keV band with the pexrav neutral reflection model (Magdziarz & Zdziarski 1995) implies a reflection fraction for the distant reflector of with this model, within the typical range seen from local Seyferts (e.g. Nandra et al. 2007).
We also find that the two extensions to standard reflection models considered here are not formally needed by the data for ESO 033–G002; with the relxilllp_ion_cp model the ionisation gradient runs to zero, with an upper limit of , and with the relxilllp_d_cp model we find the density tends back to the typical value of cm-3, with an (fairly weak) upper limit of . This may be because of the lack of direct soft X-ray flux from the nucleus, which is absorbed away below 1.5 keV; although both and can have some influence in the Fe K band, this soft band generally provides the majority of the information that constrains these parameters.
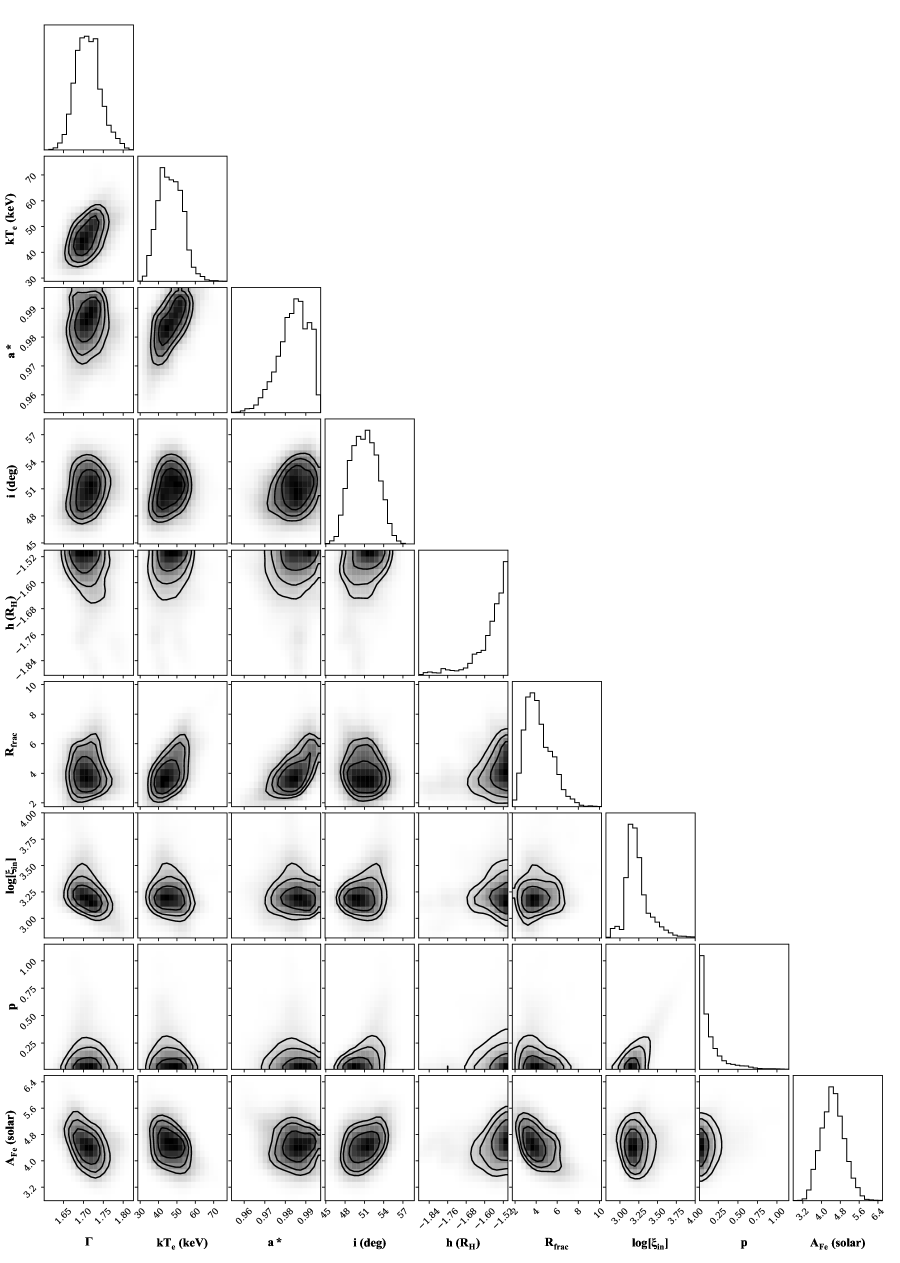
Given the model complexity, we also confirm the parameter constraints returned by our analysis by running a series of Monte Carlo Markoff Chain (MCMC) simulations, making use of the MCMC functionality within xspec. We use the Goodman-Weare algorithm (Goodman & Weare 2010), and focus on model 1a for this exercise, taking the best-fit model parameters presented in Table 2 as our starting point. The rest of the setup is: 60 walkers, each of which is run for 30,000 steps with a burn-in length of 5,000, giving a total chain of 1,500,000 parameter combinations. The full results of this run are presented in Appendix A. Here, we simply note that the 90% constraint on the spin found from this analysis is , very similar to that obtained with our analysis.
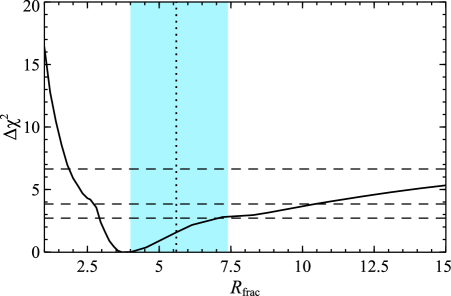
The best-fit reflection fractions found in both models 1a and 2a are quantitatively consistent with the predicted reflection fractions based purely on and for a thin disc model (predicted 5.4; see Figure 5), broadly similar to the recent case of IRAS 09149–6206 (Walton et al. 2020). We therefore present further fits with each of the relxill variants in which is self-consistently computed from and in the lamppost geometry (models 1b and 2b). These are also presented in Table 2; minimal differences are seen in the best fits, but some of the parameter constraints have tightened further (see below). The updated confidence contours for the spin are also shown in Figure 4; although the formal 90% constraints are not too different for the spin specifically, these fits do exclude the low spin parameter space at higher confidence than the fits in which is a free parameter.
In all of our models, the iron abundance is found to be significantly super-solar, with best-fit abundances of 4–5. The constraints are tighter in models 1b and 2b, where we compute self consistently, as there is a mild degeneracy between and since both of these parameters play a role in determining the strength of the iron emission line (see Appendix A). In turn, this results in tighter constraints on the column densities of the various absorbers, which are similarly connected to the iron abundance (also see Appendix A). Interestingly, we find that the abundance constraints are similar for both relxill variants considered, implying the abundance does not depend on the density here. Indeed, even if we force the density to the upper boundary of the range for which relxilllp_d_cp is currently valid ( cm-3), we still find best-fit abundances consistent with those reported for models 2a/b in Table 2.
In other cases, allowing for higher densities can result in lower iron abundances being inferred (Tomsick et al. 2018; García et al. 2018; Jiang et al. 2019), as increasing the disc density can also influence the reflection continuum in the iron band (in addition to the main changes that occur at low energies), and in turn the best-fit iron abundance. For ESO 033–G002 specifically, the fact that this does not occur may be because the high iron abundance is not only driven by the disc reflection. If we split the main spectral components into those associated with the disc (the relativistic reflection and the ionised absorption) and those presumably associated with more distant nuclear structures (the neutral absorbers and the distant reflector), and allow the two groups to have different iron abundances, using model 2b we still find a super-solar iron abundance of for the ‘distant’ group, consistent with the constraint found for the ‘disc’ group of ; a solar abundance for the ‘distant’ group is strongly disfavoured (). Reynolds et al. (2012) also suggested an alternative ‘radiative levitation’ explanation for the super-solar iron abundances seen in some AGN, in which radiation pressure within the disc preferentially forces iron to the surface, artificially enhancing the perceived abundance. However, again the consistently high abundance seen for both the disc and the distant model components would suggest this is not relevant here, and that ESO 033–G002 really does have a super-solar iron abundance.
4 Discussion
We have presented a detailed analysis of the the first broadband (i.e. XMM-Newton+NuSTAR) observation of the type-2 Seyfert ESO 033–G002. These data show clear evidence for X-ray obscuration, broadly consistent with its type-2 optical classification and qualitatively similar to the limited archival observations available for this source (Smith & Done 1996; Vignali et al. 1998; Marchesi et al. 2017, although note that the final absorption model we use is more complex than those considered in these works); the direct emission from the nucleus is completely absorbed away below 1.5 keV, leaving only scattered/diffuse emission at the lowest energies, and there is clear evidence for reprocessing by distant material in the form of a narrow emission line from neutral iron. However, the level of obscuration is not so strong as to prevent us from viewing the innermost regions of the accretion flow: a strong contribution from relativistic disc reflection is also seen at higher energies via a relativistically broadened iron emission line and its associated Compton reflection continuum, and an ionised outflow is also seen via blueshifted absorption from Fe XXV and Fe XXVI. The combined coverage from XMM-Newton and NuSTAR allows us to disentangle all of these contributions to the observed spectrum, and to place robust constraints on the emission from the nuclear regions despite their moderate obscuration.
4.1 X-ray Constraints on the Black Hole
By modelling the reflection from the innermost accretion disc, we are able to place tight constraints on the spin of the black hole. Although we have used two different reflection models (allowing for a radial ionisation gradient across the disc and for a variable density), and made differing assumptions about the precise treatment of the reflected emission in our analysis (allowing the reflection fraction to be both coupled and decoupled to the spin constraints), we find consistent results for the spin across all of our models: (at 90% confidence). Systematic errors on spin measurements in this regime are likely 0.1 (e.g. Bonson & Gallo 2016; Choudhury et al. 2017; Kammoun et al. 2018). ESO 033–G002 therefore joins the growing list of rapidly rotating SMBHs in active galactic nuclei (e.g. Risaliti et al. 2013; Walton et al. 2013, 2014, 2020; Parker et al. 2014; Reis et al. 2014; Reynolds et al. 2014; Chamani et al. 2020; see Reynolds 2020 for a recent review). Similar to many of the other AGN with rapidly rotating black holes, ESO 033–G002 is radio-quiet, arguing further against the idea that the difference between radio-loud and radio-quiet AGN is solely related to different black hole spins, with high/low spin black holes exhibiting/lacking jet activity (as has been suggested previously, e.g. Wilson & Colbert 1995; Moderski et al. 1998; Sikora et al. 2007). We stress, however, that this only means that black hole spin is not simply a ‘switch’ that determines whether a jet is launched or not; when jets are launched, it is certainly still plausible that the spin could play an important role in setting the jet power (e.g. Blandford & Znajek 1977).
The spin of a SMBH is dictated by the manner in which its most recent major growth episode occurred. Growth by a series of chaotic accretion events/mergers will tend to spin the black hole down, while growth via prolonged ‘coherent’ accretion (in which the accreted material has a common angular momentum axis) will spin the black hole up (e.g. King & Pringle 2006; Sesana et al. 2014; Fiacconi et al. 2018). The high spin of the SMBH in ESO 033–G002 suggests its most recent growth episode is best described with the latter scenario. Indeed, the barred-spiral morphology of the host galaxy shows no obvious evidence for disruption related to recent merger activity (Malkan et al. 1998) which could have triggered a more chaotic recent accretion history.
Ultimately, though, in terms of informing black hole growth/galaxy evolution models on a global scale, it is the distribution of SMBH spins that is key (e.g. Berti & Volonteri 2008; Sesana et al. 2014). Some preliminary attempts have been made to build this distribution in the literature (Walton et al. 2013; Vasudevan et al. 2016), which show a preference for higher spins, but these have been hampered by the relatively low numbers of reflection-based measurements available (even today, we only have 35 AGN spin constraints; Reynolds 2020) and the fact that there is a known observational bias towards rapidly rotating black holes (as such sources should be brighter for a given accretion rate; Brenneman et al. 2011). In order to overcome these limitations, the sample of AGN with spin constraints still needs expanding. In this respect, the impact of NuSTAR will continue to be significant, as its broadband coverage this has opened up the possibility of obtaining robust spin measurements for even slightly more obscured systems by accurately determining the contribution from reflection (e.g. Risaliti et al. 2013; Walton et al. 2014, 2018, 2019). In these cases, such constraints would have been challenging with only soft X-ray coverage owing to modelling degeneracies, and we can now add ESO 033–G002 to this list. Although numbers are still small, early indications are that these more obscured cases also show a preference for rapidly rotating black holes, similar to their less obscured counterparts, but further measurements are required here too before robust conclusions can be made.
The mass of the black hole in ESO 033–G002 is not currently well established in the literature; as a type-2 Seyfert, there are no optical broad lines from which to determine the mass via either the line widths or via optical reverberation mapping campaigns. Nevertheless, we can obtain a very rough estimate from its X-ray properties. The X-ray photon index is known to correlate with the Eddington ratio of the black hole, (e.g. Shemmer et al. 2008; Risaliti et al. 2009b; Brightman et al. 2013; Trakhtenbrot et al. 2017). The photon index of found here would imply , based on the more recent of these works. We can also estimate from the 2–10 keV luminosity inferred from our work via the appropriate bolometric correction ; this correction is known to be a function of Eddington ratio (Vasudevan & Fabian 2009; Lusso et al. 2010), and would imply . From our spectral fits we find the observed and absorption-corrected 2–10 keV fluxes to be and , respectively. The latter corresponds to an intrinsic 2–10 keV luminosity of erg s-1 for a luminosity distance of 77 Mpc.333Based on and assuming a standard CDM concordance cosmology, i.e. = 70 km s-1 Mpc-1, , . Combining this with and gives erg s-1 and . However, given both the statistical uncertainty on and the scatter on the vs trend, the uncertainty on this estimate is likely almost an order of magnitude.
We can also estimate the mass from the X-ray variability observed, since the lack of strong spectral variability suggest this is largely intrinsic to the AGN (as opposed to being driven by changes in the line-of-sight absorption; Figure 2). Although we do not have sufficient data for more sophisticated methods, such as using features in the variability power spectrum (e.g. McHardy et al. 2006), we use the anti-correlation between the normalised excess variance (, see Vaughan et al. 2003) and black hole mass for local AGN reported by Ponti et al. (2012). We follow their approach and calculate on 40 ks timescales after having rebinned the 2–10 keV XMM-Newton lightcurve to 250s bins, and find . This would imply based on the trend reported for AGN with reverberation-mapped masses, in good agreement with the mass estimated from the spectral results, but again with fairly significant uncertainties (roughly a factor of 5, combining the scatter reported in Ponti et al. 2012 and the systematic error on reverberation mapped masses of 0.4 dex discussed by Peterson 2014).
Although both of the mass estimates from the X-ray spectroscopy and the X-ray timing for ESO 033–G002 carry significant uncertainties, they are in encouraging agreement. Furthermore, these X-ray mass estimates are also in good agreement with the mass estimate of recently obtained by the BAT AGN Spectroscopic Survey team (BASS; Koss et al. 2017) based on VLT/Xshooter optical spectroscopy. These data allow a measurement of the stellar velocity dispersion of the host galaxy, from which the back hole mass is inferred based on standard scaling relations (e.g. Kormendy & Ho 2013). Appendix B briefly summarizes these optical data and their analyiss; full details will be presented in Koss et al. (in prep.). Improved mass constraints may be possible in the future via reverberation mapping of the relativistic iron line (e.g. Alston et al. 2020), but such work would require a series of long X-ray observations.
4.2 The X-ray Source
Although the X-ray corona is widely expected to be related to Compton up-scattering of thermal photons emitting by the accretion disc (e.g. Haardt & Maraschi 1991), the detailed properties of this structure (its geometry, temperature, etc.) are still being explored. Through a variety of arguments, combining intrinsic X-ray variability/reverberation (e.g. Fabian et al. 2009; Zoghbi et al. 2012; Kara et al. 2016), microlensing variations in lensed quasars (e.g. Chartas et al. 2009; Dai et al. 2010; MacLeod et al. 2015), X-ray occultation events (e.g. Risaliti et al. 2009a; Gallo et al. 2021) and detailed analyses of the emissivity profiles implied by relativistic disc reflection models (e.g. Wilkins & Fabian 2011; Fabian et al. 2013), we know the corona must typically be a compact region close to the black hole (within 10 or so). However, the strength of the disc reflection found in our analysis ( 5) implies a particularly compact corona in ESO 033–G002; assuming a lamppost geometry with a thin disc, we find that the corona must be within 2 of the black hole in order to produce the necessary lightbending. Similar reflection-dominated states have been seen in other AGN (e.g. Fabian et al. 2012; Parker et al. 2014), where coronae within a few of the black hole have also been inferred.
Although a lamppost is clearly a simplified geometry (Wilkins & Fabian 2012; Zhang et al. 2019), the requirement for such a compact corona reinforces the use of such models in our spectral analyses; the more compact the corona, the more reasonably it can be approximated as a lamppost. Disc geometries beyond the razor-thin approximation used in relxill have recently been explored in the literature. In particular, Taylor & Reynolds (2018) allow for a varying scale-height for the accretion disc, following the expectation that at higher accretion rates larger scale-height discs are expected (Shakura & Sunyaev 1973). If the scale-height of the disc is non-negligible then the inner regions can form more of a funnel-like geometry, which could potentially help to enhance the reflection fraction. However, this would only have a significant effect if the size of the X-ray source is smaller than the scale-height of the funnel, and in most cases this would imply that the corona is likely to be in a regime in which strong gravitational lightbending is important anyway. Furthermore, the Eddington ratio inferred above is very modest, , and the disc is still expected to be geometrically thin in this regime as radiation pressure should not play a major role, so it is not clear that such a thick disc geometry is a plausible alternative explanation for the large found in this case. Furthermore, we note that the constraints on are still tight even in the models where this is decoupled from . We therefore conclude that the X-ray corona really is very compact in this system.
Despite this, we note that it should still be possible to accommodate a corona that intercepts sufficient disc photons to power the observed X-ray flux within the relevant size scales for ESO 033–G002. Following the approach of Dovčiak & Done (2016, see their equation 6) we estimate the minimum ‘size’ for the corona () required by the assumption that the X-rays are powered by inverse Compton scattering of disc photons. The type-2 nature of ESO 033–G002 means that the thermal emission from the disc cannot be observed directly in this case, but adopting the above X-ray bolometric correction of as being representative of the relative X-ray and disc fluxes, we find that the key results here (, , and ) comfortably satisfy , as the minimum size implied is only . This is broadly consistent with the results of Ursini et al. (2020), who find that solutions with are generally available for rapidly rotating black holes.
Taken at face value, the fact that strong reflection has been reported for both NuSTAR observations, taken in 2014 and 2020 could imply that black hole coronae can remain highly compact for extended periods of time (several years). However, we cannot rule out the possibility that the source geometry is variable on these timescales either. Indeed, extrapolating beyond the NuSTAR bandpass, the 14–195 keV flux implied by our model is , a factor of 2.5 lower than the long-term average seen by Swift/BAT ( ; Oh et al. 2018). This may imply we caught ESO 033–G002 in an unusually low-flux state, and in turn imply a variable coronal geometry (e.g. Parker et al. 2014; Fabian et al. 2012), but further deep NuSTAR observations will be required to confirm this.
In addition to the geometric constraints from the disc reflection, the high-energy coverage from NuSTAR also provides insight into the plasma conditions in the corona, and in particular the temperature of the Comptonising electrons () which governs the high-energy cutoff in the primary continuum emission (e.g. Brenneman et al. 2014; Matt et al. 2015; Baloković et al. 2015; García et al. 2015; Walton et al. 2016; Kamraj et al. 2018). As noted above, the variants of the relxill model we use here both assume the primary continuum is a thermal Comptonisation model, and so provide constraints on directly, and our use of the lamppost geometry variants means that this is evaluated in the rest-frame of the X-ray source (i.e. gravitational redshift is accounted for; note that this produces the mild dependence seen between and the spin in the Monte Carlo contours, as the spin helps set ). Beyond these assumptions, the results are largely independent of the precise details of the reflection model used, and we find = 40–70 keV.
This differs from the initial estimate based on a shorter NuSTAR+Swift snapshot of keV (when modelling the high-energy cutoff as an exponential; Baloković et al. 2020); adopting a fairly standard conversion of (Petrucci et al. 2001), our measurement would correspond to = 120-210 keV (note also that the previous constraint is in the observed frame, and does not consider any gravitational redshift, which would further increase the discrepancy). However, as noted by Baloković et al. (2020), their result marked ESO 033–G002 as something of an outlier among the broader AGN population. The electron temperature obtained here is much more in line with typical results for other AGN (e.g. Fabian et al. 2015; Tortosa et al. 2018; Ricci et al. 2018; Baloković et al. 2020), demonstrating the importance of both high S/N broadband coverage and detailed modelling of the reflection and absorption in these complex cases when determining as well as geometric constraints on the X-ray source. This is not just an issue relating to lower S/N giving poorer statistical constraints on model parameters; the low S/N also forces the use of only simple models. Although such models can still be informative in many cases, for complex sources such as ESO 033–G002 they can give misleading results.
Fabian et al. (2015) compiled the constraints from accreting black holes (both AGN and X-ray binaries) for which has been constrained by high S/N NuSTAR data, characterising the data in terms of the compactness–temperature plane (here ‘compactness’ refers to the radiative compactness; this can be expressed as , where is the size of the X-ray source in , and and are the electron and proton masses, respectively). In doing so, Fabian et al. (2015) were able to show that the results cluster close to the limit set by pair runaway, the point at which further injection of energy into the corona no longer increases its temperature but instead results in increasing pair generation (see also Fabian et al. 2017 and Tortosa et al. 2018 for updated samples of constraints with NuSTAR). The properties of X-ray coronae therefore appear to be primarily dictated by this pair-production ‘thermostat’. Given that we infer the corona to be highly compact (in a geometrical sense) here, we also consider where ESO 033–G002 lies in the – plane. Taking the size of the X-ray source to be , and , we therefore find . Combining this with our temperature constraints implies that the X-ray source in ESO 033–G002 is also consistent with being close to this pair runaway limit. ESO 033–G002 therefore does not appear to be abnormal in this regard, despite its highly compact corona.
4.3 The Low-Energy Absorption and the Ionised Outflow
Even though the covering factor is fairly high (80%) the primary low-energy absorber (in terms of column density) does not appear to cover the whole X-ray source. Geometrically this would be quite challenging to achieve for a very distant absorber, given how compact the X-ray source appears to be. We therefore speculate that this component may be similar to the transient ‘obscurer’ seen recently in NGC 5548 (Kaastra et al. 2014). This low-ionisation () outflow persisted for several years, covered a similar fraction of the X-ray source (85%), and was inferred to be a stream of material originally launched from the accretion disc that also extended sufficiently to obscure some fraction of the broad line region (BLR), and so its location was deemed to be comparable to the latter. Several similar events have now been recognised in other AGN (e.g. Ebrero et al. 2016; Mehdipour et al. 2017; Gallo et al. 2021). Allowing the partially covering component to be outflowing does not offer any notable improvement to the fit here, but we find the upper limit on any outflow velocity to be 5000 , which would still permit a similar outflow velocity to that seen from the NGC 5548 obscurer. The X-ray source is likely more compact by a factor of a few in the case of ESO 033–G002 (the X-ray source size was assumed to be 10 in the case of NGC 5548), which would in turn require the absorber to be closer by a similar factor in comparison (the black hole masses are quite similar), but the overall comparison seems promising. This could imply that the partially covering component could be transient for ESO 033–G002 as well, and it is therefore interesting to note that the total level of obscuration inferred here seems to exceed that of the archival observations, for which (similar to our fully-covering component; e.g. Smith & Done 1996; Baloković 2017). Further monitoring of ESO 033–G002 with high S/N broadband observations would therefore be of significant interest.
The ionised absorption seen at 7 keV is clearly blueshifted relative to the cosmological redshift of ESO 033–G002, implying an outflow with a line-of-sight velocity of 5400 . Although this is fast relative to typical outflow velocities seen in lower ionisation warm absorbers (typically , e.g. Laha et al. 2014), similar velocities are seen for highly ionised outflows in a number of other systems (e.g. Risaliti et al. 2005; Walton et al. 2018, 2020), and the wind in ESO 033–G002 does not come close to the most extreme winds seen from AGN in this respect (the ‘ultrafast’ ouflows, which can reach , Reeves et al. 2018; Walton et al. 2019). Following Tombesi et al. (2012), we attempt to constrain the location of the wind by considering both escape velocity and ionisation arguments; the former indicates the lower bound on the wind radius (, assuming the wind escapes, i.e. , where is determined by assuming and the mass determined above), while the latter likely provides an upper bound (see also Nardini et al. 2015). Here, we find cm (or equivalently ). This is somewhat intermediate to the range of radii inferred for the ultrafast outflows and the classic warm absorbers (Tombesi et al. 2012), and in the case of ESO 033–G002 likely places the outflow in the BLR. We also attempt to estimate the kinetic power carried by the wind in ESO 033–G002 relative to its radiative output () following the same methodology as Walton et al. (2020), i.e. combining equation 1 from that work (in which is expressed in terms of the column density, outflow velocity and the radius of the wind) with the assumption that , since this may provide the lower bound on . With this approach, we find (where and are the solid angle subtended by the wind and its volume filling factor, respectively, both of which are normalised to the range 0–1).
The observed co-evolution between SMBHs and their host galaxies (e.g. Ferrarese et al. 2006; Kormendy & Ho 2013) requires some kind of feedback mechanism that is able to connect their disparate size scales, and accretion-driven outflows are considered a prime candidate for this (see Fabian 2012 for a review). In order for this to be the case, simulations suggest that must be at least a few per cent of (e.g. Di Matteo et al. 2005; Hopkins & Elvis 2010). Although the outflow velocity is fairly modest in this case, the relative kinetic power of the wind in ESO 033–G002 still appears to be fairly close to this threshold. It should be noted that owing to our definitions, the product must be . Furthermore, we note again that significant uncertainties remain on the mass, and also likely on , both of which translate into additional significant uncertainties on . Depending on how these factors balance with the size of the launch radius (relative to ), the outflow in ESO 033–G002 may plausibly carry sufficient energy to drive galaxy-scale feedback, but a firm case for this conclusion cannot yet be made.
5 Conclusions
The nuclear X-ray spectrum of the type-2 Seyfert ESO 033–G002 is complex, showing evidence for absorption by both neutral and ionised material, as well as reprocessed emission from both the accretion disc and more distant material. Utilizing the broadband coverage provided by XMM-Newton and NuSTAR, we have been able to disentangle all of these various contributions to the observed data. The total neutral absorption column is fairly large, , consistent with its optical classification as a type-2 Seyfert but not so large as to prevent us from viewing the innermost accretion flow, while the ionised absorption occurs in a moderately rapid outflow ( ) with a column comparable to the neutral absorption. Most remarkably, the contribution from reflection from the innermost accretion flow is very large, 5, requiring strong gravitational lightbending. In turn, this requires both an extremely compact X-ray corona and a rapidly rotating black hole; we find that the corona must be within 2 of the black hole, which must have a spin of . ESO 033–G002 is therefore yet another addition to the sample of radio-quiet AGN that host high-spin black holes. In addition to its geometry, the high-energy coverage from NuSTAR also allows us to place constraints on the temperature of the corona, which we find to be keV. Although its geometry is fairly extreme, similarly compact coronae have been inferred in a handful of other AGN, and when considered in terms of the compactness–temperature plane, ESO 033–G002 does not seem abnormal when compared with the broader AGN population, lying similarly close to the limit set by runaway pair production.
ACKNOWLEDGEMENTS
DJW acknowledges support from the Science and Technology Facilities Council (STFC) in the form of an Ernest Rutherford Fellowship (ST/N004027/1). MB acknowledges support from the YCAA Prize Postdoctoral Fellowship. CSR thanks the STFC for support under Consolidated Grant ST/S000623/1, as well as the European Research Council (ERC) for support under the European Union’s Horizon 2020 research and innovation programme (grant 834203). CR acknowledges support from the Fondecyt Iniciacion grant 11190831. JAG acknowledges support from NASA grant 80NSSC19K1020 and from the Alexander von Humboldt Foundation. This research has made use of data obtained with NuSTAR, a project led by Caltech, funded by NASA and managed by the NASA Jet Propulsion Laboratory (JPL), and has utilized the nustardas software package, jointly developed by the Space Science Data Centre (SSDC; Italy) and Caltech (USA). This research has also made use of data obtained with XMM-Newton, an ESA science mission with instruments and contributions directly funded by ESA Member States. This work has made use of the corner package (Foreman-Mackey 2016) for data visualisation.
Data Availability
All of the data underlying this article will be available from June 2021 via ESA’s XMM-Newton Science Archive (https://www.cosmos.esa.int/web/xmm-newton/xsa) and NASA’s HEASARC archive (https://heasarc.gsfc.nasa.gov/).
Appendix A Monte Carlo Results
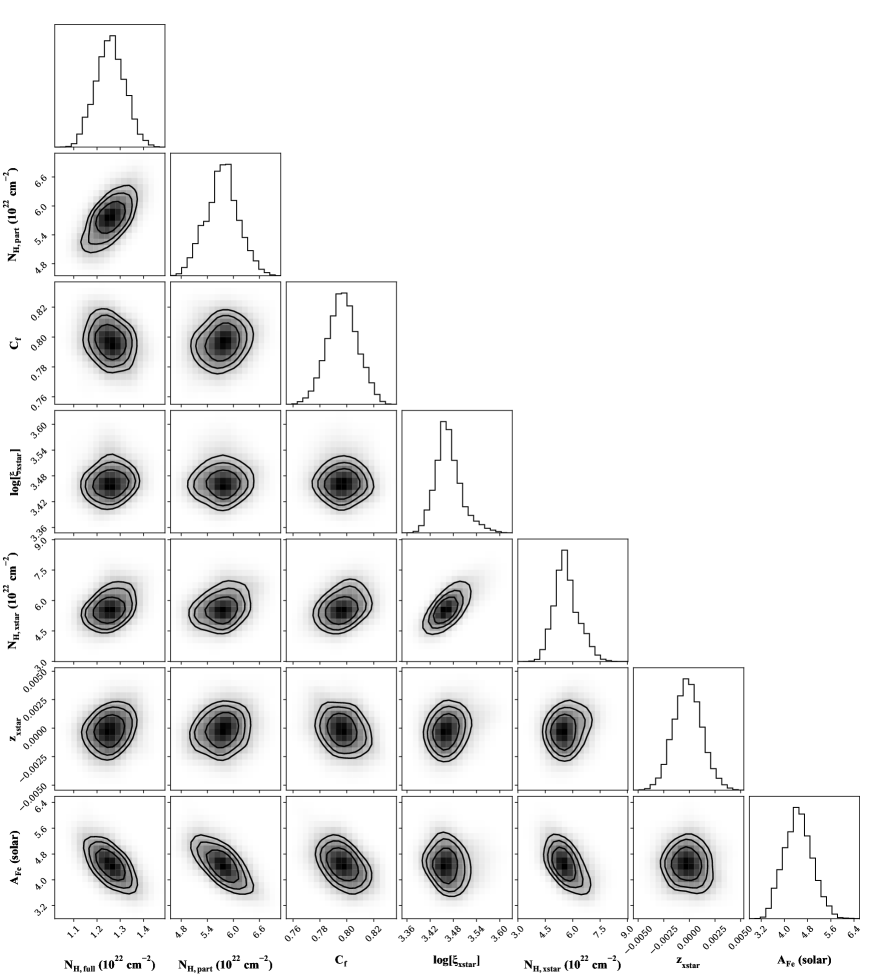
Here we present the results from our MCMC simulations performed for model 1a (see Section 3.2). For clarity, we focus on the parameters relating to the intrinsic continuum and the disc reflection in Figure 6, and on the parameters relating to the various absorbers in Figure 7. Note that here, the lamppost height is in units of the vertical horizon () which varies from , depending on the spin (the negative values are related to the relxill setup). In addition, the outflow velocity of the ionised absorber is given in terms of its redshift in the observed frame. We also stress that although the iron abundance is shown in both Figure 6 and 7 as it is important to both the reflection and the absorption, the abundance is common to all of these components; showing it in both also allows the reader to draw links between the panels in the two Figures. Chain convergence is good for all model parameters, with the convergence measure proposed by Geweke (1992) always close to zero.
Appendix B Optical Constraints on the Black Hole Mass
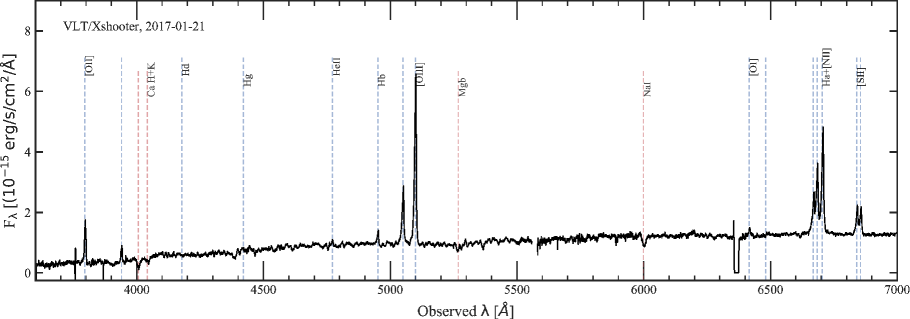
As part of ongoing efforts to follow-up AGN detected in hard X-rays by Swift/BAT, the BASS survey team444https://www.bass-survey.com/ recently obtained updated optical spectroscopy for ESO 033–G002 with VLT/Xshooter (Vernet et al. 2011). These data revealed resolved stellar absorption features, providing a measurement of the central stellar velocity dispersion, . In turn, this provides an independent estimate of the black hole mass using the well-known relation (Kormendy & Ho 2013). Full details of the spectroscopy and analysis performed will be presented in Koss et al (in prep.), here we summarise a few of the salient details relevant to this optical mass constraint.
ESO 033–G002 was observed for a 480 s exposure on UT 2017-01-21, with the Xshooter data relevant here coming from the UVB and VIS arms (3000–5595 and 5595–10,240 Å, respectively). The wavelength ranges 3880-5550 Å and 8350-8730 Å were used specifically to constrain , as these cover key stellar absorption features from Ca H+K (3935, 3968 Å), Mg i (5175 Å) and the Ca ii triplet (8498, 8542, 8662 Å); see e.g. Greene & Ho (2006). A portion of data are shown in Figure 8, in which some of these absorption features can clearly be seen. The continuum and the absorption features were fit using the penalized PiXel Fitting software (pPXF; Cappellari & Emsellem 2004) after masking out all of the prominent emission lines. The stellar features were fit using the VLT/Xshooter stellar template library (Chen et al. 2014), broadly following the procedure outlined in Koss et al. (2017); these templates have been observed with a higher resolution () than the observation of ESO 033–G002, and were convolved to the appropriate spectral resolution in pPXF. After accounting for the spectral resolution (which was subtracted in quadrature), the data imply a velocity dispersion of in the UVB arm and in the VIS arm. This implies a black hole mass of from the relation, where the quoted uncertainty is dominated by the known scatter of 0.3 dex around this trend.
References
- Alston et al. (2020) Alston W. N., Fabian A. C., Kara E., et al., 2020, Nature Astronomy, 4, 597
- Arnaud (1996) Arnaud K. A., 1996, in Astronomical Data Analysis Software and Systems V, edited by G. H. Jacoby & J. Barnes, vol. 101 of Astron. Soc. Pac. Conference Series, Astron. Soc. Pac., San Francisco, 17
- Ballantyne et al. (2011) Ballantyne D. R., McDuffie J. R., Rusin J. S., 2011, ApJ, 734, 112
- Baloković (2017) Baloković M., 2017, Unveiling the Structure of Active Galactic Nuclei with Hard X-ray Spectroscopy, Ph.D. thesis, California Institute of Technology
- Baloković et al. (2019) Baloković M., García J. A., Cabral S. E., 2019, Research Notes of the American Astronomical Society, 3, 11, 173
- Baloković et al. (2020) Baloković M., Harrison F. A., Madejski G., et al., 2020, arXiv e-prints, arXiv:2011.06583
- Baloković et al. (2015) Baloković M., Matt G., Harrison F. A., et al., 2015, ApJ, 800, 1, 62
- Bardeen et al. (1972) Bardeen J. M., Press W. H., Teukolsky S. A., 1972, ApJ, 178, 347
- Berti & Volonteri (2008) Berti E., Volonteri M., 2008, ApJ, 684, 822
- Bianchi et al. (2005) Bianchi S., Miniutti G., Fabian A. C., Iwasawa K., 2005, MNRAS, 360, 1, 380
- Bird et al. (2007) Bird A. J., Malizia A., Bazzano A., et al., 2007, ApJS, 170, 1, 175
- Blandford & Znajek (1977) Blandford R. D., Znajek R. L., 1977, MNRAS, 179, 433
- Bonson & Gallo (2016) Bonson K., Gallo L. C., 2016, MNRAS, 458, 1927
- Brenneman et al. (2014) Brenneman L. W., Madejski G., Fuerst F., et al., 2014, ApJ, 781, 83
- Brenneman et al. (2011) Brenneman L. W., Reynolds C. S., Nowak M. A., et al., 2011, ApJ, 736, 103
- Brightman et al. (2013) Brightman M., Silverman J. D., Mainieri V., et al., 2013, MNRAS, 433, 2485
- Buisson et al. (2018) Buisson D. J. K., Fabian A. C., Lohfink A. M., 2018, MNRAS, 481, 4, 4419
- Cappellari & Emsellem (2004) Cappellari M., Emsellem E., 2004, PASP, 116, 816, 138
- Chamani et al. (2020) Chamani W., Koljonen K., Savolainen T., 2020, A&A, 635, A172
- Chartas et al. (2009) Chartas G., Kochanek C. S., Dai X., Poindexter S., Garmire G., 2009, ApJ, 693, 174
- Chen et al. (2014) Chen Y.-P., Trager S. C., Peletier R. F., et al., 2014, A&A, 565, A117
- Choudhury et al. (2017) Choudhury K., García J. A., Steiner J. F., Bambi C., 2017, ApJ, 851, 1, 57
- Dadina & Cappi (2004) Dadina M., Cappi M., 2004, A&A, 413, 921
- Dai et al. (2010) Dai X., Kochanek C. S., Chartas G., et al., 2010, ApJ, 709, 278
- Dauser et al. (2014) Dauser T., García J., Parker M. L., Fabian A. C., Wilms J., 2014, MNRAS, 444, L100
- Dauser et al. (2016) Dauser T., García J., Walton D. J., et al., 2016, A&A, 590, A76
- Dauser et al. (2013) Dauser T., Garcia J., Wilms J., et al., 2013, MNRAS, 430, 1694
- Dauser et al. (2010) Dauser T., Wilms J., Reynolds C. S., Brenneman L. W., 2010, MNRAS, 409, 1534
- de Grijp et al. (1992) de Grijp M. H. K., Keel W. C., Miley G. K., Goudfrooij P., Lub J., 1992, A&AS, 96, 389
- Di Matteo et al. (2005) Di Matteo T., Springel V., Hernquist L., 2005, Nat, 433, 604
- Dovčiak & Done (2016) Dovčiak M., Done C., 2016, Astronomische Nachrichten, 337, 4-5, 441
- Ebrero et al. (2016) Ebrero J., Kriss G. A., Kaastra J. S., Ely J. C., 2016, A&A, 586, A72
- Elvis et al. (1994) Elvis M., Wilkes B. J., McDowell J. C., et al., 1994, ApJS, 95, 1
- Fabian (2012) Fabian A. C., 2012, ARA&A, 50, 455
- Fabian et al. (2013) Fabian A. C., Kara E., Walton D. J., et al., 2013, MNRAS, 429, 2917
- Fabian et al. (2017) Fabian A. C., Lohfink A., Belmont R., Malzac J., Coppi P., 2017, MNRAS, 467, 3, 2566
- Fabian et al. (2015) Fabian A. C., Lohfink A., Kara E., Parker M. L., Vasudevan R., Reynolds C. S., 2015, MNRAS, 451, 4375
- Fabian et al. (1989) Fabian A. C., Rees M. J., Stella L., White N. E., 1989, MNRAS, 238, 729
- Fabian et al. (2009) Fabian A. C., Zoghbi A., Ross R. R., et al., 2009, Nat, 459, 540
- Fabian et al. (2012) Fabian A. C., Zoghbi A., Wilkins D., et al., 2012, MNRAS, 419, 116
- Ferrarese et al. (2006) Ferrarese L., Côté P., Dalla Bontà E., et al., 2006, ApJ, 644, L21
- Fiacconi et al. (2018) Fiacconi D., Sijacki D., Pringle J. E., 2018, MNRAS
- Foreman-Mackey (2016) Foreman-Mackey D., 2016, The Journal of Open Source Software, 1, 24
- Gallo et al. (2021) Gallo L. C., Gonzalez A. G., Miller J. M., 2021, ApJ, 908, 2, L33
- García et al. (2014) García J., Dauser T., Lohfink A., et al., 2014, ApJ, 782, 76
- García & Kallman (2010) García J., Kallman T. R., 2010, ApJ, 718, 695
- García et al. (2015) García J. A., Dauser T., Steiner J. F., McClintock J. E., Keck M. L., Wilms J., 2015, ApJ, 808, L37
- García et al. (2018) García J. A., Kallman T. R., Bautista M., et al., 2018, in Workshop on Astrophysical Opacities, vol. 515 of Astronomical Society of the Pacific Conference Series, 282
- Gehrels et al. (2004) Gehrels N., Chincarini G., Giommi P., et al., 2004, ApJ, 611, 1005
- George & Fabian (1991) George I. M., Fabian A. C., 1991, MNRAS, 249, 352
- Geweke (1992) Geweke J., 1992, in Bayesian Statistics 4 (ed. J. M. Bernardo, J. O. Berger, A. P. Dawid and A. F. M. Smith), 169–193, Clarendon Press, Oxford
- Gonzalez et al. (2017) Gonzalez A. G., Wilkins D. R., Gallo L. C., 2017, MNRAS, 472, 2, 1932
- Goodman & Weare (2010) Goodman J., Weare J., 2010, Communications in Applied Mathematics and Computational Science, 5, 1, 65
- Greene & Ho (2006) Greene J. E., Ho L. C., 2006, ApJ, 641, 1, 117
- Grevesse & Sauval (1998) Grevesse N., Sauval A. J., 1998, Space Sci. Rev., 85, 161
- Haardt & Maraschi (1991) Haardt F., Maraschi L., 1991, ApJ, 380, L51
- Harrison et al. (2013) Harrison F. A., Craig W. W., Christensen F. E., et al., 2013, ApJ, 770, 103
- HI4PI Collaboration et al. (2016) HI4PI Collaboration, Ben Bekhti N., Flöer L., et al., 2016, A&A, 594, A116
- Hopkins & Elvis (2010) Hopkins P. F., Elvis M., 2010, MNRAS, 401, 7
- Ingram et al. (2019) Ingram A., Mastroserio G., Dauser T., Hovenkamp P., van der Klis M., García J. A., 2019, MNRAS, 488, 1, 324
- Jansen et al. (2001) Jansen F., Lumb D., Altieri B., et al., 2001, A&A, 365, L1
- Jiang et al. (2019) Jiang J., Fabian A. C., Dauser T., et al., 2019, MNRAS, 489, 3, 3436
- Jiang et al. (2018) Jiang J., Parker M. L., Fabian A. C., et al., 2018, MNRAS
- Kaastra et al. (2014) Kaastra J. S., Kriss G. A., Cappi M., et al., 2014, Science, 345, 6192, 64
- Kallman & Bautista (2001) Kallman T., Bautista M., 2001, ApJS, 133, 221
- Kallman et al. (2021) Kallman T., Bautista M., Deprince J., et al., 2021, ApJ, 908, 1, 94
- Kammoun et al. (2019) Kammoun E. S., Domček V., Svoboda J., Dovčiak M., Matt G., 2019, MNRAS, 485, 1, 239
- Kammoun et al. (2018) Kammoun E. S., Nardini E., Risaliti G., 2018, A&A, 614, A44
- Kamraj et al. (2018) Kamraj N., Harrison F. A., Baloković M., Lohfink A., Brightman M., 2018, ApJ, 866, 2, 124
- Kara et al. (2016) Kara E., Alston W. N., Fabian A. C., et al., 2016, MNRAS, 462, 1, 511
- King & Pringle (2006) King A. R., Pringle J. E., 2006, MNRAS, 373, L90
- Kormendy & Ho (2013) Kormendy J., Ho L. C., 2013, ARA&A, 51, 511
- Koss et al. (2017) Koss M., Trakhtenbrot B., Ricci C., et al., 2017, ApJ, 850, 1, 74
- Laha et al. (2014) Laha S., Guainazzi M., Dewangan G. C., Chakravorty S., Kembhavi A. K., 2014, MNRAS, 441, 3, 2613
- Lanz et al. (2019) Lanz L., Hickox R. C., Baloković M., et al., 2019, ApJ, 870, 1, 26
- Laor (1991) Laor A., 1991, ApJ, 376, 90
- Liedahl et al. (1995) Liedahl D. A., Osterheld A. L., Goldstein W. H., 1995, ApJ, 438, L115
- Lusso et al. (2010) Lusso E., Comastri A., Vignali C., et al., 2010, A&A, 512, A34
- MacLeod et al. (2015) MacLeod C. L., Morgan C. W., Mosquera A., et al., 2015, ApJ, 806, 2, 258
- Madsen et al. (2020) Madsen K. K., Grefenstette B. W., Pike S., et al., 2020, arXiv e-prints, arXiv:2005.00569
- Madsen et al. (2015) Madsen K. K., Harrison F. A., Markwardt C. B., et al., 2015, ApJS, 220, 8
- Magdziarz & Zdziarski (1995) Magdziarz P., Zdziarski A. A., 1995, MNRAS, 273, 837
- Makino & ASTRO-C Team (1987) Makino F., ASTRO-C Team, 1987, Astrophys. Lett., 25, 223
- Malizia et al. (2014) Malizia A., Molina M., Bassani L., et al., 2014, ApJ, 782, 2, L25
- Malkan et al. (1998) Malkan M. A., Gorjian V., Tam R., 1998, ApJS, 117, 1, 25
- Marchesi et al. (2017) Marchesi S., Tremblay L., Ajello M., et al., 2017, ApJ, 848, 1, 53
- Marinucci et al. (2014) Marinucci A., Matt G., Kara E., et al., 2014, MNRAS, 440, 2347
- Martocchia et al. (2000) Martocchia A., Karas V., Matt G., 2000, MNRAS, 312, 4, 817
- Matt et al. (2015) Matt G., Baloković M., Marinucci A., et al., 2015, MNRAS, 447, 4, 3029
- McHardy et al. (2006) McHardy I. M., Koerding E., Knigge C., Uttley P., Fender R. P., 2006, Nat, 444, 730
- Mehdipour et al. (2017) Mehdipour M., Kaastra J. S., Kriss G. A., et al., 2017, A&A, 607, A28
- Mewe et al. (1986) Mewe R., Lemen J. R., van den Oord G. H. J., 1986, A&AS, 65, 511
- Miniutti & Fabian (2004) Miniutti G., Fabian A. C., 2004, MNRAS, 349, 1435
- Miniutti et al. (2007) Miniutti G., Fabian A. C., Anabuki N., et al., 2007, PASJ, 59, 315
- Moderski et al. (1998) Moderski R., Sikora M., Lasota J.-P., 1998, MNRAS, 301, 142
- Nandra et al. (2007) Nandra K., O’Neill P. M., George I. M., Reeves J. N., 2007, MNRAS, 382, 194
- Nardini et al. (2015) Nardini E., Reeves J. N., Gofford J., et al., 2015, Science, 347, 860
- Oh et al. (2018) Oh K., Koss M., Markwardt C. B., et al., 2018, ApJS, 235, 1, 4
- Panagiotou & Walter (2019) Panagiotou C., Walter R., 2019, A&A, 626, A40
- Parker et al. (2014) Parker M. L., Wilkins D. R., Fabian A. C., et al., 2014, MNRAS, 443, 1723
- Peterson (2014) Peterson B. M., 2014, Space Sci. Rev., 183, 1-4, 253
- Petrucci et al. (2001) Petrucci P. O., Merloni A., Fabian A., Haardt F., Gallo E., 2001, MNRAS, 328, 501
- Ponti et al. (2012) Ponti G., Papadakis I., Bianchi S., et al., 2012, A&A, 542, A83
- Reeves et al. (2018) Reeves J. N., Braito V., Nardini E., Lobban A. P., Matzeu G. A., Costa M. T., 2018, ApJ, 854, L8
- Reis et al. (2014) Reis R. C., Reynolds M. T., Miller J. M., Walton D. J., 2014, Nat, 507, 207
- Reynolds (2020) Reynolds C. S., 2020, arXiv e-prints, arXiv:2011.08948
- Reynolds & Begelman (1997) Reynolds C. S., Begelman M. C., 1997, ApJ, 488, 109
- Reynolds et al. (2012) Reynolds C. S., Brenneman L. W., Lohfink A. M., et al., 2012, ApJ, 755, 88
- Reynolds et al. (2014) Reynolds M. T., Walton D. J., Miller J. M., Reis R. C., 2014, ApJ, 792, L19
- Ricci et al. (2018) Ricci C., Ho L. C., Fabian A. C., et al., 2018, MNRAS, 480, 2, 1819
- Ricci et al. (2017) Ricci C., Trakhtenbrot B., Koss M. J., et al., 2017, ApJS, 233, 2, 17
- Risaliti et al. (2005) Risaliti G., Bianchi S., Matt G., et al., 2005, ApJ, 630, L129
- Risaliti et al. (2013) Risaliti G., Harrison F. A., Madsen K. K., et al., 2013, Nat, 494, 449
- Risaliti et al. (2009a) Risaliti G., Miniutti G., Elvis M., et al., 2009a, ApJ, 696, 160
- Risaliti et al. (2009b) Risaliti G., Young M., Elvis M., 2009b, ApJ, 700, L6
- Rivers et al. (2015) Rivers E., Risaliti G., Walton D. J., et al., 2015, ApJ, 804, 107
- Sesana et al. (2014) Sesana A., Barausse E., Dotti M., Rossi E. M., 2014, ApJ, 794, 104
- Shakura & Sunyaev (1973) Shakura N. I., Sunyaev R. A., 1973, A&A, 24, 337
- Shemmer et al. (2008) Shemmer O., Brandt W. N., Netzer H., Maiolino R., Kaspi S., 2008, ApJ, 682, 1, 81
- Sikora et al. (2007) Sikora M., Stawarz Ł., Lasota J.-P., 2007, ApJ, 658, 2, 815
- Smith & Done (1996) Smith D. A., Done C., 1996, MNRAS, 280, 2, 355
- Strüder et al. (2001) Strüder L., Briel U., Dennerl K., et al., 2001, A&A, 365, L18
- Svoboda et al. (2012) Svoboda J., Dovčiak M., Goosmann R. W., et al., 2012, A&A, 545, A106
- Tanaka et al. (1994) Tanaka Y., Inoue H., Holt S. S., 1994, PASJ, 46, L37
- Taylor & Reynolds (2018) Taylor C., Reynolds C. S., 2018, ApJ, 855, 120
- Tombesi et al. (2012) Tombesi F., Cappi M., Reeves J. N., Braito V., 2012, MNRAS, 422, 1, L1
- Tomsick et al. (2018) Tomsick J. A., Parker M. L., García J. A., et al., 2018, ApJ, 855, 3
- Tortosa et al. (2018) Tortosa A., Bianchi S., Marinucci A., Matt G., Petrucci P. O., 2018, A&A, 614, A37
- Trakhtenbrot et al. (2017) Trakhtenbrot B., Ricci C., Koss M. J., et al., 2017, MNRAS, 470, 1, 800
- Tueller et al. (2008) Tueller J., Mushotzky R. F., Barthelmy S., et al., 2008, ApJ, 681, 1, 113
- Turner et al. (2001) Turner M. J. L., Abbey A., Arnaud M., et al., 2001, A&A, 365, L27
- Ursini et al. (2020) Ursini F., Dovčiak M., Zhang W., Matt G., Petrucci P. O., Done C., 2020, A&A, 644, A132
- Vasudevan & Fabian (2009) Vasudevan R. V., Fabian A. C., 2009, MNRAS, 392, 1124
- Vasudevan et al. (2016) Vasudevan R. V., Fabian A. C., Reynolds C. S., Aird J., Dauser T., Gallo L. C., 2016, MNRAS, 458, 2012
- Vaughan et al. (2003) Vaughan S., Fabian A. C., Nandra K., 2003, MNRAS, 339, 1237
- Verner et al. (1996) Verner D. A., Ferland G. J., Korista K. T., Yakovlev D. G., 1996, ApJ, 465, 487
- Vernet et al. (2011) Vernet J., Dekker H., D’Odorico S., et al., 2011, A&A, 536, A105
- Vignali et al. (1998) Vignali C., Comastri A., Stirpe G. M., et al., 1998, A&A, 333, 411
- Walton et al. (2020) Walton D. J., Alston W. N., Kosec P., et al., 2020, MNRAS, 499, 1, 1480
- Walton et al. (2018) Walton D. J., Brightman M., Risaliti G., et al., 2018, MNRAS, 473, 4377
- Walton et al. (2013) Walton D. J., Nardini E., Fabian A. C., Gallo L. C., Reis R. C., 2013, MNRAS, 428, 2901
- Walton et al. (2019) Walton D. J., Nardini E., Gallo L. C., et al., 2019, MNRAS, 484, 2544
- Walton et al. (2014) Walton D. J., Risaliti G., Harrison F. A., et al., 2014, ApJ, 788, 76
- Walton et al. (2016) Walton D. J., Tomsick J. A., Madsen K. K., et al., 2016, ApJ, 826, 87
- Weisskopf et al. (2002) Weisskopf M. C., Brinkman B., Canizares C., Garmire G., Murray S., Van Speybroeck L. P., 2002, PASP, 114, 1
- Wilkins & Fabian (2011) Wilkins D. R., Fabian A. C., 2011, MNRAS, 414, 1269
- Wilkins & Fabian (2012) Wilkins D. R., Fabian A. C., 2012, MNRAS, 424, 1284
- Wilms et al. (2000) Wilms J., Allen A., McCray R., 2000, ApJ, 542, 914
- Wilson & Colbert (1995) Wilson A. S., Colbert E. J. M., 1995, ApJ, 438, 62
- Winkler et al. (2003) Winkler C., Courvoisier T. J. L., Di Cocco G., et al., 2003, A&A, 411, L1
- Winter et al. (2008) Winter L. M., Mushotzky R. F., Tueller J., Markwardt C., 2008, ApJ, 674, 2, 686
- Zdziarski et al. (1996) Zdziarski A. A., Johnson W. N., Magdziarz P., 1996, MNRAS, 283, 193
- Zhang et al. (2019) Zhang W., Dovčiak M., Bursa M., 2019, ApJ, 875, 2, 148
- Zoghbi et al. (2012) Zoghbi A., Fabian A. C., Reynolds C. S., Cackett E. M., 2012, MNRAS, 422, 129
- Zycki et al. (1999) Zycki P. T., Done C., Smith D. A., 1999, MNRAS, 309, 561