Department of Biomedical Informatics, Harvard Medical School
Cancer Data Science Program, Dana-Farber Cancer Institute
Cancer Program, Broad Institute of Harvard and MIT
11email: richardchen@g.harvard.edu, faisalmahmood@bwh.harvard.edu
Whole Slide Images are 2D Point Clouds: Context-Aware Survival Prediction using Patch-based Graph Convolutional Networks
Abstract
Cancer prognostication is a challenging task in computational pathology that requires context-aware representations of histology features to adequately infer patient survival. Despite the advancements made in weakly-supervised deep learning, many approaches are not context-aware and are unable to model important morphological feature interactions between cell identities and tissue types that are prognostic for patient survival. In this work, we present Patch-GCN, a context-aware, spatially-resolved patch-based graph convolutional network that hierarchically aggregates instance-level histology features to model local- and global-level topological structures in the tumor microenvironment. We validate Patch-GCN with 4,370 gigapixel WSIs across five different cancer types from the Cancer Genome Atlas (TCGA), and demonstrate that Patch-GCN outperforms all prior weakly-supervised approaches by 3.58-9.46%. Our code and corresponding models are publicly available at https://github.com/mahmoodlab/Patch-GCN.
Keywords:
Computer Vision Computational Pathology Weakly-Supervised Learning Graph Convolutional Networks Interpretability1 Introduction
Weakly-supervised deep learning has made remarkable progress in computational pathology in using whole slide images (WSIs) for cancer diagnosis and prognosis [1, 2, 3, 4, 5, 6]. Due to the computational complexities in training with WSIs, many weakly-supervised methods have approached WSIs using multiple instance learning (MIL), in which: 1) small image patches from the WSI are extracted as independent instances, and then 2) pooled using a global aggregation operator over the bag of unordered instances. Despite not being context-aware and without needing detailed clinical annotation, many of these MIL-based approaches are able to still solve difficult tasks such as cancer grading and subtyping using only slide-level labels, as the distinction between morphological phenotypes such as tumor vs. non-tumor tissue may only depend on instance-level patch-based features [7, 8].

In contrast with cancer grading and subtyping, cancer prognostication is a challenging task that requires considering both instance- and global-level features in the tumor and surrounding tissues for assessing patient risk of mortality [9, 10]. In adapting the MIL framework to WSIs, many approaches follow the standard multiple instance (SMI) assumption for solving clinical tasks in computational pathology, e.g. - if a bag contains at least one positive instance, it is labeled positive, else negative [11]. This assumption holds when the clinical task is solving binary instance-level feature discrimination problems such as tumor vs. non-tumor tissue. However, in tasks such as survival outcome prediction in cancer pathology, MIL-based approaches are unable to capture important contextual and hierarchical information that have known prognostic significance in cancer survival [12, 13, 14, 15]. For example, though MIL would be able to learn instance-level features that discriminate image patches of lymphocytes and tumor cells, it is unable to distinguish whether those immune cells are tumor-infiltrating lymphocytes (TILs) or from an adjacent inflammatory response, which depends on the lymphocytes’ apposition to tumor cells or normal stroma respectively [10, 16, 17].
In this work, we propose a context-aware, spatially-resolved patch-based graph convolutional network (Patch-GCN) for survival prediction in patients with multiple WSIs (Fig. 1). One of the key contributions of our work is that we formulate WSIs as a graph-based data structure in the Euclidean space similar to a point cloud in which: 1) nodes correspond to histology image patches, and 2) edges are connected between adjacent image patches from the true spatial coordinates of the WSI. As a result, message passing in Patch-GCN generalizes the standard convolutional operator in CNNs, in which node features are hierarchically aggregated from local to global structures in the WSI. Compared to other weakly-supervised learning approaches such as MIL, Patch-GCN is context-aware and is able to build hierarchical representations of morphological image patch features in context with their surrounding environment. To robustly validate Patch-GCN, we quantitatively assessed our model on five different cancer datasets from The Cancer Genome Atlas (TCGA) in survival outcome prediction against several state-of-the-art methods in weakly-supervised learning for WSIs, and evaluated the interpretability of Patch-GCN through attention heatmaps in low and high risk patients (Fig. 2). Our code is made available at https://github.com/mahmoodlab/Patch-GCN.
2 Related Work
2.1 Survival Analysis in WSIs
In recent years, deep learning methods using CNNs and MIL-based approaches have been proposed for survival analysis in WSIs [18, 19, 20, 4, 21]. Due to the large image sizes of WSIs, many of these methods rely on selective sampling of small image ROIs for tractable training and inference, which are then used matched with patient-level outcome labels. Mobadersany et al. [19] proposed one of the first methods for end-to-end training with image ROIs using CNNs supervised with the Partial Cox Proportional Hazard loss. Zhu et al. [20] developed a two-step-based approach for WSI-level survival outcome prediction, in which patches are clustered using K-Means groups using K-Means clustering method then used as inputs into a CNN. Yao et al. [22] similarly proposed patch-based sampling K-Means clustering to identify morphological phenotypes in WSIs.
2.2 Graph-based Analysis in Computational Pathology
In addition to CNNs and MIL-based approaches, GCNs and other graph-based methods have received attention in computational pathology, solving problems such as cancer classification [23, 24, 11, 25, 26, 27, 28], cancer grading [29, 30, 31], and survival analysis [32, 33]. Many of these approaches, however, consider only cell identities as graph nodes, which ignores important prognostic tissue features such as stroma and are confined again to small image regions [12, 34, 29]. In survival analysis, Chen et al. [33] constructed a cell-based graph for small image ROIs followed by spectral convolutions. Alternatively, Li et al. [32] proposed sampling patches in a WSI as nodes, followed by constructing edges between patches via feature similarity on the embedding space and using spectral convolutions. However, we argue that in using this approach for graph construction, GCNs are unable to learn context-aware features as message passing as feature interactions between adjacent image patches are not modeled.
3 Method
3.1 WSI-Graph Construction
For a given sample, let patient , overall survival time and censorship status be a single triplet observation in a dataset . In addition, let be the set of all WSIs for , as there may exist multiple WSIs collected for a single patient. To construct graph for , we first perform automatic tissue segmentation for all by: 1) transforming a low-downsampled version of into HSV colorspace, and then 2) using Otsu’s Binarization on the saturation channel to separate H&E-stained tissue from the background. Then, non-overlapping instance-level image regions at magnification are patched and used as input for a truncated ResNet-50 model pretrained on ImageNet, which extracts a 1024-dimensional feature vector via spatial average pooling after the 3rd residual block and is then packed into a node feature matrix for total patches in . For each patch, we save (x,y)-coordinates from the tissue segmentation, from which we use to build an adjacency matrix for each via fast approximate k-NN that models a image receptive field in CNN convolutions. Finally, we build a subgraph , with the patient-level graph across all WSIs constructed as which we denote as a WSI-Graph.
In comparison to previous graph-based approaches that build neighborhoods using nearest neighbors in the embedding space, our approach is distinct in that graphs are constructed in the Euclidean space. As a result, WSI-Graphs are effectively 2D point clouds (e.g. nodes / points connected to other proximal points in a 2D planar grid), which allows us to leverage spatial convolutions that perform local neighborhood aggregation functions similar to CNNs. In comparison to CNNs, however, Path-GCN is able to tractably perform CNN-like convolution operations on thousands on extracted instance-level image features.
3.2 Patch-GCN Architecture
Message Passing: For a WSI-Graph with instances, we learn a differentiable function parameterized using a GCN that iteratively aggregates and combines node features in their spatial neighborhoods across different hidden layers via message passing. For instance, for the message passing of vertex (that has node feature ) with its neighboring vertices in hidden layer , we use the graph convolution layer that implement the following functions:
| (1) |
where is a message construction function that calculates a message between and its neighbor (with edge feature ), is a permutation invariant aggregation function that aggregates all messages passed to , and is an update function that updates the existing node feature at with the aggregated message . Note that the in Equation 2 use similar instance-level and bag-level functions in MIL [35], in which GCN layers can be considered as performing multiple MIL operations in local graph neighborhoods, with used as an additional differentiable function for propagating bag-level features across hidden layers in a neural network. In viewing neighborhood aggregation in GCNs has a formulation of MIL with structural neighborhood constraints, we adapt the message passing functions from DeepGCN [36] which implement as:
| (2) |
in which is the additively combines node and edge features followed by activation, is a Softmax Aggregation scheme similar to Ilse et al. [37] that computes an attention weight that weights how much should contribute to the aggregated message , and additive combines the current node feature and aggregated message followed by a multilayer perceptron. Additionally, is an indicator function when an edge feature exists, is a positive constant for numerical stability (set to ), and is a hyperparameter for the inverse temperature in Softmax (set to ). We argue that can be viewed as a formulation of attention pooling operation in Ilse et al. [37] with structural neighborhood constraints, in which attention pooling of instance-level features is performed in local graph neighborhoods instead of across the entire bag.
Learning Hierarchical Features: To learn global-level morphological features in WSIs, following [36], we make a residual mapping and stack multiple layers of where the output of additively combines with its input.
| (3) |
We implement the spatial neighborhood aggregation backbone of Patch-GCN using graph convolutional layers. As a result, each patch-based histology image feature aggregates features from other nodes in a 4-hop neighborhood, which results in an effective image receptive field size of for patches connected to its 8 nearest neighbors (Fig. 3, Supplementary Material). Furthermore, we also implement dense connections from the output of every GCN Layer to the last hidden layer of , so that the representation of each histology patch would be an amalgamation of its instance-level embedding and its learned surrounding context, written as .
Global Neighborhood Aggregation & Supervision: From the penultimate node feature matrix , following [37], we learn a global attention-based pooling layer that adaptively computes a weighted sum of all node features in the graph, which generalizes aggregation function in Equation 2 to function on all nodes in the graph, in which the node feature matrix for the last hidden layer is pooled to a WSI-level embedding , which is subsequently supervised using the cross entropy-based Cox proportional loss function following [38] for survival analysis.
Implementation Details: To train Patch-GCN, we used Adam optimization with a default learning rate of , weight decay of , using a ResNet-50 CNN backbone pretrained on ImageNet, and trained for 20 epochs. To train with large graphs, we used NVIDIA 2080 Ti GPUs with a batch size of 1 with 32 steps for gradient accumulation.
4 Experimental Setup
For this study, we used 4,370 diagnostic gigapixel WSIs across five different cancer types from The Cancer Genome Atlas: Bladder Urothelial Carcinoma (BLCA) , Breast Invasive Carcinoma (BRCA) , Glioblastoma & Lower Grade Glioma (GBMLGG) , Lung Adenocarcinoma (LUAD) , and Uterine Corpus Endometrial Carcinoma (UCEC) . Our selection criterion in choosing these cancer types for training and evaluation were defined by: 1) dataset size, and 2) balanced distribution of uncensored-to-censored patients. On average, each WSI contained approximately 13487 image patches at magnification, with some patients having graph sizes as large as instances.
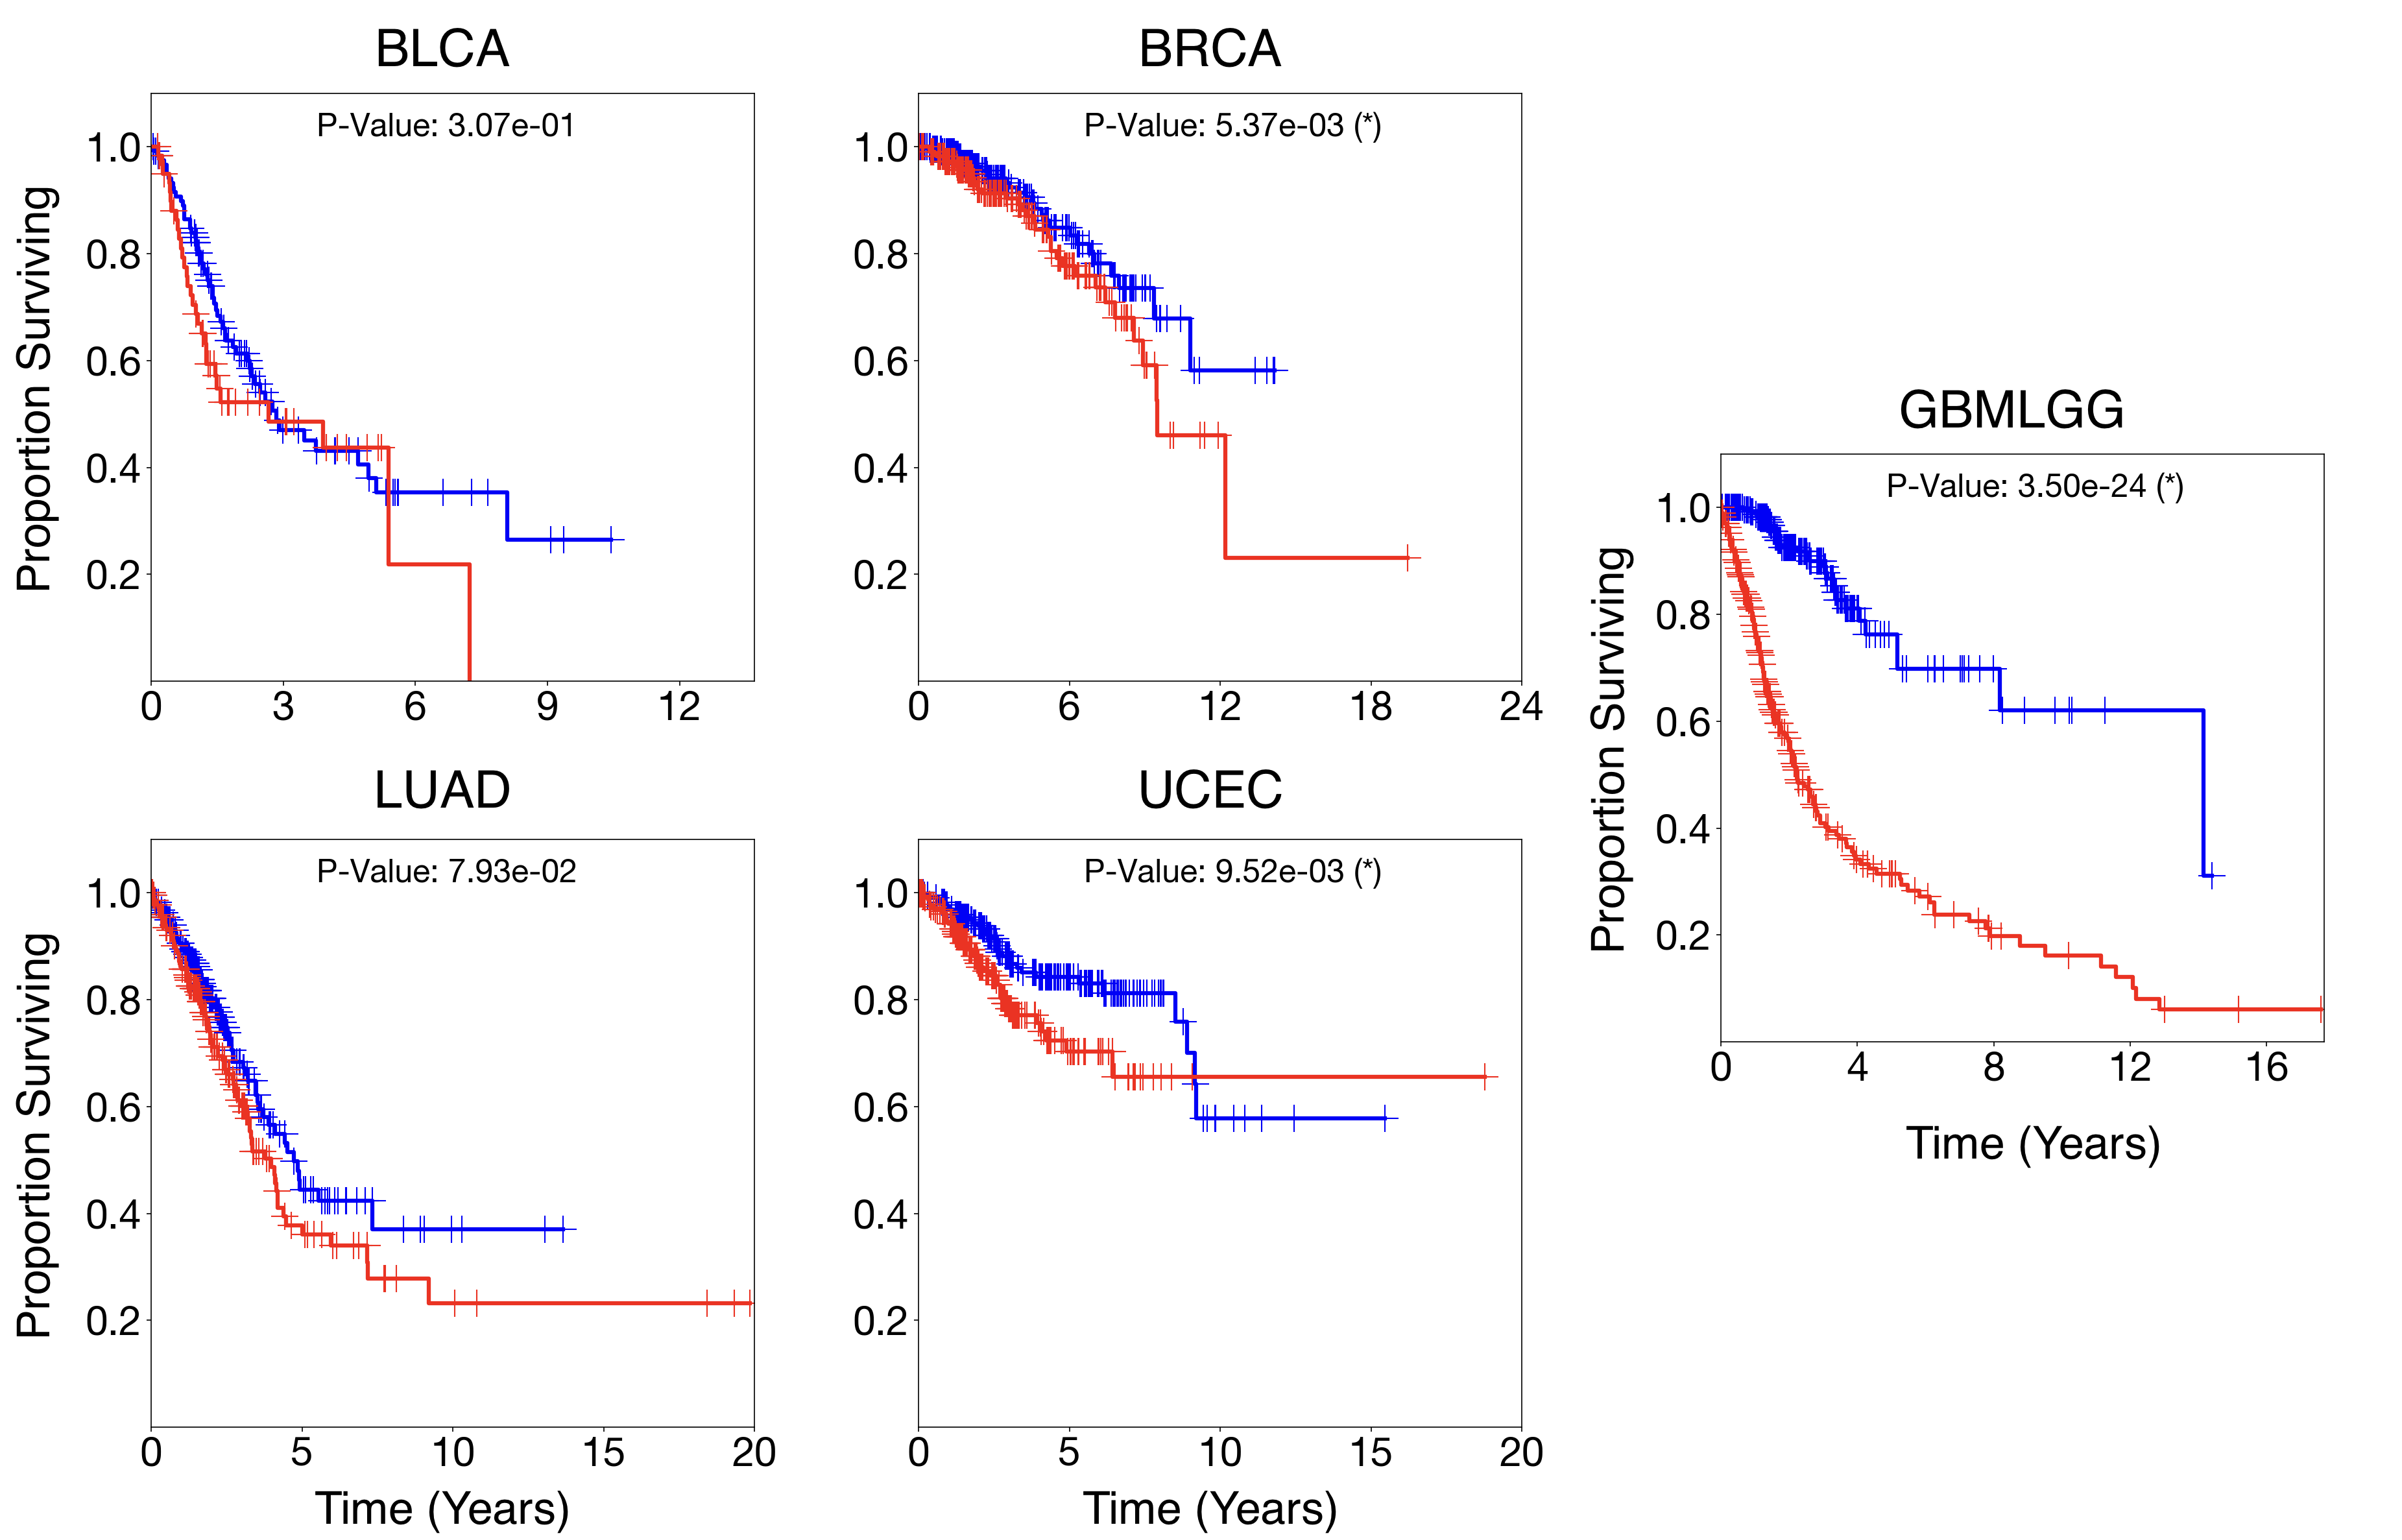
To evaluate Patch-GCN, we trained our proposed model using 5-fold cross-validation for each cancer type, in which each dataset was split into 5 80/20 partitions for training and validation. The cross-validated concordance index (c-Index) across the validation splits was used to measure the predictive performance in correctly ranking the survival times of each patient. As qualitative assessment, we used Kaplan-Meier curves to visualize the quality of patient stratification in stratifying low and high risk patients as two different survival distributions, as well as attention-based heatmaps using the weights computed by (Fig. 2, 4). In addition, we compared Patch-GCN against several other weakly-supervised deep learning approaches for processing in WSIs in computational pathology. As a fair comparison, we used the same survival loss function, ResNet-50 feature embeddings, and training hyperparameters in Patch-GCN.
5 Results & Discussion
5.1 Quantitative Results
In comparing our approach to other weakly-supervised learning methods for WSIs in computational pathology, Patch-GCN outperforms all prior approaches on 4 out of 5 cancer types in head-to-head comparisons, achieving an overall c-Index of 0.636 (Table 1). For cancer types such as GBMLGG which has known intertumoral and intratumoral heterogeneity, Patch-GCN achieves a c-Index of 0.824 using WSIs and shows patient stratification into distinct survival groups (Fig. 4, Supplementary Material), which empirically suggests that Patch-GCN is able to learn context-aware features via hierarchical feature aggregation in local spatial neighborhoods. In comparing Patch-GCN to permutation-invariant / MIL-based approaches, we observe that Patch-GCN improves over all methods on all 5 cancer types (9.46% performance increase over DeepAttnMISL and 3.58% performance increase over Attention MIL), which further suggests that context matters in survival outcome prediction in WSIs. In comparison to DeepGraphConv which samples random patch features from WSIs as nodes and connects these nodes on the embedding space, Patch-GCN improves on all cancer types except UCEC (2.58% performance increase), which suggests the importance of building graphs via adjacent patches rather than feature similarity in the embedding space. Though DeepGraphConv has higher c-Index on UCEC, we note that in comparison to other cancer types, cancer prognosis in UCEC correlates with global-level morphological determinants such as tumor size and depth of tumor invasion in the myometrium, rather than cell-to-cell mediated interactions between tumor cells and other cell types. BLCA is a similar cancer type to UCEC that also depends on the depth of invasion into the bladder wall, but because the bladder wall is thinner than the myometrium, the invasion may be adequately captured via a limited receptive field, hence better Patch-GCN performance on that cancer type.
| Models | BLCA | BRCA | GBMLGG |
|---|---|---|---|
| MIL (Deep Sets) [35] | 0.500 0.000 | 0.500 0.000 | 0.498 0.014 |
| Attention MIL [37] | 0.536 0.038 | 0.564 0.050 | 0.787 0.028 |
| DeepAttnMISL [22] | 0.504 0.042 | 0.524 0.043 | 0.734 0.029 |
| DeepGraphConv [32] | 0.499 0.057 | 0.574 0.044 | 0.816 0.025 |
| Patch-GCN (Ours) | 0.560 0.034 | 0.580 0.025 | 0.824 0.024 |
| LUAD | UCEC | Overall | |
| MIL (Deep Sets) [35] | 0.496 0.008 | 0.500 0.000 | 0.499 |
| Attention MIL [37] | 0.559 0.060 | 0.625 0.057 | 0.614 |
| DeepAttnMISL [22] | 0.548 0.050 | 0.597 0.059 | 0.581 |
| DeepGraphConv [32] | 0.552 0.058 | 0.659 0.056 | 0.620 |
| Patch-GCN (Ours) | 0.585 0.012 | 0.629 0.052 | 0.636 |
5.2 Attention Visualization
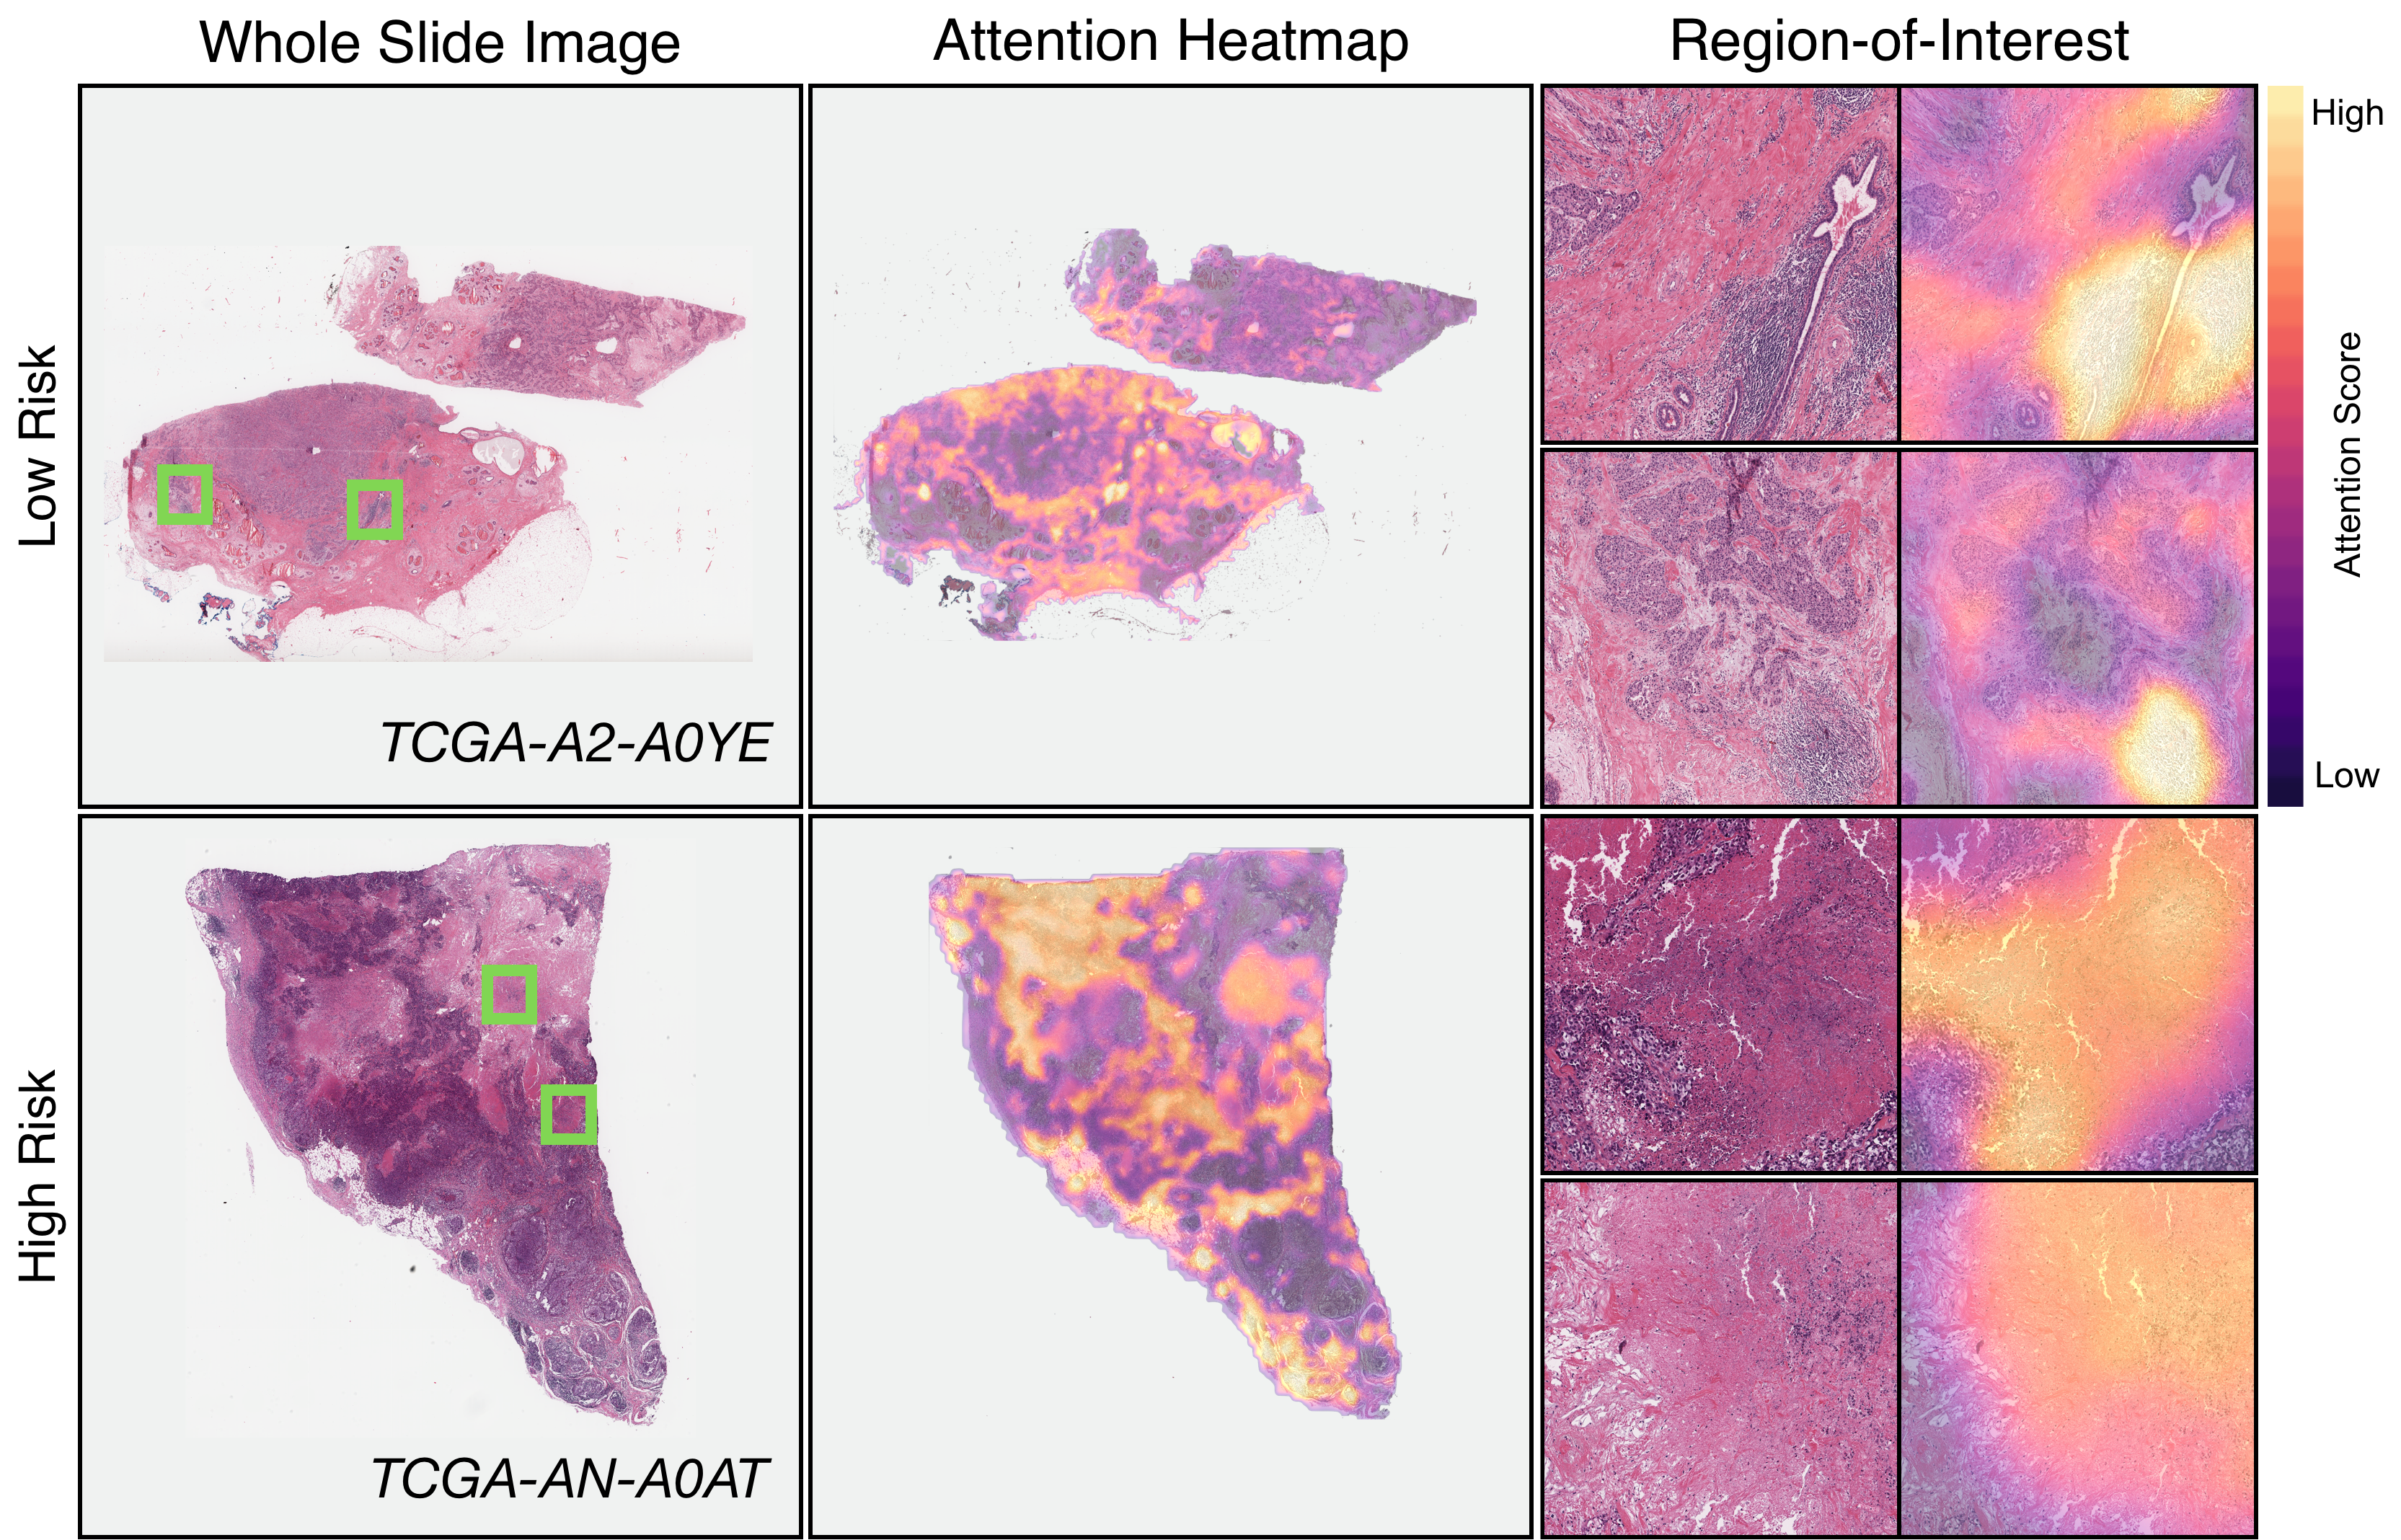
To understand how Patch-GCN uses morphological features to predict risk, we visualized heatmaps using the attention weights from the attention pooling layer and utilized two trained pathologists to assess high-attention image regions. Across all cancers, we observed that in high risk patients, the network assigned high attention to necrosis, dense tumor aggregates, and regions of desmoplastic stroma containing tumor infiltrates, which are indicative of tumor invasion and proliferation (Fig. 2). In low risk patients, we observe that lymphocyte aggregates and normal stroma were frequently assigned high attention, which corroborates with the prognostic significance of stroma [12]. Fig. 2 shows exemplar low and high risk cases in BRCA, with lymphocytes adjacent to tumor cells and infiltrating normal stroma given high attention in low risk patients, while necrosis and desmoplastic stroma were given high attention in high risk patients.
5.3 Conclusion
Despite the progress made in weakly-supervised deep learning in computational pathology, many current approaches are not context-aware in modeling important local- and global-level morphological features in the tumor microenvironment. In this work, we present Patch-GCN, a context-aware, attention-based graph convolutional network for survival analysis using WSIs. In comparing Patch-GCN to permutation-invariant network architectures that learn only instance-level morphological features, we observe that Patch-GCN outperforms all prior approaches on 5 cancer types in the TCGA. Moreover, we demonstrate the improvement in connecting nodes via adjacent image patches, which allows node aggregation in GCNs to learn such coarse-grained to fine-grained topological structures in the tumor microenivronment. Our approach is adaptable to any weakly-supervised learning task in computational pathology that uses slide-level or patient-level labels, and contributes towards a more holistic view of representation learning in the tumor microenvironment.
6 Acknowledgements
Funding: This work was supported in part by internal funds from BWH Pathology, Google Cloud Research Grant, Nvidia GPU Grant Program, and NIGMS R35GM138216 (F.M.). R.J.C. was additionally supported by the NSF Graduate Fellowship. The content is solely the responsibility of the authors and does not reflect the official views of the National Institutes of Health, National Institute of General Medical Sciences or the National Science Foundation.
References
- [1] Yu, K.H., Zhang, C., Berry, G.J., Altman, R.B., Ré, C., Rubin, D.L., Snyder, M.: Predicting non-small cell lung cancer prognosis by fully automated microscopic pathology image features. Nature Communications 7(1), 1–10 (2016)
- [2] Campanella, G., Hanna, M.G., Geneslaw, L., Miraflor, A., Silva, V.W.K., Busam, K.J., Brogi, E., Reuter, V.E., Klimstra, D.S., Fuchs, T.J.: Clinical-grade computational pathology using weakly supervised deep learning on whole slide images. Nature Medicine 25(8), 1301–1309 (2019)
- [3] Courtiol, P., Maussion, C., Moarii, M., Pronier, E., Pilcer, S., Sefta, M., Manceron, P., Toldo, S., Zaslavskiy, M., Le Stang, N., et al.: Deep learning-based classification of mesothelioma improves prediction of patient outcome. Nature medicine 25(10), 1519–1525 (2019)
- [4] Wulczyn, E., Steiner, D.F., Moran, M., Plass, M., Reihs, R., Tan, F., Flament-Auvigne, I., Brown, T., Regitnig, P., Chen, P.H.C., et al.: Interpretable survival prediction for colorectal cancer using deep learning. NPJ digital medicine (2021)
- [5] Lu, M.Y., Williamson, D.F., Chen, T.Y., Chen, R.J., Barbieri, M., Mahmood, F.: Data efficient and weakly supervised computational pathology on whole slide images. Nature Biomedical Engineering (2020)
- [6] Lu, M.Y., Chen, T.Y., Williamson, D.F., Zhao, M., Shady, M., Lipkova, J., Mahmood, F.: Ai-based pathology predicts origins for cancers of unknown primary. Nature 594(7861), 106–110 (2021)
- [7] Bandi, P., Geessink, O., Manson, Q., Van Dijk, M., Balkenhol, M., Hermsen, M., Bejnordi, B.E., Lee, B., Paeng, K., Zhong, A., et al.: From detection of individual metastases to classification of lymph node status at the patient level: the camelyon17 challenge. IEEE transactions on medical imaging 38(2), 550–560 (2018)
- [8] Lu, M.Y., Chen, R.J., Wang, J., Dillon, D., Mahmood, F.: Semi-supervised histology classification using deep multiple instance learning and contrastive predictive coding. Advances in Neural Information Processing Systems (NeurIPS) Workshop in Machine Learning for Health (2019)
- [9] Balkwill, F.R., Capasso, M., Hagemann, T.: The tumor microenvironment at a glance (2012)
- [10] Saltz, J., Gupta, R., Hou, L., Kurc, T., Singh, P., Nguyen, V., Samaras, D., Shroyer, K.R., Zhao, T., Batiste, R., et al.: Spatial organization and molecular correlation of tumor-infiltrating lymphocytes using deep learning on pathology images. Cell reports 23(1), 181–193 (2018)
- [11] Zhao, Y., Yang, F., Fang, Y., Liu, H., Zhou, N., Zhang, J., Sun, J., Yang, S., Menze, B., Fan, X., et al.: Predicting lymph node metastasis using histopathological images based on multiple instance learning with deep graph convolution. In: Proceedings of the IEEE/CVF Conference on Computer Vision and Pattern Recognition (CVPR). pp. 4837–4846 (2020)
- [12] Beck, A.H., Sangoi, A.R., Leung, S., Marinelli, R.J., Nielsen, T.O., Van De Vijver, M.J., West, R.B., Van De Rijn, M., Koller, D.: Systematic analysis of breast cancer morphology uncovers stromal features associated with survival. Science Translational Medicine 3(108), 108ra113–108ra113 (2011)
- [13] Abdul Jabbar, K., Raza, S.E.A., Rosenthal, R., Jamal-Hanjani, M., Veeriah, S., Akarca, A., Lund, T., Moore, D.A., Salgado, R., Al Bakir, M., et al.: Geospatial immune variability illuminates differential evolution of lung adenocarcinoma. Nature Medicine pp. 1–9 (2020)
- [14] Diao, J.A., Wang, J.K., Chui, W.F., Mountain, V., Gullapally, S.C., Srinivasan, R., Mitchell, R.N., Glass, B., Hoffman, S., Rao, S.K., et al.: Human-interpretable image features derived from densely mapped cancer pathology slides predict diverse molecular phenotypes. Nature communications 12(1), 1–15 (2021)
- [15] Jaume, G., Pati, P., Bozorgtabar, B., Foncubierta, A., Anniciello, A.M., Feroce, F., Rau, T., Thiran, J.P., Gabrani, M., Goksel, O.: Quantifying explainers of graph neural networks in computational pathology. In: Proceedings of the IEEE/CVF Conference on Computer Vision and Pattern Recognition. pp. 8106–8116 (2021)
- [16] Shaban, M., Khurram, S.A., Fraz, M.M., Alsubaie, N., Masood, I., Mushtaq, S., Hassan, M., Loya, A., Rajpoot, N.M.: A novel digital score for abundance of tumour infiltrating lymphocytes predicts disease free survival in oral squamous cell carcinoma. Scientific Reports 9(1), 1–13 (2019)
- [17] Shaban, M., Raza, S.E.A., Hassan, M., Jamshed, A., Mushtaq, S., Loya, A., Batis, N., Brooks, J., Nankivell, P., Sharma, N., et al.: A digital score of tumour-associated stroma infiltrating lymphocytes predicts survival in head and neck squamous cell carcinoma. arXiv preprint arXiv:2104.12862 (2021)
- [18] Lu, C., Romo-Bucheli, D., Wang, X., Janowczyk, A., Ganesan, S., Gilmore, H., Rimm, D., Madabhushi, A.: Nuclear shape and orientation features from h&e images predict survival in early-stage estrogen receptor-positive breast cancers. Laboratory investigation 98(11), 1438–1448 (2018)
- [19] Mobadersany, P., Yousefi, S., Amgad, M., Gutman, D.A., Barnholtz-Sloan, J.S., Vega, J.E.V., Brat, D.J., Cooper, L.A.: Predicting cancer outcomes from histology and genomics using convolutional networks. Proceedings of the National Academy of Sciences 115(13), E2970–E2979 (2018)
- [20] Zhu, X., Yao, J., Zhu, F., Huang, J.: Wsisa: Making survival prediction from whole slide histopathological images. In: Proceedings of the IEEE/CVF Conference on Computer Vision and Pattern Recognition (CVPR). pp. 7234–7242 (2017)
- [21] Lu, M.Y., Kong, D., Lipkova, J., Chen, R.J., Singh, R., Williamson, D.F., Chen, T.Y., Mahmood, F.: Federated learning for computational pathology on gigapixel whole slide images. arXiv preprint arXiv:2009.10190 (2020)
- [22] Yao, J., Zhu, X., Jonnagaddala, J., Hawkins, N., Huang, J.: Whole slide images based cancer survival prediction using attention guided deep multiple instance learning networks. Medical Image Analysis 65, 101789 (2020)
- [23] Ali, S., Veltri, R., Epstein, J.A., Christudass, C., Madabhushi, A.: Cell cluster graph for prediction of biochemical recurrence in prostate cancer patients from tissue microarrays. In: Medical Imaging 2013: Digital Pathology. vol. 8676, p. 86760H. International Society for Optics and Photonics (2013)
- [24] Anand, D., Gadiya, S., Sethi, A.: Histographs: graphs in histopathology. In: Medical Imaging 2020: Digital Pathology. vol. 11320, p. 113200O. International Society for Optics and Photonics (2020)
- [25] Raju, A., Yao, J., Haq, M.M., Jonnagaddala, J., Huang, J.: Graph attention multi-instance learning for accurate colorectal cancer staging. In: International Conference on Medical Image Computing and Computer-Assisted Intervention. pp. 529–539. Springer (2020)
- [26] Ding, K., Liu, Q., Lee, E., Zhou, M., Lu, A., Zhang, S.: Feature-enhanced graph networks for genetic mutational prediction using histopathological images in colon cancer. In: International Conference on Medical Image Computing and Computer-Assisted Intervention. pp. 294–304. Springer (2020)
- [27] Pati, P., Jaume, G., Foncubierta, A., Feroce, F., Anniciello, A.M., Scognamiglio, G., Brancati, N., Fiche, M., Dubruc, E., Riccio, D., et al.: Hierarchical cell-to-tissue graph representations for breast cancer subtyping in digital pathology. arXiv e-prints pp. arXiv–2102 (2021)
- [28] Lu, W., Graham, S., Bilal, M., Rajpoot, N., Minhas, F.: Capturing cellular topology in multi-gigapixel pathology images. In: Proceedings of the IEEE/CVF Conference on Computer Vision and Pattern Recognition Workshops (2020)
- [29] Zhou, Y., Graham, S., Alemi Koohbanani, N., Shaban, M., Heng, P.A., Rajpoot, N.: Cgc-net: Cell graph convolutional network for grading of colorectal cancer histology images. In: Proceedings of the IEEE/CVF International Conference on Computer Vision Workshops. pp. 0–0 (2019)
- [30] Wang, J., Chen, R.J., Lu, M.Y., Baras, A., Mahmood, F.: Weakly supervised prostate tma classification via graph convolutional networks. In: 2020 IEEE 17th International Symposium on Biomedical Imaging (ISBI). pp. 239–243. IEEE (2020)
- [31] Javed, S., Mahmood, A., Werghi, N., Benes, K., Rajpoot, N.: Multiplex cellular communities in multi-gigapixel colorectal cancer histology images for tissue phenotyping. IEEE Transactions on Image Processing 29, 9204–9219 (2020)
- [32] Li, R., Yao, J., Zhu, X., Li, Y., Huang, J.: Graph cnn for survival analysis on whole slide pathological images. In: International Conference on Medical Image Computing and Computer-Assisted Intervention. pp. 174–182. Springer (2018)
- [33] Chen, R.J., Lu, M.Y., Wang, J., Williamson, D.F., Rodig, S.J., Lindeman, N.I., Mahmood, F.: Pathomic fusion: an integrated framework for fusing histopathology and genomic features for cancer diagnosis and prognosis. IEEE Transactions on Medical Imaging (2020)
- [34] Mahmood, F., Borders, D., Chen, R.J., Mckay, G.N., Salimian, K.J., Baras, A., Durr, N.J.: Deep adversarial training for multi-organ nuclei segmentation in histopathology images. IEEE Transactions on Medical Imaging 39(11) (Nov 2020)
- [35] Zaheer, M., Kottur, S., Ravanbakhsh, S., Poczos, B., Salakhutdinov, R., Smola, A.: Deep sets. Advances in Neural Information Processing Systems (NeurIPS) (2017)
- [36] Li, G., Muller, M., Thabet, A., Ghanem, B.: Deepgcns: Can gcns go as deep as cnns? In: Proceedings of the IEEE/CVF International Conference on Computer Vision (ICCV). pp. 9267–9276 (2019)
- [37] Ilse, M., Tomczak, J., Welling, M.: Attention-based deep multiple instance learning. In: Proceedings of the 35th International Conference on Machine Learning (ICML). pp. 2132–2141 (2018)
- [38] Zadeh, S.G., Schmid, M.: Bias in cross-entropy-based training of deep survival networks. IEEE Transactions on Pattern Analysis and Machine Intelligence (2020)
Appendix