∎
e1till.kahlke@uol.de \thankstexte2martin.fraenzle@informatik.uni-oldenburg.de \thankstexte3a.hartmann@uni-oldenburg.de
We study numerically the maximum -matching problems on ensembles of bipartite random graphs. The -matching problems describes the matching between two types of nodes, users and servers, where each server may serve up to users at the same time. By using a mapping to standard maximum-cardinality matching, and because for the latter there exists a polynomial-time exact algorithm, we can study large system sizes of up to nodes. We measure the capacity and the energy of the resulting optimum matchings. First, we confirm previous analytical results for bipartite regular graphs. Next, we study the finite-size behaviour of the matching capacity and find the same scaling behaviour as before for standard matching, which indicates the universality of the problem. Finally, we investigate for bipartite Erdős-Rényi random graphs the saturability as a function of the average degree, i.e., whether the network allows as many customers as possible to be served, i.e. exploiting the servers in an optimal way. We find phase transitions between unsaturable and saturable phases. These coincide with a strong change of the running time of the exact matching algorithm, as well with the point where a minimum-degree heuristic algorithm starts to fail.
Phase transition in the bipartite -matching
1 Introduction
Phase transitions in combinatorial optimisation or in constraint-satisfaction problems martin2001 ; phase-transitions2005 ; moore2011 ; mezard2009 have been an active area of research at the interface of statistical mechanics and computer science since more than two decades. Usually, non-deterministically polynomial (NP) complete garey1979 or NP-hard problems are studied, i.e., problems for which so far no algorithm is known which runs in the worst case in polynomial time as a function of the system size. Thus, so far only worst-case exponential-time algorithms are available, i.e., the problems are hard. One the other hand, problems running in polynomial (P) time are often termed easy. But since it is not known, i.e., proven, whether P forms a proper subclass of NP, or whether maybe P=NP, one has been interested since almost the beginning of computer science in finding out what makes a problem hard. Among many other approaches, also numerical experiments and statistical-mechanics calculations have been performed. For this purpose, ensembles of random problems have been considered, which are hard in the worst case but for some regions in parameter space typically require only a polynomial running time, meaning they are typically easy there. Here in particular phase transitions monasson1999 ; martin2001 , e.g., with respect to the solvability have been observed when varying suitable ensemble parameters. These phase transitions often coincide with changes of the typical complexity from easy to hard. Thus, the structure of problems from such ensembles, in particular near phase transitions, may teach us about the source of computational hardness. Such phase transitions have been studied, e.g., for constraint satisfaction problems like satisfiability (SAT) kirkpatrick1994 ; cocco2001 or colouring mulet2002 . Also optimisation problems like the travelling salesperson mezard1986 ; gent1996tsp ; tsp_lp2016 ; tsp_rsb2019 , vertex cover cover2000 ; cover-tcs2001 ; cover-time2001 ; cover-long2001 or number partitioning mertens1998 ; mertens2006 have been investigated. Beyond delivering insight into the structure of problems, this reserach performed at the interface of physics and computer science has also led to algorithmic advances like the development of efficient message-passing algorithms as Belief Propagation or Survey Propagation mezard2002 .
Nevertheless, not only hard optimisation or constraint-satisfaction problems may exhibit changes of problem space structure and corresponding changes of the computational complexity. Also ensembles of polynomially-solvable problems like shortest paths, maximum flows or graph matching may be of interest and show corresponding phase transitions. Usually, in physics such algorithms are used to investigate models like random magnets opt-phys2001 ; opt-phys2004 . Here, we want to perform a fundamental study of such a phase transitions for a generalisation of the graph matching problem. As we will see here, we observe changes of the algorithmic behaviour related to this phase transition. This shows that such a coincidence of the change of a suitably defined solvability and of algorithmic complexity exists also for a polynomially-solvable problem and can therefore easier be studied numerically.
For a given graph, the maximum-cardinality matching problem, also just called matching, considers subsets of edges, such that each node is incident to at most one edge in the subset and such that the cardinality of matching is maximum. This problem is widely studied in computer science usually from the algorithmic point of view jungnickel2010 with the aim to find efficient algorithms. But also in the field of statistical mechanics it has already played its role, as it was among the first optimisation problems studied, and therefore it has inspired the field a lot. First, the model was solved analytically using a replica-symmetric approach mezard1985 ; parisi2002 on bipartite random graphs with random edge weights, i.e., for the maximum-weight matching instead of the maximum-cardinality matching. This suitability of a replica-symmetric calculation means that the thermodynamic behaviour of matching for this ensemble is not very complex, similar to a ferromagnet. Later, the solution was extended to arbitrary graphs and the finite-size behaviour of the matching capacity, i.e., the sum of the weights of the edges in the matching, was obtained mezard1987matching . Also studied were Euclidean variants mezard1988 ; houdayer1998 ; caracciolo2014 . The case where more than two nodes are connected per matching element was also considered with a statistical mechanics approach martin2005 . Furthermore, so called dimer coverings, i.e., perfect matchings involving all nodes, on -dimensional lattices without edge weights were studied kenyon2009 . Since no energy is involved, the number of matchings, i.e., the entropy, was mainly studied kasteleyn1961 ; fisher1961 ; tempereley1961 . Such studies of entropies of dimer coverings were extended also to include energy for the edges fisher1966 , or to mixtures of dimers and single atoms heilmann1972 . Also, entropies of the matchings karp1981 or dimer coverings zdeborova2006 were considered for various more general random graph structures.
In this work, we study a phase transition of the satisfiable-unsatisfiable type for the -matching problem, which is a generalisation of the standard matching. The model describes a set of users and a set of servers, possible user-server connections are described by a bipartite graph. Each user shall be served by one server, while each server may serve up to users at the same time. The system is characterised by its capacity, i.e., the number of users which can be served simultaneously . An example for the application of -matching are wireless communication networks gu2015 ; han2017 . Our study is motivated by a previous work of Kreačıć and Bianconi Kreacic_2019 , who have studied, to our knowledge for the first time in statistical mechanics, the -matching problem analytically with the approximate cavity approach and numerically with a message-passing algorithm. They have obtained the capacity of the system for two ensembles, namely for fixed degree and Poissonian bipartite graphs. They showed that for both cases, parameter combinations exists, where the capacity converges to its maximum possible value, i.e., a saturable phase, when increasing the average node degree.
Here, we expand on this work by using an exact numerical matching algorithm. Since this algorithm allows for calculating exact optimum matchings in polynomial time, we are able to solve exactly very large graphs of up to users. To start, we confirm with our exact numerical approach the previously obtained analytical results from Ref. Kreacic_2019 . Also, we find the same finite-size scaling behaviour of the capacity as for standard matching mezard1987matching . In the main part of our work, for the case of the Poissonian random graphs with average user degree , we investigate the model with respect to the phase transition between saturability and unsaturability for some typical parameter combinations of and the ratio . We determine with high precision the phase-transition point using finite-size scaling techniques. In addition, we obtain the critical exponent characterising the phase transition. By analysing the run-time of the exact algorithm and furthermore studying an approximation algorithm, we are able to show that the phase transition coincides with remarkable changes of the algorithmic performance.
The remainder of the paper is organised as follows: Next, we define the -matching problem and the measurable quantities we have evaluated, together with the ensemble of random graphs we have studied. In the third section, we present the methods we have applied. In the main section, we present our results and finally, we summarise our work and outline further research directions.
2 Model
2.1 -matching
We consider bipartite graphs with vertices consisting of users and servers. We denote the ratio of number of users and servers by
| (1) |
Since the graph is bipartite, each edge connects a user and a server. This means that the average degree of the users and the average degree of the severs are related by
| (2) |
When inserting Equation 1, it follows that .
A -matching is a subset of in with each user is adjacent to at most one server and each server is adjacent to at most users. For each edge in we say that the adjacent user and server are matched. Thus, one server can be matched to at most users. The capacity of the matching is defined as the number of edges in the matching, i.e., its cardinality. In accordance with previous work Kreacic_2019 , the energy is defined as
| (3) |
Hence, is equal to the number of unmatched users plus the number of users that all servers can still host. A low value of the energy means that the given resources are well used, such that many, or all users are served and at the same time not too many, possibly no, servers exhibit unused serving capacities.
For the maximum -matching problem one wants find a -matching which maximises the capacity . This will usually depend on the edges in the graph. For any graph, the capacity is bounded by a theoretical capacity which is obtained, when all users are matched to servers or when all servers are matched to users. This leads to the maximum theoretical capacity
| (4) |
Note that does not at all depend on the edges, i.e., the actual topology of the graphs. But it depends on the given graph whether this maximum can actually be reached. Naturally, the more edges exist, the more likely it is that a given graph reaches . For numerical reasons, we do not require that is 100% reached. Instead, we call a graph saturated if the actual capacity reaches with being a suitable threshold. Correspondingly, when studying an ensemble of random graphs, the saturation probability is defined as
| (5) |
We use as an order parameter. If is close to zero, few graphs reach the capacity . We call this the unsaturated phase. But if is close to one, almost all graphs have a high capacity. This describes the saturated phase. As our results will show below, we are indeed able to observe phase transitions between these two phases.
In principle one could use , but for large random graphs, for most ensembles, it can be anticipated that it is exponentially unlikely that all demands can be matched exactly to all resources. We confirmed this in our numerical experiments. Thus, we used a value of close to 1, i.e., , hence we call a network saturated if there is an almost complete balance between demand and resources. We also verified by tests that our results did not change significantly when we used other values like or .
Note that the variance of is given simply by . We used it to calculate our error bars and to obtain more conventiently the positions of the phase transitions, see subsection 4.3.
2.2 Random graphs
We consider the same two different networks ensembles as previously studied Kreacic_2019 . The first networks ensemble consist of ()-regular graphs were all users have the same fixed integer degree and all servers have integer degree , satisfying Equation 2. To generate such random graphs for the numerical studies, the configuration model Bollobas_1980 ; Newman_2001 can be used. In our case for ()-regular graphs we did the following: stubs are assigned to each user and stubs to each server. Then iteratively one stub from a user and one stub from a server are drawn randomly (with uniform distribution from the list of free stubs), respectively. If there is so far no edge between the two nodes where the stubs belong to, the edge connecting them is created and the used stubs get removed. If this edge already exists, two new stubs are drawn. This procedure is repeated until no stub is left. According to Klein-Hennig_2012 , redrawing two stubs if the edge already exists create a bias in the generation of the random graphs. This bias can be removed, after the initial graph construction has finished, by repeatedly swapping the edges of the generated graph Viger_2005 . For a swap, two edges are chosen randomly. Then the users, but not the servers to with the edges are connected are swapped. Repeating this ‘shuffle‘ enough times will lead to unbiased graphs. We tested the influences of edge swaps and in our case, they had no measurable effect on the final data. This might be because we consider bipartite graphs. Thus, to save computation time, we did not perform such swaps.
The second network ensemble we considered, which is in the center of our study, consist of bipartite Erdős-Rényi graphs Edroes_1959 . This means, each possible edge between a user and a server is drawn with a probability , with for any desired average number of neigbouring servers for the users. Thus, the degree distributions of users and servers are Poissonian, respectively.
3 Methods
To solve the maximum -matching problem, which we call also just -matching in the following, numerically on a given graph, we map the problem to the original 1-to-1-matching problem on bipartite graphs. To achieve this, each server node is cloned times. This means that new nodes will be inserted in the graph for every server node. Then, for each user in the neighbourhood of the server, an edge to each of the new nodes is created. Thus, in the graph with cloned nodes, each clone has the same neighbours as the original server node. Next, a matching is calculated for the graph with the cloned nodes. Here each node is matched at most once. This means, with respect to the original graph, each user node will be matched at most once and each server node will be matched at most times. Therefore, a standard 1-to-1-matching on the graph with cloned nodes corresponds to a -matching on the original graph. This procedure is shown in Figure 1.

4 Results
We have performed simulations practical_guide2015 by using exact numerical matching calculations for the two graph ensembles, for various values of the parameters, for various graph sizes of up to user nodes and up to server nodes. We performed for all results an average over up to several thousands of different graph realisations. Details are stated below. We first compare our numerical results with the previously obtained analytical results Kreacic_2019 . Next, we investigate the finite-size scaling behaviour of the capacity and compare with scaling form previously found mezard1987matching for standard matchings. In the main part, we show the results concerning the saturable-unsaturable phase transition and compare with the algorithmic behavior.
4.1 Comparison with previous results
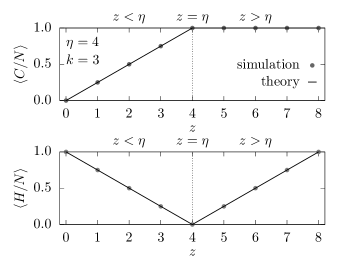
We studied the ()-regular graphs, i.e, for integer values of . We considered a rather large graph size and , thus . We have considered , thus . In Figure 2 the average capacity per user node and the average energy per user node are shown as a function of . The results are averaged over 100 realisations for each value of . But due to the simple structure of the graphs, although being random, there are no statistical fluctuation on the results.
One can observe three cases, dependent on the value of :
-
•
For , or equivalently , the capacity is always and the energy is . All servers are matched to users, but there are more users than all servers together can handle.
-
•
At , i.e., , the capacity is and the energy is . This is an optimal situation since all users are matched to servers and no server has unused resources.
-
•
For , i.e., , the capacity is and the energy is . All users are matched, but there are more servers than needed.
Thus, in all networks, the full capacity is reached, but there is only one point of optimal balance between user demands and provided resources, where the energy is zero. It is interesting, that such a point of balance is possible. Note that here with , the graphs exhibit a rather large number of edges much larger than the number of edges in the matching. On the other hand for the smallest meaningful degree , at all users will be connected to exactly one server, and, because of , each server will be connected to distinct nodes. Thus, trivally the full edge set is a -matching and again all user demands are satisfied. Anyway, these results confirm those recently obtained analytically Kreacic_2019 for this network ensemble.
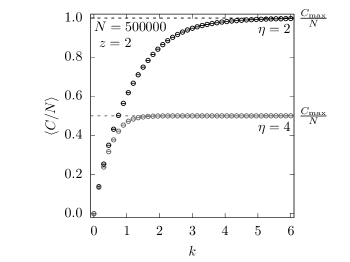
More variations in the results are obtained for the other network ensemble we have studied, the bipartite Erdős-Rényi graphs, since for this ensemble the nodes exhibit fluctuations of the degrees. In Figure 3 the average capacity per user node is shown as a function of the average user degree for server capacity and users. The results are averaged over 500 realisations for each value of . Two cases for the user to server ratio are considered, and . These values correspond to average server degrees and , respectively and server numbers , and , respectively. When approaching large degrees , in both cases the limiting capacities are reached which are according to Equation 4 for and for . Our results from using the exact algorithm agree well with the previous results Kreacic_2019 obtained by a message-passing algorithm. Note that we obtained data for all values of down to zero, while in the previous work only the range , i.e. was considered. Anyway, this success of the message-passing approach in the previous work is interesting, because it is known that for other problems, like the NP-hard vertex-cover problem, message-passing fails in the range of high degrees because for such models there exist replica-symmetry breaking cover2000 ; cover-tcs2001 ; cover-long2001 . The reason for the success with respect to -matching could be that in the range of large values of , the problem is easy to solve since there are enough options for each user and each server, which do not block each other too much. This corresponds to a simple, i.e, “dense” organization of the solution space and makes a quick convergence of the message-passing iterations possible. On the other hand for NP-hard problems, each assignment of a problem variable has typically a strong impact on the availability of suitable assignments for other variables.
4.2 Finite-size behaviour
Since there are basically no finite-size effects for the ()-regular graphs, we studied the finite-size scaling behaviour for bipartite Erdős-Rényi graphs. For we averaged over 5000 different realisations and for larger values of , a number of 500 realisations turned out to be sufficient.
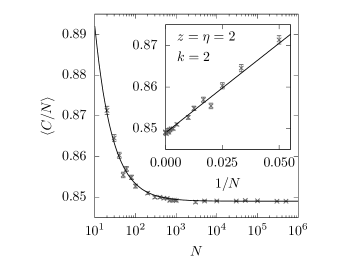
In Figure 4, the average capacity density is shown as a function of the system size for the case , and . Motivated by the results mezard1987matching for standard matching, we fitted the data to the function
| (6) |
and found a good agreement. The resulting parameters, also for the other cases we have studied, are shown in Table 1. For , and the fit does not converge since most graphs reached and therefore a finite-size dependence is hardly to observe. For all other cases, we observe a good agreement with the scaling. Only the prefactor of this term seems to be non-universal. Also it should be noted that not only the finite-size capacities but also the limiting values of the capacity density are usually well below , due to typically too small average degrees. This corresponds also to the behaviour seen in Figure 3.
| 2 | 2 | 1 | 1 | 0.60089(2) | 0.32(1) |
| 2 | 1 | 0.84902(2) | 0.43(1) | ||
| 3 | 1 | 0.947900(9) | 0.388(6) | ||
| 4 | 2 | 1 | 0.5 | 0.466631(9) | 0.118(8) |
| 2 | 0.5 | 0.499142(1) | 0.0141(6) | ||
| 3 | 0.5 | – | – | ||
| 4 | 4 | 1 | 1 | 0.62561(2) | 0.70(2) |
| 2 | 1 | 0.86292(2) | 1.09(1) | ||
| 3 | 1 | 0.950115(9) | 0.794(6) |
4.3 Phase transition
Finally, we study the saturation probability . Due to the simple structure of ()-regular graphs, we only focus on the Erdős-Rényi graphs and investigate them while varying the average degrees and . All results are obtained over 500 difference realisations for each value of and each system size .
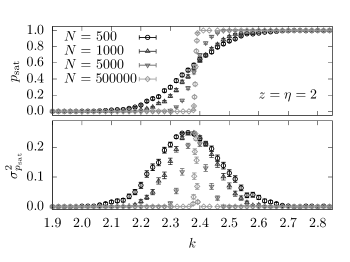
Figure 5 shows for different number of users. increases from 0 to 1 with growing degree , such that the curves become steeper when increasing . This is an indication for a transition from an unsaturated phase to a saturated phase. Note that this transition becomes almost step-wise for a really large number of users. We are able to observe the phase transition in such a clear way, because we could study huge system sizes due to the polynomial nature of the problem. This is in contrast to previously studied phase transitions for NP-hard optimisation problems, where only exponential-time exact algorithms are known and therefore only rather small system sizes could be studied exactly.
To study the observed phase transition in more detail, we use finite-size scaling analysis Cardy_2015_fss . Hence, we assume that for continuous transitions the saturation probability follows the standard finite-size scaling relation
| (7) |
with infinite-size critical point and being the exponent describing the divergence of the correlation length. We obtained the best-fitting scaling parameters using the tool autoScale.py Melchert_2009 . The results are obtained over 9 different system sizes , ranging from 500 to 500000. Figure 6 shows the resulting data collapse for , . Apperently the collapse works very good for this case. The best found values for and for all studied cases can be found in Table 2. The quality is the average deviation of the data points from the collapse curve, measured in terms of error bars gauss_2d . Since is close to one for all cases we have considered, the quality of the data collapse is always very good.
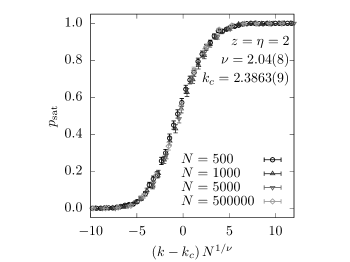
| 2 | 2 | 2.3863(9) | 2.04(8) | 0.90 |
|---|---|---|---|---|
| 4 | 2 | 0.8852(4) | 2.0(1) | 0.84 |
| 4 | 4 | 2.312(1) | 2.0(1) | 1.48 |
The statistical errors of the scaling parameters are determined as how much a parameter has to be changed to increase the quality of the fit by one to . We also systematically changed the intervals over which the data collapse is performed. However, these differences turned out to be smaller than the statistical errors, so we state only those. Interestingly, within error bars, the value for is compatible with a value of in all studied cases. This indicates that the behaviour of the saturable-unsaturable phase transition is universal with respect to network parameters.
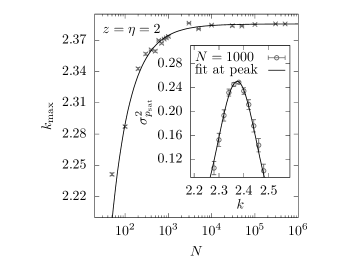
Note that the phase transition can also be studied and analysed by obtaining the variance as a function of . Although does not contain any additional information, it is easy to analyze, because it peaks at the apparent transition for each system size, which can be seen in the bottom of Figure 5. To confirm the results obtained from , we also analysed the phase transition by a finite-size analysis of the variance. In the thermodynamic limit, the variance should be maximal at the critical point. On finite systems, the position of maximal variance, denoted as , will approach as the system size grows. To determined more accurately than given by the resolution of the considered values of , we performed Gaussian fits to in small intervals near the maxima. An example is shown in the inset of Figure 7. To extrapolate the fit
| (8) |
is used. Note that we had to use here a correction term to the scaling behaviour, taking care of the very small system sizes. But we did not need to add a correction exponent to achieve a good fit and used exponent instead. Also, based on the above results of the finite-size scaling, we fixed . Figure 7 shows the fit for the case . The results of the obtained fit parameter for all three cases are shown in Table 3. Within error bars, one or two sigma, the values for agree with the above results which we obtained from the data collapse.
| 2 | 2 | 2.38566(3) | -0.07(1) | 137(21) |
|---|---|---|---|---|
| 4 | 2 | 0.88487(2) | 0.076(6) | -68(5) |
| 4 | 4 | 2.31068(4) | -0.04(1) | 404(118) |
To summarise, our results speak in favour of a phase transition from a unsaturable to a saturable phase at a critical average degree which depends on the graph structure. The scaling of the phase transition seems to be coverned by a universal exponent , which is very different from the usual mean-field exponent .
4.4 Algorithm running time
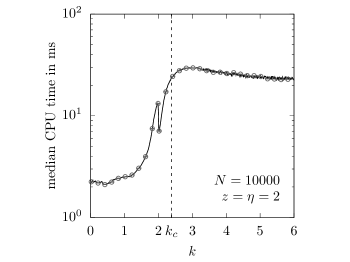
We next analyse the running time of the matching algorithm when varying the average user degrees, to see whether the phase transition is reflected for this quantity. Unfortunately, the package we used, the fastest open-source matching algorithm implementation to our knowledge, does not provide a machine-independent measure of the running time. So he had to limit our self to measure the CPU time. For this purpose, we used always the same machine under the same conditions. Figure 8 shows the median of the CPU time for Erdős-Rényi graphs as the average degree increases. Interestingly, the CPU time increases rapidly around the critical point, a typical behaviour observed so far for a phase transitions in NP-hard optimisation problems. Note that there appears to be a small non-monotonicity at . At each user has on average two servers available and the number of users with this degree is maximal as compared to all other degree values. A possible explanation for this behaviour is that the matching algorithm, which contains many sophisticated heuristics to speed up the exact calculation, can improve the solutions here substantially with just performing local changes for nodes of degree exactly two. For much larger values , the median CPU-time decreases slowly, even though there are more edges to handle. This is the case, because the -matchings become more and more degenerate in this region, i.e., the algorithm has more feasible options to choose among.
4.5 Approximation algorithm
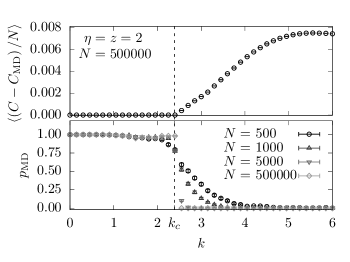
The result of the running time of the exact algorithm shows that for small values of , matchings can be obtained quickly. This could mean that in that region they are so simple to obtain such that even a non-exact but even faster algorithm is feasible. Therefore, we compare the exact matching algorithm with a matching heuristics. We considered the commonly used so called minimum-degree heuristics Duff_2012 . It finds a matching by connecting the nodes with lowest degree first, until no more nodes can be matched. The basic idea is that for nodes with few neighbours, one has to find a matching partner first, while nodes with many neighbours will still find a partner even if many of their neighbours have been matched already. Note that the heuristics has a linear running time. In this context, we study , i.e., the empirical estimated probability that the minimum-degree heuristics obtains the same capacity as the exact matching algorithm. The top of Figure 9 shows how far the capacity density obtained from the minimum degree heuristic differs from the the one calculated by the exact matching algorithm. On the bottom, is shown. Both results are obtained over 500 different realisations for each value of . Note that the average difference of the capacities between both algorithms starts to grow for . In particular, undergoes for large systems an almost step-wise transition from 1 to 0 near the critical point. This means that for the heuristic finds solutions with are well comparable to the exact solution. But for this is no longer the case. Hence, the saturable-unsaturable phase transition coincides with a kind of easy-hard transition with respect to a fast heuristics, although the -matching problem is polynomially solvable everywhere.
5 Summary and outlook
We have studied the saturable-unsaturable phase transition for the -matching problem on bipartite Erdős-Rényi random graphs. Since the problem can be solved with exact algorithms in polynomial time, we could study very large systems with good accuracy, leading to high-precision estimates of the critical points and of the critical exponent of the correlation length.
We have also studied the running time of the exact algorithm and found that the phase transition point is very close to the largest change in the running time. Also, for the minimum-degree heuristics, when studied for increasing node degrees, we find that the degree beyond which the heuristics start to fail, seems to agree with the critical point . Thus, the saturable-unsaturable transitions seems to coincide with strong changes of the algorithmic behaviour. This was previously observed mainly for NP-hard optimisation or constraints-satisfaction problems, not for polynomial problems.
Thus, for future work, it could be very interesting to study other polynomial optimisation problems in a similar way and verify whether phase transitions in connection with changes of the run time are present. This could also apply to the investigation of other ensembles of the -matching problems, or other variants of matching. This could lead to better understand the relation between phase transitions and computational hardness of optimisation or decision problems.
Finally, to understand this relation even better, one could analyse the solution structure for the -matching problem. For this purpose one could extend the algorithm to allow for sampling of degenerate solutions, possibly by introducing slight random changes to the initially uniform edge weights, in order to make so-far found solutions unfavourable. This would allow to investigate the cluster structure jain1988 of the solution space. Possibly one could in this way observe changes of the solution-space structure in connection with the saturable-unsaturable transition, as it has been the case for NP-hard problems vccluster2004 ; krzakala2007 ; sat_cluster2010 .
Acknowledgements.
The simulations were performed at the the HPC cluster CARL, located at the University of Oldenburg (Germany) and funded by the DFG through its Major Research Instrumentation Program (INST 184/157-1 FUGG) and the Ministry of Science and Culture (MWK) of the Lower Saxony State.References
- (1) O.C. Martin, R. Monasson, R. Zecchina, Theoretical Computer Science 265(1), 3 (2001). DOI https://doi.org/10.1016/S0304-3975(01)00149-9. Phase Transitions in Combinatorial Problems
- (2) A.K. Hartmann, M. Weigt, Phase Transitions in Combinatorial Optimization Problems (Wiley-VCH, Weinheim, 2005)
- (3) C. Moore, S. Mertens, The Nature of Computation (Oxford University Press, Oxford, 2011)
- (4) M. Mézard, A. Montanari, Information, Physics and Computation (Oxford University Press, Oxford, 2009)
- (5) M.R. Garey, D.S. Johnson, Computers and intractability (W.H. Freemann, San Francisco, 1979)
- (6) R. Monasson, R. Zecchina, S. Kirkpatrick, B. Selman, L. Troyansky, Nature 400, 133 (1999)
- (7) S. Kirkpatrick, B. Selman, Science 264, 1297 (1994)
- (8) S. Cocco, R. Monasson, Phys. Rev. Lett. 86, 1654 (2001)
- (9) R. Mulet, A. Pagnani, M. Weigt, R. Zecchina, Phys. Rev. Lett. 89, 268701 (2002)
- (10) M. Mézard, G. Parisi, J. de Phys. France 47(8), 1285 (1986)
- (11) I.P. Gent, T. Walsh, Artif. Intell. 88(1–2), 349 (1996). DOI 10.1016/S0004-3702(96)00030-6
- (12) H. Schawe, A.K. Hartmann, Europhys. Lett. 113, 30004 (2016). DOI 10.1209/0295-5075/113/30004
- (13) H. Schawe, J.K. Jha, A.K. Hartmann, Phys. Rev. E 100, 032135 (2019). DOI 10.1103/PhysRevE.100.032135
- (14) M. Weigt, A.K. Hartmann, Phys. Rev. Lett. 84, 6118 (2000)
- (15) A.K. Hartmann, M. Weigt, Theor. Comp. Sci. 265, 199 (2001)
- (16) M. Weigt, A.K. Hartmann, Phys. Rev. Lett. 86, 1658 (2001)
- (17) M. Weigt, A.K. Hartmann, Phys. Rev. E 63, 056127 (2001)
- (18) S. Mertens, Phys. Rev. Lett. 81, 4281 (1998)
- (19) S. Mertens, in Computational Complexity and Statistical Physics, ed. by A.G. Percus, G. Istrate, C. Moore (Oxford University Press, New York, 2006), p. 125
- (20) M. Mézard, G. Parisi, R. Zecchina, Science 297, 812 (2002)
- (21) A.K. Hartmann, H. Rieger, Optimization Algorithms in Physics (Wiley-VCH, Weinheim, 2001)
- (22) A.K. Hartmann, H. Rieger (eds.). New Optimization Algorithms in Physics (Wiley-VCH, Weinheim, 2004)
- (23) D. Jungnickel, Graphs, Networks and Algorithms (Springer, Heidelberg, 2010)
- (24) M. Mézard, G. Parisi, Journal de Physique Lettres 46(17), 771 (1985). DOI 1051/jphyslet:019850046017077100.jpa-00232897
- (25) G. Parisi, M. Ratiéville, Eur. Phys. J. B 29(3), 457 (2002). DOI 10.1140/epjb/e2002-00326-3
- (26) M. Mézard, G. Parisi, J. de Phys, France 48(9), 1451 (1987)
- (27) M. Mézard, G. Parisi, J. de Phys. France 49(12), 2019 (1988). DOI {10.1051/jphys:0198800490120201900}
- (28) J. Houdayer, J.H. Boutet de Monvel, O.C. Martin, Eur. Phys. J. B 6(3), 383 (1998). DOI 10.1007/s100510050565
- (29) S. Caracciolo, C. Lucibello, G. Parisi, G. Sicuro, Phys. Rev. E 90, 012118 (2014). DOI 10.1103/PhysRevE.90.012118. URL https://link.aps.org/doi/10.1103/PhysRevE.90.012118
- (30) O.C. Martin, M. Mézard, O. Rivoire, Journal of Statistical Mechanics: Theory and Experiment 2005(09), P09006 (2005). DOI 10.1088/1742-5468/2005/09/p09006. URL https://doi.org/10.1088/1742-5468/2005/09/p09006
- (31) R. Kenyon, ArXiv e-prints (2009)
- (32) P. Kasteleyn, Physica 27(12), 1209 (1961). DOI https://doi.org/10.1016/0031-8914(61)90063-5
- (33) M.E. Fisher, Phys. Rev. 124, 1664 (1961). DOI 10.1103/PhysRev.124.1664. URL https://link.aps.org/doi/10.1103/PhysRev.124.1664
- (34) H.N.V. Tempereley, M.E. Fisher, Phil. Mag. 6(68), 1061 (1961). DOI 10.1080/14786436108243366
- (35) M.E. Fisher, Journal of Mathematical Physics 7(10), 1776 (1966). DOI 10.1063/1.1704825
- (36) O.J. Heilmann, E.H. Lieb, Commun. Math. Phys. 25(3), 190 (1972). DOI 10.1007/BF01877590
- (37) R.M. Karp, M. Sipser, in Proc. 22nd Annual IEEE Symp. on Foundations of Computer Science, vol. 22, ed. by I.C. Society (IEEE Computer Society, Los Alamitos, CA, USA, 1982), vol. 22, pp. 364––75
- (38) L. Zdeborova, M. Mézard, JSTAT (2006). DOI {10.1088/1742-5468/2006/05/P05003}
- (39) Y. Gu, W. Saad, M. Bennis, M. Debbah, Z. Han, IEEE Communications Magazine 53(5), 52 (2015). DOI 10.1109/MCOM.2015.7105641
- (40) Z. Han, Y. Gu, W. Saad, Matching theory for future wireless networks (Springer, Heidelberg, 2017)
- (41) E. Kreačić, G. Bianconi, EPL (Europhysics Letters) 126(2), 28001 (2019). DOI 10.1209/0295-5075/126/28001. URL https://doi.org/10.1209%2F0295-5075%2F126%2F28001
- (42) B. Bollobás, Europ. J. of Combinatorics 1(4), 311 (1980)
- (43) M.E. Newman, S.H. Strogatz, D.J. Watts, Physical review E 64(2), 026118 (2001)
- (44) H. Klein-Hennig, A.K. Hartmann, Phys. Rev. E 85, 026101 (2012). DOI 10.1103/PhysRevE.85.026101. URL https://link.aps.org/doi/10.1103/PhysRevE.85.026101
- (45) F. Viger, M. Latapy, Proceedings of the 11th Annual International Conference on Computing and Combinatorics 3595, 440 (2005)
- (46) P. Erdős, A. Rényi, Publicationes Mathematicae Debrecen 6, 290 (1959)
- (47) W.J. Cook, W.H. Cunningham, W.R. Pulleyblank, A. Schrijver, Combinatorial Optimization (John Wiley & Sons, Inc., New York, NY, USA, 1998)
- (48) Egerváry Research Group on Combinatorial Optimization. LEMON stands for Library for Efficient Modeling and Optimization in Networks. It is a Open Sorce C++ Library. http://lemon.cs.elte.hu/pub/doc/1.2.3/index.html
- (49) A.K. Hartmann, Big Practical Guide to Computer Simulations (World Scientific, Singapore, 2015)
- (50) J. Cardy, Finite-Size Scaling, Current Physics, Sources and Comments, vol. 2 (North Holland, 2015)
- (51) O. Melchert, arXiv:0910.5403v1 (2009). URL https://arxiv.org/abs/0910.5403
- (52) J. Houdayer, A.K. Hartmann, Phys. Rev. B 70, 014418 (2004). DOI 10.1103/PhysRevB.70.014418. URL https://link.aps.org/doi/10.1103/PhysRevB.70.014418
- (53) B. Efron, R.J. Tibshirani, An Introduction to the Bootstrap (Chapman & Hall/CRC, Boca Raton, 1994)
- (54) I.S. Duff, K. Kaya, B. Uçcar, ACM Trans. Math. Softw. 38(2) (2012). DOI 10.1145/2049673.2049677. URL https://doi.org/10.1145/2049673.2049677
- (55) A.K. Jain, R.C. Dubes, Algorithms for Clustering Data (Prentice-Hall, Englewood Cliffs, USA, 1988)
- (56) W. Barthel, A.K. Hartmann, Phys. Rev. E 70, 066120 (2004)
- (57) F. Krzakala, A. Montanari, F.R.T. rsenghi, G. Semerjian, L. Zdeborová, PNAS 104, 10318 (2007). DOI 10.1073/pnas.0703685104
- (58) A. Mann, A.K. Hartmann, Phys. Rev. E 82, 056702 (2010)