Single-component superconducting state in UTe2 at 2 K
UTe2 is a newly-discovered unconventional superconductor wherein multicomponent topological superconductivity is anticipated based on the presence of two superconducting transitions and time-reversal symmetry breaking in the superconducting state Ran et al. (2019a); Hayes et al. (2021). The observation of two superconducting transitions, however, remains controversial Aoki et al. (2019a); Thomas et al. (2020, 2021); Cairns et al. (2020). Here we demonstrate that UTe2 single crystals displaying an optimal superconducting transition temperature at K exhibit a single transition and remarkably high quality supported by their small residual heat capacity in the superconducting state and large residual resistance ratio. Our results shed light on the intrinsic superconducting properties of UTe2 and bring into question whether UTe2 is a multicomponent superconductor at ambient pressure.
Uranium is a fascinating element located at the border between localized and delocalized wavefunctions. Uranium-based materials may therefore be found close to a magnetic-nonmagnetic boundary at which unconventional superconductivity is generally expected to emerge. According to the Hill limit, superconductivity is favored when the distance between uranium atoms, , is smaller than Å, whereas localized wavefunctions favor magnetic order when Å Hill (1970); Moore and Van Der Laan (2009). Unconventional actinide superconductors, however, remain a rather sparse class of strongly correlated materials that host many puzzling emergent properties. Hidden order in tetragonal URu2Si2 Palstra et al. (1985); Mydosh and Oppeneer (2011), time-reversal symmetry breaking in the superconducting state of hexagonal UPt3 Schemm et al. (2014); Avers et al. (2020), and contradicting reports on whether cubic UBe13 is a spin-singlet or a spin-triplet superconductor Han et al. (1986); Shimizu et al. (2015) are just a few examples. Other prominent examples include hexagonal antiferromagnetic UAl3 ( Ni, Pd) Geibel et al. (1991); Pfleiderer (2009) and orthorhombic ferromagnetic superconductors UGe2, UCoGe, and URhGe Saxena et al. (2000); Aoki et al. (2019b).
In 2019, orthorhombic UTe2 became a new member of this family. Early reports observed a superconducting transition at K and a remarkably large upper critical field exceeding 40 T, a value much higher than the expected Pauli limit for a spin-singlet state Ran et al. (2019a, b). Nuclear magnetic resonance (NMR) measurements found that the decrease in Knight shift below is much smaller than the expectation from spin-singlet pairing Nakamine et al. (2019). Though no magnetic order is observed above 25 mK muon spin resonance measurements Sundar et al. (2019), -axis magnetization data can be described by the Belitz-Kirkpatrick-Votja theory for metallic ferromagnetic quantum criticality Ran et al. (2019a). UTe2 was therefore proposed to be close to a ferromagnetic quantum critical point akin to UGe2, UCoGe, and URhGe Aoki et al. (2019b). The shortest U-U distance in UTe2 within the -axis dimers, Å, supports proximity to a magnetic instability, but inelastic neutron scattering measurements as well as pressure- and field-dependent thermodynamic properties point to dominant antiferromagnetic fluctuations Braithwaite et al. (2019); Thomas et al. (2020); Li et al. (2021); Duan et al. (2020, 2021); Knafo et al. (2021).
Recently, the presence of two phase transitions in specific heat data combined with time-reversal symmetry breaking probed by the polar Kerr effect support the presence of a multicomponent superconducting order parameter in UTe2. Kerr trainability along the axis and symmetry requirements in the space group further indicate that the two superconducting order parameters belong to a combination of either and or and spin-triplet channels Hayes et al. (2021). In this case, UTe2 is a topological superconductor with Weyl nodes and surface Fermi arc states Hayes et al. (2021).
The observation of two superconducting transitions in UTe2, however, remains disputed as independent groups observe a single transition Cairns et al. (2020); Aoki et al. (2019a); Thomas et al. (2021). The superconducting properties of UTe2 are strongly dependent on the synthesis route, which further highlights the crucial role of sample quality in determining the intrinsic properties of unconventional superconductors. UTe2 crystals grown by the self-flux method show no signs of bulk superconductivity, whereas crystals grown by chemical vapor transport show either a split transition or a single transition Aoki et al. (2019a). Notably, specific heat data show an apparent lack of entropy conservation between the superconducting and normal states, and a large residual Sommerfeld coefficient of unknown origin is observed in the superconducting state, . Further, the highest reported of 1.77 K yields a single transition and an inverse correlation between and Cairns et al. (2020); Aoki et al. (2021). Key outstanding questions are therefore whether the optimal in UTe2 leads to entropy conservation and how the purported multicomponent transition responds to changes in .
Here we show that UTe2 crystals with the highest superconducting transition temperature, K, exhibit a single thermodynamic transition. The high quality of the crystals is demonstrated by their high residual resistance ratio, RRR=57, and low residual heat capacity, =23 mJ/mol.K2, which leads to entropy conservation. Remarkably, normal state properties such as magnetic susceptibility and Sommerfeld coefficient remain unchanged between samples. Lattice parameters and site occupancy determined from single crystal x-ray diffraction also do not change within experimental uncertainty. Our results suggest that the superconducting state of UTe2 is sensitive to remarkably subtle structural differences that deserve a central place in future investigations of the intrinsic superconducting properties of UTe2.
As described in Methods and summarized in Table I, single crystals of UTe2 were grown using the chemical vapor transport (CVT) method with iodine as the transport agent. Figure 1a shows the specific heat divided by temperature, , as a function of temperature for seven representative samples. Sample s1 exhibits two well-defined features at K and K, which is consistent with results from Ref. Hayes et al. (2021) (group 1) interpreted as distinct superconducting transitions from a multicomponent order parameter. Here is defined as the midpoint of the rise in on cooling. This double feature is quickly replaced by a single transition as the growth temperature decreases. Results for samples s2 ( K) and s3 ( K) are consistent with reports from group 2 Aoki et al. (2019a) and group 3 Cairns et al. (2020), respectively.
The optimal superconducting transition temperature is found in sample s6, whose bulk is K. The bulk superconducting transition quickly vanishes in crystals grown at even lower temperatures (sample s7). Importantly, the residual heat capacity value in the superconducting state decreases monotonically as increases. Although changes in the U/Te starting ratio were previously shown to affect Cairns et al. (2020), our results demonstrate that the optimal in UTe2 is obtained at lower growth temperatures. We find that slightly larger Te concentrations also quickly suppress . In contrast to variations in and , the normal state Sommerfeld coefficient is virtually constant for all samples, mJ/mol.K2.
| Sample | RRR | ||||
| (∘C) | (∘C) | (K) | (mJ/mol.K2) | ||
| s1 | 1060 | 1000 | 1.64 & 1.48 | 65 | 30-40 |
| s2 | 950 | 860 | 1.68 | 51 | - |
| s3 | 925 | 835 | 1.77 | 43 | - |
| s4 | 875 | 785 | 1.85 | 41 | 50 |
| s5 | 825 | 735 | 1.95 | 25 | 57 |
| s6 | 800 | 710 | 2.00 | 23 | - |
| s7 | 775 | 685 | None | - | 2 |
Figure 1b shows as a function of temperature for sample s6. At , the magnitude of the superconducting jump divided by the normal state Sommerfeld coefficient is . This value is larger than the weak coupling BCS limit of 1.43 and agrees with previous results on samples with a single transition higher than 1.7 K Cairns et al. (2020). For samples with lower , is smaller and ranges from to Ran et al. (2019a); Hayes et al. (2021); Aoki et al. (2019a); Thomas et al. (2020, 2021). Notably, a transition temperature of K has been observed previously in electrical resistivity data, but the associated bulk transition in occurred at lower temperature K Cairns et al. (2020). Whether the higher resistive transition is due to surface effects or percolation through filaments in the bulk is still an open question.
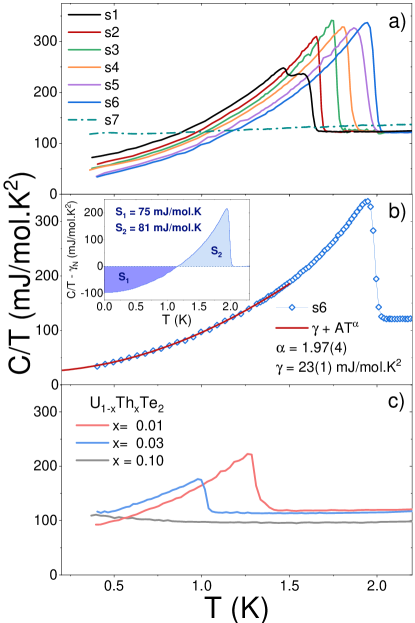
The low-temperature behavior of sample s6 can be well described by the power-law expression wherein mJ/mol.K2 and (solid line in Fig. 1b). The magnitude of the residual Sommerfeld coefficient in the superconducting state of sample s6 is the lowest reported value, which suggests that a larger value is not an intrinsic property of UTe2. In addition, the quadratic dependence of indicates the presence of point nodes, in agreement with previous thermal conductivity and specific heat measurements in crystals grown at higher temperatures Metz et al. (2019); Kittaka et al. (2020); Cairns et al. (2020).
The second order nature of the superconducting transition in UTe2 requires entropy to be conserved at . This equality can be probed by comparing the areas enclosed above and below the baseline. The inset of Fig. 1b shows the difference between and as a function of temperature as well as the corresponding areas and . The magnitudes of the two areas differ by less than 8%, in agreement with the expected entropy conservation in UTe2, whereas samples with lower show an apparent entropy imbalance of about % Ran et al. (2019a); Hayes et al. (2021); Thomas et al. (2020); Aoki et al. (2019a). The remaining small apparent entropy imbalance may be a hint that can still be further improved, though likely not by a significant amount. Alternatively, the imbalance could be tentatively explained by the presence of a nuclear Schottky anomaly at lower temperatures. Finally, we note that a proper phonon subtraction was hindered by the fact that nonmagnetic analog ThTe2 is not known to crystallize in the same strucutre of UTe2.
To test the solubility of Th in UTe2, we investigate Th-doped UTe2 single crystals grown in conditions similar to sample s1, which could also provide access to the unexplored regime of negative chemical pressure in UTe2. Figure 1c shows the specific heat divided by temperature as a function of temperature for U1-xThxTe2 at three Th concentrations. At only 1% Th doping, the superconducting anomaly is substantially suppressed by about 20%. At such low doping, microprobe analysis using energy dispersive x-ray spectroscopy shows that the actual concentration of Th is very close to the nominal concentration, and the doping is fairly homogeneous. For the crystal shown in Fig. 1c, the mean actual concentration is 1.2% and the homogeneity range is about 0.2%. At 3% nominal Th doping, the mean actual concentration is 4%, but a larger standard deviation of 2% is observed within a crystal. The superconducting transition in specific heat is further suppressed to K at 3% nominal Th doping, whereas no transition is observed at 10% nominal Th doping. Microprobe analysis of the crystal shown in Fig. 1c yields an actual concentration of 24(8)%, but measurements in different crystals from the same batch show significantly different dopings. These results are consistent with an insolubitity region at larger Th concentrations.
Now we turn to the electrical and magnetic properties of sample s5, whose is 1.95 K. Figure 2 shows the anisotropic magnetic susceptibility, , of UTe2 as a function of temperature. Importantly, in the normal state is identical to previous reports Ran et al. (2019a); Aoki et al. (2019a) and between different samples in this work. The a-axis susceptibility is the largest, which suggests that the axis is the easy axis. The -axis susceptibility is small and monotonic, whereas the -axis susceptibility shows a broad feature centered at K. The right inset of Fig. 2 displays the zero-field-cooled and field-cooled at 2 Oe with field applied along the axis. A clear diamagnetic signal sets in at K, which is consistent with electrical resistivity and specific heat data.
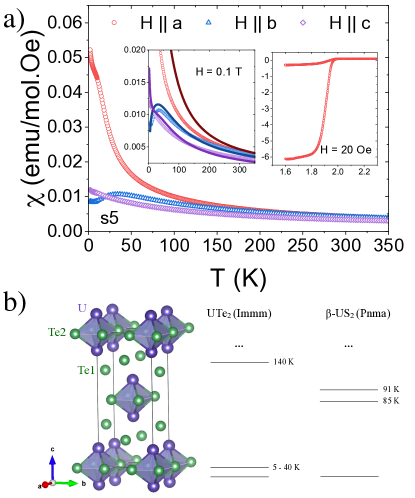
Crystal electric field (CEF) effects are able to capture the qualitative behavior of UTe2. The solid lines in the left inset of Figure 2 show fits of the data to an orthorhombic CEF Hamiltonian , where are the CEF parameters, and are the Stevens equivalent operators obtained from the angular momentum operators Pagliuso et al. (2006). Here we consider the configuration of uranium, , U4+ (, ), as the localized configuration that gives rise to CEF effects. This consideration is based on two experimental results. First, x-ray absorption measurements under pressure show that UTe2 is mixed valence at ambient pressure and goes towards when magnetic order sets in under pressure Thomas et al. (2020). Second, core-level spectroscopy supports the mixed valence nature of UTe2 wherein the dominant contribution arises from the itinerant configuration and a smaller localized contribution is responsible for a satellite peak Fujimori et al. (2021a).
The orthorhombic crystalline environment splits the 9-fold degenerate multiplet of U4+ into a collection of singlets. The relevant levels below room temperature are described by a combination of two low-lying singlets and an excited singlet at 140 K. As shown in Figure 2b, this configuration resembles that of -US2, whose experimentally-determined crystal field levels are given by a ground state singlet separated by 85 K and 91 K from two excited singlets. Akin to UTe2, -US2 also orders magnetically under pressure, which indicates that the admixture of three low-lying singlets yields a finite magnetic moment. In fact, the ground state and the second excited state at 140 K in UTe2 form a quasi-doublet, , they share the same contributions , , and . The CEF parameters and corresponding energy levels and wavefunctions are shown in Table S1 (Supplemental Information).
Figure 3 shows the electrical resistivity with applied current along the axis, , as a function of temperature. At high temperatures, increases slightly on cooling, which is consistent with previous reports and stems from incoherent Kondo scattering. At about K, decreases sharply on cooling, a behavior typically attributed to the formation of a Kondo coherent state. This coherence temperature is also consistent with estimates from scanning tunneling microscopy Jiao et al. (2020).
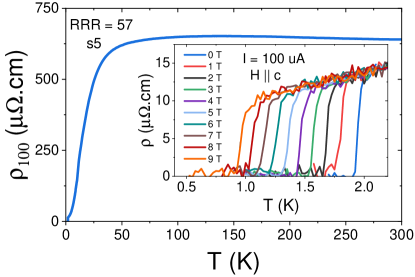
The inset of Fig. 3 shows the low-temperature behavior of at various magnetic fields applied along the axis. At zero field, the mid-point of the superconducting transition is at 1.95 K, which is precisely the value obtained from specific heat measurements. At 9 T, is reduced to 1 K, which is consistent with previous reports by taking into account a K shift in the zero-field Ran et al. (2019a); Aoki et al. (2019a). Finally, the residual resistivity ratio (RRR), defined as , is 57, which is the highest reported value for . In contrast, the RRR value of non-superconducting sample s7 is only 2 (see Table 1). The residual resistivity, .cm, was obtained by a low-temperature fit to , and to our knowledge is also the lowest reported value.
Both and RRR values are commonly used criteria for the presence of disorder and have been successfully utilized to infer the quality of unconventional superconductors, including UTe2 by groups 1 and 2 Hayes et al. (2021); Aoki et al. (2019a). The pressing question therefore relates to the cause of the underlying disorder in UTe2. Historically, planar defects, grain boundaries, and substitutional or interstitial impurities have been argued to affect the sample quality of various actinide superconductors including UPt3 Kycia et al. (1998), UBe13 Amon et al. (2018), UCoGe Huy et al. (2009), and URu2Si2 Gallagher et al. (2016). More broadly, disorder has been shown to reduce in other unconventional superconductors such as Sr2RuO4 Mackenzie et al. (1998) and FeSe Böhmer et al. (2016). Recent reports have argued that Te vacancies are responsible for lower superconducting transitions in UTe2 Cairns et al. (2020). Remarkably, in the present study we do not observe statistically relevant differences in microprobe analysis through energy dispersive x-ray spectroscopy. All single crystals investigated here showed a stoichiometry of UTe2.2(3), , the large error bars hinder the establishment of any possible trends. This result is supported by standard laboratory single crystal x-ray diffraction of samples s1 and s6, wherein both uranium and tellurium sites are fully occupied. In addition, lattice parameters as well as all refined parameters are constant across all investigated samples within experimental uncertainty. Table S2 (Supplemental Information) provides details of the full refinements. Our results suggest that the superconducting state of UTe2 is remarkably sensitive to disorder and calls attention to the importance of determining the main structural parameter that suppresses and splits .
In summary, we report the optimal superconducting transition temperature, K, in UTe2 single crystals. Our crystals exhibit a single superconducting transition and their high quality is demonstrated by high residual resistance ratios, RRR , and low residual heat capacity values in the superconducting state, mJ/mol.K2, which leads the expected entropy conservation. The correlation between and residual resistance ratios underscores the role of disorder in the superconducting state of UTe2. The disappearance of the double transition feature as sample quality is improved brings into question whether UTe2 is a multi-component superconductor at ambient pressure.
We would like to acknowledge constructive discussions with M Bordelon, N Butch, JP Paglione, A Huxley, and RM Fernandes. This material is based upon work supported by the U.S. Department of Energy, Office of Science, National Quantum Information Science Research Centers, Quantum Science Center. Scanning electron microscope and energy dispersive x-ray measurements were supported by the Center for Integrated Nanotechnologies, an Office of Science User Facility operated for the U.S. Department of Energy Office of Science. AW acknowledges support from the Laboratory Directed Research and Development program at LANL.
.1 Methods
Single crystals of UTe2 were grown using the chemical vapor transport method. Solid pieces of depleted uranium (%) and tellurium (Alfa Aesar, %) were weighed in a 2:3 ratio with total mass of g. The elements were sealed under vacuum using a hydrogen torch in a quartz tube along with g of iodine (Alfa Aesar, %). The dimensions of the quartz tube are 1.8 cm (outer diameter), 1.4 cm (inner diameter), and cm (length), which resulted in an iodine density of about mg/cm3. A temperature gradient was maintained in a multi-zone furnace for 11 days. The elements were placed in the hot end of the gradient at , whereas single crystals of UTe2 were obtained at , the cold end of the gradient. was varied from 1060 ∘C to 800 ∘C, whereas was varied from 1000 ∘C to 710 ∘C. A summary of the growth conditions of representative samples is presented in Table 1. For Th-doped samples, Th and U were arc melted in a water-cooled Cu hearth prior to the growth.
The crystallographic structure of UTe2 was determined at room temperature by a Bruker D8 Venture single-crystal diffractometer equipped with Mo radiation. Elemental analysis of our single crystals using energy-dispersive x-ray spectroscopy in a commercial scanning electron microscope. Single crystals of UTe2 are sensitive to air and moisture, and they were kept in an argon glovebox between measurements to allow for sample stability over several months. Magnetization measurements were obtained through a commercial SQUID-based magnetometer. Specific heat measurements were made using a commercial calorimeter that utilizes a quasi-adiabatic thermal relaxation technique. The electrical resistivity () was characterized using a standard four-probe configuration with an AC resistance bridge. Values of RRR in Table I were determined for current flow along the axis.
References
- Ran et al. (2019a) S. Ran, C. Eckberg, Q.-P. Ding, Y. Furukawa, T. Metz, S. R. Saha, I.-L. Liu, M. Zic, H. Kim, J. Paglione, et al., Science 365, 684 (2019a).
- Hayes et al. (2021) I. M. Hayes, D. S. Wei, T. Metz, J. Zhang, Y. S. Eo, S. Ran, S. R. Saha, J. Collini, N. P. Butch, D. F. Agterberg, et al., Science 373, 797 (2021).
- Thomas et al. (2020) S. M. Thomas, F. B. Santos, M. H. Christensen, T. Asaba, F. Ronning, J. D. Thompson, E. D. Bauer, R. M. Fernandes, G. Fabbris, and P. F. S. Rosa, Science Advances 6, eabc8709 (2020).
- Aoki et al. (2019a) D. Aoki, A. Nakamura, F. Honda, D. Li, Y. Homma, Y. Shimizu, Y. J. Sato, G. Knebel, J.-P. Brison, A. Pourret, et al., Journal of the Physical Society of Japan 88, 043702 (2019a).
- Thomas et al. (2021) S. M. Thomas, C. Stevens, F. B. Santos, S. S. Fender, E. D. Bauer, F. Ronning, J. D. Thompson, A. Huxley, and P. F. S. Rosa, arXiveprint :2103.09194 (2021).
- Cairns et al. (2020) L. P. Cairns, C. R. Stevens, C. D. O’Neill, and A. Huxley, Journal of Physics: Condensed Matter 32, 415602 (2020).
- Hill (1970) H. H. Hill, in Plutonium 1970 and Other Actinides, edited by W. N. Miner (The Metallurgical Society of the AIME, 1970).
- Moore and Van Der Laan (2009) K. T. Moore and G. Van Der Laan, Reviews of Modern Physics 81, 235 (2009).
- Palstra et al. (1985) T. T. M. Palstra, A. A. Menovsky, J. V. D. Berg, A. J. Dirkmaat, P. H. Kes, G. J. Nieuwenhuys, and J. A. Mydosh, Physical Review Letters 55, 2727 (1985).
- Mydosh and Oppeneer (2011) J. A. Mydosh and P. M. Oppeneer, Reviews of Modern Physics 83, 1301 (2011).
- Schemm et al. (2014) E. R. Schemm, W. J. Gannon, C. M. Wishne, W. P. Halperin, and A. Kapitulnik, Science 345, 190 (2014).
- Avers et al. (2020) K. E. Avers, W. J. Gannon, S. J. Kuhn, W. P. Halperin, J. A. Sauls, L. DeBeer-Schmitt, C. D. Dewhurst, J. Gavilano, G. Nagy, U. Gasser, et al., Nature Physics (2020).
- Han et al. (1986) S. Han, K. W. Ng, E. L. Wolf, A. Millis, J. L. Smith, and Z. Fisk, Physical Review Letters 57, 238 (1986).
- Shimizu et al. (2015) Y. Shimizu, S. Kittaka, T. Sakakibara, Y. Haga, E. Yamamoto, H. Amitsuka, Y. Tsutsumi, and K. Machida, Physical Review Letters 114, 147002 (2015).
- Geibel et al. (1991) C. Geibel, C. Schank, S. Thies, H. Kitazawa, C. D. Bredl, A. Bohm, M. Rau, A. Grauel, R. Caspary, R. Helfrich, et al., Zeitschrift fur Physik B Condensed Matter 84, 1 (1991).
- Pfleiderer (2009) C. Pfleiderer, Reviews of Modern Physics 81, 1551 (2009).
- Saxena et al. (2000) S. S. Saxena, P. Agarwal, K. Ahilan, F. M. Grosche, R. K. W. Haselwimmer, M. J. Steiner, E. Pugh, I. R. Walker, S. R. Julian, P. Monthoux, et al., Nature 406, 587 (2000).
- Aoki et al. (2019b) D. Aoki, K. Ishida, and J. Flouquet, Journal of the Physical Society of Japan 88, 022001 (2019.
- Ran et al. (2019b) S. Ran, I.-L. Liu, Y. S. Eo, D. J. Campbell, P. M. Neves, W. T. Fuhrman, S. R. Saha, C. Eckberg, H. Kim, D. Graf, et al., Nature Physics 15, 1250 (2019.
- Nakamine et al. (2019) G. Nakamine, S. Kitagawa, K. Ishida, Y. Tokunaga, H. Sakai, S. Kambe, A. Nakamura, Y. Shimizu, Y. Homma, D. Li, et al., Journal of the Physical Society of Japan 88, 113703 (2019).
- Sundar et al. (2019) S. Sundar, S. Gheidi, K. Akintola, A. M. Cote, S. R. Dunsiger, S. Ran, N. P. Butch, S. R. Saha, J. Paglione, and J. E. Sonier, Physical Review B 100, 140502 (2019).
- Braithwaite et al. (2019) D. Braithwaite, M. Vališka, G. Knebel, G. Lapertot, J.-P. Brison, A. Pourret, M. E. Zhitomirsky, J. Flouquet, F. Honda, and D. Aoki, Communications Physics 2, 147 (2019).
- Li et al. (2021) D. Li, A. Nakamura, F. Honda, Y. J. Sato, Y. Homma, Y. Shimizu, J. Ishizuka, Y. Yanase, G. Knebel, J. Flouquet, et al., Journal of the Physical Society of Japan 90, 073703 (2021).
- Duan et al. (2020) C. Duan, K. Sasmal, M. B. Maple, A. Podlesnyak, J.-X. Zhu, Q. Si, and P. Dai, Physical Review Letters 125, 237003 (2020).
- Duan et al. (2021) C. Duan, R. E. Baumbach, A. Podlesnyak, Y. Deng, C. Moir, A. J. Breindel, M. B. Maple, and P. Dai, arXiv (2021), eprint 2106.14424.
- Knafo et al. (2021) W. Knafo, G. Knebel, P. Steffens, K. Kaneko, A. Rosuel, J. P. Brison, J. Flouquet, D. Aoki, G. Lapertot, and S. Raymond, arXiv (2021), eprint 2106.13087.
- Aoki et al. (2021) D. Aoki, A. Nakamura, F. Honda, DeXin Li, Y. Homma, Y. Shimizu, Y. J. Sato, G. Knebel, J.-P. Brison, A. Pourret, D. Braithwaite, G. Lapertot, Qun Niu, M. Valiska, H. Harima, and J. Flouquet, Proceedings of the International Conference on Strongly Correlated Electron Systems (SCES2019) 30, 011065 (2020).
- Metz et al. (2019) T. Metz, S. Bae, S. Ran, I.-l. Liu, Y. S. Eo, W. T. Fuhrman, D. F. Agterberg, S. M. Anlage, N. P. Butch, and J. Paglione, Physical Review B 100, 220504 (2019).
- Kittaka et al. (2020) S. Kittaka, Y. Shimizu, T. Sakakibara, A. Nakamura, D. Li, Y. Homma, F. Honda, D. Aoki, and K. Machida, Physical Review Research 2, 032014 (2020).
- Pagliuso et al. (2006) P. G. Pagliuso, D. J. Garcia, E. Miranda, E. Granado, R. Lora Serrano, C. Giles, J. G. S. Duque, R. R. Urbano, C. Rettori, J. D. Thompson, et al., Journal of Applied Physics 99, 08P703 (2006).
- Fujimori et al. (2021a) Shin-ichi Fujimori, I. Kawasaki, Y. Takeda, H. Yamagami, A. Nakamura, Y. Homma, D. Aoki, Journal of the Physical Society of Japan 90, 015002 (2021a).
- Jiao et al. (2020) L. Jiao, S. Howard, S. Ran, Z. Wang, J. O. Rodriguez, M. Sigrist, Z. Wang, N. P. Butch, and V. Madhavan, Nature 579, 523 (2020).
- Kycia et al. (1998) J. B. Kycia, J. I. Hong, M. J. Graf, J. A. Sauls, D. N. Seidman, and W. P. Halperin, Physical Review B 58, R603 (1998).
- Amon et al. (2018) A. Amon, I. Zelenina, P. Simon, M. Bobnar, M. Naumann, E. Svanidze, F. Arnold, H. Borrmann, U. Burkhardt, W. Schnelle, et al., Scientific Reports 8, 10654 (2018).
- Huy et al. (2009) N. Huy, Y. Huang, and A. de Visser, Journal of Magnetism and Magnetic Materials 321, 2691 (2009).
- Gallagher et al. (2016) A. Gallagher, W. Nelson, K. Chen, T. Besara, T. Siegrist, and R. Baumbach, Crystals 6, 128 (2016).
- Mackenzie et al. (1998) A. P. Mackenzie, R. K. W. Haselwimmer, A. W. Tyler, G. G. Lonzarich, Y. Mori, S. Nishizaki, and Y. Maeno, Phys. Rev. Lett. 80, 161 (1998).
- Böhmer et al. (2016) A. E. Böhmer, V. Taufour, W. E. Straszheim, T. Wolf, and P. C. Canfield, Phys. Rev. B 94, 024526 (2016).