Electron-to-nuclear spectral mapping via “Galton board” dynamic nuclear polarization
Abstract
We report on a strategy to indirectly readout the spectrum of an electronic spin via polarization transfer to nuclear spins in its local environment. The nuclear spins are far more abundant and have longer lifetimes, allowing repeated polarization accumulation in them. Subsequent nuclear interrogation can reveal information about the electronic spectral density of states. We experimentally demonstrate the method for reading out the ESR spectrum of Nitrogen Vacancy center electrons in diamond via readout of lattice nuclei. Spin-lock control on the nuclei yields significantly enhanced signal-to-noise for the nuclear readout. Spectrally mapped readout presents operational advantages in being background-free and immune to crystal orientation and optical scattering. We harness these advantages to demonstrate applications in underwater magnetometry. The physical basis for the “one-to-many” spectral map is itself intriguing. To uncover its origin, we develop a theoretical model that maps the system dynamics, involving traversal of a cascaded structure of Landau-Zener anti-crossings, to the operation of a tilted “Galton board”. This work points to new opportunities for “ESR-via-NMR” in dilute electronic systems, and in hybrid electron-nuclear quantum memories and sensors.
Introduction – The control and readout of electronic spins forms the basis for quantum sensing [1]. Magnetometry with diamond Nitrogen Vacancy (NV) centers leverages the ability of the NV electronic spin to be optically initialized and read out at room temperature [2, 3]. Let denote the NV electronic spectrum at bias field and frequency . Optical readout (ODMR) [4] maps to fluorescence contrast by exploiting the differential optical contrast between the triplet ground state levels originating from state-selective branching in the excited state [5, 6]. Ensemble DC magnetometry then entails measuring a fluorescence change upon a shift in the electronic spectrum, when subject to a probe magnetic field [7, 8].
Spin-fluorescence mapping, while attractive in many contexts, suffers from technical limitations that can reduce sensitivity in some operational scenarios. A typical example is when the N-V axis is misoriented with respect to [9]. State mixing in the excited state then leads to a steep drop in fluorescence and ODMR contrast [9]. Even when perfectly aligned, typical fluorescence contrast levels are and susceptible to optical backgrounds and readout laser amplitude noise [10, 11, 8]. In scenarios requiring quantum sensing in fluidic (or optically dense) media, optical scattering can further reduce contrast. There has been broad interest in alternate strategies that map the NV electronic populations into other parameters (e.g. charge [12, 13]) that can be efficiently readout.
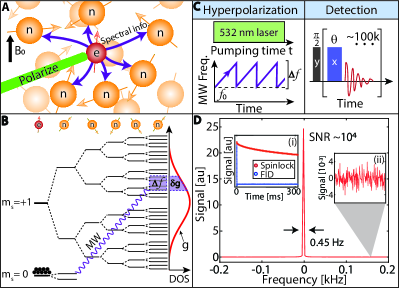
Here, we demonstrate an alternate route to reading out the NV electronic spectrum via nuclear spins in the surrounding environment (Fig. 1A). Our strategy relies on mapping the NV spectral density of states (DOS) at frequency , , into nuclear polarization (see Fig. 1B),
| (1) |
where refers to an approximate map in the limit . The nuclei are subsequently inductively readout via RF techniques (NMR) providing certain natural advantages over optical readout [17]: it is crystal orientation independent, background-free, and immune to fluorescence fluctuations due to scattering.
The central focus of this paper is to unravel the mechanism of the NV spectral-map in Eq. (1). Such a one-to-many spectral map appears challenging at first (Fig. 1A-B): every NV center is surrounded by multiple nuclei, which are in turn dipole-coupled to each other, and selective control is difficult. Our approach employs dynamic nuclear polarization (DNP) performed within narrow spectral windows [14, 15] (Fig. 1C). We demonstrate that this permits globally mapping the NV DOS into populations (Fig. 1B). A key contribution here is uncovering the physical basis behind this process, and hence Eq. (1); we accomplish this by viewing the system dynamics in Fig. 1A, manifesting as traversals through a cascade of Landau-Zener (LZ) anti-crossings, to the analogous operation of a “Galton board” which ultimately yields analytic solutions.
System – Experiments here are carried out on a single-crystal sample with an ensemble of 1ppm NV centers (Fig. 1A). The NV spectrum (red line in Fig. 1B) is constructed out of both homogeneous and inhomogeneous contributions: the former primarily due to interactions with lattice nuclei, and the latter on account of strain and orientational effects [18]. Fig. 1B, for instance, describes the spectral DOS in window (purple) arising from an NV center hierarchically coupling to multiple nuclei [19].
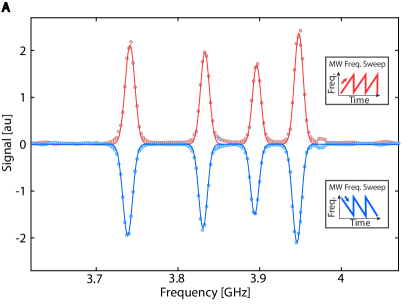
Our strategy to map the electronic spectrum is outlined in Fig. 1C. DNP is applied via chirped MWs [14, 15] in a window (Fig. 1B) over to transfer the corresponding information to population differences. This typically involves MW sweeps (left panel of Fig. 1C), during which polarization is accumulated in the nuclei. Fig. 2 demonstrates that the corresponding polarization closely tracks the electronic DOS in the window swept (see Fig. 1B). A novelty in this work with respect to previous reports [20, 21] is the enhanced signal-to-noise (SNR) readout of the nuclei. We employ a pulsed spin-locking protocol [22, 23] (right panel of Fig. 1C) that allows the populations to be continuously interrogated for long periods up to the limit set by the rotating-frame lifetimes, typically s [16]. It consists of a train of -pulses spin-locked with the initial spin state (Fig. 1C), simultaneously inhibiting dipolar interactions and e-induced dephasing. Inductive readout (with bandwidth 10kHz) occurs after every pulse (red line in Fig. 1C); typical experiments involve 100k pulses. This yields a readout SNR that is boosted by times [16] with respect to traditional free induction decay (FID) measurements. Fig. 1D shows a representative single-shot signal obtained using a MHz window. Fig. 1D(i) shows the corresponding time-domain signal, and for comparison, the fast-decaying FID readout. We estimate here a single-shot SNR by comparing to the noise level at the spectral wing (Fig. 1D(ii)).
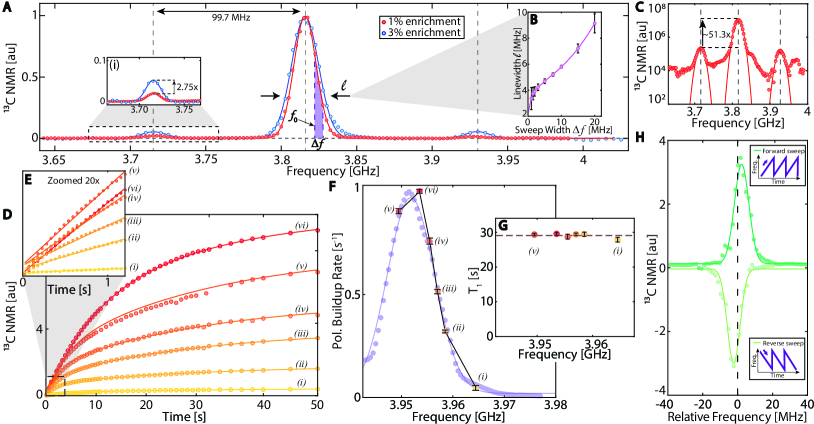
NV spectral map – Fig. 2 elucidates results of spectral mapping. In Fig. 2A, we consider two single crystal samples with enrichment levels at 1% (red) and 3% (blue) respectively. Points here denote the single-shot inductively detected signal intensity at 7T following Fig. 1C with 10MHz (purple window). The high SNR data traces the underlying NV electronic DOS with excellent fidelity (solid lines are Gaussian fits), reflecting that the map in Eq. (1) is indeed viable. For instance, there is no measurable signal (to within noise) for where the NV spectral DOS is zero. Intriguingly, however, for a window even in the wing of the spectrum (purple window in Fig. 1B), the signal reflects .
We observe two satellites, offset at MHz from the spectral center (zoomed in Fig. 2A(i)). We identify them as arising from NV centers possessing a nucleus in the first shell [24]; the high SNR readout here allows them to be easily discerned despite their low concentration ( of all NV centers in the 1% enriched sample). Fig. 2A(i) shows that while we probe only bulk nuclei (hyperfine shifted by 10kHz), one can unravel information via polarization funneled into them from NV-proximal nuclei. Fig. 2C shows data for the 1% enriched sample in a logarithmic scale; the ratio of the satellite and main peak intensities (0.02) approximately follows the expected 3.3% concentration. Returning to Fig. 2A, it is evident that increasing enrichment yields a larger electronic spectral broadening [25] and increased (relative) satellite intensity, both as theoretically predicted. Fig. 2B describes the measured spectral linewidth (arrows in Fig. 2A), as a function of the sweep window employed. It increases approximately linearly with , as expected from Eq. (1), and saturates at MHz, which correlates with the linewidth due to strain-broadening [26]. Error bars here are obtained from the Gaussian fits.
Some key features of the spectra in Fig. 2A are worth mentioning. Here, the NV center families have their NV axes at 54∘ to the bias field : a regime of strong misorientation where ODMR suffers significant () contrast loss [10]. RF readout here is background free, and spin-locking provides a significantly higher SNR compared to previous reports [27, 28, 20, 21]. As opposed to solid-effect DNP [29] or that obtained at the NV ESLAC [30, 28], the sign of the NMR signals obtained via Fig. 1C is identical for the entire spectrum in Fig. 2A [31]. This makes unraveling the electronic spectra feasible even when they are inhomogeneously broadened (see Fig. 4).
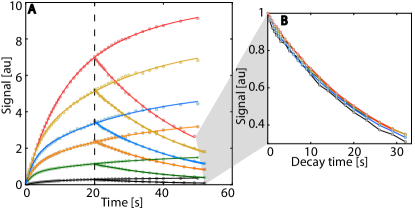
What is the physical origin of a higher polarization for a spectral point at the peak in Fig. 2A versus at the wing? Insight is provided by Fig. 2D-E which consider how the growth of nuclear polarization relates to the electronic DOS. We study polarization buildup curves for representative points on the spectrum (marked (i)-(vi) in Fig. 2F) for the natural abundance (1%) sample. Indeed, the points in Fig. 2A reflect a slice of this data at s. Polarization buildup reflects an interplay between spin injection into directly hyperfine coupled nuclei, spin diffusion, and relaxation. To a good approximation, relaxation rates are determined by interactions with paramagnetic impurities (P1 centers) [32, 25], and are independent of the spectral location being probed. This is shown in Fig. 2G, where we find s (dashed line) independent of (see [33]). Similarly, spin diffusion rates, driven by internuclear interactions, can be considered to be independent of [34]. One expects then that data in Fig. 2A arises from differences in polarization injection rates conditioned on , this in turn produces the frequency-dependent polarization levels and yields Eq. (1). Experiments in Fig. 2D-F confirm this intuition. We restrict attention to short-time (1s) buildup (zoomed in Fig. 2E) and linearize the corresponding polarization growth curves (solid lines) to extract the injection rate. Normalizing and overlaying these values (colored points) on the normalized -interrogated NV electronic spectra in Fig. 2F (lighter purple points) shows that the polarization injection rates produce the signal differences that tracks .
Finally, Fig. 2H illustrates the result of an experiment similar to Fig. 2A (with 3MHz), but focused on a single NV center family and employing alternate MW sweeps conditions [14, 31] (low-to-high or high-to-low frequency). Both cases in Fig. 2H reflect the electronic spectrum, but with an opposite sign. There is a small observable shift (2.3MHz) from the spectral center.
“Galton board” hyperpolarization – Experiments in Fig. 2 give rise to the intriguing question: why is the map in Eq. (1), even if just approximate, possible at all? This can be recast to asking why DNP in a window in the wing of the spectrum (as in the purple window in Fig. 2A) should produce a signal tracking . Modeling polarization transfer at the spectral wing requires the ability to solve dynamics for an electron coupled to multiple () nuclei (as in Fig. 1A-B) under a MW sweep. This requires extending analytic descriptions of DNP mechanisms beyond commonly considered - or -- systems [29, 35, 31, 36]. Here we develop an approach to make such solutions tractable at large . A companion paper [37] elucidates this theory in greater detail; here we present its salient aspects and connections to experiments.
The instantaneous Hamiltonian of the e-n system at a particular frequency along the MW sweep is,
| (2) |
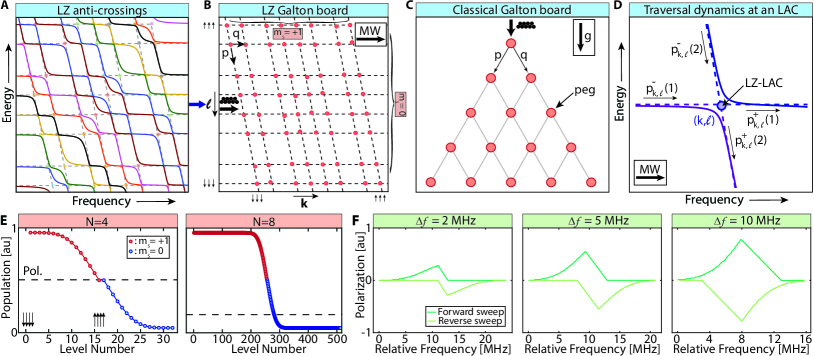
where we restrict attention to the manifold, ignore internuclear interactions, and where =2.87GHz is the NV center zero field splitting, is the electronic Rabi frequency, and are projection operators. The eigenenergies of manifest as a cascade of LZ-LACs, the number of which scale exponentially with . Fig. 3A shows this for a representative example of and positive hyperfine couplings .
Modeling experiments in Fig. 2A requires a machinery to track the nuclear populations as this LZ cascade is traversed. We first extract the LAC points to a 2D checkerboard (Fig. 3B) of energy and frequency (axes labeled and ), and identify their corresponding energy gaps as . Upon optical pumping, the initial nuclear populations are equally distributed among nuclear states in the manifold. Then under the MW sweep, the nuclear populations traverse through and redistribute down or right at every LAC (Fig. 3B). These traversals can be viewed as analogous to the operation of a classical Galton board [38, 39] (Fig. 3C) in which balls fall through a system of pegs under gravity, encountering which they bounce left or right. In a similar manner, the LACs in Fig. 3B form the “pegs”, the “balls” are the nuclear populations, and the swept MWs provide the driving force. The probability of population bifurcation “right” at each LAC is conditioned on the size of the energy gap , and given by the tunneling probability , where is the MW sweep rate. Downward bifurcation then has probability . The energy gaps are the largest on the checkerboard, making traversals through them approximately adiabatic.
We assume that the LACs in Fig. 3B are hit sequentially due to the tilted nature of the LZ Galton board, and that despite continuous action of the laser, electronic repolarization happens far away from the LACs. If and are two-element column vectors denoting the nuclear populations entering or leaving the LAC (Fig. 3D), then where is a transfer matrix [40, 41] describing the bifurcation of populations analogous to a Galton board. Traversals through LACs as in Fig. 3A can then be recursively solved as, where the operators, describe “walks” down and right through the board in Fig. 3B. Ultimately, one can quantify the traversal probability between two points with coordinates and in as [37],
| (3) |
where represents the total number of paths v involved, defined by the nearest neighbor vertices such that , and the coefficients,
| (4) |
After the action of the laser that resets the NV to , the population of any nuclear state is, where indexes in a Hamming ordering. Consequently, the nuclear hyperpolarization in Eq. (1) and measured in experiments in Fig. 2A takes the form,
| (5) |
for . The alternate case of is shown to produce no hyperpolarization in the manifold [37].
Drawing the analogy to the classical Galton board to yield the solution procedure in Eq. (3)-Eq. (5) for the coupled e- system in Fig. 1A is a key result of this work. It permits an analytical (or numerical) means to evaluate traversals through the full checkerboard in Fig. 3B, or in narrow window through it (as in Fig. 2A). Consider first the solution of the full sweep through . Assuming the probability of redistribution down and right to be and respectively at every LAC and that the large energy gaps yield adiabatic traversals (), assumptions that do not alter the essential physics of the problem, the probability of ending in the nuclear state after a full MW sweep can be analytically written as [37]:
| (6) |
where represents the combinatoric operator and is a constant equal to 1 when and 0 otherwise. Eq. (6) alludes to the binomial nature of Galton board traversals [42] and provides insight into the physics of the polarization transfer process. Solutions to and are displayed in Fig. 3E, showing populations of the numbered nuclear states in the and manifolds (blue and red points respectively). Representative nuclear states are marked. As is evident, traversal through the Galton board in Fig. 3B is “biased”, resulting in the hyperpolarization denoted by the horizontal dashed lines in Fig. 3E.
In a similar manner, one can carry out calculations of traversal through a narrow window on the LZ Galton board (Fig. 2A). While an analytic solution is tractable, it is unwieldy and here we resort to a numerical solution assuming an exemplary Gaussian distribution of energy levels (with width 13.5MHz) in the manifold as in Fig. 1B. The edge of the window () is swept in an analogous fashion to the experiments in Fig. 2A, and nuclear populations are calculated following Eq. (3)-Eq. (5). Fig. 3F demonstrates the result for varying and under alternate sweep conditions. We observe that the polarization levels approximately track the Gaussian DOS , qualitatively matching the experimental results in Fig. 2. Intuitively, this is because the Galton board operation “moves” nuclear populations following the underlying distribution . Larger windows (panels left-to-right in Fig. 3F) yield a broader spectrum, and opposite sweeps produce an alternate hyperpolarization sign (Fig. 3F). These match the experimental observations in Fig. 2B and Fig. 2H.
Outlook and conclusions — This work opens many interesting future directions. Fig. 2A suggests the possibility to perform “ESR-via-NMR”, portending avenues to probe electronic spins via nuclei coupled to them. We envision applications in dilute electronic systems or photopolarizable radicals [43], where ESR spectra may be inaccessible, but where information can be instead relayed to more abundant, longer-lived nuclear spins to be readout. Such “one-to-many” spectral maps also suggest applications in quantum memories [44].
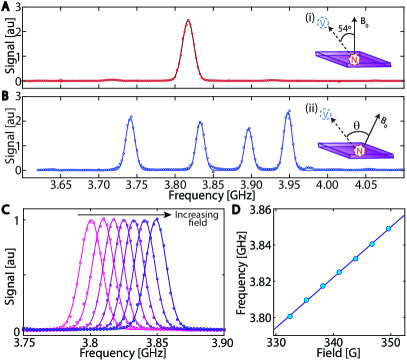
From a technological perspective, we envision applications in RF () interrogated NV-center magnetometry, without the use of a MW cavity [45]. As opposed to optical NV sensors, this can permit DC magnetometers that function in turbid or scattering media and with arbitrarily oriented crystals. Fig. 4 demonstates a proof-of-concept, employing NV maps for bulk DC magnetometry underwater, a regime with several applications (e.g. undersea magnetic anomaly detection [46]), but where current quantum sensor technologies are not viable. Fig. 4A-B shows NV spectra for samples placed under mL of water, corresponding to about 2000-fold the volume of the sample. Here the four NV axes are identically aligned at 54∘ to the bias field (Fig. 4A) and arbitrarily oriented (Fig. 4B). We clarify that only the sample (and not the excitation and detection apparatus) is submerged, but these experiments suggest that fully underwater quantum sensor magnetometers are feasible.
DC magnetometry can be carried out by monitoring the NV spectral shift under an applied probe field . Fig. 4C-D shows the resulting individual -interrogated spectra, from where we estimate an underwater DC sensitivity . Sensitivity is governed by the NMR readout SNR, which is still limited here due to the relatively low NMR coil filling-factor (0.004), hyperpolarization level (0.2%) and small readout time (0.3s) with respect to the dead-time. These factors can be considerably improved with advancements to the experimental apparatus (see Ref. [16]); we estimate a sensitivity improvement by four orders of magnitude is feasible. Fig. 4B also suggests underwater vector magnetometry exploiting the four NV center families simultaneously [47].
In conclusion, we have demonstrated a technique to readout electronic spectra by mapping them to spin population differences in surrounding nuclear spins via DNP. We applied this to mapping the NV center spectrum into the spin polarization levels. We showed that this physically originates from the DNP process stemming from traversals of cascaded structure of LZ anti-crossings. In an analogy to the operation of a “Galton board”, we showed that these traversals can be analytically solved, yielding a means to extract the resulting hyperpolarization levels in the nuclear spins coupled to the NV center. Finally, we demonstrated practical applications of the method for underwater bulk-diamond DC magnetometry. We envision applications of the spectral mapping technique introduced here to a broader class of hybrid quantum systems.
We acknowledge discussions with J. Reimer, S. Bhave, P. Zangara, C. Meriles and D. Suter. This work is funded by ONR under contract N00014-20-1-2806.
References
- Degen et al. [2017] C. L. Degen, F. Reinhard, and P. Cappellaro, Quantum sensing, Reviews of modern physics 89, 035002 (2017).
- Jelezko and Wrachtrup [2006] F. Jelezko and J. Wrachtrup, Single defect centres in diamond: A review, Physica Status Solidi (A) 203, 3207 (2006).
- Taylor et al. [2008] J. M. Taylor, P. Cappellaro, L. Childress, L. Jiang, D. Budker, P. R. Hemmer, A. Yacoby, R. Walsworth, and M. D. Lukin, High-sensitivity diamond magnetometer with nanoscale resolution, Nature Phys. 4, 810 (2008).
- Jelezko et al. [2004] F. Jelezko, T. Gaebel, I. Popa, M. Domhan, A. Gruber, and J. Wrachtrup, Observation of coherent oscillation of a single nuclear spin and realization of a two-qubit conditional quantum gate, Phys. Rev. Lett. 93, 130501 (2004).
- Manson et al. [2006] N. B. Manson, J. P. Harrison, and M. J. Sellars, Nitrogen-vacancy center in diamond: Model of the electronic structure and associated dynamics, Phys. Rev. B 74, 104303 (2006).
- Gali et al. [2008] A. Gali, M. Fyta, and E. Kaxiras, Ab initio supercell calculations on nitrogen-vacancy center in diamond: Electronic structure and hyperfine tensors, Phys. Rev. B 77, 155206 (2008).
- Pham et al. [2011] L. M. Pham, D. L. Sage, P. L. Stanwix, T. K. Yeung, D. Glenn, A. Trifonov, P. Cappellaro, P. R. Hemmer, M. D. Lukin, H. Park, A. Yacoby, and R. L. Walsworth, Magnetic field imaging with nitrogen-vacancy ensembles, New J. Phys. 13, 045021 (2011).
- Barry et al. [2020] J. F. Barry, J. M. Schloss, E. Bauch, M. J. Turner, C. A. Hart, L. M. Pham, and R. L. Walsworth, Sensitivity optimization for nv-diamond magnetometry, Reviews of Modern Physics 92, 015004 (2020).
- Tetienne et al. [2012] J. Tetienne, L. Rondin, P. Spinicelli, M. Chipaux, T. Debuisschert, J. Roch, and V. Jacques, Magnetic-field-dependent photodynamics of single nv defects in diamond: an application to qualitative all-optical magnetic imaging, New Journal of Physics 14, 103033 (2012).
- Rondin et al. [2014] L. Rondin, J.-P. Tetienne, T. Hingant, J.-F. Roch, P. Maletinsky, and V. Jacques, Magnetometry with nitrogen-vacancy defects in diamond, Reports on progress in physics 77, 056503 (2014).
- Le Sage et al. [2012] D. Le Sage, L. M. Pham, N. Bar-Gill, C. Belthangady, M. D. Lukin, A. Yacoby, and R. L. Walsworth, Efficient photon detection from color centers in a diamond optical waveguide, Phys. Rev. B 85, 121202 (2012).
- Shields et al. [2015] B. Shields, Q. Unterreithmeier, N. De Leon, H. Park, and M. Lukin, Efficient readout of a single spin state in diamond via spin-to-charge conversion, Physical review letters 114, 136402 (2015).
- Siyushev et al. [2019] P. Siyushev, M. Nesladek, E. Bourgeois, M. Gulka, J. Hruby, T. Yamamoto, M. Trupke, T. Teraji, J. Isoya, and F. Jelezko, Photoelectrical imaging and coherent spin-state readout of single nitrogen-vacancy centers in diamond, Science 363, 728 (2019).
- Ajoy et al. [2018a] A. Ajoy, K. Liu, R. Nazaryan, X. Lv, P. R. Zangara, B. Safvati, G. Wang, D. Arnold, G. Li, A. Lin, et al., Orientation-independent room temperature optical 13c hyperpolarization in powdered diamond, Sci. Adv. 4, eaar5492 (2018a).
- Ajoy et al. [2018b] A. Ajoy, R. Nazaryan, K. Liu, X. Lv, B. Safvati, G. Wang, E. Druga, J. Reimer, D. Suter, C. Ramanathan, et al., Enhanced dynamic nuclear polarization via swept microwave frequency combs, Proceedings of the National Academy of Sciences 115, 10576 (2018b).
- Beatrez et al. [2021] W. Beatrez, O. Janes, A. Akkiraju, A. Pillai, A. Oddo, P. Reshetikhin, E. Druga, M. McAllister, M. Elo, B. Gilbert, et al., Floquet prethermalization with lifetime exceeding 90s in a bulk hyperpolarized solid, arXiv preprint arXiv:2104.01988 (2021).
- Lv et al. [2021] X. Lv, J. H. Walton, E. Druga, F. Wang, A. Aguilar, T. McKnelly, R. Nazaryan, F. L. Liu, L. Wu, O. Shenderova, et al., Background-free dual-mode optical and 13c magnetic resonance imaging in diamond particles, Proceedings of the National Academy of Sciences 118 (2021).
- Ajoy et al. [2020] A. Ajoy, R. Nazaryan, E. Druga, K. Liu, A. Aguilar, B. Han, M. Gierth, J. T. Oon, B. Safvati, R. Tsang, et al., Room temperature “optical nanodiamond hyperpolarizer”: Physics, design, and operation, Review of Scientific Instruments 91, 023106 (2020).
- Ajoy et al. [2019a] A. Ajoy, U. Bissbort, D. Poletti, and P. Cappellaro, Selective decoupling and hamiltonian engineering in dipolar spin networks, Physical Review Letters 122, 013205 (2019a).
- Álvarez et al. [2015] G. A. Álvarez, C. O. Bretschneider, R. Fischer, P. London, H. Kanda, S. Onoda, J. Isoya, D. Gershoni, and L. Frydman, Local and bulk 13c hyperpolarization in nitrogen-vacancy-centred diamonds at variable fields and orientations, Nature communications 6 (2015).
- Wunderlich et al. [2017] R. Wunderlich, J. Kohlrautz, B. Abel, J. Haase, and J. Meijer, Room temperature bulk diamond 13-c hyperpolarisation–strong evidence for a complex four spin coupling, arXiv preprint arXiv:1703.09243 (2017).
- Rhim et al. [1974] W.-K. Rhim, D. D. Elleman, K. U. Schreiber, and R. W. Vaughan, Analysis of multiple pulse nmr in solids. ii, J. Chem. Phys. 60, 4595 (1974).
- Rhim et al. [1976] W.-K. Rhim, D. Burum, and D. Elleman, Multiple-pulse spin locking in dipolar solids, Physical Review Letters 37, 1764 (1976).
- Rao and Suter [2016] K. R. K. Rao and D. Suter, Characterization of hyperfine interaction between an nv electron spin and a first-shell c 13 nuclear spin in diamond, Physical Review B 94, 060101 (2016).
- Ajoy et al. [2019b] A. Ajoy, B. Safvati, R. Nazaryan, J. Oon, B. Han, P. Raghavan, R. Nirodi, A. Aguilar, K. Liu, X. Cai, et al., Hyperpolarized relaxometry based nuclear t 1 noise spectroscopy in diamond, Nature communications 10, 1 (2019b).
- Acosta et al. [2009] V. M. Acosta, E. Bauch, M. P. Ledbetter, C. Santori, K.-M. C. Fu, P. E. Barclay, R. G. Beausoleil, H. Linget, J. F. Roch, F. Treussart, S. Chemerisov, W. Gawlik, and D. Budker, Diamonds with a high density of nitrogen-vacancy centers for magnetometry applications, Phys. Rev. B 80, 115202 (2009).
- Parker et al. [2019] A. J. Parker, K. Jeong, C. E. Avalos, B. J. Hausmann, C. C. Vassiliou, A. Pines, and J. P. King, Optically pumped dynamic nuclear hyperpolarization in c 13-enriched diamond, Physical Review B 100, 041203 (2019).
- Pagliero et al. [2018] D. Pagliero, K. K. Rao, P. R. Zangara, S. Dhomkar, H. H. Wong, A. Abril, N. Aslam, A. Parker, J. King, C. E. Avalos, et al., Multispin-assisted optical pumping of bulk c 13 nuclear spin polarization in diamond, Physical Review B 97, 024422 (2018).
- Hovav et al. [2010] Y. Hovav, A. Feintuch, and S. Vega, Theoretical aspects of dynamic nuclear polarization in the solid state–the solid effect, Journal of Magnetic Resonance 207, 176 (2010).
- Fischer et al. [2013] R. Fischer, C. O. Bretschneider, P. London, D. Budker, D. Gershoni, and L. Frydman, Bulk nuclear polarization enhanced at room temperature by optical pumping, Physical review letters 111, 057601 (2013).
- Zangara et al. [2019] P. R. Zangara, S. Dhomkar, A. Ajoy, K. Liu, R. Nazaryan, D. Pagliero, D. Suter, J. A. Reimer, A. Pines, and C. A. Meriles, Dynamics of frequency-swept nuclear spin optical pumping in powdered diamond at low magnetic fields, Proceedings of the National Academy of Sciences , 201811994 (2019).
- Reynhardt et al. [1998] E. C. Reynhardt, G. L. High, and J. A. van Wyk, Temperature dependence of spin-spin and spin-lattice relaxation times of paramagnetic nitrogen defects in diamond, The Journal of Chemical Physics 109, 8471 (1998).
- [33] See supplementary online material.
- Abragam [1961] A. Abragam, Principles of Nuclear Magnetism (Oxford Univ. Press, 1961).
- Thurber and Tycko [2012] K. R. Thurber and R. Tycko, Theory for cross effect dynamic nuclear polarization under magic-angle spinning in solid state nuclear magnetic resonance: the importance of level crossings, The Journal of chemical physics 137, 084508 (2012).
- Hovav et al. [2012] Y. Hovav, A. Feintuch, and S. Vega, Theoretical aspects of dynamic nuclear polarization in the solid state–the cross effect, Journal of Magnetic Resonance 214, 29 (2012).
- Elanchezhian et al. [2021] M. Elanchezhian, A. Pillai, T. Virtanen, and A. Ajoy, “galton board” nuclear hyperpolarization, arXiv preprint arXiv:2110.05742 (2021).
- Bouwmeester et al. [1999] D. Bouwmeester, I. Marzoli, G. P. Karman, W. Schleich, and J. Woerdman, Optical galton board, Physical Review A 61, 013410 (1999).
- Chernov and Dolgopyat [2007] N. Chernov and D. Dolgopyat, Diffusive motion and recurrence on an idealized galton board, Physical review letters 99, 030601 (2007).
- Katsidis and Siapkas [2002] C. C. Katsidis and D. I. Siapkas, General transfer-matrix method for optical multilayer systems with coherent, partially coherent, and incoherent interference, Applied optics 41, 3978 (2002).
- Troparevsky et al. [2010] M. C. Troparevsky, A. S. Sabau, A. R. Lupini, and Z. Zhang, Transfer-matrix formalism for the calculation of optical response in multilayer systems: from coherent to incoherent interference, Optics express 18, 24715 (2010).
- Lue and Brenner [1993] A. Lue and H. Brenner, Phase flow and statistical structure of galton-board systems, Physical Review E 47, 3128 (1993).
- Rugg et al. [2019] B. K. Rugg, M. D. Krzyaniak, B. T. Phelan, M. A. Ratner, R. M. Young, and M. R. Wasielewski, Photodriven quantum teleportation of an electron spin state in a covalent donor–acceptor–radical system, Nature chemistry 11, 981 (2019).
- Bradley et al. [2019] C. Bradley, J. Randall, M. H. Abobeih, R. Berrevoets, M. Degen, M. Bakker, M. Markham, D. Twitchen, and T. H. Taminiau, A ten-qubit solid-state spin register with quantum memory up to one minute, Physical Review X 9, 031045 (2019).
- Eisenach et al. [2021] E. R. Eisenach, J. F. Barry, M. F. O’Keeffe, J. M. Schloss, M. H. Steinecker, D. R. Englund, and D. A. Braje, Cavity-enhanced microwave readout of a solid-state spin sensor, Nature communications 12, 1 (2021).
- Ge et al. [2020] J. Ge, W. Luo, H. Dong, H. Liu, H. Wang, W. Wang, Z. Yuan, J. Zhu, and H. Zhang, Towed overhauser marine magnetometer for weak magnetic anomaly detection in severe ocean conditions, Review of Scientific Instruments 91, 035112 (2020).
- Schloss et al. [2018] J. M. Schloss, J. F. Barry, M. J. Turner, and R. L. Walsworth, Simultaneous broadband vector magnetometry using solid-state spins, Physical Review Applied 10, 034044 (2018).
Supplementary Information
Electron-to-nuclear spectral mapping via “Galton board” dynamic nuclear polarization
Arjun Pillai, Moniish Elanchezhian, Teemu Virtanen, Sophie Conti and Ashok Ajoy
Department of Chemistry, University of California, Berkeley, Berkeley, CA 94720, USA.
I Extended Data
Extended data for Fig. 2 and Fig. 4 of the main paper are shown in Fig. S1 and Fig. S2. First, Fig. S1 considers data corresponding to Fig. 4B of the main paper for an arbitrarily oriented diamond crystal showing the four NV center families. We note that for each family, the -obtained NV ESR spectrum is of the same sign, which is opposite for the two MW sweep directions. This highlights the main property that makes it easy to uncover the electronic spectrum in spite of the spectra having inhomogenously broadened components.
Fig. S2A shows the raw data corresponding to Fig. 2G of the main paper. Here, for different parts of the ESR spectrum (shown in Fig. 2F) of the paper, we determine the polarization buildup characteristics at a bias field (also shown in Fig. 2D). After 20s of polarization injection (dashed line), the spins are then allowed to relax at the same bias field . This relaxation data is normalized and shown in Fig. S2B, from where it is evident that the relaxation characteristics are independent of the NV ESR spectral location being originally polarized. The extracted time constants of this decay were plotted in Fig. 2G of the main paper.