POLE: Polarized Embedding for Signed Networks
Abstract.
From the 2016 U.S. presidential election to the 2021 Capitol riots to the spread of misinformation related to COVID-19, many have blamed social media for today’s deeply divided society. Recent advances in machine learning for signed networks hold the promise to guide small interventions with the goal of reducing polarization in social media. However, existing models are especially ineffective in predicting conflicts (or negative links) among users. This is due to a strong correlation between link signs and the network structure, where negative links between polarized communities are too sparse to be predicted even by state-of-the-art approaches. To address this problem, we first design a partition-agnostic polarization measure for signed graphs based on the signed random-walk and show that many real-world graphs are highly polarized. Then, we propose POLE (POLarized Embedding for signed networks), a signed embedding method for polarized graphs that captures both topological and signed similarities jointly via signed autocovariance. Through extensive experiments, we show that POLE significantly outperforms state-of-the-art methods in signed link prediction, particularly for negative links with gains of up to one order of magnitude.
1. Introduction
Social media has made our world more polarized (Tucker et al., 2018; Gillani et al., 2018; Garimella and Weber, 2017). The events surrounding the 2016 U.S. election (Guess et al., 2018) and, more recently, the tragic U.S. Capitol riot (Prabhu et al., 2021) and spread of COVID-19 misinformation (Naeem et al., 2021; M. Otala et al., 2021), have illustrated the dangers of a deeply ideologically divided society. But if technology has led to the rise of polarization, can it also help us to solve it? More specifically, can recent advances in representation learning (Perozzi et al., 2014; Javari et al., 2020) help us to address online polarization? One could argue these methods should be as effective for predicting conflicts as they are for recommending connections and content in social media platforms (Goyal and Ferrara, 2018). However, we will show that polarization leads to new challenges for representation learning.
Signed graphs are a powerful tool for analyzing social polarization, capturing both positive (friendly) and negative (hostile) connections between entities. They have been used to model relationships between politicians in the U.S. Congress (Thomas et al., 2006) and interactions between Twitter users on political matters (Lai et al., 2018), both of which are known to harbor polarization (Theriault, 2006; Conover et al., 2011). In signed graphs, polarization is often related to the emergence of conflicting communities (Bonchi et al., 2019), where nodes within each community form dense positive connections and nodes across different communities are sparsely connected via negative links. Figure 1 shows two signed graphs with the same underlying topology (based on the LFR benchmark (Lancichinetti et al., 2008)) but different link signs. The left graph is more polarized as all of its negative links connect the two communities, while link signs in the right graph are unrelated to the community structure.
To fight polarization, we first need to measure it. Existing measures (Bonchi et al., 2019; Tzeng et al., 2020) are defined as objective functions for community detection, requiring community memberships as input. This dependence makes those measures less useful for real-world graphs, where ground-truth memberships are often unknown. To solve this problem, we propose a novel polarization measure based on the correlation between unsigned and signed random-walk dynamics. By varying the random-walk length, our measure naturally captures polarized community structure at different scales and does not rely on specific partitions. We will demonstrate its effectiveness in characterizing both node and graph-level polarization.
But how can we fight polarization in a network? For unsigned graphs, one approach is to bridge communities to reduce the effect of echo chambers (Garimella et al., 2017). Signed graphs open new possibilities in this endeavor. In particular, if one can identify potential hostile links that are likely to be formed in the future, they can take preventive measures to reduce further polarization. The success of this approach relies on the accuracy of signed link prediction (Chiang et al., 2011; Hsieh et al., 2012; Wang et al., 2017a), where both existence and signs of future links are inferred. However, while unsigned and signed graph embedding methods have shown success at the related link-level tasks of (unsigned) link prediction (Grover and Leskovec, 2016; Huang et al., 2021) and sign prediction (Wang et al., 2017b; Kim et al., 2018), they cannot be easily combined for signed link prediction in polarized graphs. That is because negative links mostly connect antagonistic communities and are much sparser than positive links, making it nearly impossible to predict their existence with unsigned embedding methods. And without link existence information, even a perfect sign prediction oracle is unable to predict the negative links.
To address the challenges mentioned above, we propose POLE, a novel signed embedding method for polarized graphs. The key feature that distinguishes our method from existing ones is that it captures signed and topological similarities jointly. Specifically, it guarantees that positively related pairs are more similar than unrelated topologically distant pairs, which are in turn more similar than negatively related pairs. This is accomplished by leveraging the signed random-walk that incorporates social balance theory (Heider, 1946) and extending autocovariance similarity (Delvenne et al., 2010; Schaub et al., 2019) to signed graphs. In this way, negative links can be predicted as the most dissimilar node pairs in the graph, at the other end of the similarity spectrum.
To summarize, our main contributions are:
-
•
We design a novel partition-agnostic polarization measure for signed graphs based on the signed random-walk.
-
•
We analyze how existing signed embedding methods fail in signed link prediction for polarized graphs.
-
•
We propose POLE, a novel signed embedding approach for polarized graphs that captures both topological and signed similarities via signed autocovariance.
-
•
We conduct an extensive experimental evaluation of our method on six real-world signed graphs. Results show that POLE significantly outperforms state-of-the-art methods in signed link prediction, especially for negative links.
2. Random-walk on Signed Graphs
We introduce our formulation for random-walks on signed graphs, the basis for our polarization measure and embedding algorithm.
2.1. Notations
A signed undirected weighted graph is a tuple , where denotes the set of nodes and denotes the set of links, with positive and negative signs. The graph is represented by a signed weighted adjacency matrix , with (or ) if a positive (or negative) link of weight connects nodes and , and otherwise. We also use the absolute adjacency matrix to construct the degree matrix/vector / with as the degree of node .
2.2. Signed Random-walk
Random-walks are widely used for unsigned graph embedding due to their ability to capture topological similarity at multiple structural scales. While there have been several attempts to extend random-walks to signed graphs (Jung et al., 2016; Yin et al., 2021), we will define our own version to capture topological and signed similarity jointly and explicitly guarantee polarized similarity consistency—we will discuss this important property in more detail in the next subsection.
We start by recalling random-walks for unsigned graphs. A walk is a sequence of nodes where . The transition probability of the walk is the product of stepwise ones:
| (1) | ||||
Then, the -step random-walk transition probability from node to can be expressed as the sum of the transition probabilities of all length- walks between and , denoted as :
| (2) |
which serves as a measure of topological similarity between and . The Markov time controls the scale of the walk.
For signed graphs, we keep transition probabilities of walks for topological similarity and add an inferred sign for each walk to capture signed similarity, leading to
| (3) |
where determines the sign of the walk between and . We leverage the well-established social balance theory (Heider, 1946) to infer the sign of the walk, which states the famous rule that “an enemy of my enemy is my friend” among other rules. Figure 2 shows examples of signed transitions.
Note that after adding signs to walks, is no longer a probability but rather captures a notion of signed similarity between and . In matrix form, we will still call the signed random-walk transition matrix even though it is not stochastic. A nice property of is that it can be conveniently expressed in terms of the signed adjacency and degree matrices:
| (4) |
where is the identity matrix. We will use the continuous version of the transition matrix in the rest of the paper due to its finer granularity of the Markov time ( instead of ).
2.3. Similarity Consistency
The key advantage of our signed random-walk is that it guarantees polarized similarity consistency, a property critical to signed link prediction in polarized graphs. The consistency of similarity states which type of node pairs should be more similar than other types. For example, unsigned embedding methods satisfy:
Property 1 (Topological similarity consistency).
Topologically close nodes are more similar than topologically distant ones.
And signed embedding methods guarantee:
Property 2 (Signed similarity consistency).
Positively related nodes are more similar than negatively related ones.
These properties enable corresponding link-level downstream tasks, namely (unsigned) link prediction and sign prediction.
The transitions of our signed random-walk as a similarity metric have a stronger consistency guarantee:
Property 3 (Polarized similarity consistency).
Positively related node pairs are more similar than unrelated topologically distant pairs, which are in turn more similar than negatively related pairs.
Property 3 is a direct implication of the transition probability defined in Equation 3. Large positive/negative values of indicate that and are connected via mostly positive/negative paths while small values mean that they are unrelated and topologically distant. Property 3 also holds for a similarity defined by dot products between columns of . More specifically, is large and positive (or negative) if and only if and have transitions of same (or different) sign(s) to a common set of nodes. And the similarity is small if their transitions reach a distinct set of nodes.
3. A Measure of Polarization
In this section, we propose and evaluate a measure of polarization based on the signed random-walks we have just introduced.
3.1. Random-walk Based Polarization
A signed network is polarized if it comprises antagonistic communities with dense positive connections in each community and sparse negative ones across communities. Unlike previous works (Bonchi et al., 2019; Tzeng et al., 2020) that define polarization as a quality measure of graph partitions, our aim is to measure polarization based solely on graph structure. To achieve this, we apply a soft characterization of the polarized community structure in the graph based on signed random-walks.
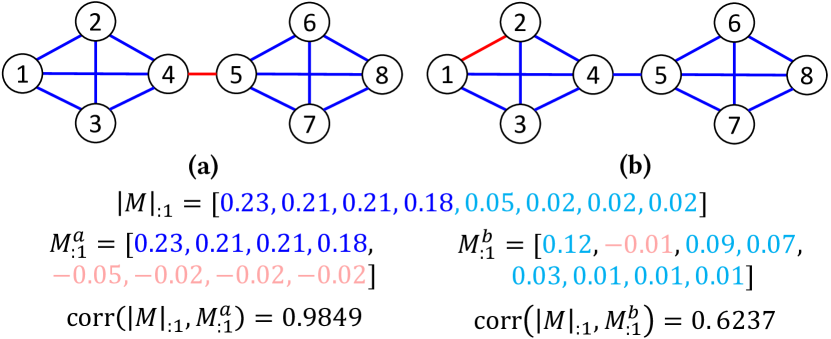
The key observation that supports our polarization measure is that polarization increases the correlation between unsigned and signed random-walk dynamics. Consider the two graphs shown in Figure 3. While they share the same underlying topology, (a) is more polarized than (b) as its negative link connects the two communities. We then analyze how their signed random-walk transitions differ from unsigned ones. For node in graph (a), only signs of its inter-community transitions are changed, whose magnitudes are smaller, if not negligible, compared to the intra-community transitions. On the other hand, the negative link in the less polarized graph (b) significantly affects the signed intra-community transitions. As a consequence, the signed and unsigned transitions in the polarized graph are more correlated than in the less polarized one.
We define the node-level polarization as the (Pearson) correlation between a node’s signed and unsigned random-walk transitions:
| (5) |
We can then define the graph-level polarization as the mean node-level polarization for all nodes in the graph:
| (6) |
The random-walk based polarization proposed here has two main advantages. First, it is partition-agnostic and does not depend on the availability of ground-truth communities or the outcome of community detection algorithms. Second, it can measure polarization at different structural scales by tuning the Markov time —large captures polarization between macro-level communities (e.g., hostility between political parties) while small measures it at a micro scale (e.g., disagreement between factions within a party). In the next subsection, we will demonstrate that our measure is effective in characterizing both node and graph-level polarization.
3.2. Polarization of Real-world Graphs
3.2.1. Node-level polarization
We apply our polarization measure to characterize nodes in a political network (Congress) (Thomas et al., 2006). Signed links in this network represent (un/)favorable interactions between U.S. congresspeople on the House floor in 2005. The statistics of the network are shown in Table 1.
We rank all nodes by their polarization scores at a fixed . The top 20 least and most polarized nodes are shown in Table 3 and Table 3 (both in Appendix A.1). The congressperson with the smallest score () is Henry Cuellar, a self-described moderate-centrist (McCumber, 2014). As a Democrat, he voted with President Trump (Republican) nearly 75% of the time, advocating his fellow Democrats to embrace a more conservative voting record (Malone, 2017). The second least polarized person is Jane Harman (with ). She was described as a centrist, particularly on defense and intelligence issues (Pershing, 2009). She was also once called the best Republican in the Democratic Party (Skelton, 1998). In general, we found that our polarization measure captures the political views (centrists vs. extremists) of the congresspeople based on their signed interactions.
3.2.2. Graph-level polarization
We also apply our graph-level polarization measure to characterize real-world signed graphs. In addition to Congress, we consider five other networks, with their statistics summarized in Table 1:
-
•
WoW-EP8 (Kristof et al., 2020): Interaction network of editors in the eighth legislature of the European Parliament. Link signs indicate whether they collaborate or compete with each other.
-
•
Bitcoin-Alpha and Bitcoin-OTC (Kumar et al., 2016): Trust networks of Bitcoin traders on the platforms Bitcoin Alpha and Bitcoin OTC. Link weights and signs are based on users’ rating of each other.
-
•
Referendum (Lai et al., 2018): Interaction network of Twitter users on the 2016 constitutional referendum in Italy. Link signs are inferred from the stance of the users.
-
•
Wiki-RfA (West et al., 2014): Voting network of Wikipedia users on adminship. Link signs indicate whether users vote for/against each other.
| Congress | 219 | 523 | 20.46% |
|---|---|---|---|
| WoW-EP8 | 789 | 116,009 | 18.63% |
| Bitcoin-Alpha | 3,772 | 14,077 | 9.31% |
| Bitcoin-OTC | 5,872 | 21,431 | 14.71% |
| Referendum | 10,864 | 251,396 | 5.09% |
| Wiki-RfA | 11,275 | 169,925 | 22.04% |
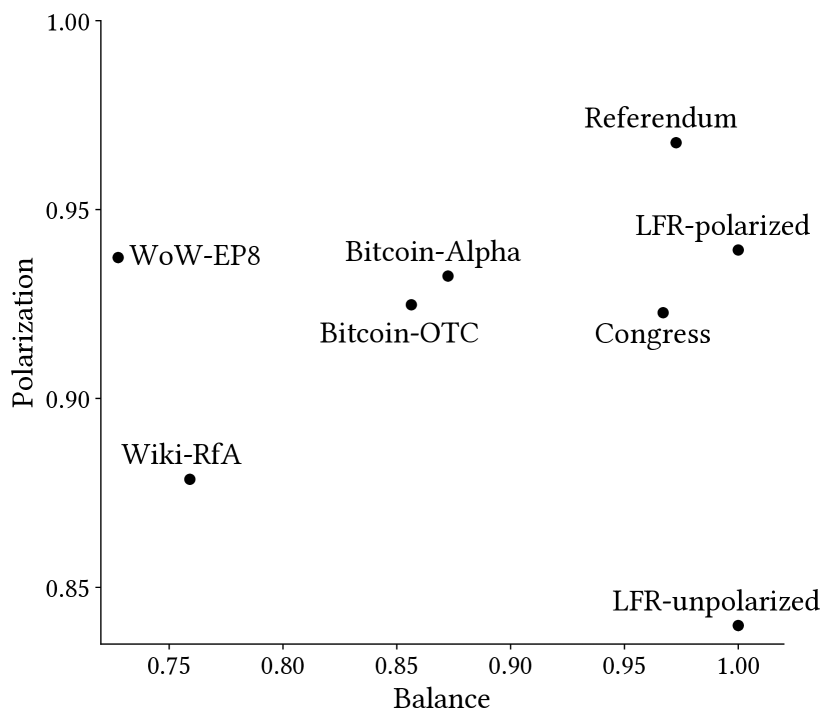
As reference for graph-level polarization, we construct two synthetic graphs, one polarized and the other unpolarized, with the same underlying topology but different link signs, as shown in Figure 1. The topology is based on the LFR benchmark (Lancichinetti et al., 2008) with the following parameters: two structural communities with 50 nodes, an average node degree of 12, and an inter-community link ratio of 0.15. Then, for the polarized version (LFR-polarized), we assign link signs fully based on the structural communities—negative for inter-community links and positive for intra-community links. For the unpolarized version (LFR-unpolarized), we first assign nodes to two random communities with the same cut size as structural communities. We then assign link signs based on the random communities following the same rule. In this way, both graphs have the same proportion of negative links and the same social balance—proportion of closed triangles in the graph that satisfy the social balance theory (Leskovec et al., 2010b)—of 1.0.
The polarization and social balance for the real-world graphs along with the two synthetic ones are shown in Figure 4, with the Markov time selected based on signed link prediction performance (details in Section 5.1.3). As we see, most real-world graphs are at the same level of polarization as LFR-polarized. On the other hand, their social balance is not directly related to polarization, contrary to as one might think (Garimella and Weber, 2017). The only dataset that falls behind in polarization is Wiki-RfA, which might be due to the more collaborative nature of its inter-community interactions. As we will discuss in the next section, effective link prediction for those polarized graphs requires a novel embedding scheme that satisfies polarized similarity consistency.
4. Polarized Embedding for Networks
Now that we have shown that many real-world graphs are polarized, here, we propose a novel embedding method for effectively predicting signed links in polarized graphs. We first demonstrate that existing embedding methods are incapable of this task due to their weak similarity consistency (see Section 2.3). We then introduce polarized embedding based on autocovariance and matrix factorization that addresses the limitations of existing approaches.
4.1. Limitation of Existing Methods
The objective of signed link prediction (Beigi et al., 2019; Xu et al., 2019) is to predict both the existence and the signs of future links given the observed graph. Most of existing signed embedding methods focus on the second half of the task, sign prediction, which is specific to signed graphs. The first half, link prediction, is a common downstream task for unsigned embedding methods. Combining them seems like a viable solution for the task. However, this approach fails to predict negative links in polarized graphs because they are sparse and mostly appear as inter-community connections. They are hard, if not impossible, to be predicted by unsigned link prediction algorithms based on topology only. Without the existence of links known a priori, sign prediction itself is incapable of predicting negative links.
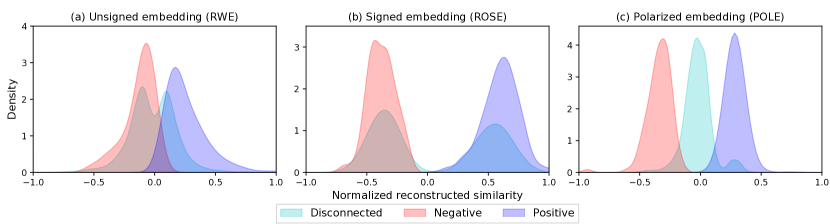
We identify the key weakness of existing embedding methods as that they only preserve weak similarity consistency. In particular, signed embedding methods (Wang et al., 2017b; Islam et al., 2018; Kim et al., 2018; Chen et al., 2018; Xu et al., 2019; Javari et al., 2020) just ensure signed similarity consistency—positively related pairs are separable from negatively related pairs—for sign prediction. And similarly, unsigned embedding methods (Perozzi et al., 2014; Grover and Leskovec, 2016; Huang et al., 2021) only guarantee the topological similarity consistency—topologically close node pairs are separable from distant pairs—for link prediction. While positive links are detectable as the intersection of positive and topologically close pairs, negative links in polarized graphs would remain hidden with other topologically distant pairs. Figure 5 (a) and Figure 5 (b) illustrate this idea. They show the distributions of reconstructed similarity of positively connected pairs, negatively connected pairs, and disconnected pairs for LFR-polarized via dot products of unsigned and signed embedding, respectively. While both embedding methods are able to capture their respective similarity consistency, negative links are always inseparable from disconnected pairs. This motivates us to design an embedding method with a stronger similarity consistency that enables the separation of negative pairs from the others. We describe such an embedding method next.
4.2. The Solution: Polarized Embedding
Our solution to the separability of negative pairs is polarized embedding, a novel embedding scheme that captures polarized similarity consistency, the strongest consistency among the three. This consistency guarantees that negatively related pairs are more dissimilar than unrelated topologically distant pairs (thus “polarized”), which are more dissimilar than positively related pairs. In this way, the negatively related pairs stand out at the other end of the similarity spectrum, easily separable from others. In the following subsections, we introduce our polarized embedding method, POLE, that applies signed autocovariance similarity and matrix factorization.
4.2.1. Signed autocovariance similarity
POLE is based on the signed random-walk introduced in Section 2.2. As discussed in Section 2.3, both the entries and the dot products of columns of the signed random-walk transition matrix can be viewed as similarity metrics that satisfy polarized similarity consistency. Therefore, one can directly use a low-rank representation of them—for example, the matrix factorization of or —as embeddings. However, those embeddings may not be effective for link-level inference. Instead, we propose to take advantage of the random-walk based similarity metrics that have been well understood in unsigned embedding. In particular, it has been shown that autocovariance similarity (Delvenne et al., 2010) enables state-of-the-art performance in unsigned link prediction by incorporating node degree information (Huang et al., 2021). This coincides with our goal of predicting signed links in polarized graphs. Thus, we first extend autocovariance similarity to signed graphs.
The unsigned autocovariance similarity is built upon the co-visiting probability for node pairs in a walk. However, as defined in our signed random-walk, is not a stochastic matrix and does not encode probabilities. Instead, we resort to another interpretation of autocovariance—a centered dynamic similarity metric (Schaub et al., 2019). The dynamic similarity based on is
| (7) |
where is a weight matrix. In the unsigned case, selecting makes equivalent to the autocovariance similarity, where is the stationary distribution of the unsigned random-walk and . For the signed case, is singular if and only if the graph is perfectly balanced (Kunegis et al., 2010). This means that there is no “stationary distribution” for signed random-walks on most real-world graphs. However, as (Lambiotte et al., 2014) points out, the role of stationary distribution in the similarity formulation is to provide a centrality measure—in the unsigned case, the degree centrality. Thus, we can also use node degrees to construct the weight matrix:
| (8) |
where . And substituting this weight matrix into Equation 7 leads to the signed autocovariance similarity matrix. To the best our knowledge, we are the first to extend random-walk based similarity metrics to signed graphs in a principled manner.
4.2.2. Matrix factorization
We are now ready to introduce how to generate embedding based on signed autocovariance. Let be the embedding of node and be the embedding matrix. We use the dot product in the embedding space to preserve the signed autocovariance similarity :
| (9) | ||||
This leads to a straightforward matrix factorization algorithm to find the optimal embedding. Specifically, —where is the Singular Value Decomposition (SVD) of —is the optimal solution of under the constraint (Eckart and Young, 1936).
Figure 5 (c) shows distributions of reconstructed similarity of different types of node pairs for polarized embedding. It is clear that negative pairs can be effectively separated from unrelated and positive pairs. In addition, with negative pairs staying at the negative end of the similarity spectrum, positive pairs are also more separable. This demonstrates the strength of our polarized embedding that captures polarized similarity consistency.
5. Experiments
In this section, we demonstrate the effectiveness of POLE in signed link prediction using the six datasets in Table 1. Our code is available at https://github.com/zexihuang/POLE.
5.1. Experimental Settings
5.1.1. Baselines
We consider the following baselines:
-
•
SiNE (Wang et al., 2017b): Combines an objective function based on social balance theory with a learned pairwise similarity function.
-
•
SIGNet (Islam et al., 2018): Attempts to capture higher-order balance structure by computing embeddings for which dot product approximates the signed proximity for links in the graph.
-
•
SIDE (Kim et al., 2018): Extends random-walk based embedding to signed graphs. Embeddings are learned based on maximum likelihood using pairwise proximities that are sensitive to link signs.
-
•
BESIDE (Chen et al., 2018): Applies balance and status theory to model signed triangles and “bridge” links, which are not included in a triangle.
-
•
SLF (Xu et al., 2019): Decomposes node embeddings into two types of latent factors (positive and negative). These factors, which are learned via coordinate descent, are applied to generate four types of scores corresponding to positive, negative, neutral, and no link.
-
•
ROSE (Javari et al., 2020): Transforms the signed network into an unsigned bipartite one by representing each node multiple times. Embeddings for the unsigned network are generated using a random-walk based approach and combined into signed embeddings.
5.1.2. Downstream task
We focus on signed link prediction, which consists of predicting of both link existence and signs. We randomly remove 20% of links while ensuring that the residual graph is connected and embed the residual graph. Then, for POLE, we rank all disconnected node pairs based on reconstructed dot product similarity and predict the most similar/dissimilar pairs as positive/negative links. For baselines, we follow (Xu et al., 2019) and train two logistic regression classifiers on concatenated node embeddings for positive/negative pairs vs disconnected pairs, respectively. While ranking by classifier scores is adopted by most baselines, we also conduct experiments with baselines using the same dot product similarity ranking as for POLE. The results are similar and included in Appendix A.2. We report precision@k (Lü and Zhou, 2011) for positive/negative links respectively, where is the number of top pairs in terms of the ratio of removed positive/negative links, ranging from 10% to 100%.
Since the baselines are designed to only capture signed similarity consistency and thus may perform poorly without link existence information, we also consider supplementing them with an unsigned embedding method. This also allows us to analyze the interaction between unsigned similarity and the signed similarity captured by our polarized embedding. Specifically, we apply RWE (Huang et al., 2021) with unsigned autocovariance and continuous random-walk and compute the reconstructed similarity based on embeddings for the unsigned residual graph. We then train logistic regression classifiers to combine the unsigned similarity (encoding link existence information) and either reconstructed similarity (for POLE) or classifier scores (for baselines) for final ranking and report precision@k scores.
5.1.3. Parameters
We set the number of embedding dimensions to 40 for all methods (except ROSE which requires a multiple of 3, we set it to 42). The only other parameter in RWE and POLE is the Markov time , which is selected from {} based on signed/unsigned link prediction. Other parameters for baselines are set as recommended in the original papers.
5.2. Results
5.2.1. Signed link prediction
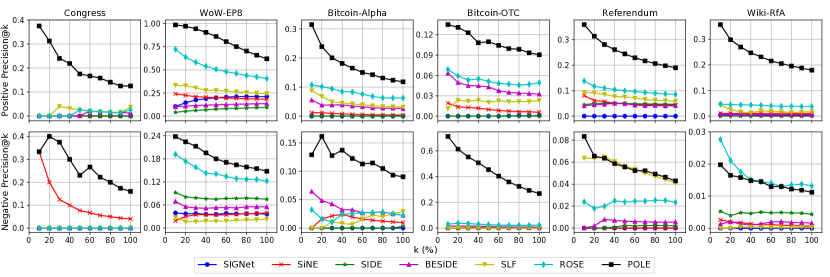
Figure 6 shows the signed link prediction performance for different methods without supplementing the unsigned link existence information. We first note that the proposed method, POLE, outperforms all baselines in almost all datasets for both positive and negative links. The average gains in precision@k over the best baseline for each dataset are 629.2%/58.8%/115.7% /108.3% /142.5%/468.8% on positive links and 220.0%/27.6%/261.8% /1539.4%/4.3%/-10.9% on negative links. This shows that POLE enables state-of-the-art signed link prediction performance.
While the main motivation for POLE is predicting negative links, its superior performance in positive link prediction is also consistent with our previous similarity analysis (see Figure 5 (b) and Figure 5 (c)). The only scenario where POLE underperforms the best baseline is the negative link prediction on Wiki-RfA. This is actually not surprising as Wiki-RfA is the least polarized network among the six, as shown in Figure 4. When the graph is less polarized (e.g., Figure 1 (b)), negative links are formed independently from community structure, and therefore the polarized similarity consistency may not be the best criterion to embed nodes.
5.2.2. Signed link prediction with link existence information
We now supplement each method with unsigned link existence information. Results are shown in Figure 7. Adding unsigned information narrows down the average performance gains of POLE over baselines on positive links to 18.0%/5.1%/4.4%/-6.6%/11.2%/3.5%. But our method still exhibits significant gains on negative links, outperforming the best baseline by 300.0%/93.9%/70.4%/243.8%/29.6%/79.7% for all datasets including the least polarized Wiki-RfA. Even with unsigned link existence information, our polarized embedding method has an edge over existing approaches, especially for negative links.
The notable improvement of baselines after adding unsigned link existence information is consistent with our expectation. For positive links, combining the signed/unsigned embeddings enables the separation of positive pairs from negative/disconnected pairs, respectively, as illustrated in Figure 5 (a) and Figure 5 (b). This boosts baselines to a performance comparable with ours. For negative links, while all baselines still underperform POLE by a large margin, their predictions are improved significantly compared to the scenario without link existence information. The most prominent improvement is observed for Bitcoin-OTC, from negligible precision scores to notable ones of around 0.2 at . This is reasonable since none of the networks are fully polarized, and not all negative links in the networks are inter-community. Those that are intra-community can be correctly predicted by unsigned similarity first and then correct signs can be discovered using the baselines. The inter-community negative links, however, remain exclusively predictable via polarized similarity consistency, for which our polarized embedding method is designed.
At this point, it is important to analyze the interaction between unsigned similarity and our polarized embedding. While the performance for negative links more than doubles on average across the datasets, precision for positive links decreases by an average of 2.9%. To understand this phenomenon, we draw scatter plots of the reconstructed signed and unsigned similarity for different node pairs in signed link prediction, along with the decision boundaries based on each similarity and a combination of both (via the classifier). The results for Referendum and Wiki-RfA are shown in Figure 8, with the rest in Figure 11 in Appendix A.3. For positive pairs, signed and unsigned similarities are highly correlated, and signed similarity alone is predictive enough. This is consistent with the fact that regions above the signed and combined decision boundaries highly overlap. On the other hand, prediction for negative links is clearly improved by combining signed and unsigned similarities. The decision boundaries of the learned classifiers imply that negative pairs should have smaller signed similarity than unsigned similarity. This rule is especially useful as it filters out a large number of disconnected pairs with large negative signed similarity but even larger negative unsigned similarity. Finally, this plot is another illustration of how our method captures polarization. Referendum, the most polarized graph (see Figure 4) of all, shows a clearer separation between positive and negative pairs compared to Wiki-RfA, which is the least polarized.
6. Related Work
Measuring polarization. Social polarization has received great attention with the increasing popularity in online social media (Guerra et al., 2013). In the context of networks/graphs, polarization is often defined as the cohesiveness of communities. Several community quality measures, such as conductance (Kannan et al., 2004) and modularity (Newman, 2006), have been used for analyzing polarization in the U.S. congress (Waugh et al., 2011) and online social media platforms (Conover et al., 2011). Later works consider other measures based on the community structure. For example, (Guerra et al., 2013) measures polarization based on the concentration of high-degree nodes in the community boundaries, and (Garimella et al., 2018) extends it with betweenness and inter-community random-walk transitions. Likewise, polarization in signed graphs is often related to the objective function of signed community detection. In (Bonchi et al., 2019), the authors define polarization as the size-normalized signed cut between two conflicting communities, which is later extended to multiple communities in (Tzeng et al., 2020). The main distinction of our polarization measure compared with existing methods is that it leverages the signed random-walk to capture the community structure at multiple scales and does not require specific community assignments as input.
Signed link prediction. Link prediction is a common inference task for graphs (Lü and Zhou, 2011; Martínez et al., 2016). Link signs in signed graphs add another dimension to the problem, leading to the different tasks of (1) link sign prediction (Leskovec et al., 2010a; Javari and Jalili, 2014; Song and Meyer, 2015), (2) link existence prediction (Yuan et al., 2019; Javari et al., 2020), and (3) signed link prediction (Chiang et al., 2011; Hsieh et al., 2012; Wang et al., 2017a). Signed link prediction is the most challenging one among them, requiring both existence and signs of links to be inferred. Existing signed link prediction methods are based on feature engineering (Chiang et al., 2011), matrix factorization (Hsieh et al., 2012; Ye et al., 2013), and graph embedding (Xu et al., 2019). Due to sparsity of links, several methods also consider side information, including user-item ratings (Beigi et al., 2019), user-user opinions (Beigi et al., 2016, 2019), and user-review ratings (Tang et al., 2014). Our work focuses on signed link prediction in polarized graphs, which is an even harder problem as negative links mostly appear as sparse inter-community connections. Yet by incorporating polarization in the embedding, our method enables state-of-the-art signed link prediction without using additional information.
Signed graph embedding. Signed graph embedding enables the application of classical machine learning algorithms to graph-based downstream tasks, such as signed link prediction (Chiang et al., 2011; Hsieh et al., 2012), node classification (Islam et al., 2018), and polarized community detection (Bonchi et al., 2019; Tzeng et al., 2020). Existing methods are often based on extending unsigned embedding methods (such as those based on random-walks (Perozzi et al., 2014; Grover and Leskovec, 2016)) and incorporating social theories (such as social balance theory (Heider, 1946) and social status theory (Guha et al., 2004)). Both SNE (Yuan et al., 2017) and SIDE (Kim et al., 2018) extend random-walk based objective functions to signed embedding. SiNE (Wang et al., 2017b) incorporates social balance theory and uses a learned pairwise similarity function modeled as a multi-layer neural network. SIGNet (Islam et al., 2018) captures higher-order balance structure with efficient sampling algorithms. BESIDE (Chen et al., 2018) combines social balance theory and social status theory to model triangles and “bridge” links for embedding. SLF (Xu et al., 2019) models each node with four signed latent factors in order to capture positive, negative, neutral, and the absence of a relationship between them. ROSE (Javari et al., 2020) transforms the signed network into a bipartite unsigned network and leverages an existing random-walk based method (Grover and Leskovec, 2016) for embedding. While these methods capture the signed similarity consistency needed for sign prediction (see Figure 5), they are unable to predict negative links in polarized graphs even when combined with unsigned embedding (Huang et al., 2021). By comparison, our polarized embedding preserves polarized similarity consistency and can effectively predict both positive and negative links in real-world signed graphs.
7. Conclusion
We have introduced several analytical tools for understanding and combating polarization in signed graphs. They include a partition-agnostic polarization measure for both nodes and graphs and an embedding algorithm that enables state-of-the-art signed link prediction, especially for the hostile links in polarized graphs. We hope that our work will be an important step towards making social media an environment for healthy and constructive communication among individuals with diverse viewpoints.
Acknowledgements.
This work is partially funded by NSF via grant IIS 1817046 and DTRA via grant HDTRA1-19-1-0017.References
- (1)
- Beigi et al. (2019) Ghazaleh Beigi, Suhas Ranganath, and Huan Liu. 2019. Signed link prediction with sparse data: The role of personality information. In WebConf.
- Beigi et al. (2016) Ghazaleh Beigi, Jiliang Tang, Suhang Wang, and Huan Liu. 2016. Exploiting emotional information for trust/distrust prediction. In SDM.
- Bonchi et al. (2019) Francesco Bonchi, Edoardo Galimberti, Aristides Gionis, Bruno Ordozgoiti, and Giancarlo Ruffo. 2019. Discovering polarized communities in signed networks. In CIKM.
- Chen et al. (2018) Yiqi Chen, Tieyun Qian, Huan Liu, and Ke Sun. 2018. ”Bridge” Enhanced Signed Directed Network Embedding. In CIKM.
- Chiang et al. (2011) Kai-Yang Chiang, Nagarajan Natarajan, Ambuj Tewari, and Inderjit S Dhillon. 2011. Exploiting longer cycles for link prediction in signed networks. In CIKM.
- Conover et al. (2011) Michael D Conover, Jacob Ratkiewicz, Matthew Francisco, Bruno Gonçalves, Filippo Menczer, and Alessandro Flammini. 2011. Political polarization on twitter. In ICWSM.
- Delvenne et al. (2010) J-C Delvenne, Sophia N Yaliraki, and Mauricio Barahona. 2010. Stability of graph communities across time scales. PNAS 107, 29 (2010), 12755–12760.
- Eckart and Young (1936) Carl Eckart and Gale Young. 1936. The approximation of one matrix by another of lower rank. Psychometrika 1, 3 (1936), 211–218.
- Garimella et al. (2017) Kiran Garimella, Gianmarco De Francisci Morales, Aristides Gionis, and Michael Mathioudakis. 2017. Reducing controversy by connecting opposing views. In WSDM.
- Garimella et al. (2018) Kiran Garimella, Gianmarco De Francisci Morales, Aristides Gionis, and Michael Mathioudakis. 2018. Quantifying controversy on social media. TSC 1, 1 (2018), 1–27.
- Garimella and Weber (2017) Venkata Rama Kiran Garimella and Ingmar Weber. 2017. A long-term analysis of polarization on Twitter. In ICWSM.
- Gillani et al. (2018) Nabeel Gillani, Ann Yuan, Martin Saveski, Soroush Vosoughi, and Deb Roy. 2018. Me, my echo chamber, and I: introspection on social media polarization. In WebConf.
- Goyal and Ferrara (2018) Palash Goyal and Emilio Ferrara. 2018. Graph embedding techniques, applications, and performance: A survey. Knowledge-Based Systems 151 (2018), 78–94.
- Grover and Leskovec (2016) Aditya Grover and Jure Leskovec. 2016. node2vec: Scalable feature learning for networks. In SIGKDD. 855–864.
- Guerra et al. (2013) Pedro Calais Guerra, Wagner Meira Jr, Claire Cardie, and Robert Kleinberg. 2013. A measure of polarization on social media networks based on community boundaries. In ICWSM.
- Guess et al. (2018) Andrew Guess, Brendan Nyhan, and Jason Reifler. 2018. Selective exposure to misinformation: Evidence from the consumption of fake news during the 2016 US presidential campaign. European Research Council 9, 3 (2018), 4.
- Guha et al. (2004) Ramanthan Guha, Ravi Kumar, Prabhakar Raghavan, and Andrew Tomkins. 2004. Propagation of trust and distrust. In WebConf.
- Heider (1946) Fritz Heider. 1946. Attitudes and cognitive organization. The Journal of psychology 21, 1 (1946), 107–112.
- Hsieh et al. (2012) Cho-Jui Hsieh, Kai-Yang Chiang, and Inderjit S Dhillon. 2012. Low rank modeling of signed networks. In SIGKDD.
- Huang et al. (2021) Zexi Huang, Arlei Silva, and Ambuj Singh. 2021. A Broader Picture of Random-walk Based Graph Embedding. In SIGKDD.
- Islam et al. (2018) Mohammad Raihanul Islam, B Aditya Prakash, and Naren Ramakrishnan. 2018. Signet: Scalable embeddings for signed networks. In PAKDD.
- Javari et al. (2020) Amin Javari, Tyler Derr, Pouya Esmailian, Jiliang Tang, and Kevin Chen-Chuan Chang. 2020. ROSE: Role-based Signed Network Embedding. In WebConf.
- Javari and Jalili (2014) Amin Javari and Mahdi Jalili. 2014. Cluster-based collaborative filtering for sign prediction in social networks with positive and negative links. TIST 5, 2 (2014), 1–19.
- Jung et al. (2016) Jinhong Jung, Woojeong Jin, Lee Sael, and U Kang. 2016. Personalized ranking in signed networks using signed random walk with restart. In ICDM.
- Kannan et al. (2004) Ravi Kannan, Santosh Vempala, and Adrian Vetta. 2004. On clusterings: Good, bad and spectral. JACM 51, 3 (2004), 497–515.
- Kim et al. (2018) Junghwan Kim, Haekyu Park, Ji-Eun Lee, and U Kang. 2018. Side: representation learning in signed directed networks. In WebConf.
- Kristof et al. (2020) Victor Kristof, Matthias Grossglauser, and Patrick Thiran. 2020. War of words: The competitive dynamics of legislative processes. In WebConf.
- Kumar et al. (2016) Srijan Kumar, Francesca Spezzano, VS Subrahmanian, and Christos Faloutsos. 2016. Edge weight prediction in weighted signed networks. In ICDM.
- Kunegis et al. (2010) Jérôme Kunegis, Stephan Schmidt, Andreas Lommatzsch, Jürgen Lerner, Ernesto W De Luca, and Sahin Albayrak. 2010. Spectral analysis of signed graphs for clustering, prediction and visualization. In SDM.
- Lai et al. (2018) Mirko Lai, Viviana Patti, Giancarlo Ruffo, and Paolo Rosso. 2018. Stance evolution and twitter interactions in an italian political debate. In NLDB.
- Lambiotte et al. (2014) Renaud Lambiotte, Jean-Charles Delvenne, and Mauricio Barahona. 2014. Random walks, Markov processes and the multiscale modular organization of complex networks. IEEE TSNE 1, 2 (2014), 76–90.
- Lancichinetti et al. (2008) Andrea Lancichinetti, Santo Fortunato, and Filippo Radicchi. 2008. Benchmark graphs for testing community detection algorithms. Physical review E 78, 4 (2008), 046110.
- Leskovec et al. (2010a) Jure Leskovec, Daniel Huttenlocher, and Jon Kleinberg. 2010a. Predicting positive and negative links in online social networks. In WebConf.
- Leskovec et al. (2010b) Jure Leskovec, Daniel Huttenlocher, and Jon Kleinberg. 2010b. Signed networks in social media. In SIGCHI.
- Lü and Zhou (2011) Linyuan Lü and Tao Zhou. 2011. Link prediction in complex networks: A survey. Physica A: statistical mechanics and its applications 390, 6 (2011), 1150–1170.
- M. Otala et al. (2021) Jacqueline M. Otala, Gillian Kurtic, Isabella Grasso, Yu Liu, Jeanna Matthews, and Golshan Madraki. 2021. Political Polarization and Platform Migration: A Study of Parler and Twitter Usage by United States of America Congress Members. In Fairness, Accountability, Transparency, Ethics and Society on the Web. 224–231.
- Malone (2017) Clare Malone. 2017. A Q&A with the house Democrat who’s voted with Trump 75 percent of the time. FiveThirtyEight (2017).
- Martínez et al. (2016) Víctor Martínez, Fernando Berzal, and Juan-Carlos Cubero. 2016. A survey of link prediction in complex networks. CSUR 49, 4 (2016), 1–33.
- McCumber (2014) David McCumber. 2014. From the house on the hill: congressman looks back at his life. Laredo Morning Times (2014).
- Naeem et al. (2021) Salman Bin Naeem, Rubina Bhatti, and Aqsa Khan. 2021. An exploration of how fake news is taking over social media and putting public health at risk. Health Information & Libraries Journal 38, 2 (2021), 143–149.
- Newman (2006) Mark EJ Newman. 2006. Modularity and community structure in networks. PNAS 103, 23 (2006), 8577–8582.
- Perozzi et al. (2014) Bryan Perozzi, Rami Al-Rfou, and Steven Skiena. 2014. Deepwalk: Online learning of social representations. In SIGKDD. 701–710.
- Pershing (2009) Ben Pershing. 2009. Pelosi, Harman have long history. The Washington Post (2009).
- Prabhu et al. (2021) Avinash Prabhu, Dipanwita Guhathakurta, Mallika Subramanian, Manvith Reddy, Shradha Sehgal, Tanvi Karandikar, Amogh Gulati, Udit Arora, Rajiv Ratn Shah, Ponnurangam Kumaraguru, et al. 2021. Capitol (Pat) riots: A comparative study of Twitter and Parler. arXiv preprint arXiv:2101.06914 (2021).
- Schaub et al. (2019) Michael T Schaub, Jean-Charles Delvenne, Renaud Lambiotte, and Mauricio Barahona. 2019. Multiscale dynamical embeddings of complex networks. Physical Review E 99, 6 (2019), 062308.
- Skelton (1998) George Skelton. 1998. California and the west: in the ring, with contenders for governor. Los Angeles Times (1998).
- Song and Meyer (2015) Dongjin Song and David A Meyer. 2015. Link sign prediction and ranking in signed directed social networks. Social network analysis and mining 5, 1 (2015), 1–14.
- Tang et al. (2014) Jiliang Tang, Xia Hu, Yi Chang, and Huan Liu. 2014. Predictability of distrust with interaction data. In CIKM.
- Theriault (2006) Sean M Theriault. 2006. Party polarization in the US Congress: Member replacement and member adaptation. Party Politics 12, 4 (2006), 483–503.
- Thomas et al. (2006) Matt Thomas, Bo Pang, and Lillian Lee. 2006. Get out the vote: determining support or opposition from congressional floor-debate transcripts. In EMNLP.
- Tucker et al. (2018) Joshua A Tucker, Andrew Guess, Pablo Barberá, Cristian Vaccari, Alexandra Siegel, Sergey Sanovich, Denis Stukal, and Brendan Nyhan. 2018. Social media, political polarization, and political disinformation: A review of the scientific literature. Technical Report. The William and Flora Hewlett Foundation.
- Tzeng et al. (2020) Ruo-Chun Tzeng, Bruno Ordozgoiti, and Aristides Gionis. 2020. Discovering conflicting groups in signed networks. In NeurIPS.
- Wang et al. (2017a) Jing Wang, Jie Shen, Ping Li, and Huan Xu. 2017a. Online matrix completion for signed link prediction. In WSDM.
- Wang et al. (2017b) Suhang Wang, Jiliang Tang, Charu Aggarwal, Yi Chang, and Huan Liu. 2017b. Signed network embedding in social media. In SDM.
- Waugh et al. (2011) Andrew Scott Waugh, Liuyi Pei, James H Fowler, Peter J Mucha, and Mason Alexander Porter. 2011. Party polarization in congress: a network science approach. arXiv preprint arXiv:0907.3509 (2011).
- West et al. (2014) Robert West, Hristo S Paskov, Jure Leskovec, and Christopher Potts. 2014. Exploiting social network structure for person-to-person sentiment analysis. TACL 2 (2014), 297–310.
- Xu et al. (2019) Pinghua Xu, Wenbin Hu, Jia Wu, and Bo Du. 2019. Link prediction with signed latent factors in signed social networks. In SIGKDD.
- Ye et al. (2013) Jihang Ye, Hong Cheng, Zhe Zhu, and Minghua Chen. 2013. Predicting positive and negative links in signed social networks by transfer learning. In WebConf.
- Yin et al. (2021) Xiaoyan Yin, Xiao Hu, Yanjiao Chen, Xu Yuan, and Baochun Li. 2021. Signed-PageRank: An Efficient Influence Maximization Framework for Signed Social Networks. IEEE TKDE 33, 5 (2021), 2208–2222.
- Yuan et al. (2017) Shuhan Yuan, Xintao Wu, and Yang Xiang. 2017. Sne: signed network embedding. In PAKDD.
- Yuan et al. (2019) Weiwei Yuan, Kangya He, Donghai Guan, Li Zhou, and Chenliang Li. 2019. Graph kernel based link prediction for signed social networks. Information Fusion 46 (2019), 1–10.
Appendix A Appendix
A.1. Polarization Scores for the U.S. Congresspeople
Table 3 and Table 3 (both referred in Section 3.2.1) show the polarization scores for the top 20 least and most U.S. congresspeople.
| Congressperson | State | Party | Score |
|---|---|---|---|
| Henry Cuellar | Texas | D | -0.6542 |
| Jane Harman | California | D | -0.5376 |
| Curt Weldon | Pennsylvania | R | -0.4381 |
| Dutch Ruppersberger | Maryland | D | -0.4318 |
| Jim Moran | Virginia | D | -0.3832 |
| Dave Obey | Wisconsin | D | -0.3588 |
| Wayne Gilchrest | Maryland | R | -0.3503 |
| Duke Cunningham | California | R | -0.3248 |
| Al Edwards | Texas | D | -0.3063 |
| Lincoln Davis | Tennessee | D | -0.2901 |
| Joe Barton | Texas | R | -0.1492 |
| Charles Bass | New Hampshire | R | -0.1381 |
| Mary Bono | California | R | -0.1381 |
| Charlie Dent | Pennsylvania | R | -0.1381 |
| Nick Rahall | West Virginia | D | -0.1357 |
| Bill Young | Florida | R | -0.1250 |
| Roger Wicker | Mississippi | R | -0.1189 |
| Charles Rangel | New York | D | -0.0926 |
| Candice Miller | Michigan | R | -0.0743 |
| Jim Kolbe | Arizona | R | -0.0716 |
| Congressperson | State | Party | Score |
|---|---|---|---|
| Steve Buyer | Indiana | R | 0.9897 |
| James T. Walsh | New York | R | 0.9877 |
| Charles H. Taylor | North Carolina | R | 0.9851 |
| Zach Wamp | Tennessee | R | 0.9776 |
| Tom Cole | Oklahoma | R | 0.9747 |
| Geoff Davis | Kentucky | R | 0.9261 |
| Steve Israel | New York | D | 0.9019 |
| Marsha Blackburn | Tennessee | R | 0.8875 |
| Virginia Foxx | North Carolina | R | 0.8814 |
| Steve King | Iowa | R | 0.8516 |
| Joe Crowley | New York | D | 0.8444 |
| Virgil Goode | Virginia | R | 0.8175 |
| Robert E. Cramer | Alabama | D | 0.8117 |
| Rubén Hinojosa | Texas | D | 0.8030 |
| Carolyn McCarthy | New York | D | 0.8030 |
| David Dreier | California | R | 0.7874 |
| Christopher Cox | California | R | 0.7868 |
| Jo Ann Davis | Virginia | R | 0.7867 |
| John E. Peterson | Pennsylvania | R | 0.7867 |
| Ray LaHood | Illinois | R | 0.7793 |
A.2. Signed Link Prediction for Baselines with Reconstructed Similarity Ranking
Figure 9 and Figure 10 (both referred in Section 5.1.2) show the signed link prediction performance comparison between POLE and baselines with reconstructed similarity ranking via embedding dot products.
A.3. Scatter Plots of Signed and Unsigned Similarities with Decision Boundaries
Figure 11 (referred in Section 5.2.2) shows the scatter plots of signed and unsigned similarity for different node pairs in signed link prediction along with the decision boundaries for Congress, WoW-EP8, Bitcoin-Alpha, and Bitcoin-OTC, respectively.