Near-UV Reddening Observed in the Reflectance Spectrum of High Inclination Centaur 2012 DR30
Abstract
Centaurs with high orbital inclinations and perihelia (; au) are a small group of poorly understood minor planets that are predicted to enter the giant planet region of the Solar System from the inner Oort Cloud. As such they are one of the few samples of relatively unaltered Oort Cloud material that can currently be directly observed. Here we present two new reflectance spectra of one of the largest of these objects, 2012 DR30, in order to constrain its color and surface composition. Contrary to reports that 2012 DR30 has variable optical color, we find that consistent measurements of its spectral gradient from most new and published datasets at m agree with a spectral gradient of m within their uncertainties. The spectral variability of 2012 DR30 at Near-UV/blue and Near-Infrared wavelengths, however, is still relatively unconstrained; self-consistent rotationally resolved followup observations are needed to characterise any spectral variation in those regions. We tentatively confirm previous detections of water ice on the surface of 2012 DR30, and also consistently observe a steady steepening of the gradient of its spectrum from m towards Near-UV wavelengths. Plausible surface materials responsible for the observed reddening may include ferric oxides contained within phyllosilicates, and aromatic refractory organics.
1 Introduction
Solar System minor planets with high orbital inclinations and perihelia (; au) comprise a small and poorly understood population known as the High-i High-q (HiHq) Centaurs (Brasser et al., 2012). Their precise origin is not known, but studies of their dynamical properties generally converge towards the conclusion that they are unlikely to be sourced from the trans-Neptunian scattered disk or the Kuiper Belt; instead they probably originate from a more distant reservoir of objects such as the Oort Cloud (Emel’yanenko et al., 2005; Gladman et al., 2009; Brasser et al., 2012; Volk & Malhotra, 2013; Kiss et al., 2013; Morbidelli et al., 2020).
The dynamical lifetime of a centaur correlates positively with its orbital perihelion and inclination (e.g. Volk & Malhotra, 2013; Di Sisto & Rossignoli, 2020), and those of HiHq Centaurs are stable on timescales of years (e.g. Gladman et al., 2009; Brasser et al., 2012; Volk & Malhotra, 2013; Kiss et al., 2013; Chen et al., 2016; Morais & Namouni, 2017). This is still short relative to the age of the Solar System, however, so the extant population of HiHq Centaurs requires the existence of one or more dynamical mechanisms capable of resupplying it with new members (e.g. Levison & Duncan, 1997; Tiscareno & Malhotra, 2003). The combined gravitational action of the galactic tide, stellar flybys, and the ice giant planets on the orbits of Oort Cloud objects is one possible mechanism suggested to explain the existence of the observed population (e.g. Brasser et al., 2012), and more recently so has the gravitational influence of a distant perturbing planetary mass (Gomes et al., 2015; Batygin & Brown, 2016). The discovery that some (but not all) HiHq Centaurs occupy a shared highly inclined orbital plane suggests that objects within that plane may be delivered to planet-crossing orbits by a shared mechanism, although none of those put forward so far were found to be capable of maintaining the observed plane for any meaningful length of time (Chen et al., 2016). While the precise origins of HiHq Centaurs and their dynamical pathways into the giant planet region remain somewhat enigmatic, characterisation of the observable population is clearly crucial to exploring the Solar System beyond the Kuiper Belt, which for the most part is presently beyond our observable reach.
To date, multiband photometry has been the main technique used for characterisation of the surfaces of HiHq Centaurs, and half of those currently known have published optical colors. 127546 (2002 XU93), 528219 (2008 KV42), 2010 WG9, and 2012 DR30 have all been reported to have grey to moderately red optical colors similar to those of cometary nuclei, the Damocloids, the Trojan asteroids of Jupiter and Neptune, the less-red Trans-Neptunian Objects (TNOs), and the primitive X- and D-type asteroids (Sheppard, 2010; Hainaut et al., 2012; Kiss et al., 2013; Rabinowitz et al., 2013; Jewitt, 2015; Szabó et al., 2018; Hromakina et al., 2021). The similarity between the colors of these minor planet populations and those of HiHq Centaurs suggests that the HiHq Centaurs are likely to have dark and carbonaceous surfaces that may have experienced significant irradiation and thermal evolution (e.g. Sheppard, 2010).
Of the known HiHq Centaurs, 2012 DR30 is the most thoroughly characterised, and has the most extreme orbit (au; , ; au; au). Both Kiss et al. (2013) and Szabó et al. (2018) noted that due to its high aphelion and the orientation of its orbit away from the heliotail toward an ecliptic longitude of , 2012 DR30 spends most of its time beyond the heliosphere in local interstellar space where it experiences strong cosmic particle irradiation. The orbit of 2012 DR30 is not within the common plane identified by Chen et al. (2016), so its orbit may have become planet-crossing by a different mechanism to those that are.
With a radiometrically determined effective diameter of km, 2012 DR30 is the largest of the HiHq Centaurs that have been observed at thermal wavelengths (for 2002 XU93 and 2010 WG9 see Santos-Sanz et al., 2012; Bauer et al., 2013), and indeed is large in comparison to most centaurs, which typically have diameters below 120 km (Duffard et al., 2014). The radiometrically determined geometric albedo of 2012 DR30 is (Kiss et al., 2013), which is consistent with those of centaurs, but lies at the higher end of the centaur albedo distribution (Duffard et al., 2014). Kiss et al. (2013) noted that the beaming parameter of 2012 DR30, at , is closer to those typical of main belt asteroids (e.g. see Masiero et al., 2011; Mainzer et al., 2011; Grav et al., 2012; Alí-Lagoa et al., 2018) than those of TNOs (e.g. Santos-Sanz et al., 2012; Mommert et al., 2012; Vilenius et al., 2012; Lellouch et al., 2013), but also that this value still falls within the broad range of values occupied by the centaurs (Duffard et al., 2014).
The optical and Near-Infrared (NIR) reflectance spectra of 2012 DR30 reported by Szabó et al. (2018) were observed to be featureless, red, and broadly linear across the range m. The only absorption band detected by Szabó et al. (2018) was a m band characteristic of the presence of surface water ice; a weaker water ice absorption band at m that often accompanies the band at m was not detected. A potential silicate absorption band predicted to be present at m by Kiss et al. (2013) was also not detected. Spectral modeling by Szabó et al. (2018) suggested that the reflectance properties of 2012 DR30 could be approximated by that of a mixture of water ice (both with and without organic inclusions), Titan and Triton tholins, and pyroxene; the addition of amorphous carbon to this mixture was found to decrease consistency between the model spectrum and the observed one.
As a collection, the optical colors reported for 2012 DR30 so far suggest that its color varies significantly between observational epochs (Kiss et al., 2013; Szabó et al., 2018; Hromakina et al., 2021).
Our team spectroscopically observed 2012 DR30 in 2015 and 2017. Here we present two new reflectance spectra of 2012 DR30 resulting from those observations that we use to constrain its color and surface composition.
2 Observations
| Target | Observation Date UT Time | Texp, s | Nexp | Airmass | IQ, ″ | ||||
| VLT/X-Shooter | UVB | VIS | NIR | UVB | VIS | NIR | |||
| HD 76440 | 2015 Jun 10 23:32:51–23:39:12 | 13.0 | 13.0 | 13.0 | 3 | 1.421–1.426 | 1.41–1.68 | 1.06–1.21 | 0.93–1.10 |
| 2012 DR30 | 2015 Jun 10 23:53:55–01:32:16 | 500.0 | 466.0 | 612.0a | 8 | 1.246–1.654 | 1.27–1.44 | 1.04–1.19 | 0.80–0.91 |
| HD 97356 | 2015 Jun 11 02:12:38–02:18:55 | 10.0 | 10.0 | 10.0 | 3 | 1.817–1.832 | 1.43–1.68 | 1.07–1.26 | 0.89–1.06 |
| VLT/FORS2 | |||||||||
| HD 69216 | 2017 Apr 21 23:12:55–23:21:31 | 3.0 | 2 | 1.169 | 0.65–0.69 | ||||
| HD 87027 | 2017 Apr 21 23:22:03–23:28:28 | 3.0 | 2 | 1.177 | 0.75–0.88 | ||||
| 2012 DR30 | 2017 Apr 21 23:28:47–01:02:59 | 500.0 | 8 | 1.175–1.197 | 0.68–1.15 | ||||
| HD 100076 | 2017 Apr 22 01:09:47–01:17:03 | 3.0 | 2 | 1.149 | 0.71–0.78 | ||||
| HD 101082 | 2017 Apr 22 01:17:08–01:22:54 | 2.0 | 2 | 1.164 | 0.68–0.78 | ||||
| BD-00 2514 | 2017 Apr 22 01:30:52–01:41:46 | 12.0 | 2 | 1.127 | 0.65–0.69 | ||||
Note. For each target we present the UT observation date and time, the integration time per exposure (Texp), the number of exposures per wavelength range observed (Nexp), and the airmass at which they were observed. The range of estimated image quality (IQ) values presented for each target is the range of Full Widths at Half Maximum measured from Moffat profiles (Moffat, 1969) fitted to the set of spatial profiles produced by median collapsing each of a target’s reduced 2D spectroscopic exposures along the dispersion axis. Spectra of the stars presented in bold were the ones ultimately used to calibrate the reflectance spectra of 2012 DR30.
a Total exposure time reached by coadding two 306 s integrations.
| Instrument | R.A., hr | Decl, ∘ | , au | , au | , ∘ | , mag |
|---|---|---|---|---|---|---|
| VLT/X-Shooter | 09 05 04.91 | -41 24 25.5 | 16.083 | 16.042 | 3.6186 | |
| VLT/FORS2 | 09 24 01.75 | -56 14 37.2 | 17.540 | 17.141 | 3.0494 |
Note. Values presented here correspond to the temporal median of our observations of 2012 DR30. Alongside the instrument used during each observation epoch we present the coordinates of 2012 DR30, heliocentric distance (), geocentric distance (), solar phase angle (), and apparent magnitude (). Apparent magnitudes were calculated using , where mag and mag (Kiss et al., 2013).
We observed 2012 DR30 during two separate visitor mode runs at the European Southern Observatory’s (ESO’s) Very Large Telescope (VLT). Observing logs and the observation geometry of 2012 DR30 at each epoch are respectively presented in Tables 1 and 2. Both observing runs were conducted under clear (sky cloudless at elevation , transmission variation ) or photometric (sky cloudless, transmission variation ) conditions as defined by ESO; as a result we expect the continuum colors of our spectra to be minimally affected by clouds, and therefore accurate. As in previously reported observational epochs (Kiss et al., 2013; Szabó et al., 2018; Hromakina et al., 2021), 2012 DR30 was found to be inactive both times we observed it.
2.1 X-Shooter
During the first run, on 2015 Jun 10-11 UT, we observed 2012 DR with the X-Shooter spectrograph, mounted on the 8.2m UT2(Kueyen) unit telescope. X-Shooter is a medium resolution echelle spectrograph with three arms covering the Near-UV/blue (UVB; m), visual (VIS; m), and NIR (NIR; m) spectral ranges that can be exposed simultaneously (Vernet et al., 2011). We did not make use of X-Shooter’s -band blocking filter for these observations, so the uncalibrated spectroscopic observations covered the full observable wavelength range. No detector binning was implemented, so data was obtained at the native pixel scales of each detector (UVB & VIS, ; NIR, ). For the UVB, VIS, and NIR spectrographic arms we respectvely used slit widths of , , and , which each provided respective resolving powers () of , , and ; all three slits had a common length of .
We obtained spectra of 2012 DR30 and two Solar twins from the catalog of Datson et al. (2015) adjacent in time and at a similar airmass and pointing (see Table 1). We used a three-point repeating dither pattern of , , and along the slit relative to the slit center when observing these targets to mitigate the effects of bad pixel artifacts and cosmic rays. To minimise slit losses resulting from atmospheric differential refraction (Filippenko, 1982), and to account for X-Shooter’s disabled atmospheric dispersion corrector (ADC), the slit was realigned to the parallactic angle after the completion of each dither cycle (every three exposures). One flux calibrator, EG 274, was observed as a part of the standard X-Shooter calibration program (Vernet et al., 2010).
2.2 FORS2
| J-C | |||
|---|---|---|---|
| SDSS | |||
Note. Table presenting Solar colors reported by \textcite2012ApJ…752….5R and SDSS for the Johnson-Cousins (J-C) and SDSS filter systems respectively.
We revisited 2012 DR30 on 2017 Apr 21-22 UT with the FOcal Reducer/low dispersion Spectrograph 2 (FORS2; Appenzeller et al., 1998), which is mounted on the 8.2 m UT1(Antu) unit telescope. FORS2 was configured in longslit spectroscopy mode, with the blue-sensitive E2V CCD detector, the standard resolution collimator, and a slit width of . We used the GRIS_600B+22 grism, which provided a wavelength coverage of m and a resolving power of at m when used with our chosen slit.
We observed spectra of 2012 DR30 and five solar calibrator sources close in time and at similar airmass and pointing (see Table 1). The high throughput and sensitivity of VLT/FORS2 made selection of solar calibrator stars challenging, as most well characterised solar twins and analogs were capable of saturating even the shortest spectroscopic exposures due to their brightness. Prior to our observing run three of our stars were selected because they were sufficiently faint, near to 2012 DR30 at the time of observation, and listed with G2V spectral type and photometric colors within 0.02 magnitudes of Solar in the SIMBAD catalog (Wenger et al., 2000, see Table 3 for Solar colors). A fourth star, HD 101082, had G0V spectral type and , but was chosen as a calibrator-of-last-resort in the event that others were unusable. A fifth faint calibrator star was later selected while we were at the observatory from a list of stars with precisely measured near-Solar colors compiled by Brian A. Skiff from catalogs of standard stars. In the end it was the spectrum of this fifth star, BD-00 2514 (a.k.a. SA 103-204; for colors see Taylor, 1986) that we used to calibrate our FORS2 spectrum of 2012 DR30, because of all the calibrator stars we observed it provided the best cancellation of the Solar metal lines in the raw spectrum of 2012 DR30.
We used a two-point repeating dither pattern for all our FORS2 observations that alternated between and along the slit from the slit center. Again, the slit was periodically realigned to the parallactic angle to minimise slit losses. All exposures were read out using the 100 kHz, binned, high gain readout mode.
3 Data Reduction
For all our spectra from both instruments, initial data reduction steps including bias subtraction, flat field correction, wavelength calibration, and spectrum rectification (i.e. straightening of the echelle orders) were performed with the data reduction pipelines provided for X-Shooter (v.2.7.1; Modigliani et al., 2010) and FORS2 (v.5.2.3111ftp://ftp.eso.org/pub/dfs/pipelines/instruments/fors/fors-pipeline-manual-5.10.pdf) by ESO in the ESO Reflex data reduction environment (v.2.8.4 & v.2.8.5 respectively; Freudling et al., 2013). The X-Shooter pipeline was also used for merging the echelle orders of each spectrum, and correcting the spectra for instrument response using the observed flux standard. The instrument response of FORS2 is stable over a timescale of days and was not corrected for in our data; because it would have been applied to both the raw spectrum of 2012 DR30 and the Solar calibrator spectrum, such a correction would have been negated when the former was divided by the latter to derive the reflectance spectrum.
Sky subtraction, cosmic-ray removal, and extraction of the spectra from both instruments were performed using a method similar to that used by Seccull et al. (2018), where Moffat functions (Moffat, 1969) were fitted to the spatial profile of the 2D wavelength-calibrated spectrum at many locations along the dispersion axis in order to track the wavelength dependent center and width of the spectrum’s spatial profile. Sky region boundaries were defined at Full-Widths at Half Maximum (FWHM) from each Moffat profile center with sky outside these boundaries. 15 iterations of sigma clipping at 5 were separately conducted in the sky and target regions to remove cosmic rays. In each unbinned wavelength element the median background was subtracted. The Moffat fitting process was repeated on the sky-subtracted 2D spectra with extraction limits defined at FWHM from each of the Moffat profile centers. During this second round, pixels that had been flagged as bad, or containing cosmic rays, had their values replaced using a process similar to that used in the ESO X-Shooter pipeline for the same purpose (Modigliani et al., 2010); details are presented in the X-Shooter pipeline manual222see the Standard Exraction algorithm; ftp://ftp.eso.org/pub/dfs/pipelines/instruments/xshooter/xshoo-pipeline-manual-3.3.5.pdf. Within the defined extraction limits the flux was summed for each wavelength element to form the 1D spectrum. At this stage, the signal-to-noise ratio (S/N) of our X-Shooter spectra of 2012 DR30 were found to be too low to be of use in analysis at m. This is primarily due to the relatively low sensitivity of X-Shooter in the band; our use of a long s integration time per NIR X-Shooter frame (see Table 1) also made accurate sky subtraction challenging in this region.
The FORS2 spectra were all then corrected for atmospheric extinction using , where and are respectively the extinction corrected and uncorrected spectra, is the median airmass at which the spectrum was observed, and is the FORS2 extinction coefficient (taken from the FORS2 data reduction pipeline) interpolated to the resolution of the spectra. Atmospheric extinction correction was not needed for the X-Shooter spectra as they had already been flux calibrated by the ESO pipeline.
Next, the spectra for each target observed with a given instrument were median stacked. All individual spectra of each Solar calibrator star were stacked. For 2012 DR30, however, some spectra were omitted from stacking. One spectrum was omitted from the X-Shooter UVB stack, and two were omitted from both the X-Shooter VIS stack and NIR stack, because the first triplet observing sequence performed with X-Shooter was observed with 2012 DR30 poorly centered in the slit; this reduced the S/N of these exposures and caused the blue end of the spectrum to fall off the slit at certain dither positions. One further frame was also left out of the X-Shooter NIR stack due to low S/N. The first three frames observing 2012 DR30 in the FORS2 stack were also omitted, as this observation began soon after the end of evening twilight while the sky was still darkening, resulting in low S/N at short wavelengths. The remaining five frames, observed once the sky was sufficiently dark, provided better S/N into the Near-UV (NUV). The stacked calibrator star spectra were used to calibrate the signature of the Solar spectrum out of the stacked spectra of 2012 DR30. We used the spectrum of HD 97356, rather than that of HD 76440, to calibrate our X-Shooter spectrum of 2012 DR30, as HD 97356 was the brighter of the two calibrators observed and had a spectrum with higher S/N; as previously discussed in section 2 we calibrated the FORS2 spectrum with that of BD-00 2514. The resulting reflectance spectra were binned using the bootstrapping method described by Seccull et al. (2019). Binning factors (i.e. numbers of points per bin) of 130, 125, and 260 were respectively used when binning the spectra observed with the X-Shooter UVB, VIS, and NIR arms. A binning factor of 25 was used with the FORS2 data. The UVB, VIS, and NIR X-Shooter reflectance spectra of 2012 DR30 were aligned to each other via a linear fit to the wavelength ranges adjacent to the gaps between each arm.
4 Analysis
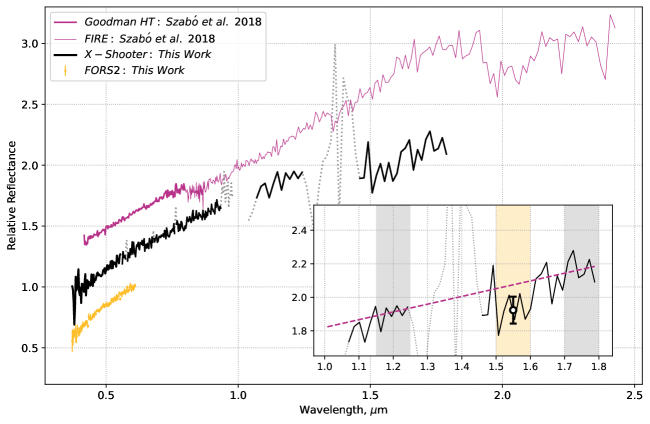
We present our full optical and NIR reflectance spectra of 2012 DR30 in Figure 1 alongside the two reflectance spectra of 2012 DR30 presented by Szabó et al. (2018). The optical and NIR spectra combined and published by Szabó et al. (2018) were observed at different epochs and, as mentioned in that article, likely observed different faces of 2012 DR30; we therefore plot them in Figure 1 as they were initially published, but we differentiate the two combined spectra using lines of different thickness.
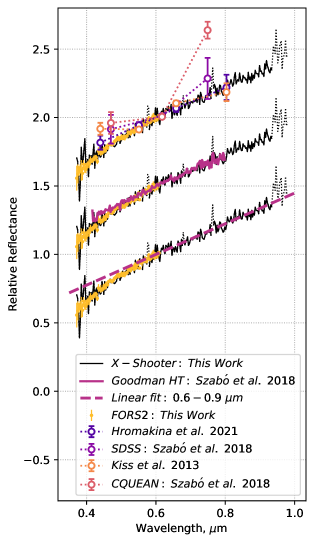
In Figure 2 we present our optical reflectance spectra of 2012 DR30 in comparison to all published optical photometric and spectroscopic reflectance data where such data covers m, enabling consistent scaling between datasets (literature datasets include those reported by Kiss et al., 2013; Szabó et al., 2018; Hromakina et al., 2021). Optical photometric colors were converted to coarse reflectance spectra using methods described by Hainaut & Delsanti (2002), and were scaled relative to the reflectance value at m on a line drawn between the two datapoints either side of that wavelength. Solar colors from Ramírez et al. (2012) were used to convert the colors of 2012 DR30 to reflectance; likewise, Solar colors reported on the SDSS webpages 333https://www.sdss.org/dr12/algorithms/ugrizvegasun/ were used to convert the colors of 2012 DR30 (see Table 3).
4.1 Spectral Gradients
For the purpose of comparison we measured the gradients of our reflectance spectra of 2012 DR30 along with those obtained or derived from the literature. The bootstrapping method described by Seccull et al. (2019) was used to measure the spectral gradient () and estimate both the standard deviation () and the standard error of the mean () of that measurement. We take to indicate the accuracy of the gradient measured from a given dataset, and use to compare the consistency of gradients measured from different datasets. For our binned reflectance spectra, each datapoint was sampled by bootstrapping the sample of points in the unbinned spectrum that were combined to make it during binning. For the coarse color-derived reflectance spectra, each datapoint was (crudely) assumed to have a gaussian uncertainty distribution with a standard deviation equal to the datapoint’s uncertainty; the gaussian uncertainty distribution of each datapoint was therefore randomly sampled when it was bootstrapped. It was not possible to use the bootstrapping method to measure the gradient of the reflectance spectra published by Szabó et al. (2018), as the datafiles published with their article were done so without uncertainties. We resorted instead to measuring the gradients of these spectra with a single linear regression, which was sufficient to estimate and , but not . Measurements of the gradients of the reflectance spectra presented in Figures 1 and 2 are presented in Table 4 for multiple wavelength ranges. The gradients reported for a given wavelength range were all consistently measured relative to the reflectance at the central wavelength within that range.
| Rangea | Data Typeb | Bandsc | Sourced | |||
| 10.24 | 0.57 | 0.02 | 0.551-0.803 | Spectroscopic | X-Shooter: This Work | |
| 10.55 | 0.06 | 0.551-0.803 | Spectroscopic | Goodman-HT: Szabó et al. (2018) | ||
| 9.98 | 3.33 | 0.11 | 0.551-0.803 | Photometric | VRI | Hromakina et al. (2021) |
| 9.87 | 2.32 | 0.07 | 0.551-0.803 | Photometric | VRI | Kiss et al. (2013) |
| 17.69 | 9.05 | 0.29 | 0.551-0.803 | Photometric | ri | SDSS: Szabó et al. (2018) |
| 20.79 | 7.81 | 0.25 | 0.551-0.803 | Photometric | ri | CQUEAN, 2013-03-23: Szabó et al. (2018) |
| 37.25 | 5.45 | 0.17 | 0.551-0.803 | Photometric | ri | CQUEAN, 2013-04-13: Szabó et al. (2018) |
| 19.81 | 2.60 | 0.08 | 0.440-0.551 | Spectroscopic | X-Shooter: This Work | |
| 19.72 | 0.89 | 0.03 | 0.440-0.551 | Spectroscopic | FORS2: This Work | |
| 13.94 | 0.19 | 0.440-0.551 | Spectroscopic | Goodman-HT: Szabó et al. (2018) | ||
| 12.99 | 5.99 | 0.19 | 0.440-0.551 | Photometric | BV | Hromakina et al. (2021) |
| 4.62 | 0.15 | 0.440-0.551 | Photometric | BV | Kiss et al. (2013) | |
| 16.27 | 0.53 | 0.02 | 0.470-0.618 | Spectroscopic | FORS2: This work | |
| 13.65 | 0.08 | 0.470-0.618 | Spectroscopic | Goodman-HT: Szabó et al. (2018) | ||
| 7.47 | 7.77 | 0.29 | 0.470-0.618 | Photometric | gr | SDSS: Szabó et al. (2018) |
| 3.25 | 5.45 | 0.17 | 0.470-0.618 | Photometric | gr | CQUEAN, 2013-04-13: Szabó et al. (2018) |
| 6.12 | 1.15 | 0.04 | 1.070-1.250 | Spectroscopic | X-Shooter: This work | |
| 9.28 | 0.05 | 1.070-1.250 | Spectroscopic | FIRE: Szabó et al. (2018) |
Note. Here we present spectral gradients (), associated uncertainties (), and associated standard errors () measured for 2012 DR30 across multiple wavelength ranges from our new spectra and several published spectroscopic and photometric datasets. a: The Range column presents the wavelength range across which each measurement was made; all values were measured relative to the reflectance at the center of this range. b: The Data Type column shows whether each measurement was derived from spectroscopic or photometric data. c: The Bands column shows, if the data type is photometric, which bands within a photometric dataset were used when deriving a given measurement. d: The Source column notes the articles in which each dataset has been published and, where an article reports multiple datasets, the instrument used to obtain it.
4.2 NIR Absorption Bands
One absorption band was identified in the X-Shooter spectrum of 2012 DR30, centered at m (see the inset in Figure 1). Based on its shape and location, it is most likely to be attributable to the presence of water ice on the surface of 2012 DR30. The depth of this band, , was estimated by measuring the average reflectance of 2012 DR30 within the band at m, , relative to an estimate of the continuum reflectance at m, . A model linear continuum slope was fitted to regions of reliable continuum on each side of the band at m and m using the bootstrapping method previously used to obtain spectral gradients in section 4.1. Use of this method provided both an average value for and an uncertainty. The uncertainty of was estimated to be the standard deviation of the reflectance points within the m band. We then used
| (1) |
to determine the band depth as a percentage relative to the modeled linear continuum. Uncertainties were propagated using standard methods (see Hughes & Hase, 2010) such that
| (2) |
Ideally, we would have used the region of the spectrum at m to define the coninuum on the short wavelength side of the absorption band, but the presence of an instrument artifact at m prevented us from doing so (see Appendix). Defining the continuum using the spectrum at m, a region with lower reflectance than continuum regions closer to the band, resulted in our estimate of being a lower limit. Ultimately we estimate that the band depth is , which corresponds to a detection significance of . The S/N of the spectrum was insufficient for us to search for the m crystalline water ice band.
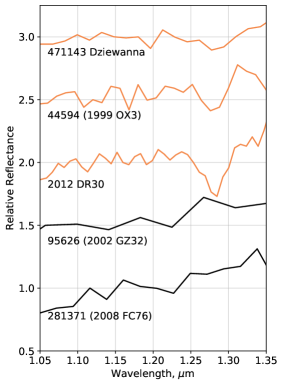
We attempted to predict the depth of the m band we would have measured in our X-Shooter spectrum of 2012 DR30 and compare it to the depth measured for a similar band observed by Szabó et al. (2018). To do this we tried to predict the m band depth based on the measured depth of the m band and estimates of the band depth ratio between the m and m bands observed in the model reflectance spectra of 29 TNOs and centaurs reported by Barkume et al. (2008) and Brown et al. (2012); the selected objects had and an unambiguous detection of water ice. We followed the methods described in these publications to model the NIR spectra of our sample as the linear combination of a sloped continuum and a water ice spectrum such that
| (3) |
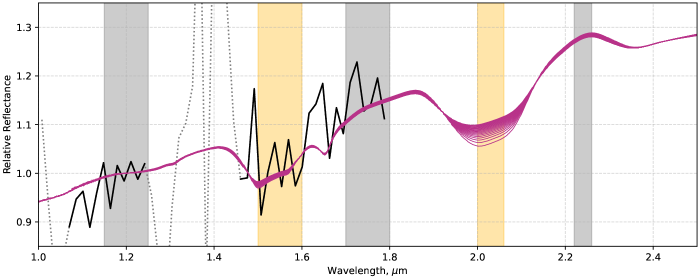
where is the gradient of the continuum, is a model water ice spectrum, and describes the proportional contribution of the water ice spectrum to the final model, . To calculate we used and values reported by Brown et al. (2012), and used Hapke (2012) theory to generate model water ice spectra, . When modeling our water ice spectra we adopted the same functions used by Protopapa et al. (2017), although for the sake of simplicity we neglected to account for large scale surface roughness (). We adopt values of , radians, and for the amplitude of the opposition effect, the angular width of the opposition effect, and the cosine asymmetry factor, respectively. , , and have never been measured for 2012 DR30, so we selected values analogous to those measured for dynamically excited TNOs by the NASA New Horizons probe (Porter et al., 2016; Verbiscer et al., 2019). All our model reflectance spectra are compared to that of 2012 DR30 in Figure 3.
We measured the average m to m water ice band depth ratio for the models generated while varying three parameters, including temperature¸ average grain size, and phase angle. In all tests we used water ice absorption coefficients measured in the lab by Grundy & Schmitt (1998), but swapped between those measured at 50 K, the temperature originally assumed for the models of Barkume et al. (2008) and Brown et al. (2012), and 90 K, which is close to the 96.3 K and 99.9 K subsolar temperatures of 2012 DR30 when it was respectively observed by us with X-Shooter and by Szabó et al. (2018). Because the rotation rate of 2012 DR30 is unconstrained (Kiss et al., 2013), we consider these temperatures to be upper limits, hence our choice of absorption coefficients measured at 90 K rather than 100 K. We varied average grain sizes between m, m, and m, inlcuding the original value assumed by Barkume et al. (2008) and Brown et al. (2012), and the best-fit values determined for water ice in the spectral models reported for 2012 DR30 by Szabó et al. (2018). Phase angles were swapped between and , the phase angles of the NIR observations reported respectively by Szabó et al. (2018) and this work.
The depths of the m and m bands in our model water ice spectra were measured using the same method described previously for the m band in our X-Shooter spectrum. For the m bands in the model spectra, continuum regions were defined at m and m and a linear continuum was drawn between them. The average reflectance of each model spectrum was determined in the range m, and that reflectance was compared to the reflectance of the linear continuum in order to measure the band depth as a percentage. Likewise continuum regions of m and m were used as continuum regions adjacent to the m band, and the reflectance at m was averaged to measure its depth.
| m | m | m | |
|---|---|---|---|
| 50 K | 1.04—1.06 | 1.16—1.17 | 1.26—1.26 |
| 90 K | 1.04—1.04 | 1.17—1.17 | 1.28—1.28 |
Note. Table presenting the ratios of the m band depth to the m band depth averaged across 29 model reflectance spectra generated as described in section 4.2 considering a variety of temperatures, grain sizes, and phase angles. In this table different rows record results for different temperatures, columns record results for different average grain sizes, and each data entry has two values corresponding to a result determined at a phase angle of on the left and at on the right. All values have standard errors of the mean at . Only changes in grain size cause a meaningful change to the band depth ratio across the parameter space tested.
Measured average band depth ratios are presened in Table 5. We find that the average ratio of the m band depth to that of the m band in our sample of model reflectance spectra is invariant to temperature and phase angle within the uncertainties at the temperatures and angles that were tested. Changing the average grain size of the models had the greatest effect, with the band depth ratio increasing from 1.05 to 1.27 as grain size was decreased from m to m. With these band depth ratios and the measured depth of the m band in the X-Shooter spectrum, we predict that, had we been able to extract it, the associated m water ice band would have had a depth of between and . This range overlaps with the m band depth measurement of Szabó et al. (2018) within its uncertainties.
4.3 The NUV Reflectance Drop
We detect a deviation from linearity in our X-Shooter and FORS2 spectra of 2012 DR30 that manifests as a drop in reflectance that curves downward from m towards NUV wavelengths. It is noticable in the greater spectral gradients measured at shorter optical wavelengths compared to longer ones; the gradient measured in the range m is almost double that measured at m (see Table 4). To quantify the significance of the deviation of the spectrum from a linear slope we performed a linear fit to the optical continuum of the spectrum in the range m and extrapolated it to shorter wavelengths as shown in Figure 2. We then compared the average reflectance of 2012 DR30 within the range m in each of our spectra to that of the linear slope at m; we take the standard deviation of the reflectance points in the same range as the uncertainty of the average reflectance at m. From our X-Shooter spectrum we find that 2012 DR30 is less reflective at m than it would be if its spectrum had constant gradient across the full optical range, and consequently that the spectrum’s deviation from linearity at this wavelength is detected at a significance of . Identical analysis of our FORS2 spectrum shows that it is less reflective than the linear profile at m, and that the spectrum’s deviation from linearity at this wavelength is detected at significance. The measurements of the deviation of the spectra from linearity are consistent within their uncertainties.
5 Results
In this section we discuss our results. First, we compare our reflectance spectra of 2012 DR30 to each other and the published datasets presented in section 4. Second, we compare the reflectance properties of 2012 DR30 to other populations of minor planet. Third, we attempt to use our new data to constrain the surface composition of 2012 DR30.
5.1 Surface Variability
We find that our two reflectance spectra of 2012 DR30 are fully consistent with one another within their shared wavelength coverage, and that the spectral gradients measured from each are also consistent within their uncertainties (see table 4).
Without the uncertainties of the optical reflectance spectrum published by Szabó et al. (2018) it was not possible for us to determine for our measurement of its gradient; this precluded robust quantitative comparison of that gradient to those measured from other datasets. Qualitative comparisons suggest that the shapes of our spectra and theirs are consistent in a broad sense, given that theirs also appears slightly redder at short optical wavelengths than it does at longer ones (see Table 4). We recognise, however, that the optical spectrum from Szabó et al. (2018) and all but one of the photometric datasets (that reported by Hromakina et al., 2021) are formally inconsistent with our own spectra at short wavelengths, showing hardly any increased reddening at m, if any at all. That said, the photometric data do not necessarily have the precision to reveal such a feature, and moreover, are inconsistent between datasets. The spectrum from Szabó et al. (2018) may suffer from calibration errors of the order a few percent that would be sufficient to mask such a feature. In particular we note that the Solar calibrator they used has a precisely measured color reported in the SIMBAD database (; Wenger et al., 2000) that is redder than the color of the Sun (; Ramírez et al., 2012) which suggests that Solar metal lines in their spectrum of 2012 DR30 may have been overcorrected, producing a reflectance spectrum with decreased redness at short wavelengths. Given the remarkable consistency between the FORS2 and X-Shooter spectra, which were acquired at different epochs separated by almost two years and used different Solar calibrators (one of which is a well characterised Solar twin; Datson et al., 2015), we trust that our spectra capture the true reflectance behaviour of 2012 DR30. Self-consistent rotationally resolved observations of 2012 DR30 at NUV/blue wavelengths will be necessary to determine whether the variability in the reported photometric data is real.
Our comparison of the red optical reflectance data for 2012 DR30 strongly suggests that its color variation is smaller than previously reported, or possibly entirely absent. When they are measured with consistent methods at m and compared, we find that the spectral gradients of four of the seven datasets presented in Figure 2 and table 4 fall within the range m, and the gradient measured from the SDSS data is also consistent with m within its uncertainties; the only inconsistent reflectance data is that derived from the CQUEAN photometry published by Szabó et al. (2018), being significantly redder than the rest. Detections of red spots or patches on the surfaces of icy minor planets are not unprecedented (e.g. Lacerda, 2009; Fraser et al., 2015; Fitzsimmons et al., 2018) and it is possible that Szabó et al. (2018) detected something similar, but such a scenario seems unlikely. The greater weight of evidence suggesting that 2012 DR30 has a fairly constant surface color and its previously reported lack of rotational lightcurve (Kiss et al., 2013) instead indicate that the surface of 2012 DR30 is likely to be much more homogenous than was previously suggested.
Despite the fact that our NIR spectrum of 2012 DR30 and that reported by Szabó et al. (2018) test positive for signatures of water ice, they are more different than alike. The FIRE spectrum is significantly redder than the NIR X-Shooter spectrum, and also lacks the m water ice absorption that we observed. The presence of a m water ice absorption band cannot be confirmed in the X-Shooter spectrum, but we predict its presence based on our tentative detection of the weaker m band. There are a number of unknown quantities in our spectral modeling analysis (see section 4.2), particularly the average size of the surface grains on 2012 DR30, so we only use the results of that analysis to give a general impression of the variablility of the water ice band strength. It appears likely that the deep m band predicted to be in the X-Shooter spectrum is no stronger than the deep band reported by Szabó et al. (2018). If the band depth is closer to the lower end of the predicted range, the variation of the band strength between observing epochs is consistent with that previously reported for the reflectance spectra of TNOs and centaurs (e.g. Merlin et al., 2005; Protopapa et al., 2009; Barucci et al., 2010; Fraser et al., 2015), and therefore seems unremarkable. Given the non-dectection of a lightcurve for 2012 DR30 reported by Kiss et al. (2013) and the following implication that its albedo does not appear to vary, we lean towards considering it more likely that the abundance of water ice on 2012 DR30 is fairly constant across its surface.
Within the uncertainties of their measurement, and the range of band depth ratios estimated by our spectral modeling work, we’d expect that the m water ice band detected by Szabó et al. (2018) would be accompanied by a m band with a depth of 8.7-12.4%, but they did not observe one. The variable presence of the m water ice band is curious, especially if the surface abundance of water ice is not variable. If this is the case, and if the m band variation is real, it may indicate a variegation of the surface’s physical properties such as grain size distribution or porosity. Like Szabó et al. (2018), we note that there have been reports of TNOs with spectra that have only the m water ice band and lack the m band (Lorenzi et al., 2014). With only two epochs of the NIR data available for 2012 DR30, however, the extent to which its NIR spectrum varies is presently unconstrained; more self consistent NIR observations are needed before a better understanding of the properties of the surface water ice on 2012 DR30 can be obtained.
5.2 Comparison to Other Minor Planets
We find that 2012 DR30 is moderately red in color with an optical spectral gradient of m at m, which makes the color of 2012 DR30 consistent with the color distributions of a number of other populations such as the Damocloids, the Trojan asteroids of Jupiter and Neptune, the irregular satellites of the giant planets, the grey centaurs, the D-type asteroids, the comets, and the less-red TNOs (e.g. Sheppard, 2010; Jewitt, 2015; Licandro et al., 2018). The water ice absorption bands and grey NIR continuum of our X-Shooter spectrum of 2012 DR30 are observed fairly frequently in the NIR spectra of centaurs and TNOs of a similar size (e.g. Guilbert et al., 2009; Barucci et al., 2011; Brown et al., 2012).
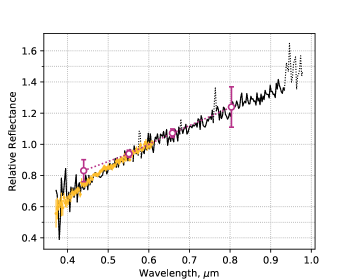
By taking the average colors of all 21 high inclination objects reported in Table 4 of Hromakina et al. (2021) and plotting the resulting coarse reflectance spectrum over our spectra of 2012 DR30 we find that the color of 2012 DR30 is completely consistent with the average color of high inclination objects at m (see Figure 4 for details); the gradient of the coarse average spectrum in this range is m. At m, however, 2012 DR30 appears redder than the average spectrum with respective spectral gradients of m and m, but note that within their uncertainties these values are still borderline consistent. Therefore, while linearity appears to be the norm for the optical reflectance spectra of most high inclination Solar System objects (Pinilla-Alonso et al., 2013; Licandro et al., 2018; Hromakina et al., 2021, e.g.), there appears to be sufficient spread in their average color that some may indeed have NUV reflectance drops that have not yet been confirmed (see Figure 4). As a result we can neither rule out the possibility that 2012 DR30 is an oddball with an unusually red color at m, nor that it is one of a subclass of high inclination objects with reddened NUV reflectance spectra.
| Rangea | Object | Bandsc | Referenced | |||
| 4.1 | 2.1 | 0.1 | 0.551-0.803 | 127546 (2002 XU93) | VRI | (1,2) |
| 6.6 | 3.3 | 0.1 | 0.551-0.803 | 528219 (2008 KV42) | VRI | (1) |
| 14.2 | 2.4 | 0.1 | 0.551-0.803 | 2010 WG9 | VRI | (3) |
| 7.2 | 2.0 | 0.1 | 0.551-0.803 | 2010 WG9 | VRI | (3) |
| 1.2 | 2.4 | 0.1 | 0.551-0.803 | 2010 WG9 | VR | (4) |
| 8.8 | 3.7 | 0.1 | 0.440-0.551 | 127546 (2002 XU93) | BV | (2) |
| 14.3 | 10.7 | 0.3 | 0.440-0.551 | 528219 (2008 KV42) | BV | (1) |
| 12.0 | 3.4 | 0.1 | 0.440-0.551 | 2010 WG9 | BV | (3) |
| 6.7 | 5.8 | 0.1 | 0.440-0.551 | 2010 WG9 | BV | (4) |
Note. Here we present spectral gradients (), associated uncertainties (), and associated standard errors () measured for three HiHq centaurs from their published photometric colors. Literature data taken from (1; Sheppard, 2010), (2; Hainaut et al., 2012), (3; Rabinowitz et al., 2013), and (4; Jewitt, 2015). colors of 2010 WG9 from Rabinowitz et al. (2013) labelled VRI1 and VRI2 were observed at different rotational phases.
Similar to the colors of 2012 DR30 presented in Table 4, those published for three centaurs were converted to reflectance and used to measure their optical spectral gradients, which are presented in Table 6. As previously reported, and as is typical of high inclination objects (e.g. Hromakina et al., 2021), the colors of 2002 XU93, 2008 KV42, and 2010 WG9 are generally grey to moderately red (Sheppard, 2010; Hainaut et al., 2012; Rabinowitz et al., 2013; Jewitt, 2015). It is interesting to note that each centaur in table 6 has at least one set of colors where the gradient measured at m is at least double that measured at longer wavelengths, suggesting the presence of a reflectance drop at short wavelengths similar to that observed in our reflectance spectra of 2012 DR30. The caveat to this observation, however, is that within their uncertainties the gradients measured at short and long wavelengths are consistent, which means that we cannot rule out the possibility that the optical reflectance spectra of 2002 XU93, 2008 KV42, and 2010 WG9 are linear across the full optical range. If all HiHq centaurs do in fact become redder from optical to NUV wavelengths, the low frequency of such features in the spectra of low inclination centaurs and TNOs would support the inference made from dynamical studies that the HiHq centaurs are not sourced from the TNO population (see Brasser et al., 2012; Volk & Malhotra, 2013). A shared general spectral shape for the HiHq centaurs suggests that they have common surface properties, and that they may have either formed under similar conditions or experienced similar types and extents of surface processing. Alternatively a NUV reflectance drop may be acquired only by objects which have very large aphelion distances that cause them to spend long periods of their orbit beyond the heliosheath; at these great heliocentric distances organics on their surfaces would likely be heavily dehydrogenated and aromatised as a result of strong irradiation by galactic cosmic rays (e.g. Hudson et al., 2008). Precise spectroscopic observations of more HiHq centaurs at NUV and optical wavelengths may be able to confirm the presence of a NUV reddening in their spectra.
Differences in spectral gradient between the NUV and optical regions are not commonly observed in the reflectance spectra of objects like centaurs and TNOs (e.g. Fornasier et al., 2004, 2009). Such a feature has been clearly identified in the spectrum of the TNO 120216 (2004 EW95), but this unusual object is predicted to be a carbonaceous (C-type) asteroid interloping in the trans-Neptunian belt (Seccull et al., 2018). Beside this, only the centaur 32532 Thereus has a reported spectrum that hints at the presence of a NUV reflectance drop (Barucci et al., 2002); the feature is only detected tentatively, however, and has a different shape to the reflectance drop that 2012 DR30 has. With an orbital inclination , Thereus is not a centaur, and unlike 2012 DR30 it probably originated among the TNOs. NUV reddening is more common in the spectra of main belt asteroids (see DeMeo et al., 2009), and is also observed in the reflectance spectra of the less-red Jupiter Trojan asteroids (at m; Wong et al., 2019). The presence of this feature in the reflectance spectrum of 2012 DR30 therefore tentatively hints that this object may have more in common with those popultations than it does with the TNOs.
5.3 Surface Composition
The only clear assertion we can make about the surface composition of 2012 DR30 is that it has surface water ice. Both of the characteristic m and m water ice absorption bands have been observed in reflectance spectra of 2012 DR30, although at different epochs (see section 4 and Szabó et al., 2018). Like Szabó et al. (2018) we have not detected the m absorption band predicted to be present by Kiss et al. (2013).
The surface material responsible for the NUV reflectance drop in the spectrum of 2012 DR30 is not clearly identifiable, but a process of elimination can narrow down the list of candidates. Water ice, although detected in the NIR, does not absorb strongly at NUV/blue wavelengths and can be ruled out. For the same reason, and because its characteristic absorption bands at m and m have not been detected (see Szabó et al., 2018), methanol ice can also be ruled out.
Anhydrous mafic silicates such as olivine and pyroxene have strong NUV absoprtion features in their reflectance spectra (e.g. Reddy et al., 2015), but if anhydrous silicates are present in sufficient quantity on the surface of 2012 DR30 to be the cause of the observed reddening in its spectrum, we would expect their other strong chracteristic NIR absorption bands to also be detectable. These bands would appear at m for olivine, and at m and m for pyroxene, but detections of such bands have never been confirmed for 2012 DR30. The addition of amorphous carbon (AC) to a silicate surface has been shown to weaken these bands, but not without also weakening the NUV feature to a similar extent (Cloutis et al., 2011), so the appearance of only the NUV reflectance drop appears inconsistent with a mixture of silicate and AC. It therefore seems reasonable to exclude anhydrous mafic silicates as contributors to the NUV reddening in the spectrum of 2012 DR30. Notably, however, model reflectance spectra of mixtures of materials present in chondritic porous interplanetary dust particles (IDPs) have been shown to match well with those of the dark, moderately red, and icy asteroids to which 2012 DR30 appears similar in color and albedo. Since some of the dominant phases in IDPs are olivine, enstatite, and amorphous silicates, we cannot completely rule out the presence of anhydrous silicates on its surface (see Vernazza et al., 2015).
The low albedo and moderately red optical color of 2012 DR30 suggests that its surface may be at least partially comprised of macromolecular refractory organics of the kind produced through radiolytic and photolytic processing of simple molecular ices (e.g. Brunetto et al., 2006). Refractory organics containing aromatic rings (such as Polycyclic Aromatic Hydrocarbons; PAHs) and other -bonded molecular structures are well documented to absorb light strongly at NUV wavelengths and have strong NUV absorption features in their spectra that advance to longer wavelengths as the size and clustering of their -bond networks increase (e.g. Izawa et al., 2014). If the NUV reddening in the spectrum of 2012 DR30 is produced by aromatic refractory organics on its surface, it is plausible that its infrared spectrum will exhibit the m fundamental aromatic C-H stretching mode that is typically used to identify the presence of aromatic organics on Solar System objects (e.g. Cruikshank et al., 2014). No spectroscopic observations of 2012 DR30 have yet been reported in the m range, but if future observations at these wavelengths do detect an aromatic feature at m we can be more confident that the NUV reflectance drop is at least partly the result of absorption by aromatic hydrocarbons. The higher harmonics of the m C-H stretch band are observed in laboratory samples of PAHs at m, m, and m (Izawa et al., 2014), but these are not observed in our spectrum of 2012 DR30. This shouldn’t be surprising, however, as these features are easily washed out if a specific PAH species is not observed in a highly pure form (Izawa et al., 2014). It is likely that any organics on the surface of 2012 DR30 are a diverse mixture rather than a single uniform species, and they are also definitely mixed with other materials. For this reason we cannot claim that our non-detection of NIR C-H stretch modes is evidence against the presence of aromatic organics on the surface of 2012 DR30.
Drops in reflectance observed in the spectra of dark carbonaceous main-belt asteroids are often attributed to absorption by Fe2+Fe3+ intervalence charge transfer (IVCT) transitions occuring in iron oxide minerals contained within iron-bearing phyllosilicates on their surfaces (e.g. Vilas, 1994; Rivkin et al., 2015); the detection of such a NUV reflectance drop is not diagnostic, however. Other optical phyllosilicate bands such as the weak m Fe2+Fe3+ IVCT band are easily obscured by carbonaceous material (e.g. Cloutis et al., 2011), so if the NUV reddening in the spectrum of 2012 DR30 is caused by ferric products of aqueous alteration it is not surprising that their other optical bands have not been detected. It should also be noted that carbonaceous material is capable of reducing the strength of the NUV reflectance drops observed in the spectra of aqueously altered asteroids (Hendrix & Vilas, 2019), so if the reflectance drop is caused by aqueously altered minerals on the surface of 2012 DR30 the additional presence of carbon rich material may explain why its NUV reddening is not as strong as that observed in the spectra of pure phyllosilicate samples or aqueously altered meteorites. Confirmation that the NUV reflectance drop is caused (even in part) by the presence of aqueously altered minerals on the surface of 2012 DR30 may be achieved by the detection of a strong m absorption band associated with structural hydroxyl (OH) or adsorbed water contained within them (e.g. Takir & Emery, 2012; Rivkin et al., 2015).
6 Conclusions
We have presented two new reflectance spectra of the extreme centaur 2012 DR30, which combined have a wavelength coverage of m; through analysis of these spectra we have attempted to constrain the color and surface composition of 2012 DR30.
Contrary to previous reports of the optical color variation of 2012 DR30, we found through consistent measurements of our spectra and several previously published spectra and colors that its spectral gradient at m appears consistent with m across almost all observational epochs reported so far. The surface homogeneity that this finding suggests is consistent with the report by Kiss et al. (2013) that 2012 DR30 exhibits a minimal rotational lightcurve and therefore also has minimal variation in albedo across its surface. Two epochs of published photometry, if taken at face value, hint that 2012 DR30 may have red spots on its surface (see section 5.1), but self-consistent rotationally resolved color measurements will be required to confirm this.
The homogeneity of the reported optical colors of 2012 DR30 does not seem to extend to NUV/blue wavelengths, however. There is now considerable variation in the reported colors of 2012 DR30 at m, which is at odds with the finding that the spectral gradients measured from our own spectra in this region are completely consistent. Spectral variation also appears at NIR wavelengths. We have tentatively confirmed the detection of water ice on 2012 DR30 reported by Szabó et al. (2018), but by a weak detection of a m water ice band that was absent from their spectrum. Our spectrum does not extend to wavelengths above m, so unfortunately we cannot confirm their detection of the m water ice band. Based on the depth of the m band and model water ice reflectance spectra we predict that the m band strength has not changed much between the observations of Szabó et al. (2018) and ours. If the abundance of water ice is fairly constant across the surface of 2012 DR30, the inconsistent appearance of the m water ice band may hint that the physical properties of the surface of 2012 DR30 are more strongly variegated than its composition. In both the NUV/blue and NIR cases, any observed variation in color may be at odds with the previously reported lack of rotational lightcurve for 2012 DR30 (Kiss et al., 2013). Further self-consistent rotationally resolved observations of 2012 DR30 at NUV/blue and NIR wavelengths are needed to determine if the observed variation is real, and if so what may be causing it.
We have consistently detected a NUV reddening in the reflectance spectrum of 2012 DR30 at m. Such features are rare in the reflectance spectra of TNOs, supporting arguments from dynamical studies that suggest 2012 DR30 and other centaurs are not derived from the trans-Neptunian scattered disk or the Kuiper belt. That said, strong evidence of other high inclination minor planets with a similarly shaped optical reflectance spectrum is currently lacking, although future spectroscopic observations targeting high inclination objects may change that. The cause of the NUV reflectance drop is currently unclear, but we are able to rule out materials such as water ice, methanol ice, and anhydrous mafic silicates as likely candidates. Instead we favour the possibility that the reflectance drop may be caused by aromatic hydrocarbons and/or ferric oxides contained within aqueously altered silicates. Confirmation of the presence of these materials, however, will require observations of 2012 DR30 at wavelengths of m.
References
- Alí-Lagoa et al. (2018) Alí-Lagoa, V., Müller, T. G., Usui, F., & Hasegawa, S. 2018, A&A, 612, A85, doi: 10.1051/0004-6361/201731806
- Appenzeller et al. (1998) Appenzeller, I., Fricke, K., Fürtig, W., et al. 1998, The Messenger, 94, 1
- Astropy Collaboration et al. (2013) Astropy Collaboration, Robitaille, T. P., Tollerud, E. J., et al. 2013, A&A, 558, A33, doi: 10.1051/0004-6361/201322068
- Barkume et al. (2008) Barkume, K. M., Brown, M. E., & Schaller, E. L. 2008, The Astronomical Journal, 135, 55, doi: 10.1088/0004-6256/135/1/55
- Barucci et al. (2011) Barucci, M. A., Alvarez-Candal, A., Merlin, F., et al. 2011, Icarus, 214, 297, doi: 10.1016/j.icarus.2011.04.019
- Barucci et al. (2010) Barucci, M. A., Morea Dalle Ore, C., Alvarez-Candal, A., et al. 2010, AJ, 140, 2095, doi: 10.1088/0004-6256/140/6/2095
- Barucci et al. (2002) Barucci, M. A., Boehnhardt, H., Dotto, E., et al. 2002, Astronomy & Astrophysics, 392, 335, doi: 10.1051/0004-6361:20021186
- Batygin & Brown (2016) Batygin, K., & Brown, M. E. 2016, ApJ, 833, L3, doi: 10.3847/2041-8205/833/1/L3
- Bauer et al. (2013) Bauer, J. M., Grav, T., Blauvelt, E., et al. 2013, The Astrophysical Journal, 773, 22, doi: 10.1088/0004-637X/773/1/22
- Brasser et al. (2012) Brasser, R., Schwamb, M. E., Lykawka, P. S., & Gomes, R. S. 2012, MNRAS, 420, 3396, doi: 10.1111/j.1365-2966.2011.20264.x
- Brown et al. (2012) Brown, M. E., Schaller, E. L., & Fraser, W. C. 2012, The Astronomical Journal, 143, 146, doi: 10.1088/0004-6256/143/6/146
- Brunetto et al. (2006) Brunetto, R., Barucci, M. A., Dotto, E., & Strazzulla, G. 2006, The Astrophysical Journal, 644, 646, doi: 10.1086/503359
- Chen et al. (2016) Chen, Y.-T., Lin, H. W., Holman, M. J., et al. 2016, ApJ, 827, L24, doi: 10.3847/2041-8205/827/2/L24
- Cloutis et al. (2011) Cloutis, E. A., Hiroi, T., Gaffey, M. J., Alexander, C. M. O. ., & Mann, P. 2011, Icarus, 212, 180, doi: 10.1016/j.icarus.2010.12.009
- Cruikshank et al. (2014) Cruikshank, D. P., Dalle Ore, C. M., Clark, R. N., & Pendleton, Y. J. 2014, Icarus, 233, 306, doi: 10.1016/j.icarus.2014.02.011
- Datson et al. (2015) Datson, J., Flynn, C., & Portinari, L. 2015, A&A, 574, A124, doi: 10.1051/0004-6361/201425000
- DeMeo et al. (2009) DeMeo, F. E., Binzel, R. P., Slivan, S. M., & Bus, S. J. 2009, Icarus, 202, 160, doi: 10.1016/j.icarus.2009.02.005
- Di Sisto & Rossignoli (2020) Di Sisto, R. P., & Rossignoli, N. L. 2020, Celestial Mechanics and Dynamical Astronomy, 132, 36, doi: 10.1007/s10569-020-09971-7
- Duffard et al. (2014) Duffard, R., Pinilla-Alonso, N., Santos-Sanz, P., et al. 2014, Astronomy & Astrophysics, 564, A92, doi: 10.1051/0004-6361/201322377
- Emel’yanenko et al. (2005) Emel’yanenko, V. V., Asher, D. J., & Bailey, M. E. 2005, MNRAS, 361, 1345, doi: 10.1111/j.1365-2966.2005.09267.x
- Filippenko (1982) Filippenko, A. V. 1982, Publications of the Astronomical Society of the Pacific, 94, 715, doi: 10.1086/131052
- Fitzsimmons et al. (2018) Fitzsimmons, A., Snodgrass, C., Rozitis, B., et al. 2018, Nature Astronomy, 2, 133, doi: 10.1038/s41550-017-0361-4
- Fornasier et al. (2004) Fornasier, S., Doressoundiram, A., Tozzi, G. P., et al. 2004, Astronomy & Astrophysics, 421, 353, doi: 10.1051/0004-6361:20041221
- Fornasier et al. (2009) Fornasier, S., Barucci, M. A., de Bergh, C., et al. 2009, Astronomy & Astrophysics, 508, 457, doi: 10.1051/0004-6361/200912582
- Fraser et al. (2015) Fraser, W. C., Brown, M. E., & Glass, F. 2015, The Astrophysical Journal, 804, 31, doi: 10.1088/0004-637X/804/1/31
- Freudling et al. (2013) Freudling, W., Romaniello, M., Bramich, D. M., et al. 2013, Astronomy & Astrophysics, 559, A96, doi: 10.1051/0004-6361/201322494
- Gladman et al. (2009) Gladman, B., Kavelaars, J., Petit, J. M., et al. 2009, ApJ, 697, L91, doi: 10.1088/0004-637X/697/2/L91
- Gomes et al. (2015) Gomes, R. S., Soares, J. S., & Brasser, R. 2015, Icarus, 258, 37, doi: 10.1016/j.icarus.2015.06.020
- Gourgeot et al. (2015) Gourgeot, F., Barucci, M. A., Alvarez-Candal, A., et al. 2015, Astronomy & Astrophysics, 582, A13, doi: 10.1051/0004-6361/201526014
- Grav et al. (2012) Grav, T., Mainzer, A. K., Bauer, J., et al. 2012, ApJ, 744, 197, doi: 10.1088/0004-637X/744/2/197
- Grundy & Schmitt (1998) Grundy, W. M., & Schmitt, B. 1998, Journal of Geophysical Research, 103, 25809, doi: 10.1029/98JE00738
- Guilbert et al. (2009) Guilbert, A., Alvarez-Candal, A., Merlin, F., et al. 2009, Icarus, 201, 272, doi: 10.1016/j.icarus.2008.12.023
- Hainaut et al. (2012) Hainaut, O. R., Boehnhardt, H., & Protopapa, S. 2012, A&A, 546, A115, doi: 10.1051/0004-6361/201219566
- Hainaut & Delsanti (2002) Hainaut, O. R., & Delsanti, A. C. 2002, Astronomy & Astrophysics, 389, 641, doi: 10.1051/0004-6361:20020431
- Hapke (2012) Hapke, B. 2012, Theory of Reflectance and Emittance Spectroscopy, 2nd edn. (New York: Cambridge University Press), doi: 10.1017/CBO9781139025683
- Harris et al. (2020) Harris, C. R., Millman, K. J., van der Walt, S. J., et al. 2020, Nature, 585, 357, doi: 10.1038/s41586-020-2649-2
- Hendrix & Vilas (2019) Hendrix, A. R., & Vilas, F. 2019, Geophys. Res. Lett., 46, 14,307, doi: 10.1029/2019GL085883
- Hromakina et al. (2021) Hromakina, T., Belskaya, I., Krugly, Y., et al. 2021, A&A, 647, A71, doi: 10.1051/0004-6361/202039737
- Hudson et al. (2008) Hudson, R. L., Palumbo, M. E., Strazzulla, G., et al. 2008, Laboratory Studies of the Chemistry of Transneptunian Object Surface Materials, ed. M. A. Barucci, H. Boehnhardt, D. P. Cruikshank, A. Morbidelli, & R. Dotson (Tucson, AZ: Arizona Univ. Press), 507
- Hughes & Hase (2010) Hughes, I. G., & Hase, T. P. A. 2010, Measurements and their Uncertainties: A Practical Guide to Modern Error Analysis (New York: Oxford Univ. Press)
- Hunter (2007) Hunter, J. D. 2007, Computing in Science Engineering, 9, 90
- Izawa et al. (2014) Izawa, M. R. M., Applin, D. M., Norman, L., & Cloutis, E. A. 2014, Icarus, 237, 159, doi: 10.1016/j.icarus.2014.04.033
- Jewitt (2015) Jewitt, D. 2015, The Astronomical Journal, 150, 201, doi: 10.1088/0004-6256/150/6/201
- Kiss et al. (2013) Kiss, C., Szabó, G., Horner, J., et al. 2013, Astronomy & Astrophysics, 555, A3, doi: 10.1051/0004-6361/201321147
- Lacerda (2009) Lacerda, P. 2009, The Astronomical Journal, 137, 3404, doi: 10.1088/0004-6256/137/2/3404
- Lellouch et al. (2013) Lellouch, E., Santos-Sanz, P., Lacerda, P., et al. 2013, Astronomy & Astrophysics, 557, A60, doi: 10.1051/0004-6361/201322047
- Levison & Duncan (1997) Levison, H. F., & Duncan, M. J. 1997, Icarus, 127, 13, doi: 10.1006/icar.1996.5637
- Licandro et al. (2018) Licandro, J., Popescu, M., de León, J., et al. 2018, A&A, 618, A170, doi: 10.1051/0004-6361/201832853
- Lorenzi et al. (2014) Lorenzi, V., Pinilla-Alonso, N., Licandro, J., Dalle Ore, C. M., & Emery, J. P. 2014, A&A, 562, A85, doi: 10.1051/0004-6361/201322251
- Mainzer et al. (2011) Mainzer, A., Grav, T., Bauer, J., et al. 2011, ApJ, 743, 156, doi: 10.1088/0004-637X/743/2/156
- Masiero et al. (2011) Masiero, J. R., Mainzer, A. K., Grav, T., et al. 2011, ApJ, 741, 68, doi: 10.1088/0004-637X/741/2/68
- Merlin et al. (2005) Merlin, F., Barucci, M. A., Dotto, E., de Bergh, C., & Lo Curto, G. 2005, A&A, 444, 977, doi: 10.1051/0004-6361:20053642
- Modigliani et al. (2010) Modigliani, A., Goldoni, P., Royer, F., et al. 2010, in Proceedings of the Society of Photo-optical Instrumentation Engineers, Vol. 7737, Observatory Operations: Strategies, Processes, and Systems III (Bellingham, WA: Society of Photo-Optical Instrumentation Engineers), 28, doi: 10.1117/12.857211
- Moffat (1969) Moffat, A. F. J. 1969, Astronomy & Astrophysics, 3, 455
- Mommert et al. (2012) Mommert, M., Harris, A. W., Kiss, C., et al. 2012, Astronomy & Astrophysics, 541, A93, doi: 10.1051/0004-6361/201118562
- Morais & Namouni (2017) Morais, M. H. M., & Namouni, F. 2017, MNRAS, 472, L1, doi: 10.1093/mnrasl/slx125
- Morbidelli et al. (2020) Morbidelli, A., Batygin, K., Brasser, R., & Raymond, S. N. 2020, MNRAS, 497, L46, doi: 10.1093/mnrasl/slaa111
- Pinilla-Alonso et al. (2013) Pinilla-Alonso, N., Alvarez-Candal, A., Melita, M. D., et al. 2013, A&A, 550, A13, doi: 10.1051/0004-6361/201220030
- Porter et al. (2016) Porter, S. B., Spencer, J. R., Benecchi, S., et al. 2016, The Astrophysical Journal, 828, L15, doi: 10.3847/2041-8205/828/2/L15
- Protopapa et al. (2009) Protopapa, S., Alvarez-Candal, A., Barucci, M. A., et al. 2009, A&A, 501, 375, doi: 10.1051/0004-6361/200810572
- Protopapa et al. (2017) Protopapa, S., Grundy, W. M., Reuter, D. C., et al. 2017, Icarus, 287, 218, doi: 10.1016/j.icarus.2016.11.028
- Rabinowitz et al. (2013) Rabinowitz, D., Schwamb, M. E., Hadjiyska, E., Tourtellotte, S., & Rojo, P. 2013, AJ, 146, 17, doi: 10.1088/0004-6256/146/1/17
- Ramírez et al. (2012) Ramírez, I., Michel, R., Sefako, R., et al. 2012, The Astrophysical Journal, 752, 5, doi: 10.1088/0004-637X/752/1/5
- Reddy et al. (2015) Reddy, V., Dunn, T. L., Thomas, C. A., Moskovitz, N. A., & Burbine, T. H. 2015, Mineralogy and Surface Composition of Asteroids, 43–63, doi: 10.2458/azu_uapress_9780816532131-ch003
- Rivkin et al. (2015) Rivkin, A. S., Campins, H., Emery, J. P., et al. 2015, Astronomical Observations of Volatiles on Asteroids, ed. P. Michel, F. E. DeMeo, & W. F. Bottke (Tucson, AZ: Arizona Univ. Press), 65–87, doi: 10.2458/azu_uapress_9780816532131-ch004
- Santos-Sanz et al. (2012) Santos-Sanz, P., Lellouch, E., Fornasier, S., et al. 2012, Astronomy & Astrophysics, 541, A92, doi: 10.1051/0004-6361/201118541
- Seccull et al. (2018) Seccull, T., Fraser, W. C., Puzia, T. H., Brown, M. E., & Schönebeck, F. 2018, The Astrophysical Journal, 855, L26, doi: 10.3847/2041-8213/aab3dc
- Seccull et al. (2019) Seccull, T., Fraser, W. C., Puzia, T. H., Fitzsimmons, A., & Cupani, G. 2019, AJ, 157, 88, doi: 10.3847/1538-3881/aafbe4
- Sheppard (2010) Sheppard, S. S. 2010, The Astronomical Journal, 139, 1394, doi: 10.1088/0004-6256/139/4/1394
- Szabó et al. (2018) Szabó, G. M., Kiss, C., Pinilla-Alonso, N., et al. 2018, The Astronomical Journal, 155, 170, doi: 10.3847/1538-3881/aab14e
- Takir & Emery (2012) Takir, D., & Emery, J. P. 2012, Icarus, 219, 641, doi: 10.1016/j.icarus.2012.02.022
- Taylor (1986) Taylor, B. J. 1986, The Astrophysical Journals, 60, 577, doi: 10.1086/191098
- Tiscareno & Malhotra (2003) Tiscareno, M. S., & Malhotra, R. 2003, The Astronomical Journal, 126, 3122, doi: 10.1086/379554
- Verbiscer et al. (2019) Verbiscer, A. J., Porter, S., Benecchi, S. D., et al. 2019, AJ, 158, 123, doi: 10.3847/1538-3881/ab3211
- Vernazza et al. (2015) Vernazza, P., Marsset, M., Beck, P., et al. 2015, ApJ, 806, 204, doi: 10.1088/0004-637X/806/2/204
- Vernet et al. (2010) Vernet, J., Kerber, F., Mainieri, V., et al. 2010, Highlights of Astronomy, 15, 535, doi: 10.1017/S1743921310010574
- Vernet et al. (2011) Vernet, J., Dekker, H., D’Odorico, S., et al. 2011, Astronomy & Astrophysics, 536, A105, doi: 10.1051/0004-6361/201117752
- Vilas (1994) Vilas, F. 1994, Icarus, 111, 456, doi: 10.1006/icar.1994.1156
- Vilenius et al. (2012) Vilenius, E., Kiss, C., Mommert, M., et al. 2012, Astronomy & Astrophysics, 541, A94, doi: 10.1051/0004-6361/201118743
- Virtanen et al. (2020) Virtanen, P., Gommers, R., Oliphant, T. E., et al. 2020, Nature Methods, 17, 261, doi: https://doi.org/10.1038/s41592-019-0686-2
- Volk & Malhotra (2013) Volk, K., & Malhotra, R. 2013, Icarus, 224, 66, doi: 10.1016/j.icarus.2013.02.016
- Wenger et al. (2000) Wenger, M., Ochsenbein, F., Egret, D., et al. 2000, A&AS, 143, 9, doi: 10.1051/aas:2000332
- Wong et al. (2019) Wong, I., Brown, M. E., Blacksberg, J., Ehlmann, B. L., & Mahjoub, A. 2019, AJ, 157, 161, doi: 10.3847/1538-3881/ab0e00