Surveys of the Cosmic X-ray Background
Abstract
We provide a highly concise overview of what X-ray surveys and their multiwavelength follow-up have revealed about the nature of the cosmic X-ray background (CXRB) and its constituent sources. We first describe early global studies of the CXRB, the development of imaging CXRB surveys, and the resolved CXRB fraction. Second, we detail the sources detected in CXRB surveys describing their identification, classification, and basic nature. Third, since active galactic nuclei (AGNs) are the main contributors to the CXRB, we discuss some key insights about their demographics, physics, and ecology that have come from CXRB surveys. Finally, we highlight future prospects for the field.
Keywords Surveys; Cosmic X-ray background; Cosmology: observations; Galaxies: active; Galaxies; Galaxies: evolution; Galaxies: clusters; Galaxies: groups; X-ray astronomy
1 Introduction
1.1 The Cosmic X-ray Background and Early Global Studies
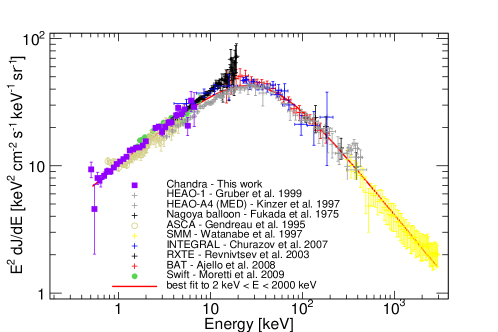
The cosmic X-ray background (CXRB) was the first cosmic background discovered (Giacconi et al. 1962). Broad-band spectral measurements showed the CXRB peaked in intensity at 20–40 keV (see Fig. 1), and that its 3–50 keV spectrum could be acceptably fit with a thermal bremsstrahlung model associated with a hot, optically thin plasma with a temperature of keV (e.g., Marshall et al. 1980). Furthermore, early all-sky surveys showed the CXRB was highly isotropic, indicating that it was primarily extragalactic in nature (e.g., Schwartz 1980). These results led some to argue that the CXRB largely originates in a hot intergalactic medium. However, such early interpretations were definitively ruled out by tight constraints upon the Compton-scattering distortion of the spectrum of the cosmic microwave background (e.g., Mather et al. 1990).
Contemporaneously with these early global studies of the CXRB, increasingly sensitive investigations with X-ray observatories were showing that many extragalactic objects were significant X-ray emitters, including active galactic nuclei (AGNs), galaxies, and galaxy clusters and groups (e.g., Giacconi 1981). These findings indicated that at least some of the CXRB must arise from discrete sources, motivating the formation and growth of an industry investigating the discrete-source contributions to the CXRB.
1.2 Imaging Surveys of the CXRB: A Very Brief Review
The discrete-source nature of much of the low-energy CXRB was supported as imaging X-ray survey observations with Wolter telescopes, such as Einstein and ROSAT, resolved increasing fractions of the CXRB below 2–3 keV (see Fig. 2 left). For example, long-exposure ROSAT surveys in the early-to-mid 1990’s reached 0.5–2 keV flux limits of erg cm-2 s-1 and resolved % of the soft CXRB into discrete sources with a sky density of 800–900 deg-2, the majority of which were identified as AGNs (e.g., Hasinger et al. 1998; Schmidt et al. 1998). The nature of the CXRB near its high-energy peak in intensity, however, remained much less clear. The unobscured and mildly obscured AGNs mostly discovered in early low-energy surveys did not appear to have the requisite spectral properties to explain the broad-band CXRB spectrum, particularly its 20–40 keV peak. However, it was recognized that additional highly obscured AGNs might be capable of explaining the CXRB spectrum, as their photoelectric-absorption cutoffs would lie at higher energies. Most notably, Setti & Woltjer (1989) put forward one of the first “AGN synthesis models” for the CXRB making this point quantitatively, where reasonable assumptions about, e.g., AGN obscuration levels, luminosities, and redshift evolution were shown to be plausibly capable of producing the CXRB spectrum. Such synthesis models, continually refined in light of new data, have become a mainstay of CXRB surveys research, aiding with the interpretation of observational results and making testable predictions for new observations.
The sensitive CXRB-surveys industry at energies above 2–3 keV took longer to develop, largely owing to the technological challenges of focusing and detecting higher energy X-rays. The ASCA mission performed multiple CXRB surveys reaching limiting 2–10 keV fluxes of erg cm-2 s-1 at best, detecting up to sources deg-2 (e.g., Ueda et al. 1998). The most sensitive ASCA surveys were source-confused owing to the limited available angular resolution, making robust source identifications often difficult. The BeppoSAX mission advanced CXRB surveys at 5–10 keV, owing to its improved high-energy imaging capabilities, resolving 20–30% of the 5–10 keV CXRB (e.g., Comastri et al. 2001).
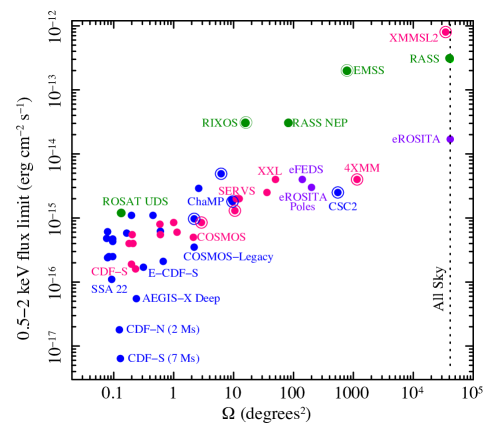
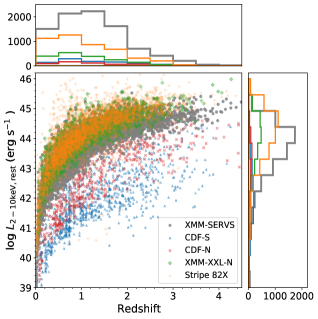
The superb X-ray telescopes and detectors on Chandra and XMM-Newton, both launched in 1999, revolutionized CXRB surveys over the –10 keV band, allowing multiple powerful surveys with up to –600 times (depending upon energy band) the sensitivity of previous X-ray missions (see Fig. 2 left; e.g., Brandt & Alexander 2015). Large samples of up to sources per survey allowed robust statistical characterization of CXRB source populations (see Fig. 3 left), and, owing to small 0.3–3′′ X-ray source positional uncertainties, the majority of the sources could be reliably matched to multiwavelength counterparts for further characterization. The surveying capabilities of Chandra and XMM-Newton are, moreover, highly complementary; e.g., Chandra excels at the highest sensitivity surveys (see Fig. 2 left) owing to its sub-arcsecond imaging which provides a small source-detection cell and largely avoids source confusion, while the larger photon-collecting area of XMM-Newton provides critical spectroscopic information for sources above its confusion limit. While Chandra and XMM-Newton still did not directly cover the 20–40 keV CXRB peak, they did reveal many highly obscured AGNs with strong signatures of nuclear Compton “reflection”. This added support to the idea that such objects are largely responsible for the overall CXRB spectrum, as formalized with improved AGN synthesis models (e.g., Gilli et al. 2007; Ananna et al. 2019).
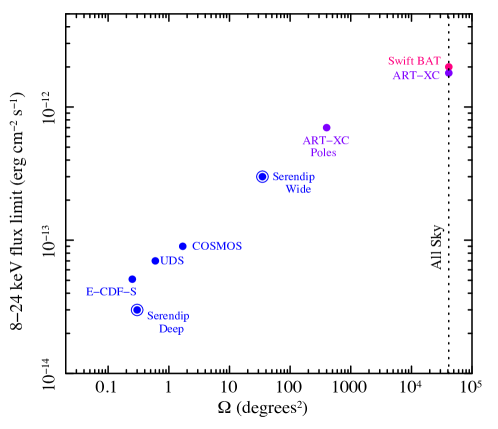
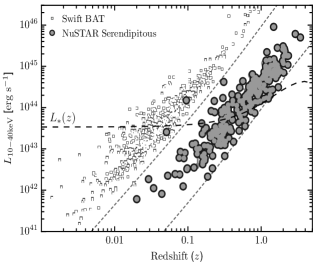
Over the past two decades, CXRB surveys at higher energies of 10–200 keV also advanced dramatically (see Fig. 2 right). First, INTEGRAL and Swift BAT (launched in 2002 and 2004, respectively) provided new coded-aperture all-sky hard X-ray surveys that generated sizable AGN samples, mostly at , with much reduced obscuration bias (e.g., Mereminskiy et al. 2016; Oh et al. 2018). Then, in 2012, NuSTAR provided the first high-energy focusing X-ray telescopes in orbit, and it became possible to conduct multiple CXRB surveys reaching up to observed –24 keV that explore the keV sky with about a one-hundred-fold improvement in sensitivity (e.g., Harrison et al. 2016; Lansbury et al. 2017). These reached ever closer to the 20–40 keV CXRB peak, still further confirming the presence of obscured AGNs capable of explaining the CXRB spectrum. The AGNs detected in NuSTAR CXRB surveys mostly lie at –3, and the combination of INTEGRAL, Swift BAT, and NuSTAR allow AGNs to be surveyed at high rest-frame energies over most of cosmic time (see Fig. 3 right).
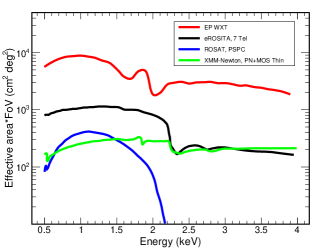
Most recently, in Fall 2019 eROSITA on Spektrum-Roentgen-Gamma (SRG) started its 4-year program of surveying the entire 0.2–5 keV sky (e.g., Predehl et al. 2021). When completed, eROSITA will reach typical flux limits below 2 keV (a 0.5–2 keV flux limit of erg cm-2 s-1) about 25 times deeper than those of ROSAT, which provided the previously most-sensitive soft X-ray all-sky survey (see Fig. 2 left). Millions of extragalactic sources are expected in the final eROSITA survey. After these are well characterized, an enormous undertaking, they will allow studies of the bright source populations of the CXRB with overwhelming statistics. SRG also carries ART-XC, which is simultaneously conducting a sensitive 4–30 keV all-sky survey that should ultimately surpass other comparable surveys in this band considering angular resolution, sensitivity, and uniformity together (see Fig. 2 right); the ART-XC survey should detect thousands of sources (e.g., Pavlinsky et al. 2021).
As shown in Fig. 2, the surveys conducted by the above-described missions have effectively covered much of the 0.5–24 keV sensitivity vs. solid-angle “discovery space” in a “wedding-cake” pattern (i.e., ranging from shallow, wide-field surveys to deep, pencil-beam surveys).
1.3 The Currently Resolved CXRB Fraction
For almost 60 years, a key driver of X-ray astronomy has been to resolve the CXRB. While this has not yet been fully accomplished, particularly at the 20–40 keV CXRB peak, enormous progress has been made, and it seems clear that the CXRB indeed primarily arises from discrete point sources, largely obscured AGNs.
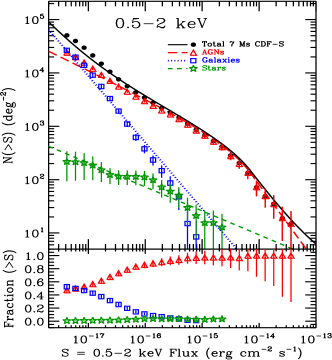
The deepest Chandra surveys, aided by a “bright-end correction” from wider field surveys, resolve % and % of the CXRB intensity in the 0.5–2 keV and 2–8 keV bands, respectively (e.g., Luo et al. 2017). The Chandra source number counts reach deg-2 with securely identified AGNs making up deg-2 and the strong majority of the resolved flux (see Fig. 4 left). Notably, at the faintest 0.5–2 keV fluxes galaxies slightly surpass the sky density of AGNs, and the galaxy number counts continue rising quickly to the faintest flux levels probed. While some of these galaxies likely contain unrecognized AGNs, it seems clear that galaxies will be the numerically dominant X-ray source population at still fainter fluxes. They are expected to contribute % to the still-unresolved portion of the 0.5–2 keV CXRB; the rest likely comes from Galactic contributions, clusters and groups, and perhaps very high-redshift () black holes.
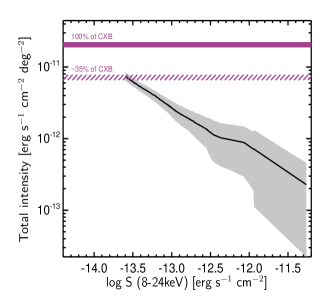
At the important higher energies, NuSTAR surveys directly resolve % of the 8–24 keV CXRB emission (see Fig. 4 right; e.g., Harrison et al. 2016), although most of the relevant NuSTAR sources are not detected above keV. The high-energy NuSTAR number counts reach deg-2 and are strongly dominated by AGNs. At still higher energies (e.g., 20–60 keV), only a few percent of the CXRB has been directly resolved (e.g., Krivonos et al. 2021).
2 Sources Detected in CXRB Surveys
2.1 CXRB Source Counterparts, Redshifts, and Classifications
Once an X-ray source has been detected in a CXRB survey, its basic nature must be determined before it can be used for most scientific studies. In addition to the X-ray data themselves, such source classification typically relies upon both multiwavelength photometric imaging data covering as much of the source’s spectral energy distribution (SED) as possible as well as optical/infrared spectroscopic data. Such source-classification work is a fundamental, large, challenging, and sometimes underappreciated component of the CXRB-surveys industry.
Counterpart matching: To begin, the X-ray source must be matched correctly to its true multiwavelength counterpart. Such matching is now generally done statistically with likelihood-ratio or Bayesian techniques that balance matching completeness vs. reliability (e.g., Sutherland & Saunders 1992; Salvato et al. 2018), and the availability of high-quality multiwavelength imaging data considerably helps with the matching process (e.g., in setting statistical matching priors and accommodating counterparts with varied SEDs). The matching process depends strongly upon the sky density of plausible counterparts, and thus matching details vary substantially from survey-to-survey (e.g., Swift BAT vs. deep Chandra surveys). In the commonly encountered regime of faint (say, -band magnitudes of –25) counterparts, X-ray sources with positional uncertainties of 1–3′′ or better (e.g., from Chandra or XMM-Newton) allow suitable counterpart identification for most scientific purposes, provided high-quality multiwavelength imaging is available (e.g., Marchesi et al. 2016; Luo et al. 2017; Ni et al. 2021a). In the best cases, up to % of the X-ray sources can be matched to counterparts. For larger positional uncertainties in the faint-counterpart regime, the robustness of the matching quickly declines, and caution is warranted. In some cases, a CXRB survey with large X-ray positional uncertainties will first be matched to another overlapping CXRB survey with smaller positional uncertainties before multiwavelength counterpart determination; e.g., the identification of NuSTAR sources in sky regions also having Chandra or XMM-Newton coverage (e.g., Lansbury et al. 2017).
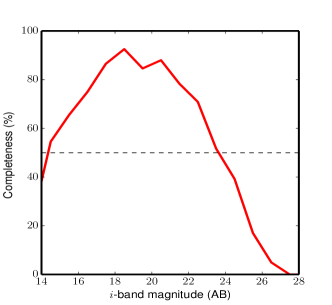
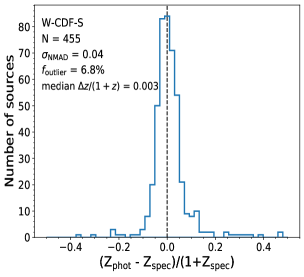
Redshift determination: Once a secure multiwavelength counterpart has been found, a counterpart redshift must be determined for most scientific applications (the X-ray data alone generally do not provide reliable redshifts, though there are notable exceptions). Ideally, this is done with a high-quality optical/infrared spectrum that identifies multiple spectral features, and a wide variety of 1–10 m telescopes, often with multi-object spectrographs, have been productively employed for spectroscopic follow-up of CXRB survey sources. Spectroscopic redshifts for CXRB sources can generally be obtained down to -band magnitudes of –24 with long exposures on large telescopes, but at still fainter magnitudes the spectroscopic-redshift completeness drops rapidly (e.g., see Fig. 5 left). In this regime, and when spectroscopic follow-up at brighter magnitudes becomes prohibitively expensive, photometric-redshift estimates are generally employed. After much effort, it has now become possible to derive quality photometric redshifts (with –8% accuracy in ) for many of the AGNs found in CXRB surveys that have sensitive photometric data broadly and densely spanning the optical/infrared SED (e.g., see Fig. 5 right; e.g., Luo et al. 2017; Salvato et al. 2019; Ni et al. 2021a). However, photometric redshifts for X-ray-selected AGNs generally have larger uncertainties and a higher fraction of catastrophic mis-estimates than those for galaxies without active nuclei. Broad-line AGNs particularly challenge photometric-redshift analyses and have elevated uncertainties and catastrophic mis-estimates. In the best-studied CXRB survey fields, the combination of spectroscopic and photometric approaches now provide a redshift completeness above 95%, sufficient for reliable conclusions about CXRB source populations over cosmic time.
Source classification: A variety of measured properties are commonly employed to sort CXRB survey sources having secure counterparts and redshifts into classes such as AGNs, galaxies, clusters and groups, and transients. These include
-
1.
X-ray luminosity, spectral shape, variability, and morphology;
-
2.
X-ray-to-optical/infrared flux ratio;
-
3.
Optical/infrared emission-line and continuum properties; and
-
4.
Radio morphology and core surface brightness.
Further discussion of these approaches is given in, e.g., Brandt & Alexander (2015). Additionally, SED fitting codes can be used, e.g., to assess if significant AGN power appears present (e.g., Pouliasis et al. 2020; Yang et al. 2020). In most cases, several independent approaches are utilized to cross-check classifications, thereby providing reliably classified samples.
2.2 Main Extragalactic Source Types
Classification of CXRB survey sources reveals a wide variety of source types, and below we will briefly describe the main extragalactic populations discovered.
AGNs: AGNs are the energetically dominant source type detected in all CXRB surveys, and they also dominate numerically in all but the 1–2 deepest 0.5–2 keV surveys (where galaxies appear to dominate numerically). Their primary X-ray emission is thought to be largely created via Compton up-scattering in an accretion-disk “corona” in the immediate vicinity of the supermassive black hole (SMBH), but X-rays may also arise from the accretion disk itself (at low energies) or jets. CXRB surveys are extremely effective at discovering AGNs for three key reasons:
-
1.
Luminous AGNs appear almost universally to produce substantial X-ray emission, typically making up 1–20% of the total power emitted;
-
2.
The penetrating nature of high-energy X-rays allows detection of the common obscured systems that are often missed at other wavelengths, and any X-ray biases against obscured systems decline with increasing redshift; and
-
3.
X-rays provide superior contrast between AGN light and host-galaxy starlight, thereby minimizing confusion between the two.
These three points together explain why deep X-ray surveys have discovered the highest sky density of AGNs, up to 23,900 deg-2, compared to any other wavelength (see Fig. 4 left).
The variety of CXRB surveys conducted (see Fig. 2) have discovered AGNs in significant numbers from the local universe to , thereby allowing studies of AGN properties over most of cosmic time (e.g., see Fig. 3). Even at high redshifts of –5, deep CXRB surveys allow the discovery of many moderate-to-low luminosity AGNs, comparable to the well-studied Seyfert galaxies in the local universe (e.g., Vito et al. 2018). The full range of AGN X-ray luminosity commonly found across CXRB surveys spans an impressive five orders of magnitude, – erg s-1, and optical counterpart magnitudes span –28.
As expected from the shape of the CXRB, X-ray surveys reveal vast numbers of obscured AGNs at all redshifts, with a generally higher fraction of obscured AGNs being found by progressively higher energy surveys. X-ray spectral fitting of the obscured systems finds intrinsic absorption column densities spanning – cm-2 and frequently reveals X-ray absorption complexity (e.g., partially covering or ionized absorption). There are also unobscured systems having intrinsic consistent with zero. The AGN column density distribution generally appears log-normal in form with a peak around cm-2 (e.g., Ueda et al. 2014; Liu et al. 2017) when averaged over wide ranges of redshift and luminosity (note the distribution depends upon both of these quantities; see §3.2).
Consistent with the wide ranges of AGN luminosity and X-ray absorption level, the optical/infrared appearances of AGNs from CXRB surveys are varied, ranging from obvious blue, broad-line AGNs to elusive AGNs that are host dominated and challenging to distinguish from normal galaxies (e.g., Luo et al. 2010; Hickox & Alexander 2018). The X-ray unobscured vs. obscured classifications do not always map simply onto the classical optical type 1 vs. type 2 classifications, though there is generally respectable correspondence (e.g., Merloni et al. 2014; Koss et al. 2017).
Much additional information about the AGNs from CXRB surveys is given in §3.
Galaxies: Galaxies are significant contributors to the 0.5–7 keV source number counts at the faint fluxes probed by deep CXRB surveys. They most prominently contribute in the 0.5–2 keV band but also materially contribute from 2–7 keV. Galaxies numerically dominate over AGNs in the X-ray number counts below 0.5–2 keV fluxes of erg cm-2 s-1 (see Fig. 4 left); a similar situation is found in deep radio surveys reaching below a few mJy. The detected X-ray emission primarily originates from the accreting X-ray binary (XB) populations inhabiting these galaxies (including ultraluminous X-ray sources). Below –2 keV, hot gas emission often contributes materially as well, arising from, e.g., supernova remnants, starburst-driven outflows, and hot interstellar media. Unrecognized SMBH activity (e.g., from low-luminosity or elusive highly obscured AGNs) inevitably also contributes in some systems.
The X-ray detected galaxies in deep CXRB surveys typically lie at –1.5 (e.g., Luo et al. 2017), and they thereby allow the evolution of galaxy X-ray source populations to be investigated over the last % of cosmic time. These galaxies generally have X-ray luminosities of – erg s-1 and relatively soft X-ray spectra with effective power-law photon indices of –2.2. They include both late-type and early-type morphologies, and they span wide ranges of stellar mass () and star-formation rate (SFR).
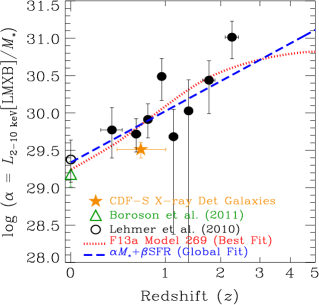
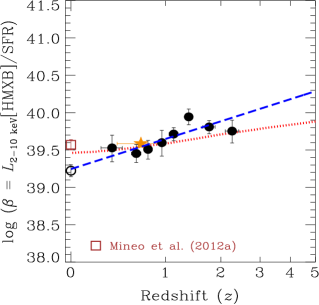
Stacking-based analyses with deep CXRB surveys have allowed systematic studies of normal-galaxy X-ray source populations over the redshift range –3 (e.g., Lehmer et al. 2016), and these have shown that average galaxy over cosmic time is a function of at least (primarily relating to low-mass XBs; LMXBs), SFR (primarily relating to high-mass XBs; HMXBs), and redshift. The redshift evolution leads to generally rising at higher redshift with scaling relations of and ; see Fig. 6. The upward evolution for LMXBs and HMXBs is respectively attributed to declining galaxy stellar ages and metallicities (e.g., Fornasini et al. 2020), although further investigations of these putative drivers are required.
Galaxy clusters and groups: Galaxy clusters and groups are detected in significant numbers (up to deg-2) in CXRB surveys below keV, standing out owing to their spatial extension and relatively soft X-ray spectra. Their X-ray emission arises from their hot intracluster/intragroup media (ICM/IGM) via a combination of bremsstrahlung, line radiation, and recombination emission; AGNs present in the cluster/group also often contribute to the total X-ray luminosity. The ICM generally outweighs the optically visible galaxies in clusters by a factor of –10, yet it is very difficult to observe at non-X-ray wavelengths; in groups the IGM often has a mass comparable to or less than that of the galaxies.
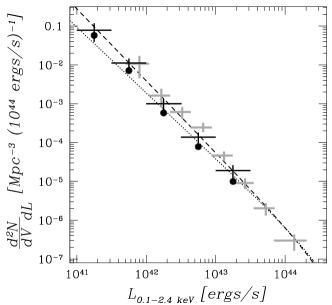
CXRB surveys have discovered thousands of clusters/groups with – erg s-1 from –1 and an increasing number at –2 and beyond (e.g., see Fig. 7 left; e.g., Böhringer et al. 2004; Finoguenov et al. 2015; Adami et al. 2018; Liu et al. 2021a). These span masses of –20) M⊙ ( is the mass within , the radius within which the mean density is equal to 500 times the critical density).
Cluster/group samples from CXRB surveys have provided key insights into the CDM cosmology via measurements of, e.g., the baryonic mass fraction and the evolution of cluster number counts (e.g., Allen & Mantz 2020). The eROSITA survey should soon deliver clusters extending to , and these will ultimately provide precision cosmological constraints (e.g., Predehl et al. 2021).
Transients: CXRB surveys have played a role in serendipitously discovering new types of extragalactic X-ray transients. This dates back to at least the ROSAT All-Sky Survey, which discovered multiple tidal disruption event (TDE) candidates and other galactic giant X-ray outbursts, some of which remain poorly understood (e.g., Komossa 2015). Chandra and XMM-Newton surveys have discovered other extragalactic transients, including the revelation of a new population of fast X-ray transients (FXRTs) with durations of s and relatively faint X-ray fluxes (e.g., see Fig. 7 right; e.g., Yang et al. 2019a; Quirola-Vásquez et al., in prep). FXRTs may be binary neutron-star merger events that form magnetars, off-axis gamma-ray bursts, and/or TDEs involving the disruption of a white dwarf by an intermediate mass black hole. The eROSITA survey is now discovering new X-ray selected TDEs and other transients.
3 Insights on the AGN Population from CXRB Surveys
As described in §2, AGNs are the energetically dominant contributors to the CXRB and usually dominate numerically in CXRB surveys as well. Therefore, in this section we will present some key insights about AGN demographics, physics, and ecology revealed by CXRB surveys.
3.1 AGN Demographics
Pre-Chandra/XMM-Newton era: The AGN luminosity function (LF) describes the AGN comoving number density as a function of luminosity and redshift. Since the discovery of the first AGNs, the LF has attracted intense investigations. Early studies before were largely limited to the LF’s luminous end (i.e., quasars, –100 deg-2) selected by optical surveys (see, e.g., Hartwick & Schade 1990 for a review). These studies established that the number density of quasars peaks at –3, despite the relatively large uncertainties at high redshifts ().
ROSAT, thanks to its unprecedented sensitivity (at the time; see §1.2) from 0.1–2.4 keV and large field of view ( diameter), delivered several key results that fundamentally shaped our understanding of AGN demographics. The ROSAT Deep Survey detected discrete X-ray sources reaching a surface density of –900 deg-2, most () of which are AGNs (e.g., Hasinger et al. 1998; Schmidt et al. 1998). ROSAT enabled the first comprehensive studies of the AGN X-ray luminosity function (XLF; e.g., Miyaji et al. 2000). These favored luminosity-dependent density evolution (LDDE) models, such that more luminous AGNs evolve more strongly as a function of redshift. Similar to the optical/radio results, the ROSAT-based XLF rises sharply from to –3. However, the XLF was poorly constrained at higher redshifts, and the inferred X-ray AGN number density was consistent with a constant at . The XLF could account for 60–90% (depending upon the specific LDDE model) of the 0.5–2 keV CXRB, indicating that the observed soft CXRB largely originates from distant AGNs.
Redshift evolution of AGN number density: Thanks to their order-of-magnitude sensitivity improvements compared to previous missions, Chandra and XMM-Newton have significantly pushed forward studies of AGN demographics. Their deepest surveys have detected an enormously dense AGN population, reaching a sky density of 23,900 deg-2 (e.g., Luo et al. 2017). This density is more than 1 and 2 orders of magnitude higher than those of ROSAT-detected AGNs and SDSS quasars, respectively (e.g., Hasinger et al. 1998; Palanque-Delabrouille et al. 2013).
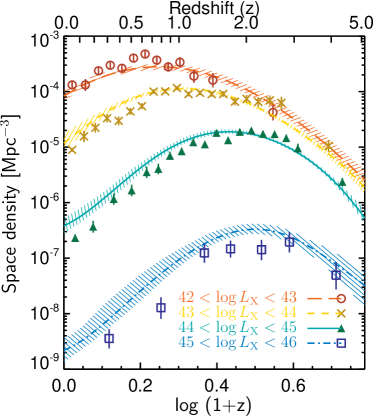
Chandra and XMM-Newton are able to detect a fairly complete AGN sample over wide luminosity, redshift, and obscuration ranges (see Fig. 3 left), allowing detailed characterization of the AGN XLF. The most outstanding feature of the AGN XLF is so-called “AGN downsizing”: the number density of higher luminosity AGNs peaks at higher redshift (e.g., Cowie et al. 2003; Ueda et al. 2014; Aird et al. 2015). For example, AGNs with erg s-1 and erg s-1 peak at and , respectively. Fig. 8 (left) displays the number-density evolution for AGNs within different luminosity ranges, where downsizing is apparent. Similar downsizing behavior has also been found among optically and radio-selected AGNs (e.g., Croom et al. 2009; Rigby et al. 2011). The AGN-downsizing behavior suggests that more-massive SMBHs today generally form earlier in cosmic history. Interestingly, a similar phenomenon has also been found in studies of galaxy formation: in the local universe, more-massive galaxies tend to have older stellar populations than less-massive ones (e.g., Thomas et al. 2005); observations of distant galaxies have directly demonstrated this galaxy-downsizing picture (e.g., Cowie et al. 1996; Juneau et al. 2005). The evolutionary similarity between AGNs and galaxies suggests some fundamental links between SMBH and stellar growth (see §3.3).
AGN downsizing behavior poses a significant theoretical challenge. In the framework of the CDM universe, dark-matter halos form hierarchically, i.e., low-mass halos form first and they merge into massive halos later in cosmic time (e.g., White & Rees 1978; Blumenthal et al. 1984). A straightforward scenario is that SMBH and galaxy growth also follow this hierarchical path, because they evolve in the central regions of dark-matter halos. However, the observed AGN and galaxy downsizing appear to go against this scenario, and thus downsizing phenomena are often described as “anti-hierarchical”. Modern cosmological simulations can roughly yield the trend of downsizing by involving physical mechanisms of AGN feedback (e.g., Scannapieco et al. 2005; Sijacki et al. 2015; Volonteri et al. 2016). However, further work is needed to reproduce the observed AGN XLF across all redshifts and luminosities (e.g., Rosas-Guevara et al. 2016; Habouzit et al. 2019).
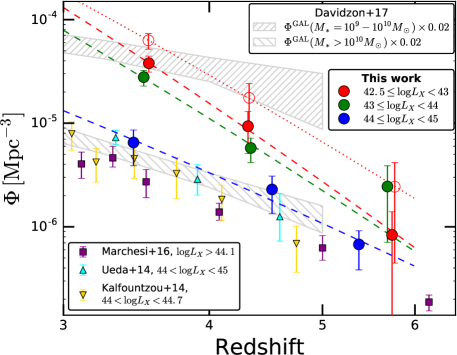
High-redshift AGNs attract particular attention, because they are closely related to the seeding and early formation of SMBHs. One of the most important lessons from Chandra and XMM-Newton is that the AGN number density declines sharply as a function of redshift at (e.g., Barger et al. 2003; Silverman et al. 2008), which was not shown with the ROSAT data (see above). Fig. 8 (right) displays the AGN number density evolution at . Adopting a power-law functional form of , the power-law index describing the number-density decline is –9, depending on the AGN luminosity. This means there are –150 times fewer AGNs at than at . X-ray stacking analyses indicate that low-luminosity AGNs undetected by the deepest Chandra surveys contribute negligibly to the total cosmic accretion power (e.g., Vito et al. 2016). Given the weak AGN activity at high redshifts, AGNs are unlikely the dominant sources driving cosmic hydrogen reionization (e.g., Parsa et al. 2018; Vito et al. 2018; Ananna et al. 2020).
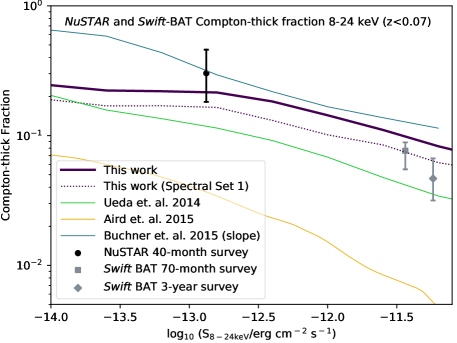
While Chandra and XMM-Newton sample X-ray photons up to keV, NuSTAR and Swift BAT can detect photons at higher energies (–79 keV for NuSTAR; 14–195 keV for Swift BAT). This allows them to detect and characterize some heavily obscured AGNs, which could be very faint in lower-energy bands (e.g., Alexander et al. 2013; Civano et al. 2015; Harrison et al. 2016; Lansbury et al. 2017). Studies based on the NuSTAR and Swift BAT surveys suggest that the Compton-thick ( cm-2) fraction among all AGNs is , a few times higher than some earlier results (e.g., Ananna et al. 2019). Fig. 9 (left) compares the Compton-thick fractions from NuSTAR and Swift BAT vs. those from different XLF models.
The ongoing eROSITA all-sky survey (see §1.2) will be particularly helpful for constraining the XLF at and the luminous end of high-redshift XLF (e.g., Wolf et al. 2021). The eROSITA team has released a deg2 survey field, eFEDS (see Fig. 2 left; Brunner et al. 2021). Fig. 9 (right) compares the XLF constrained by eFEDS with those extrapolated from lower- XLF models. The eFEDS data point appears to be higher than most of the model values, but the uncertainty is still too large for a firm conclusion. The full eROSITA release in the future will clarify whether the discrepancy is statistically significant or not.
X-ray missed AGNs: Although X-ray observations have several advantages for AGN detection (see §2.2), even deep CXRB surveys may still miss some AGNs powered by actively growing SMBHs. Multiwavelength identifications of these X-ray missed AGNs are critically important, because complete AGN samples are necessary to draw an unbiased picture of SMBH formation and evolution. There are mainly two types of AGNs that might be missed by X-ray selection: one is intrinsically X-ray weak, and the other is heavily obscured. We discuss these two types of objects separately below.
Some luminous quasars like PHL 1811 have been found to have weak X-ray emission, more than 10 times below the expectations from the relation for typical AGNs (e.g., Leighly et al. 2007; Luo et al. 2014). The weak X-ray emission appears to be intrinsic, as spectral analyses suggest these particular quasars are X-ray unobscured. However, such X-ray weak objects appear rare, consisting of only a few percent of SDSS quasars (e.g., Gibson et al. 2008; Pu et al. 2020). Considering this rarity, our general understanding of AGN demographics appears largely unaffected by the intrinsically X-ray weak population.
Compared to intrinsic X-ray weakness, heavy obscuration is a more common cause of incompleteness of X-ray surveys. When obscuration reaches above the Compton-thick level, even hard X-rays are significantly suppressed due to Compton scattering and subsequent photoelectric absorption. Despite AGN-demographics studies to correct for the incompleteness caused by selection biases against Compton-thick sources, these efforts must make strong assumptions about several key factors such as distribution above cm-2 and X-ray spectral shapes (e.g., Ueda et al. 2014; Aird et al. 2015; Buchner et al. 2015; Ananna et al. 2019). The uncertainties associated with these assumptions are a major obstacle to achieving the full picture of AGN demographics, which could be quite different from our current understanding. For example, the currently observed sharp decline of AGN activity at (see Fig. 8 right) might be exaggerated by Compton-thick obscuration (e.g., Yang et al. 2021b).
To address better the issue of X-ray incompleteness, it is important to develop multiwavelength identification methods to effectively select Compton-thick AGNs (see Brandt & Alexander 2015; Padovani et al. 2017; Hickox & Alexander 2018 for reviews). One popular method is using broad-band mid-infrared (MIR) photometry to capture AGN dust re-emission (e.g., Lacy et al. 2004; Donley et al. 2012). Another is using optical/IR spectroscopy to detect high-ionization lines that are beyond typical star-formation ionization energies (e.g., Steidel et al. 2002; Alexander et al. 2008). However, due to the constraints of survey sensitivity and/or wavelength coverage, these methods are generally limited to bright objects. Fortunately, JWST will soon provide unprecedentedly deep IR imaging and spectroscopy. It may potentially detect a significant population of Compton-thick AGNs and improve our understanding of AGN demographics across cosmic history (e.g., Satyapal et al. 2021; Yang et al. 2021a,b).
3.2 AGN Physics
X-ray obscuration: In §2.2, we briefly introduced AGN X-ray obscuration including its measurement, the basic distribution, and its relation to optical obscuration. In this section, we mainly focus on the dependence of X-ray obscuration upon redshift, AGN luminosity, and host-galaxy properties.
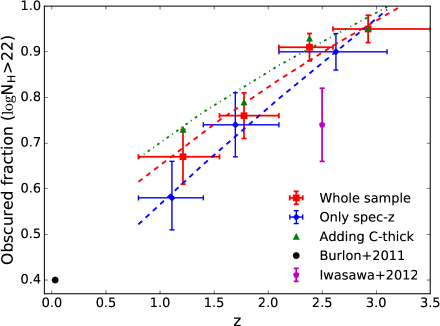
AGN X-ray obscuration shows significant cosmic evolution. The general trend is that the obscuration rises strongly from to (e.g., Buchner et al. 2015; Liu et al. 2017). Fig. 10 (left) displays the obscured AGN fraction as a function of redshift. For AGNs with erg s-1, the obscured fraction ( cm-2) increases from at to at . The obscuration-redshift relation is broadly consistent with the fact that the obscuring materials (mainly cold gas) are more abundant in the earlier universe. Interestingly, most studies of the Compton-thick AGN fraction have not found a significant redshift dependence (e.g., Buchner et al. 2015; Ananna et al. 2019; Li et al. 2019; but also see Lanzuisi et al. 2018). However, the uncertainties are large, especially considering detection incompleteness for the Compton-thick population (e.g., Hickox & Alexander 2018). At high redshifts of , measurements become challenging due to the general faintness of high-redshift objects. However, studies have suggested that the obscuration-redshift relation “saturates” at high redshifts, i.e., the obscured fraction roughly remains constant at (e.g., Liu et al. 2017; Vito et al. 2018).
At a given redshift (), AGN X-ray obscuration becomes weaker toward higher luminosities (e.g., Merloni et al. 2014; Liu et al. 2017). For example, at , the obscured fraction drops from 75% at erg s-1 to 40% at erg s-1. This luminosity dependence can be understood within the framework of the AGN-unification model, which envisages a toroidal obscuring structure (e.g., Antonucci 1993; Netzer 2015). In this model, whether a specific AGN is obscured depends on the viewing angle, and thus the obscured fraction is numerically equivalent to the torus covering factor for an AGN sample. It has been reasonably proposed that the torus covering factor is negatively related to AGN luminosity (or Eddington ratio), because more powerful central engines could blow away more obscuring materials via radiation pressure and/or winds (a “receding torus”; e.g., Lawrence 1991; Netzer 2015; Ricci et al. 2017). However, observations suggest that the obscuration-luminosity anticorrelation may not hold for high-redshift () AGNs, although the uncertainties are considerable (e.g., Vito et al. 2014, 2018; Buchner et al. 2015).
Since AGN activity is closely related to host-galaxy properties (see §3.3), it is natural to wonder if AGN obscuration also depends upon galaxy properties. Studies have not found a significant difference in host-galaxy or SFR for X-ray obscured vs. unobscured AGNs (e.g., Merloni et al. 2014; Mountrichas et al. 2021b; but also see Lanzuisi et al. 2017). Interestingly, studies indicate that optical type 2 AGNs tend to have higher compared to type 1 AGNs, although these two classes have similar SFR distributions (e.g., Zou et al. 2019; Mountrichas et al. 2021c). The different behaviors of X-ray and optical obscuration suggest that they may have different physical origins. However, robust measurements of host-galaxy properties can be challenging, especially for luminous AGNs which outshine host starlight, and further investigations are needed to test AGN obscuration-galaxy connections.
Multiwavelength energy distribution of X-ray, UV/optical, and IR: Modern imaging surveys can effectively sample the SEDs for large numbers of extragalactic sources. The investigation of AGN multiwavelength SEDs is an effective way to gain insight into AGN physics, as they reflect the physical structures of, e.g., the accretion disk and its corona.
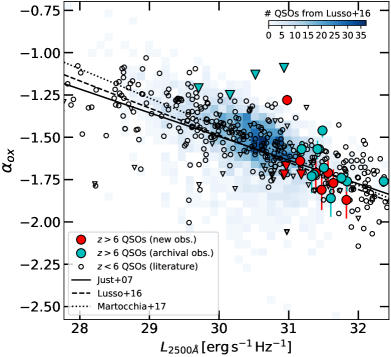
Perhaps the most fundamental SED feature is the tight connection between UV/optical and X-ray luminosities for type 1 AGNs. Conventionally, researchers have used a quantity, , the SED slope between UV and X-ray.111, where and are rest-frame 2500 and 2 keV monochromatic luminosities with units of erg s-1 Hz-1, respectively. It has been found that is tightly correlated with (e.g., Steffen et al. 2006; Just et al. 2007; Lusso et al. 2010; Lusso & Risaliti 2016). Fig. 10 (right) displays an example of this relation. The - relation has an intrinsic scatter of only in , over more than five orders of magnitude in . This scatter translates to a factor of –3 in terms of the - relation. The best-fit - relation has a negative slope of , indicating that more luminous AGNs tend to have larger UV-to-X-ray ratios. Studies have generally not found a significant redshift evolution of the - relation up to –7, indicating this relation is determined by some fundamental accretion physics (e.g., Vito et al. 2019; Wang et al. 2021; see Fig. 10 right). Taking advantage of this apparent redshift independence, some researchers have proposed to use quasars as “standard candles” to constrain cosmological parameters (e.g., Lusso & Risaliti 2017).
The - relation discussed above is mainly investigated using type 1 AGN samples, where the AGN UV emission is directly observable. Under the scheme of AGN unification, this relation should also hold for the central engines of the type 2 population, despite their obscuration. Based on this idea, Yang et al. (2020) developed a SED-fitting code, x-cigale. x-cigale builds SED templates from X-ray to IR by applying the - relation to physical AGN UV-to-IR models, in which the intrinsic is also known for type 2 AGNs. Using x-cigale, studies have successfully fitted observed type 2 SEDs, supporting the AGN-unification scheme (e.g., Yang et al. 2020; Mountrichas et al. 2021a; Toba et al. 2021). The fitted X-ray vs. MIR AGN luminosities are also consistent with empirical AGN - relations (see, e.g., Fig. 15 of Toba et al. 2021), indicating these relations are physically driven by the - relation.
Some observational studies have suggested that the observed - relation might actually be driven by a more fundamental connection between and Eddington ratio (e.g., Lusso et al. 2010; Jin et al. 2012). The Eddington-ratio dependence is also favored by some theoretical studies of the AGN disk-corona system (e.g., Cao 2009; Kubota & Done 2018). However, the dependence on Eddington ratio is still controversial, likely due to the strong degeneracy with and the relatively large uncertainties in SMBH-mass measurements (e.g., Shemmer et al. 2008; Liu et al. 2021b).
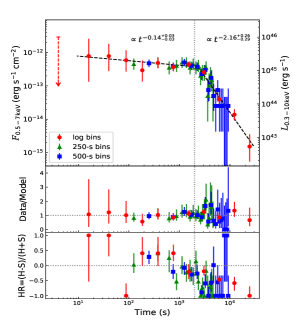
X-ray variability: Modern X-ray surveys often obtain multiple exposures on the same sky region to reach higher sensitivities. As a bonus, multiple exposures also enable time-domain analyses on timescales from days to years. These analyses can effectively reveal some essential physical properties of AGNs. It has been proposed that a significant fraction of observed AGNs might be powered by TDEs instead of normal gas accretion (e.g., Milosavljević et al. 2006). Whether an X-ray AGN is powered by a TDE or gas accretion can be distinguished with long-term (years) variability analyses. A TDE-powered AGN likely will decay monotonically over time (except for the initial burst), and the change in X-ray flux can reach orders of magnitude (e.g., Komossa 2015). In contrast, a normal AGN has stochastic variability with much milder amplitudes. The long-lived Chandra and XMM-Newton missions allow the characterization of AGN long-term variability.
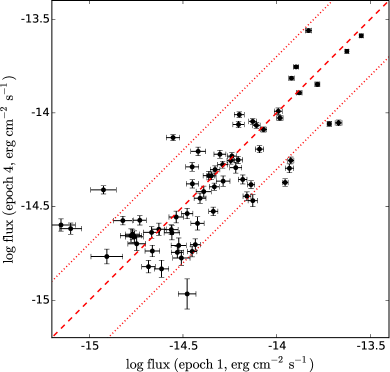
Fig. 11 (left) compares the fluxes from two observational epochs separated by years. The flux changes between the two epochs are stochastic with amplitudes generally less than a factor of –3. This result suggests these AGNs are likely powered by normal gas accretion rather than TDEs. Actually, systematic searches for TDEs in X-ray surveys indicate the fraction of TDE-powered AGN is at most (e.g., Luo et al. 2008; Zheng et al. 2017). The mild stochastic variability also indicates that novel AGN phenomena such as “changing-look” events and emission-state changes are rare, because those phenomena are often associated with large changes in X-ray flux.
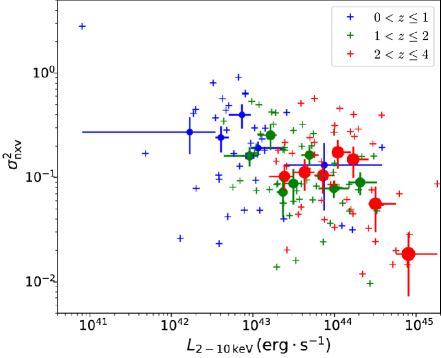
From X-ray spectral analyses, it has been found that the observed distant AGN X-ray flux variations are largely due to changes of the intrinsic luminosity rather than obscuration (e.g., Yang et al. 2016; Falocco et al. 2017). This finding means X-ray variability can be used to probe the central engine properties. Deep-field observations have found X-ray variability amplitudes are anti-correlated with luminosities, as is known in the local universe (e.g., Lanzuisi et al. 2014; Yang et al. 2016; Zheng et al. 2017). Fig. 11 (right) displays this anti-correlation. By fitting the variability-luminosity relation with physical models of power spectral density (PSD), researchers can constrain SMBH masses and Eddington ratios for different samples and thereby study the cosmic evolution of these fundamental properties (e.g., Paolillo et al. 2017; Zheng et al. 2017).
Finally, timing analyses are a useful way to select AGNs. Deep X-ray surveys can detect faint AGNs that have a similar luminosity level ( erg s-1) to normal galaxies. It is often challenging to select these AGNs with X-ray or multiwavelength methods (see §2.1) due to their similarity to normal galaxies. However, if they are found to have significant X-ray variability, then their AGN nature is revealed, because typical normal galaxies have relatively constant light curves. Deep-field studies have successfully used this method to identify low-luminosity AGNs, some of which are missed by other selection methods (e.g., Young et al. 2012; Ding et al. 2018). Future powerful observatories such as Athena and Lynx (see §4.1) will detect many more faint X-ray sources than we have today, and the variability selection method will be crucial for selecting low-luminosity AGNs among these sources.
3.3 AGN Ecology
From observations of local systems, SMBH masses are tightly correlated with some host-galaxy properties such as bulge masses and velocity dispersions (e.g., Kormendy & Ho 2013). These connections are surprising given that SMBH masses are often negligible ( a few thousandths) compared to the host-galaxy masses. Therefore, some physical connections between SMBH growth and host-galaxy properties likely exist, referred to here as “AGN ecology”. X-ray surveys and their accompanying multiwavelength data offer an excellent chance to study AGN-galaxy connections across cosmic history. We discuss the topic of AGN-galaxy connections in this section, mainly focusing on recent work not covered in Brandt & Alexander (2015).
Measurements of host-galaxy properties: Basic galaxy properties such as and SFR can be estimated by modeling the observed broad-band SEDs from the UV to IR. For optically selected quasars, the AGN component typically outshines the host-galaxy component at UV-to-NIR (near-IR) wavelengths, posing a significant challenge for SED decomposition. Fortunately, X-ray selected AGNs, especially those with low-to-moderate luminosities ( erg s-1) and/or significant nuclear absorption, often have UV-to-NIR SEDs dominated by starlight (see, e.g., Fig. 9 of Luo et al. 2010). Their and SFR measurements are almost as straightforward as those of normal galaxies. Even for luminous quasars, the X-ray fluxes can be used to constrain their AGN component in SED modeling and thereby reduce the uncertainties in the and SFR measurements (e.g., Yang et al. 2020; Mountrichas et al. 2021a).
Galaxy morphological measurements are challenging in general. Since broad-line (BL) AGNs could have a significant contribution to the optical imaging, their host-galaxy morphological measurements might be unreliable and/or heavily biased. Therefore, morphological studies often focus on non-BL AGN hosts (e.g., Yang et al. 2019b; Ni et al. 2021b). Even for non-BL AGNs’ host galaxies, morphological measurements are technically challenging for ground-based telescopes, as a seeing translates to an kpc physical scale at , comparable to the typical sizes of galaxies. For this reason, the morphological investigations of X-ray AGN hosts often rely on HST imaging.
The reddest band () from HST allows morphological measurements up to , above which the covered rest-frame wavelengths shift to the UV and the “morphological k-correction” becomes strong (e.g., Taylor-Mager et al. 2007). JWST will be able to probe to higher redshifts thanks to its high-resolution imaging ability at longer wavelengths (–m for NIRCam). There are various methods of making morphological measurements, e.g., Sérsic-profile fitting, concentration-asymmetry-clumpiness (CAS), and visual classifications (see Conselice 2014 for a review). Visual classifications from expert classifiers are often very time consuming. Fortunately, the advances of machine-learning techniques in recent years allow effective visual-like morphological classifications for large numbers of distant galaxies (e.g., Huertas-Company et al. 2015).
Host-galaxy stellar mass and star-formation rate: As we have discussed in §3.1, both SMBH growth and galaxy stellar growth have the anti-hierarchical behavior of downsizing. Also, the cosmic SMBH-accretion density and star-formation density222 The total SMBH accretion rate and star-formation rate per comoving volume, both in units of yr-1 Mpc-3. both peak at (see, e.g., Fig. 20 of Aird et al. 2015). These similarities suggest a connection between AGN activity and star formation (SF).
One major challenge in studying the AGN-SF connection is “AGN flickering”. From hydrodynamical simulations, AGNs are likely associated with strong short-term ( Myr) variability (e.g., Yuan et al. 2018). This temporal behavior acts as “noise” in the analyses of SMBH cosmic evolution, for which only long-term ( Myr) AGN strength is relevant. To overcome this variability issue, Chen et al. (2013) and Hickox et al. (2014) proposed to use sample-averaged SMBH accretion rate (BHAR, estimated from the combination of direct X-ray detection and stacking) to approximate long-term average BHAR. They found that sample-averaged BHAR is linearly correlated with galaxy SFR, and interpreted this result as a tight universal connection between SMBH and stellar growth over galaxy evolution timescales ( Myr). In this scenario, long-term BHAR can be simply inferred from host-galaxy SFR alone.
On the other hand, deep-field studies have also found that the fraction of AGN-hosting galaxies rises steeply as a function of stellar mass (e.g., Xue et al. 2010; Aird et al. 2012; Bongiorno et al. 2012). This mass dependence appears to challenge the AGN-SF connection above. This apparent paradox could result from the SF main sequence, i.e., SFR and are positively correlated among star-forming galaxies at a given redshift. For example, AGN activity might be primarily related to SFR, while the apparent dependence might be a bias due to the SFR- main sequence, or vice versa. To test this idea, Yang et al. (2017) performed partial-correlation analyses, which control SFR () and investigate the dependence on (SFR). Their result, somewhat surprisingly, indicates that sample-averaged BHAR is mainly correlated with , and the apparent BHAR-SFR connection is a secondary relation caused by the SF main sequence. Similar conclusions have also been reached by subsequent studies (e.g., Fornasini et al. 2018; Ni et al. 2019). Observational works have also investigated the effects of host-galaxy cosmic environments on BHAR when controlling for (e.g, Powell et al. 2018; Yang et al. 2018b; Allevato et al. 2019; Noordeh et al. 2020). The environmental dependence is generally weak, except for the most massive clusters.
Motivated by the importance of , studies have attempted to quantify the BHAR dependence on at different redshifts (e.g., Georgakakis et al. 2017; Aird et al. 2018; Yang et al. 2018a).333The BHAR vs. relation is sometimes called the “AGN main sequence”, in analogy with the well-known SF main sequence (e.g., Mullaney et al. 2012). Such works often have to collect large samples of AGNs, combining both deep and wide X-ray surveys to cover AGNs from low-to-high luminosities. Fig. 12 (left) shows the resulting BHAR- relation. At any fixed , BHAR rises toward high redshifts, likely reflecting the fact that AGN-accretion fuel (cold gas) is more abundant in the earlier universe. However, the redshift dependence is stronger in more massive galaxies, indicating that massive galaxies assemble their SMBH masses earlier in cosmic history, compared to low-mass galaxies. This phenomenon is broadly consistent with AGN downsizing (see §3.1), considering that more massive galaxies generally have more massive SMBHs.
We caution that AGN activity could still have some “residual” dependence on SFR, although is the main factor. Studies have also investigated the AGN dependence on host-galaxy positions with respect to the SF main sequence at a given (e.g., Aird et al. 2018, 2019; Masoura et al. 2018; Yang et al. 2018a; Bernhard et al. 2019; Florez et al. 2020; Mountrichas et al. 2021b). Fig. 12 (right) displays this dependence, where galaxies are divided into star-forming and quiescent populations. The resulting SF dependence is quite complicated, apparently affected by both redshift and . More detailed studies found evidence suggesting the AGN activity might not be a simple monotonic function of host-galaxy star formation. For example, AGN activity drops from the starburst to the main sequence (MS) populations, but it surprisingly appears to rise from the MS to the sub-MS populations (see, e.g., Fig. 11 of Aird et al. 2019). This complexity suggests there might be some “hidden parameters” beyond SFR and affecting SMBH growth. These parameters could be related to galaxy morphology as we will discuss below.
Host-galaxy morphology: In local systems, SMBH masses are closely related to host-galaxy morphology. For example, they are tightly correlated with bulge masses, but are almost completely unrelated to galactic-disk masses (see Kormendy & Ho 2013 for a review). Therefore, it is likely that AGN activity in the distant universe also depends on host-galaxy morphology.
It has been long known that optically and X-ray selected AGNs can be found in galaxies with a variety of morphological types, e.g., bulge-dominated, irregular, and disk-dominated, since the first studies on this topic (e.g., Bahcall et al. 1997; Grogin et al. 2005). However, early works did not reach a consensus on whether AGN activity is physically related to host-galaxy morphologies, especially after controlling for the effects of stellar mass and redshift as discussed above (e.g., Pierce et al. 2007; Kocevski et al. 2012). One major reason for the disagreement among these works are the technical challenges in morphological measurements (see above), which significantly limited the sample sizes ( X-ray AGNs).
The situation has been gradually improved with the advance of the HST CANDELS survey (Grogin et al. 2011; Koekemoer et al. 2011), which has provided deep imaging over five separate fields (total area arcmin2). Based on the CANDELS data, robust morphological measurements and classifications have been performed for galaxies up to (e.g., Huertas-Company et al. 2015). There are X-ray detections among these galaxies, thanks to the deep Chandra and XMM-Newton exposures for the CANDELS fields.
Taking advantage of these large AGN and galaxy samples, Yang et al. (2019b) revealed a tight correlation between sample-averaged BHAR and SFR for bulge-dominated systems, and this BHAR-SFR correlation is largely unaffected by (see Ni et al. 2019 for a similar conclusion). Fig. 13 (left) shows this correlation. The best-fit relation has , similar to the SMBH/bulge mass ratio observed in the local universe (e.g., Kormendy & Ho 2013). This similarity indicates that the BHAR-bulge SFR relation could be the origin of the SMBH-bulge mass relation in local systems. Yang et al. (2019b) also found that BHAR is not related to SFR for the non-bulge-dominated sample, highlighting the key role of morphology. The bulge-dominated systems only consist of of the massive () galaxy population. This explains why the strong BHAR-bulge SFR relation was missed by the previous works that did not have morphological information (e.g., Yang et al. 2017; Fornasini et al. 2018). The BHAR-bulge SFR relation might also hold for the bulge component in bulge-plus-disk systems. This can be tested if bulge SFR can be separated from disk SFR by future high-resolution mid/far-IR imaging by, e.g., JWST and Origins.
Besides morphological classifications, another common way to describe galaxy shapes utilizes continuous quantities. Among these morphological quantities, (the projected central surface-mass density within 1 kpc) has become increasingly popular among researchers, as observations have found is closely related to galaxy evolution (e.g., Barro et al. 2017). For AGN activity, studies have found AGN fraction is elevated among high- compact star-forming galaxies (e.g., Kocevski et al. 2017; Ni et al. 2019). This result is qualitatively consistent with the BHAR-bulge SFR relation (Yang et al. 2019b), because bulge-dominated galaxies are often compact. Ni et al. (2021b) further quantified the BHAR dependence on among star-forming galaxies, as displayed in Fig. 13 (right). BHAR increases monotonically toward high for all of the three redshift bins investigated. The conclusion suggests a link between AGN activity vs. host-galaxy gas content and/or gravitational potential well on the central kpc scale, which are closely related to the quantity .
Despite the recent significant progress on AGN links to host-galaxy properties (especially morphology), we still lack a comprehensive and quantitative description of how AGN activity depends on all the key properties including (but not limited to) , SFR, morphology, and redshift. Much larger AGN/galaxy samples are needed to achieve this goal. The future is bright for this fast-developing field, as many advanced multiwavelength survey telescopes will begin operation. In addition to future X-ray telescopes (see §4.1), Rubin will provide deep half-sky images for photometric redshifts, , and SFR measurements. JWST will open the window for high-redshift galaxies and Compton-thick AGNs (see §3.1). Roman and Xuntian will allow large-scale morphological measurements thanks to their efficient high-resolution imaging capability.
4 Some Future Prospects and Other Relevant Reviews
4.1 Some Future Prospects for CXRB Surveys
Many fundamental science questions remain that can be best answered with ongoing and new CXRB surveys, including the following:
-
1.
How do highly obscured SMBHs grow and provide feedback through the –4 galaxy formation era?
-
2.
How do SMBHs grow in the first galaxies at –10, and what are the “seeds” for these SMBHs?
-
3.
What host-galaxy properties link most strongly to SMBH growth, and what does this reveal about SMBH-galaxy co-evolution?
-
4.
How does large-scale cosmic environment, ranging from voids to superclusters, relate to SMBH growth?
-
5.
What galaxy physical properties drive the observed cosmic evolution of their X-ray binary populations, and how do these populations evolve at –10?
-
6.
What will a -object X-ray cluster/group sample reveal about the growth of the most massive cosmic structures, the cosmological model, and dark energy?
-
7.
How did the ICM form and SMBHs grow in protoclusters?
-
8.
What is the nature of faint X-ray transients in the distant universe?
The CXRB-surveys community is blessed to have multiple X-ray missions capable of addressing these questions still operating, including Chandra, XMM-Newton, INTEGRAL, Swift, NuSTAR, and SRG. These missions alone should ensure another great decade of CXRB survey discoveries, particularly if they undertake aggressive projects capable of exploring new “discovery space”. Moreover, the vast archives of X-ray observations from these missions (e.g., note the locations of the serendipitous surveys in Fig. 2) will be made immensely more valuable as the extraordinary new data from complementary imaging and spectroscopic surveys become available, such as those from Rubin, Xuntian, SDSS, AAT, DESI, 4MOST, MOONS, PFS, Extremely Large Telescopes, JWST, Euclid, Roman, ALMA, LMT TolTEC, the VLA, ASKAP, MeerKAT, and the SKA. These will allow thousands of archival sensitive pointed X-ray observations and the all-sky surveys to be systematically mined to address science questions comprehensively with titanic X-ray source samples (e.g., Brandt & Vito 2017).
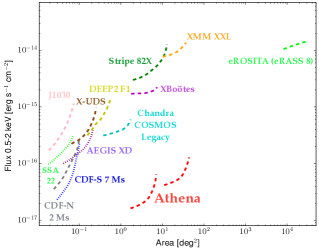
Einstein Probe, planned for launch in 2023, should greatly advance understanding of transient sources within the 0.5–4 keV CXRB. It will utilize Lobster-eye optics (covering deg2) to perform a systematic large-grasp survey of transients at an unprecedented combination of sensitivity and cadence (e.g., see Fig. 14 left). Discovered transients will be investigated with an on-board follow-up X-ray telescope.
Athena, selected for launch in , will be a potent mission for –10 keV CXRB surveys if it achieves its planned imaging point spread function; e.g., covering several deg2 to 0.5–2 keV fluxes of erg cm-2 s-1 (see Fig. 14 right) and providing sufficient photon statistics for quality source characterization. Athena surveys will hopefully provide a complete census of SMBH growth, including highly obscured systems, out to –10.
Lynx, a candidate large NASA mission, aims to observe the seeds of the first SMBHs directly as well as conduct much superb broader survey science. With Chandra-like angular resolution and a collecting area –50 times that of Chandra, Lynx could detect M⊙ black holes at (with 0.5–2 keV fluxes of erg cm-2 s-1; compare with Fig. 2 left). Seeding models (e.g., Population III remnants vs. direct-collapse black holes) would be discriminated using the observed X-ray luminosity function and host properties.
Additional impressive surveyors of the CXRB, including STAR-X, AXIS, and HEX-P, are under active scientific development and will hopefully soon obtain construction funding.
4.2 Other Relevant Reviews
Owing to page and reference limits, this overview has been highly concise. Other useful relevant reviews published over the past decade include Treister & Urry (2011), Brandt & Alexander (2015), Netzer (2015), Xue (2016), Padovani et al. (2017), Hickox & Alexander (2018), Allen & Mantz (2020), Siemiginowska & Civano (2020), and Krivonos et al. (2021).
5 Acknowledgments
We thank DM Alexander, CT Chen, L Klindt, BD Lehmer, B Luo, Q Ni, CJ Papovich, and F Vito for helpful discussions. WNB acknowledges support from the V.M. Willaman Endowment, NSF grant AST-2106990, NASA grant 80NSSC19K0961, and Penn State ACIS Instrument Team Contract SV4-74018 (issued by the Chandra X-ray Center, which is operated by the Smithsonian Astrophysical Observatory for and on behalf of NASA under contract NAS8-03060). The Chandra ACIS Team Guaranteed Time Observations (GTO) utilized were selected by the ACIS Instrument Principal Investigator, Gordon P. Garmire, currently of the Huntingdon Institute for X-ray Astronomy, LLC, which is under contract to the Smithsonian Astrophysical Observatory via Contract SV2-82024. GY acknowledges support from the NASA/ESA/CSA James Webb Space Telescope through the Space Telescope Science Institute, which is operated by the Association of Universities for Research in Astronomy, Incorporated, under NASA contract NAS5-03127. Support for program number JWST-ERS-01345 was provided through a grant from the STScI under NASA contract NAS5-03127. GY acknowledges support from the George P. and Cynthia Woods Mitchell Institute for Fundamental Physics and Astronomy at Texas A&M University.
References
- (1) Adami C, Giles P, Koulouridis E et al. (2018) The XXL Survey. XX. The 365 cluster catalogue. A&A 620:A5
- (2) Allen SW, Mantz AB (2020) Galaxy cluster cosmology. In: Wilkes BJ, Tucker W (eds) The Chandra X-ray Observatory: Exploring the high-energy universe. IOP Publishing, Bristol, Chapter 10
- (3) Allevato V, Viitanen A, Finoguenov A et al. (2019) Chandra COSMOS Legacy Survey: Clustering dependence of type 2 active galactic nuclei on host-galaxy properties. A&A 632:A88
- (4) Aird J, Coil AL, Georgakakis A et al. (2015) The evolution of the X-ray luminosity functions of unabsorbed and absorbed AGNs out to . MNRAS 451:1892-1927
- (5) Aird J, Coil AL, Georgakakis A (2018) X-rays across the galaxy population - II. The distribution of AGN accretion rates as a function of stellar mass and redshift. MNRAS 474:1225–1249
- (6) Aird J., Coil A. L., Georgakakis A. (2019) X-rays across the galaxy population - III. The incidence of AGN as a function of star formation rate. MNRAS 484:4360–4378
- (7) Alexander DM, Chary RR, Pope A et al. (2008) Reliable Identification of Compton-thick Quasars at z 2: Spitzer Mid-Infrared Spectroscopy of HDF-oMD49. ApJ 687:835–847
- (8) Alexander DM, Stern D, Del Moro A et al. (2013) The NuSTAR Extragalactic Survey: A First sensitive look at the high-energy cosmic X-ray background population. ApJ 773:125
- (9) Ananna TT, Treister E, Urry CM et al. (2019) The accretion history of AGNs. I. Supermassive black hole population synthesis model. ApJ 871:240
- (10) Ananna TT, Urry CM, Treister E et al. (2020) Accretion history of AGNs. III. Radiative efficiency and AGN contribution to reionization. ApJ 903:85
- (11) Antonucci R (1993) Unified models for active galactic nuclei and quasars. ARA&A 31:473–521
- (12) Bahcall JN, Kirhakos S, Saxe DH, et al. (1997) Hubble Space Telescope images of a sample of 20 nearby luminous quasars. ApJ 479:642–658
- (13) Barger AJ, Cowie LL, Capak P et al. (2003) Very high redshift X-ray-selected active galactic nuclei in the Chandra Deep Field-North. ApJL 584:L61–L64
- (14) Barro G, Faber SM, Koo DC, et al. (2017) Structural and star-forming relations since : Connecting compact star-forming and quiescent galaxies. ApJ 840:47
- (15) Bernhard E, Grimmett LP, Mullaney JR et al. (2019) Inferring a difference in the star-forming properties of lower versus higher X-ray luminosity AGNs. MNRAS 483:L52–L57
- (16) Blumenthal GR, Faber SM, Primack JR et al. (1984) Formation of galaxies and large-scale structure with cold dark matter. Nat 311:517-525
- (17) Böhringer H, Schuecker P, Guzzo L et al. (2004) The ROSAT-ESO Flux Limited X-ray (REFLEX) galaxy cluster survey. V. The cluster catalogue. A&A 425:367–383
- (18) Bongiorno A, Merloni A, Brusa M et al. (2012) Accreting supermassive black holes in the COSMOS field and the connection to their host galaxies. MNRAS 427:3103–3133
- (19) Brandt WN, Alexander DM (2015) Cosmic X-ray surveys of distant active galaxies. The demographics, physics, and ecology of growing supermassive black holes. A&A Rev 23:1
- (20) Brandt WN, Vito F (2017) High-redshift active galactic nuclei and the next decade of Chandra and XMM-Newton. Astr Nach 338:241–248
- (21) Brunner H, Liu T, Lamer G, et al. (2021) The eROSITA Final Equatorial Depth Survey (eFEDS): The X-ray catalog. A&A in press (arXiv:2106.14517)
- (22) Buchner J, Georgakakis A, Nandra K et al. (2015) Obscuration-dependent evolution of active galactic nuclei. ApJ 802:89
- (23) Burlon D, Ajello M, Greiner J et al. (2011) Three-year Swift-BAT survey of active galactic nuclei: Reconciling theory and observations? ApJ 728:58
- (24) Cao X (2009) An accretion disc-corona model for X-ray spectra of active galactic nuclei. MNRAS 394:207-213
- (25) Cappelluti N, Li Y, Ricarte A et al. (2017) The Chandra COSMOS Legacy Survey: Energy spectrum of the cosmic X-ray background and constraints on undetected populations. ApJ 837:19
- (26) Chen CJ, Hickox RC, Alberts S et al. (2013) A correlation between star formation rate and average black hole accretion in star-forming galaxies. ApJ 773:3
- (27) Civano F, Hickox RC, Puccetti S et al. (2015) The NuSTAR extragalactic surveys: Overview and catalog from the COSMOS field. ApJ 808:185
- (28) Comastri A, Fiore F, Vignali C et al. (2001) The BeppoSAX High Energy Large Area Survey (HELLAS). III. Testing synthesis models for the X-ray background. MNRAS 327:781–787
- (29) Conselice CJ (2014) The evolution of galaxy structure over cosmic time. ARA&A 52:291–337
- (30) Cowie LL, Songaila A, Hu EM et al. (1996) New insight on galaxy formation and evolution from Keck spectroscopy of the Hawaii Deep Fields. AJ 112:839
- (31) Cowie LL, Barger AJ, Bautz MW et al. (2003) The redshift evolution of the 2–8 keV X-ray luminosity function. ApJL 584:L57–L60
- (32) Croom SM, Richards GT, Shanks T, et al. (2009) The 2dF-SDSS LRG and QSO survey: The QSO luminosity function at . MNRAS 399:1755–1772
- (33) Ding N, Luo B, Brandt WN, et al. (2018) Variability-selected low-luminosity active galactic nuclei candidates in the 7 Ms Chandra Deep Field-South. ApJ 868:88
- (34) Donley JL, Koekemoer AM, Brusa M et al. (2012) Identifying luminous active galactic nuclei in deep surveys: Revised IRAC selection criteria. ApJ 748:142
- (35) Falocco S, Paolillo M, Comastri A et al. (2017) The XMM deep survey in the CDF-S. X. X-ray variability of bright sources. A&A 608:A32
- (36) Finoguenov A, Tanaka M, Cooper M et al. (2015) Ultra-deep catalog of X-ray groups in the Extended Chandra Deep Field-South. A&A 576:A130
- (37) Florez J, Jogee S, Sherman S et al. (2020) Exploring AGN and star formation activity of massive galaxies at cosmic noon. MNRAS 497:3273–3296
- (38) Fornasini FM, Civano F, Fabbiano G et al. (2018) Low-luminosity AGN and X-ray binary populations in COSMOS star-forming galaxies. ApJ 865:43
- (39) Fornasini FM, Civano F, Suh H (2020) Connecting the metallicity dependence and redshift evolution of high-mass X-ray binaries. MNRAS 495:771–783
- (40) Georgakakis A, Aird J, Schulze A et al. (2017) Observational constraints on the specific accretion-rate distribution of X-ray-selected AGNs. MNRAS 471:1976–2001
- (41) Giacconi R, Gursky H, Paolini FR, Rossi BB (1982) Evidence for X-rays from sources outside the Solar System. Phys Rev Lett 9:439–443
- (42) Giacconi R (1981) X-ray astronomy with the Einstein satellite. D. Reidel, Dordrecht
- (43) Gibson RR, Brandt WN, Schneider DP (2008) Are optically selected quasars universally X-ray luminous? X-ray-UV relations in Sloan Digital Sky Survey quasars. ApJ 685:773–786
- (44) Gilli R, Comastri A, Hasinger G (2007) The synthesis of the cosmic X-ray background in the Chandra and XMM-Newton era. A&A 463:79–96
- (45) Grogin NA, Conselice CJ, Chatzichristou E et al. (2005) AGN host galaxies at : Bulge-dominated and lacking merger-AGN connection. ApJL 627:L97–L100
- (46) Grogin NA, Kocevski DD, Faber SM et al. (2011) CANDELS: The Cosmic Assembly Near-infrared Deep Extragalactic Legacy Survey. ApJS 197:35
- (47) Habouzit M, Genel S, Somerville RS et al. (2019) Linking galaxy structural properties and star formation activity to black hole activity with IllustrisTNG. MNRAS 484:4413–4443
- (48) Harrison FA, Aird J, Civano F et al. (2016) The NuSTAR extragalactic surveys: The number counts of active galactic nuclei and the resolved fraction of the cosmic X-ray background. ApJ 831:185
- (49) Hartwick FDA, Schade D (1990) The space distribution of quasars. ARA&A 28:437–489
- (50) Hasinger G, Burg R, Giacconi R, Trumper J, Zamorani G (1998) The ROSAT Deep Survey. I. X-ray sources in the Lockman Field. A&A 329:482–494
- (51) Hickox RC, Mullaney JR, Alexander DM et al. (2014) Black hole variability and the star formation-active galactic nucleus connection: Do all star-forming galaxies host an active galactic nucleus? ApJ 782:9
- (52) Hickox RC, Alexander DM (2018) Obscured active galactic nuclei. Ann Rev Astron Astrophy 56:625–671
- (53) Huertas-Company M, Gravet R, Cabrera-Vives G et al. (2015) A catalog of visual-like morphologies in the 5 CANDELS fields using deep learning. ApJS 221:8
- (54) Jin C, Ward M, Done C (2012) A combined optical and X-ray study of unobscured type 1 active galactic nuclei - III. Broad-band SED properties. MNRAS 425:907–929
- (55) Juneau S, Glazebrook K, Crampton D et al. (2005) Cosmic star formation history and its dependence on galaxy stellar mass. ApJL 619:L135–L138
- (56) Just DW, Brandt WN, Shemmer O et al. (2007) The X-ray properties of the most luminous quasars from the Sloan Digital Sky Survey. ApJ 665:1004–1022
- (57) Kocevski DD, Faber SM, Mozena M et al. (2012) CANDELS: Constraining the AGN-merger connection with host morphologies at . ApJ 744:148
- (58) Kocevski DD, Barro G, Faber SM et al. (2017) CANDELS: Elevated black hole growth in the progenitors of compact quiescent galaxies at . ApJ 846:112
- (59) Koekemoer AM, Faber SM, Ferguson HC et al. (2011) CANDELS: The Cosmic Assembly Near-infrared Deep Extragalactic Legacy Survey—The Hubble Space Telescope observations, imaging data products, and mosaics. ApJS 197:36
- (60) Komossa S (2015) Tidal disruption of stars by supermassive black holes: Status of observations. J. High-Energy Ast 7:148–157
- (61) Kormendy J, Ho LC (2013) Coevolution (Or not) of supermassive black holes and host galaxies. ARA&A 51:511–653
- (62) Koss M, Trakhtenbrot B, Ricci C et al. (2017) BAT AGN Spectroscopic Survey. I. Spectral measurements, derived quantities, and AGN demographics. ApJ 850:74
- (63) Krivonos RA, Bird AJ, Churazov EM et al. (2021) 15 years of Galactic surveys and hard X-ray background measurements. New Ast Rev 92:101612
- (64) Kubota A, Done C (2018) A physical model of the broad-band continuum of AGN and its implications for the UV/X relation and optical variability. MNRAS 480:1247–1262
- (65) Lacy M, Storrie-Lombardi LJ, Sajina A et al. (2004) Obscured and unobscured active galactic nuclei in the Spitzer Space Telescope first look survey. ApJS 154:166–169
- (66) Lansbury GB, Stern D, Aird J et al. (2017) The NuSTAR Serendipitous Survey: The 40-month catalog and the properties of the distant high-energy X-ray source population. ApJ 836:99
- (67) Lanzuisi G, Ponti G, Salvato M et al. (2014) Active galactic nucleus X-ray variability in the XMM-COSMOS survey. ApJ 781:105
- (68) Lanzuisi G, Delvecchio I, Berta S et al. (2017) Active galactic nuclei vs. host-galaxy properties in the COSMOS field. A&A 602:A123
- (69) Lanzuisi G, Civano F, Marchesi S et al. (2018) The Chandra COSMOS Legacy Survey: Compton-thick AGN at high redshift. MNRAS 480:2578–2592
- (70) Lawrence A (1991) The relative frequency of broad-lined and narrow-lined active galactic nuclei: Implications for unified schemes. MNRAS 252:586
- (71) Lehmer BD, Basu-Zych AR, Mineo S et al. (2016) The evolution of normal galaxy X-ray emission through cosmic history: Constraints from the 6 Ms Chandra Deep Field-South. ApJ 825:7
- (72) Leighly KM, Halpern JP, Jenkins EB et al. (2007) The intrinsically X-ray weak quasar PHL 1811. I. X-ray observations and spectral energy distribution. ApJ 663:103–117
- (73) Li J, Xue Y, Sun M et al. (2019) Piercing through highly obscured and Compton-thick AGNs in the Chandra Deep Fields. I. X-ray spectral and long-term variability analyses. ApJ 877:5
- (74) Liu T, Tozzi P, Wang J et al. (2017) X-ray spectral analyses of AGNs from the 7 Ms Chandra Deep Field-South survey: The distribution, variability, and evolutions of AGN obscuration. ApJS 232:8
- (75) Liu A, Bulbul E, Ghirardini V et al. (2021a) The eROSITA Final Equatorial-Depth Survey (eFEDS): Catalog of galaxy clusters and groups. A&A in press (arXiv:2106.14518)
- (76) Liu H, Luo B, Brandt WN et al. (2021b) On the observational difference between the accretion disk-corona connections among super- and sub-Eddington accreting active galactic nuclei. ApJ 910:103
- (77) Luo B, Brandt WN, Steffen AT et al. (2008) Deep-survey constraints on X-ray outbursts from galactic nuclei. ApJ 674:122–132
- (78) Luo B, Brandt WN, Xue YQ et al. (2010) Identifications and photometric redshifts of the 2 Ms Chandra Deep Field-South sources. ApJS 187:560–580
- (79) Luo B, Brandt WN, Alexander DM et al. (2014) Weak hard X-ray emission from broad absorption line quasars: Evidence for intrinsic X-ray weakness. ApJ 794:70
- (80) Luo B, Brandt WN, Xue YQ et al. (2017) The Chandra Deep Field-South survey: 7 Ms source catalogs. ApJS 228:2
- (81) Lusso E, Comastri A, Vignali C et al. (2010) The X-ray to optical-UV luminosity ratio of X-ray selected type 1 AGN in XMM-COSMOS. A&A 512:A34
- (82) Lusso E, Risaliti G (2016) The tight relation between X-ray and ultraviolet luminosity of quasars. ApJ 819:154
- (83) Lusso E, Risaliti G (2017) Quasars as standard candles. I. The physical relation between disc and coronal emission. A&A 602:A79
- (84) Marchesi S, Civano F, Elvis M et al. (2016) The Chandra COSMOS-Legacy survey: Optical/IR identifications. ApJ 817:34
- (85) Marchesi S, Gilli R, Lanzuisi G et al. (2020) Mock catalogs for the extragalactic X-ray sky: Simulating AGN surveys with Athena and with the AXIS probe. A&A 642:A184
- (86) Marshall FE, Boldt EA, Holt SS et al. (1980) The diffuse X-ray background spectrum from 3 to 50 keV. ApJ 235:4–10
- (87) Masoura VA, Mountrichas G, Georgantopoulos I et al. (2018) Disentangling the AGN and star formation connection using XMM-Newton. A&A 618:A31
- (88) Mather JC, Cheng ES, Eplee RE et al. (1990) A preliminary measurement of the cosmic microwave background spectrum by the Cosmic Background Explorer (COBE) satellite. ApJ 354:L37–L40
- (89) Mereminskiy IA, Krivonos RA, Lutovinov AA et al. (2016) INTEGRAL/IBIS deep extragalactic survey: M81, LMC and 3C 273/Coma fields. MNRAS 459:140–150
- (90) Merloni A, Bongiorno A, Brusa M et al. (2014) The incidence of obscuration in active galactic nuclei. MNRAS 437:3550–3567
- (91) Milosavljević M, Merritt D, Ho LC (2006) Contribution of stellar tidal disruptions to the X-ray luminosity function of active galaxies. ApJ 652:120–125
- (92) Miyaji T, Hasinger G, Salvato M et al. (2015) Detailed shape and evolutionary behavior of the X-ray luminosity function of active galactic nuclei. ApJ 804:104
- (93) Miyaji T, Hasinger G, Schmidt M (2000) Soft X-ray AGN luminosity function from ROSAT surveys. I. Cosmological evolution and contribution to the soft X-ray background. A&A 353:25–40
- (94) Mountrichas G, Buat V, Yang G et al. (2021a) X-ray flux in SED modelling: An application of X-CIGALE in the XMM-XXL field. A&A 646:A29
- (95) Mountrichas G, Buat V, Yang G et al. (2021b) The role of AGN and obscuration in the position of the host galaxy relative to the main sequence. A&A 653:A74
- (96) Mountrichas G, Buat V, Georgantopoulos I et al. (2021c) Galaxy properties of type 1 and 2 X-ray selected AGN and a comparison among different classification criteria. A&A 653:A70
- (97) Mullaney JR, Daddi E, Béthermin M et al. (2012) The hidden “AGN main sequence”: Evidence for a universal black-hole accretion to star formation rate ratio since producing an - relation. ApJL 753:L30
- (98) Netzer H (2015) Revisiting the unified model of active galactic nuclei. ARA&A 53:365–408
- (99) Ni Q, Yang G, Brandt WN et al. (2019) Does black-hole growth depend fundamentally on host-galaxy compactness? MNRAS 490:1135–1155
- (100) Ni Q, Brandt WN, Chen CT et al. (2021a) The XMM-SERVS Survey: XMM-Newton point-source catalogs for the W-CDF-S and ELAIS-S1 fields. ApJS 256:21
- (101) Ni Q, Brandt WN, Yang G et al. (2021b) Revealing the relation between black-hole growth and host-galaxy compactness among star-forming galaxies. MNRAS 500:4989–5008
- (102) Noordeh E, Canning REA, King A et al. (2020) The environmental dependence of X-ray AGN activity at . MNRAS 498:4095–4108
- (103) Oh K, Koss M, Markwardt CB et al. (2018) The 105-month Swift BAT all-sky hard X-ray survey. ApJS 235:4
- (104) Padovani P, Alexander DM, Assef RJ et al. (2017) Active galactic nuclei: what’s in a name? A&A Rev 25:2
- (105) Palanque-Delabrouille N, Magneville C, Yèche C et al. (2013) Luminosity function from dedicated SDSS-III and MMT data of quasars in selected with a new approach. A&A 551:A29
- (106) Paolillo M, Papadakis I, Brandt WN et al. (2017) Tracing the accretion history of supermassive black holes through X-ray variability: Results from the Chandra Deep Field-South. MNRAS 471:4398–4411
- (107) Parsa S, Dunlop JS, McLure RJ (2018) No evidence for a significant AGN contribution to cosmic hydrogen reionization. MNRAS 474:2904–2923
- (108) Pavlinsky M, Sazonov S, Burenin R et al. (2021) Spektrum-Roentgen-Gamma ART-XC all-sky X-ray survey: Catalog of sources detected during the first year. A&A in press (arXiv:2107.05879)
- (109) Pierce CM, Lotz JM, Laird ES et al. (2007) AEGIS: Host-galaxy morphologies of X-ray-selected and infrared-selected active galactic nuclei at . ApJL 660:L19–L22
- (110) Pouliasis E, Mountrichas G, Georgantopoulos I et al. (2020) An obscured AGN population hidden in the VIPERS galaxies: Identification through spectral energy distribution decomposition. 495:1853–1873
- (111) Powell MC, Cappelluti N, Urry CM et al. (2018) The Swift/BAT AGN Spectroscopic Survey. IX. The clustering environments of an unbiased sample of local AGNs. ApJ 858:110
- (112) Predehl P, Andritschke R, Arefiev V et al. (2021) The eROSITA X-ray telescope on Spektrum-Roentgen-Gamma. A&A 647:A1
- (113) Pu X, Luo B, Brandt WN et al. (2020) On the fraction of X-ray-weak quasars from the Sloan Digital Sky Survey. ApJ 900:141
- (114) Ricci C, Trakhtenbrot B, Koss MJ et al. (2017) The close environments of accreting massive black holes are shaped by radiative feedback. Nat 549:488–491
- (115) Rigby EE, Best PN, Brookes MH et al. (2011) The luminosity-dependent high-redshift turnover in the steep spectrum radio luminosity function: Clear evidence for downsizing in the radio-AGN population. MNRAS 416:1900–1915
- (116) Rosas-Guevara Y, Bower RG, Schaye J et al. (2016) Supermassive black holes in the EAGLE universe. Revealing the observables of their growth. MNRAS 462:190–205
- (117) Salvato M, Ilbert O, Hoyle B (2019) The many flavours of photometric redshifts. Nat Ast 3:212-222
- (118) Salvato M, Buchner J, Budavári T (2018) Finding counterparts for all-sky X-ray surveys with NWAY: A Bayesian algorithm for cross-matching multiple catalogues. MNRAS 473:4937–4955
- (119) Satyapal S, Kamal L, Cann JM et al. (2021) The diagnostic potential of JWST in characterizing elusive AGNs. ApJ 906:35
- (120) Scannapieco E, Silk J, Bouwens R (2005) AGN feedback causes downsizing. ApJL 635:L13–L16
- (121) Schmidt M, Hasinger G, Gunn J et al. (1998) The ROSAT deep survey. II. Optical identification, photometry, and spectra of X-ray sources in the Lockman field. A&A 329:495–503
- (122) Schwartz D (1980) Irregularities in the X-ray background. Phys Scripta 21:644–649
- (123) Setti G, Woltjer L (1989) Active galactic nuclei and the spectrum of the X-ray background. A&A 224:L21–L23
- (124) Shemmer O, Brandt WN, Netzer H et al. (2008) The hard X-ray spectrum as a probe for black-hole growth in radio-quiet active galactic nuclei. ApJ 682:81–93
- (125) Siemiginowska A, Civano F (2020) Supermassive black holes (active galactic nuclei). In: Wilkes BJ, Tucker W (eds) The Chandra X-ray Observatory: Exploring the high-energy universe. IOP Publishing, Bristol, Chapter 8
- (126) Sijacki D, Vogelsberger M, Genel S et al. (2015) The Illustris simulation: The evolving population of black holes across cosmic time. MNRAS 452:575–596
- (127) Silverman JD, Green PJ, Barkhouse WA et al. (2008) The luminosity function of X-ray-selected active galactic nuclei: Evolution of supermassive black holes at high redshift. ApJ 679:118–139
- (128) Steffen AT, Strateva I, Brandt WN et al. (2006) The X-ray-to-optical properties of optically selected active galaxies over wide luminosity and redshift ranges. AJ 131:2826–2842
- (129) Steidel CC, Hunt MP, Shapley AE et al. (2002) The population of faint optically selected active galactic nuclei at . ApJ 576:653–659
- (130) Sutherland W, Saunders W (1992) On the likelihood ratio for source identification. MNRAS 259:413–420
- (131) Taylor-Mager VA, Conselice CJ, Windhorst RA et al. (2007) Dependence of galaxy structure on rest-frame wavelength and galaxy type. ApJ 659:162–187
- (132) Thomas D, Maraston C, Bender R et al. (2005) The epochs of early-type galaxy formation as a function of environment. ApJ 621:673–694
- (133) Toba Y, Liu T, Urrutia T et al. (2021) The eROSITA Final Equatorial-Depth Survey (eFEDS): A multiwavelength view of WISE mid-infrared galaxies/active galactic nuclei. A&A in press (arXiv:2106.14527)
- (134) Treister E, Urry CM (2012) The cosmic history of black hole growth from deep multiwavelength surveys. Adv Astron 2012:516193
- (135) Ueda Y, Takahashi T, Inoue H et al. (1998) A population of faint galaxies that contribute to the cosmic X-ray background. Nat 391:866–868
- (136) Ueda Y, Akiyama M, Hasinger G. et al. (2014) Toward the standard population synthesis model of the X-ray background: Evolution of X-ray luminosity and absorption functions of active galactic nuclei including Compton-thick populations. ApJ 786:104
- (137) Vito F, Gilli R, Vignali C et al. (2014) The hard X-ray luminosity function of high-redshift () active galactic nuclei. MNRAS 445:3557–3574
- (138) Vito F, Gilli R, Vignali C et al. (2016) The deepest X-ray view of high-redshift galaxies: Constraints on low-rate black-hole accretion. MNRAS 463:348–374
- (139) Vito F, Brandt WN, Yang G et al. (2018) High-redshift AGN in the Chandra Deep Fields: The obscured fraction and space density of the sub- population. MNRAS 473:2378–2406
- (140) Vito F, Brandt WN, Bauer FE et al. (2019) The X-ray properties of quasars: No evident evolution of accretion physics in the first Gyr of the Universe. A&A 630:A118
- (141) Volonteri M, Dubois Y, Pichon C et al. (2016) The cosmic evolution of massive black holes in the Horizon-AGN simulation. MNRAS 460:2979–2996
- (142) Wang F, Fan X, Yang J et al. (2021) Revealing the accretion physics of supermassive black holes at redshift with Chandra and infrared observations. ApJ 908:53
- (143) White SDM, Rees MJ (1978) Core condensation in heavy halos: A two-stage theory for galaxy formation and clustering. MNRAS 183:341–358
- (144) Wolf J, Nandra K, Salvato M et al. (2021) First constraints on the AGN X-ray luminosity function at from an eROSITA-detected quasar. A&A 647:A5
- (145) Xue YQ, Brandt WN, Luo B et al. (2010) Color-magnitude relations of active and non-active galaxies in the Chandra Deep Fields: High-redshift constraints and stellar-mass selection effects. ApJ 720:368–391
- (146) Xue YQ (2017) The Chandra Deep Fields: Lifting the veil on distant active galactic nuclei and X-ray emitting galaxies. New Ast Rev 79:59–84
- (147) Xue YQ, Zheng XC, Li Y et al. (2019) A magnetar-powered X-ray transient as the aftermath of a binary neutron-star merger. Nat 568:198–201
- (148) Yang G, Brandt WN, Luo B et al. (2016) Long-term X-ray variability of typical active galactic nuclei in the distant universe. ApJ 831:145
- (149) Yang G, Chen CJ, Vito F et al. (2017) Black-hole growth is mainly linked to host-galaxy stellar mass rather than star formation rate. ApJ 842:72
- (150) Yang G, Brandt WN, Vito F et al. (2018a) Linking black-hole growth with host galaxies: The accretion-stellar mass relation and its cosmic evolution. MNRAS 475:1887–1911
- (151) Yang G, Brandt WN, Darvish B et al. (2018b) Does black-hole growth depend on the cosmic environment? MNRAS 480:1022–1042
- (152) Yang G, Brandt WN, Zhu S et al. (2019a) Searching for fast extragalactic X-ray transients in Chandra surveys. MNRAS 487:4721–4736
- (153) Yang G, Brandt WN, Alexander DM et al. (2019b) Evident black hole-bulge coevolution in the distant universe. MNRAS 485:3721–3737
- (154) Yang G, Boquien M, Buat V et al. (2020) X-CIGALE: Fitting AGN/galaxy SEDs from X-ray to infrared. MNRAS 491:740–757
- (155) Yang G, Papovich C, Bagley MB et al. (2021a) JWST/MIRI simulated imaging: Insights into obscured star formation and AGNs for distant galaxies in deep surveys. ApJ 908:144
- (156) Yang G, Estrada-Carpenter V, Papovich C et al. (2021b) Do current X-ray observations capture most of the black-hole accretion at high redshifts? ApJ in press (arXiv:2109.00078)
- (157) Young M, Brandt WN, Xue YQ et al. (2012) Variability-selected low-luminosity active galactic nuclei in the 4 Ms Chandra Deep Field-South. ApJ 748:124
- (158) Yuan F, Yoon D, Li YP et al. (2018) Active galactic nucleus feedback in an elliptical galaxy with the most updated AGN physics. I. Low angular momentum case. ApJ 857:121
- (159) Zhao D, Zhang C, Yuan W et al. (2014) Ray tracing simulations for the Wide-field X-ray Telescope of the Einstein Probe mission based on Geant4 and XRTG4. Proc SPIE 9144:91444E
- (160) Zheng XC, Xue YQ, Brandt WN et al. (2017) Deepest view of AGN X-ray variability with the 7 Ms Chandra Deep Field-South survey. ApJ 849:127
- (161) Zou F, Yang G, Brandt WN et al. (2019) The host-galaxy properties of type 1 versus type 2 active galactic nuclei. ApJ 878:11