PyTorch Connectomics: A Scalable and Flexible Segmentation
Framework for EM Connectomics
Abstract
We present PyTorch Connectomics (PyTC), an open-source deep-learning framework for the semantic and instance segmentation of volumetric microscopy images, built upon PyTorch. We demonstrate the effectiveness of PyTC in the field of connectomics, which aims to segment and reconstruct neurons, synapses, and other organelles like mitochondria at nanometer resolution for understanding neuronal communication, metabolism, and development in animal brains. PyTC is a scalable and flexible toolbox that tackles datasets at different scales and supports multi-task and semi-supervised learning to better exploit expensive expert annotations and the vast amount of unlabeled data during training. Those functionalities can be easily realized in PyTC by changing the configuration options without coding and adapted to other 2D and 3D segmentation tasks for different tissues and imaging modalities. Quantitatively, our framework achieves the best performance in the CREMI challenge for synaptic cleft segmentation (outperforms existing best result by relatively 6.1) and competitive performance on mitochondria and neuronal nuclei segmentation. Code and tutorials are publicly available at https://connectomics.readthedocs.io.
1 Introduction
The brain is one of the most complicated and mysterious tissues, controlling the motion, perception, and emotion of animals (including us humans). However, the detailed brain structure of most animals remains largely unknown to date due to its sheer complexity. Our research focuses on connectomics, which aims to solve the comprehensive connectivity graphs in the animal brains to shed light on the underlying mechanism of intelligence and inspire better treatment for neurological diseases. Recently, with the development of modern electron microscopy (EM) techniques, neuroscientists have been collecting petabytes of volumetric images at nanometer resolution, enabling the analysis of detailed neuronal connectivities and subcellular structures like synapses and mitochondria [22, 56, 40].
Segmenting cellular and subcellular structures from microscopy images is usually the first step before structural [45] and functional [40] analysis. In terms of computing, the segmentation tasks can be generally categorized into two classes, including semantic segmentation that assigns each pixel a class label and instance segmentation that additionally assigns each pixel an object index besides the class label. Nowadays, deep learning has become the de facto methodology for both semantic segmentation [8] and instance segmentation [17, 38], which has achieved state-of-the-art performance on most natural-scene and biomedical image datasets without using hand-designed features.
However, there are several challenges when applying those automatic approaches to the segmentation of large-scale connectomics datasets. First, existing open-source segmentation packages are usually designed for standard benchmark datasets, which means adapting those tools to new data with different scales and formats requires considerable time in changing hardware conditions and data pre-processing. Second, implementing specialized network architectures or different learning targets for new tasks is usually cumbersome in prevailing frameworks. Another layer of challenge is that most packages, although having good performance on segmentation tasks, lack detailed tutorials and documentation, which adds more learning burden for researchers without much experience in programming.
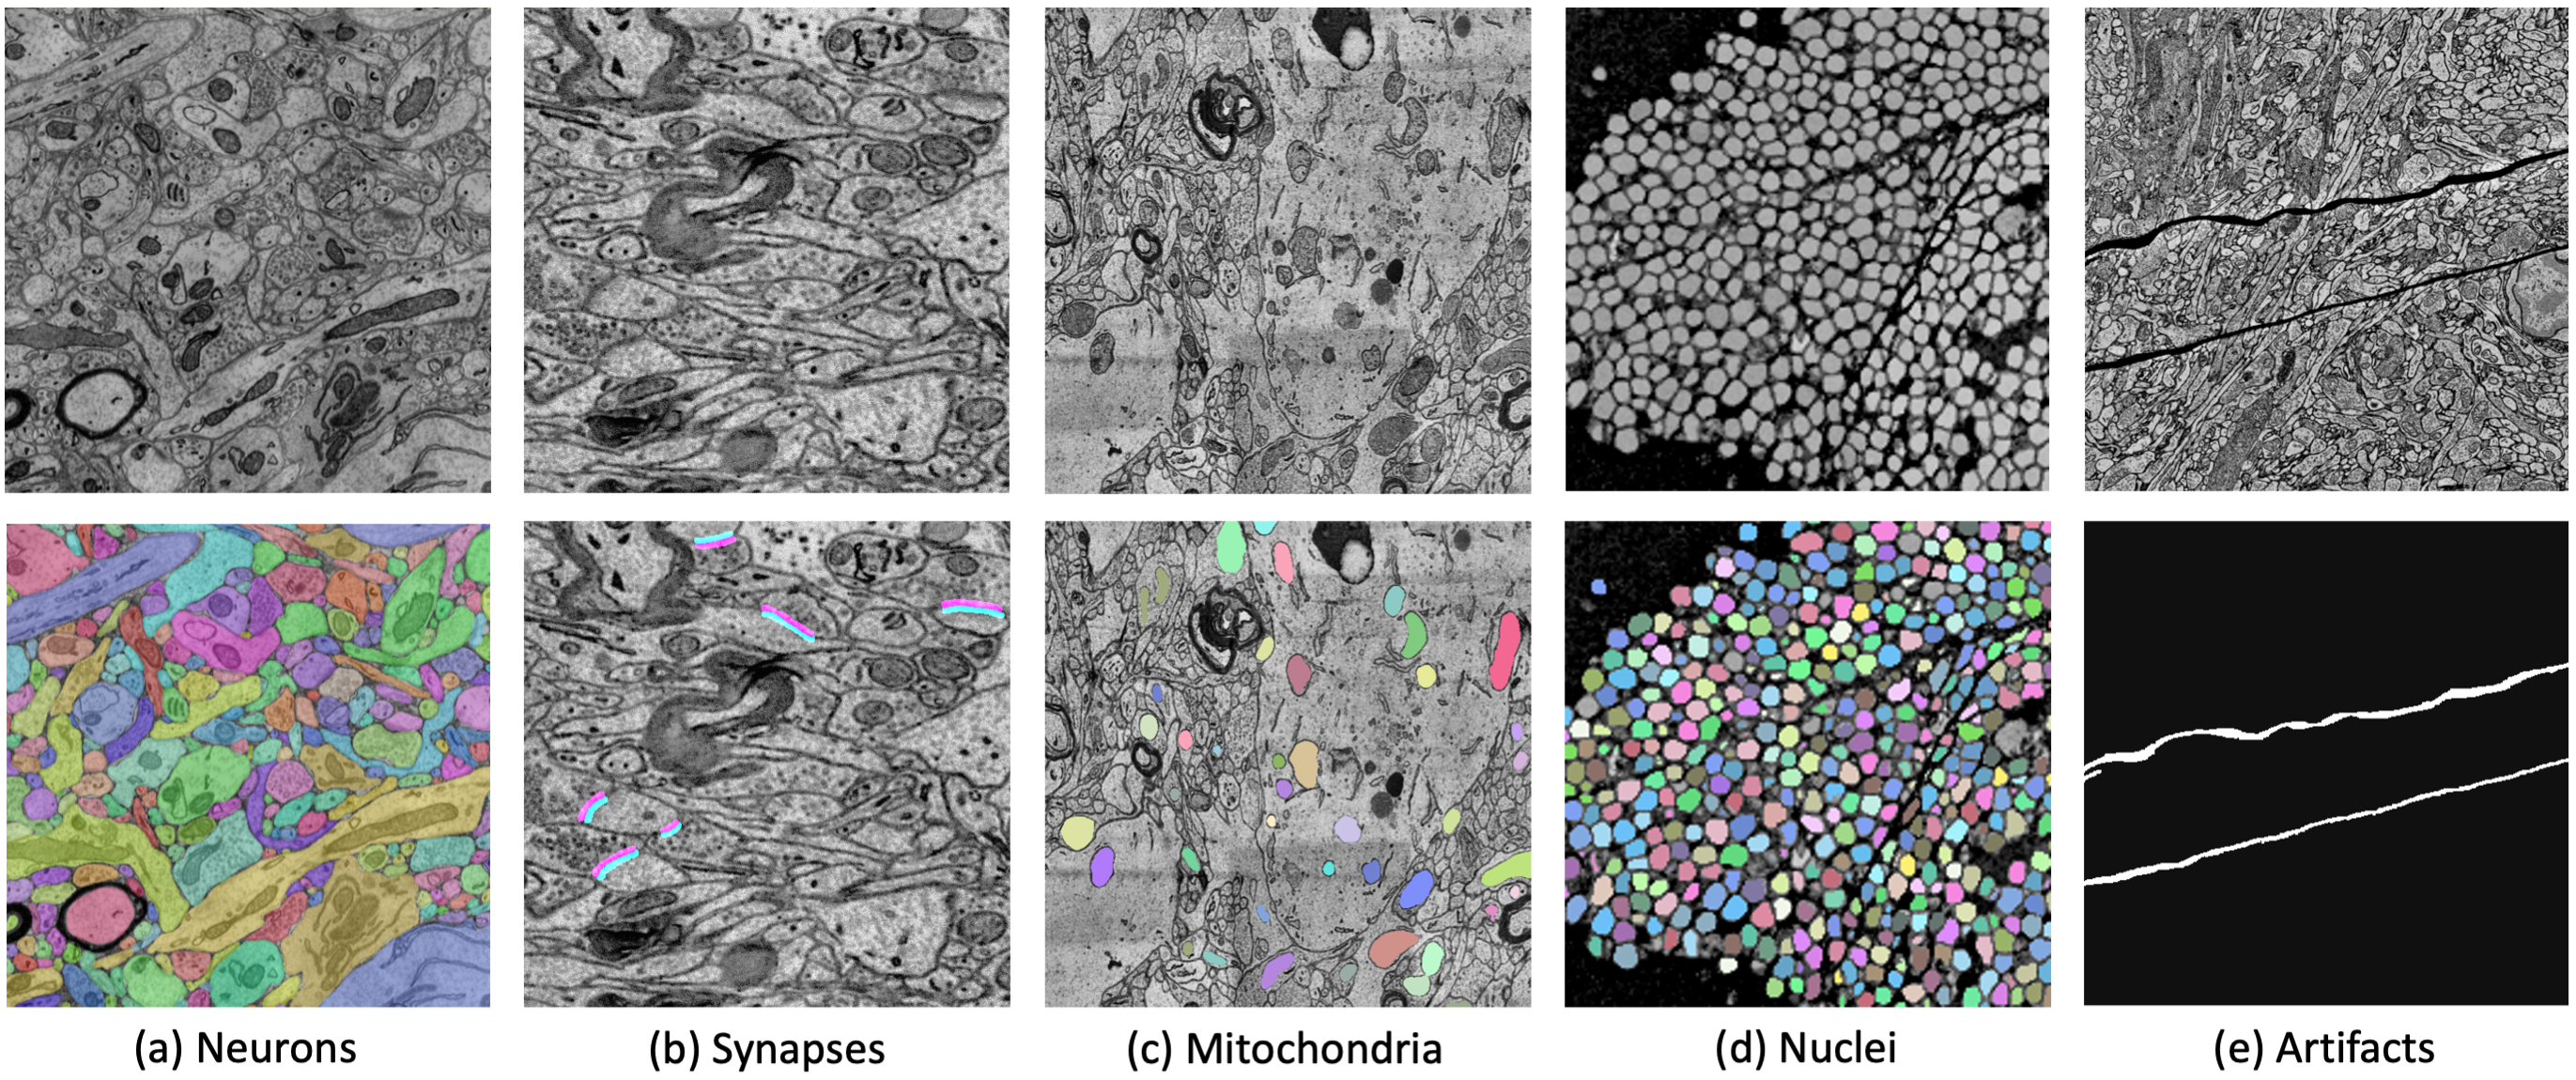
To tackle the challenges, we present PyTorch Connectomics (PyTC), an open-source deep-learning framework for the semantic and instance segmentation of volumetric microscopy images. PyTC is built upon the state-of-the-art deep learning library PyTorch [37] and inherits its advantages in flexibility and simplicity for neural network implementation. Our framework is not designed for specific imaging modality, data scale, or model architecture but versatile for different kinds of datasets and segmentation tasks, which distinguish us from previous works like flood-filling networks (FFN) [21] for neuron segmentation, StarDist [52] for nuclei segmentation, and CleftNet [27] that only focuses on synapses. Similar to nnU-Net [20], we identify a set of components like data loaders, image augmentations, and optimizers that require little adaptation among different datasets and tasks. However, nnU-Net only handles semantic segmentation, while our framework can tackle both semantic and instance segmentation. Furthermore, our framework is much more customizable than nnU-Net to tackle unique challenges in different datasets and tasks, which helps us achieve significantly better performance (\eg, synaptic cleft segmentation). Several supported tasks of PyTC are demonstrated in Figure 1.
Specifically, we design PyTC by identifying the primary needs of connectomics researchers in different components of segmentation. For data loading, we handle large datasets by automatically splitting them into manageable chunks, which is compatible with parallel and distributed processing and can easily be adapted to different hardware conditions. For modeling, researchers can customize 2D, 3D, or mixed architectures (for anisotropic images) and change the number of layers and kernels based on data complexity. The model can also learn multiple targets with multiple losses for each target, facilitating hybrid-representation learning to fully utilize annotations. Besides, users can easily configure data-loading, model-building, optimization, and visualization by just changing a configuration file without coding. The design also ensures the reproducibility of experiments and is friendly for the development and maintenance of the package. Finally, we provide a detailed description of the design and usage of PyTC in our documentation and tutorials to accelerate the learning curve.
To summarize, we present the PyTorch Connectomics framework for handling challenges in volumetric microscopy image segmentation by achieving scalability and flexibility in data processing, modeling, and learning. We have been actively improving the framework with feedback from biomedical researchers and help from open-source contributors. We are incorporating recent machine learning techniques like semi-supervised and self-supervised learning to effectively utilize vast unlabelled data, which can better assist experts in connectomics research.
2 Related Work
We here review popular image and volume segmentation packages for general microscopy and EM Connectomics.
Segmentation Packages for General Microscopy. On the one hand, many segmentation packages are based on traditional computer vision and machine learning methods as surveyed in [34, 28]. These packages have accelerated quantitative and statistical analyses for bacteria cells [44, 36, 48], mammalian cells [5, 42, 3], and general-purpose objects [39, 1]. Recently, some of these packages began to support deep learning methods [13, 33]. On the other hand, new packages strive to make state-of-the-art deep learning methods, \eg U-Net [38], accessible to non-expert users in biology [14, 49, 53]. Moreover, StarDist [52] and Cellpose [43] built user-friendly packages upon their proposed novel cell segmentation representations for better performance. nnU-Net [20] aims to learn to configure the best U-Net-like model for the given segmentation task. However, these segmentation packages, designed for general microscopy, do not work well for nanometer-scale electron microscopy images where the 3D cell structures are more complex and crowded. Our PyTC package focuses on the segmentation tasks for EM Connectomics.
Segmentation Packages for EM Connectomcis. Most EM Connectomics segmentation packages are programmer-centric, only providing research code for their own proposed methods [4, 21, 23, 41]. Without enough documentation or tutorials, it is often challenging even for computer scientists to apply the package to new image data. In contrast, UNI-EM [47] is scientist-centric, building an integrated system with a graphic interface for both backend deep learning and frontend visualization and manual proofreading. However, due to the desktop application setup, it is hard to scale UNI-EM to process large-scale data, \eg petabyte-scale [40, 2]. Our PyTC package separates the role of programmers and scientists. For development, PyTC provides design patterns that are scalable and flexible for programmers to build upon. For deployment, PyTC has detailed documentation and step-by-step tutorials for scientists with basic programming experience to use.
3 Overview
We give an overview of the framework in this section. Our main goal is to design a modular architecture so that researchers can easily adapt the framework to their data and tasks, and developers can efficiently improve part of the framework (\eg, adding a recent segmentation architecture) without modifying other components for data handling and optimization. Our PyTorch Connectomics (PyTC) package consists of four main modules. The data module is for reading and pre-processing data at different scales. This module can stream data as tractable volumes for a huge dataset so that the scalability is not restricted by memory. The model module is to construct 2D and 3D encoder-decoder models with flexibility in customizing the architecture, activations, learning targets, and loss functions. The engine module supports distributed or non-distributed multi-GPU training and with different combinations of optimizers and learning rate scheduling rules (with optional mixed-precision training), as well as multi-GPU inference.
In addition to the three modules, the configuration module, which is based on YACS111https://github.com/rbgirshick/yacs, define the configurable system and model hyperparameters like number of GPUs, depth of a segmentation model, and output path. This configuration system ensures reproducibility and version control as it serializes experimental options into YAML files instead of specifying them in the command line. When working on a new dataset, a researcher can quickly update data paths, model architecture, and optimization protocol with the YAML file without touching any source code. More details of those modules are presented in the next section.
4 System Design
The design goals of PyTorch Connectomics are scalability and flexibility. We focus on data scalability that can handle datasets of different scales, model flexibility for learning multiple targets simultaneously with various loss functions. The system is supported by GPU and CPU parallelism.
4.1 Data Scalability
Data Loading. The growth of connectomics dataset to petabyte scale [40] with various tasks including but not limited to the examples in Figure 1 brings significant challenges in interface standardization. We aim to design a data loading workflow where most components are shared regardless of the data size and computing tasks, so researchers can quickly adapt the system to their data without coding different interfaces.
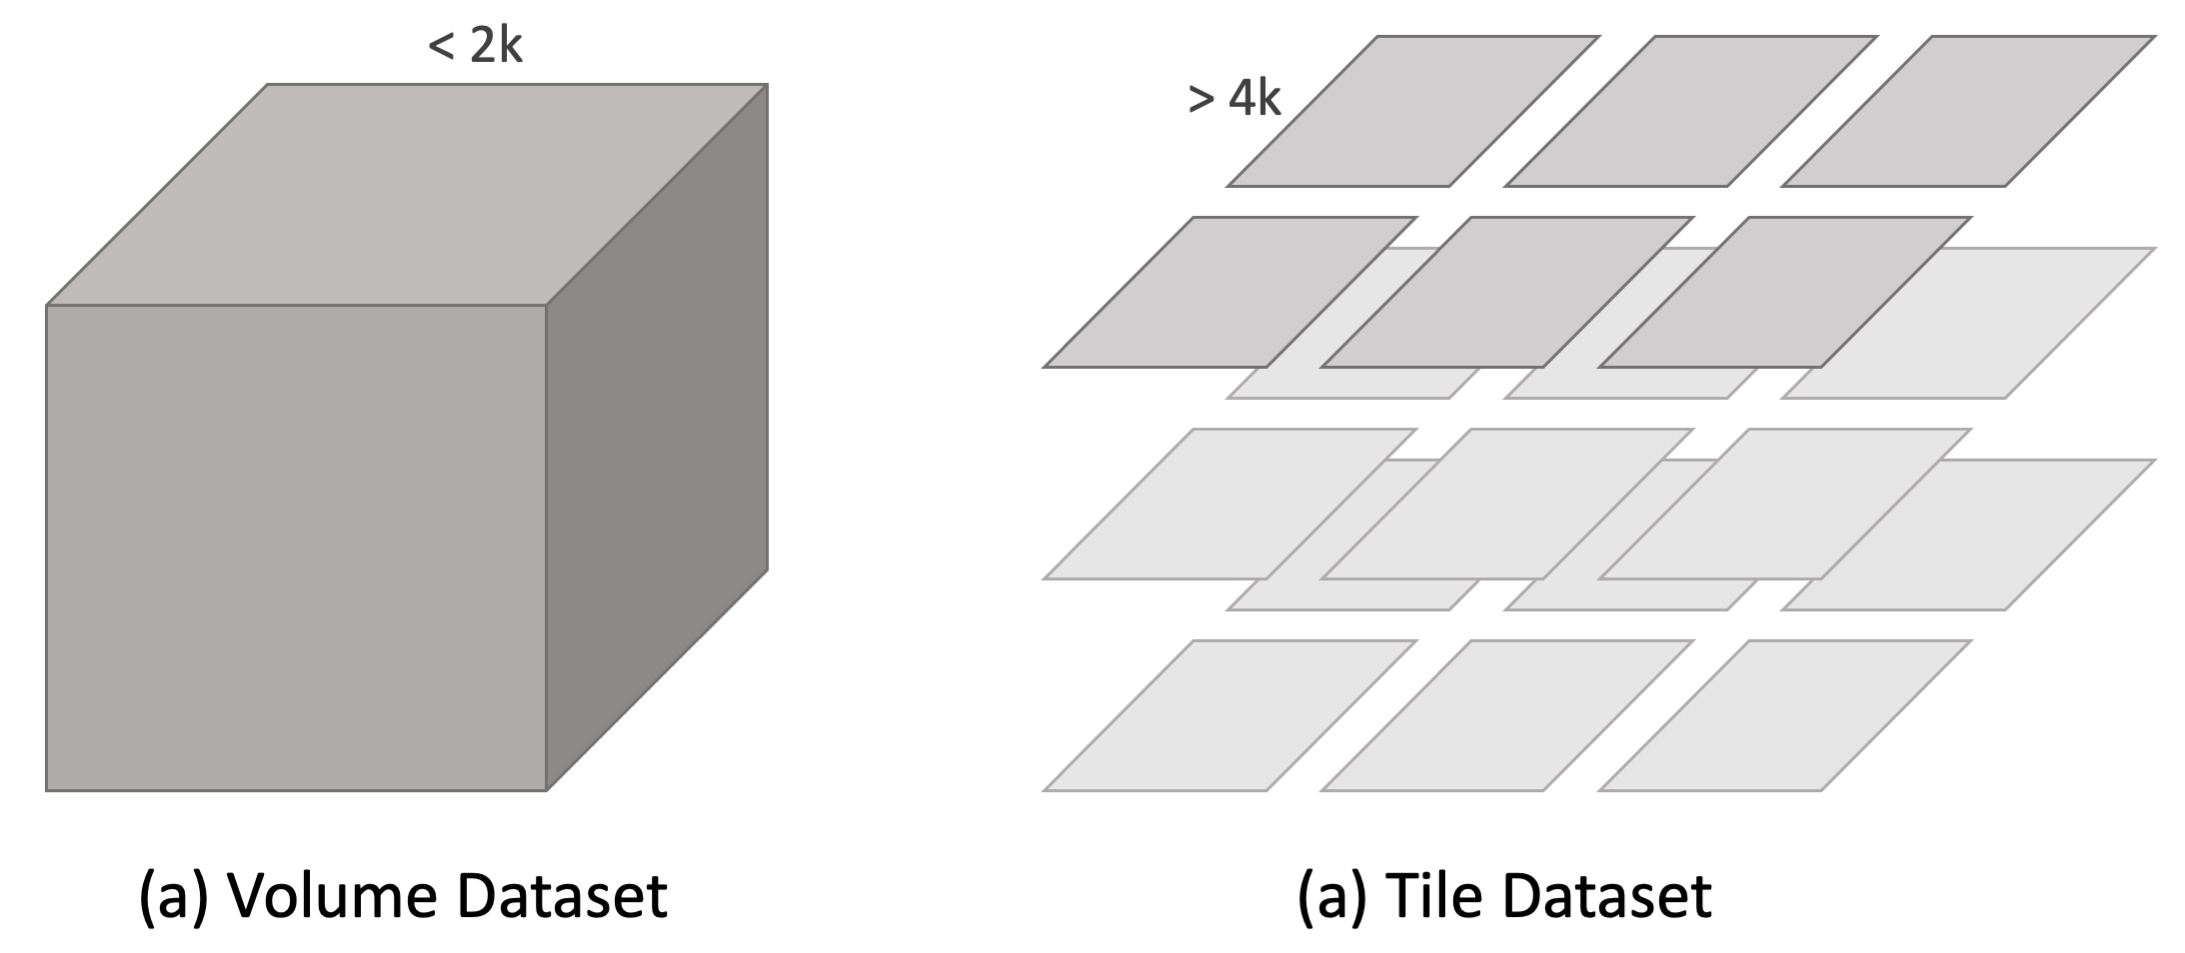
Therefore we define the Volume Dataset class that supports random sampling for training and slide-window inference with overlap for inference (Fig. 2a). Optional rejection sampling can be conducted on the fly during training to sample more foreground regions for sparse segmentation tasks like synapses. At inference time, the overlapped sliding-window volumes are combined using a blending function to reduce the border artifacts of CNN models.
Volume Dataset handles volumes at scale (\eg, CREMI [12]) by directly loading them into memory. However, volumes at scale or larger (\eg, MitoEM [51]) becomes intractable. Since those datasets are usually saved as large 2D tiles, we designed the Tile Dataset class (Fig. 2b), which reads the file paths and dataset metadata (resolution, patch size, etc.) in initialization. It then crops tractable volumes randomly during training or deterministically during inference to construct a sequence of Volume Dataset instances to conduct the following processing steps. With this design, inference on a large-scale dataset can easily be parallelized by passing different global coordinates to different processes. Even with a limited resource that can handle only one Volume Dataset instance, the framework can work properly (just with more time).
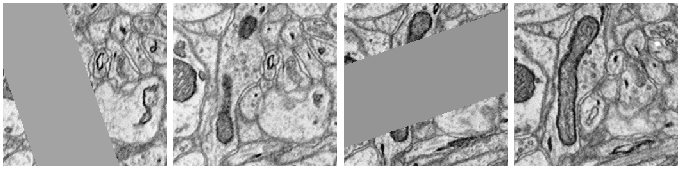
Data Augmentation. Since annotating biological and medical datasets requires expertise and time consuming, we developed more than ten different data augmentation techniques in the PyTC framework to improve the robustness of trained segmentation models. The augmentation module consists of non-spatial augmentations that work on images only and spatial augmentations that change images and corresponding segmentation labels simultaneously. Non-spatial augmentations include gray-scale that randomly adjust contrast and brightness, invert the color space, as well as apply gamma correction, and missing-part that randomly gray out image regions in non-consecutive slices, which let the model learn to infer the missing structures from the 3D context (Fig. 3). Spatial augmentations include rescale that randomly scale the image and masks in a pre-specified range, and misalignment that translates or rotates input volume at some slices to simulate the misalignment problem introduced when stitching 2D patches into 3D volumes during data processing. Details for other segmentation techniques can be found within the package at connectomics/data/augmentation.
Besides random augmentation at training time, we also support test-time augmentation that runs inference on up to 16 variants (flip along three axes and transpose one plane) and average them in a pixel-wise manner after reverting the augmented volumes to the original orientation to generate smooth predictions. Since the augmentation module directly operates on the NumPy array and does not rely on PyTorch, it can be a plug-and-play component for other deep learning and image processing frameworks.
4.2 Model Flexibility
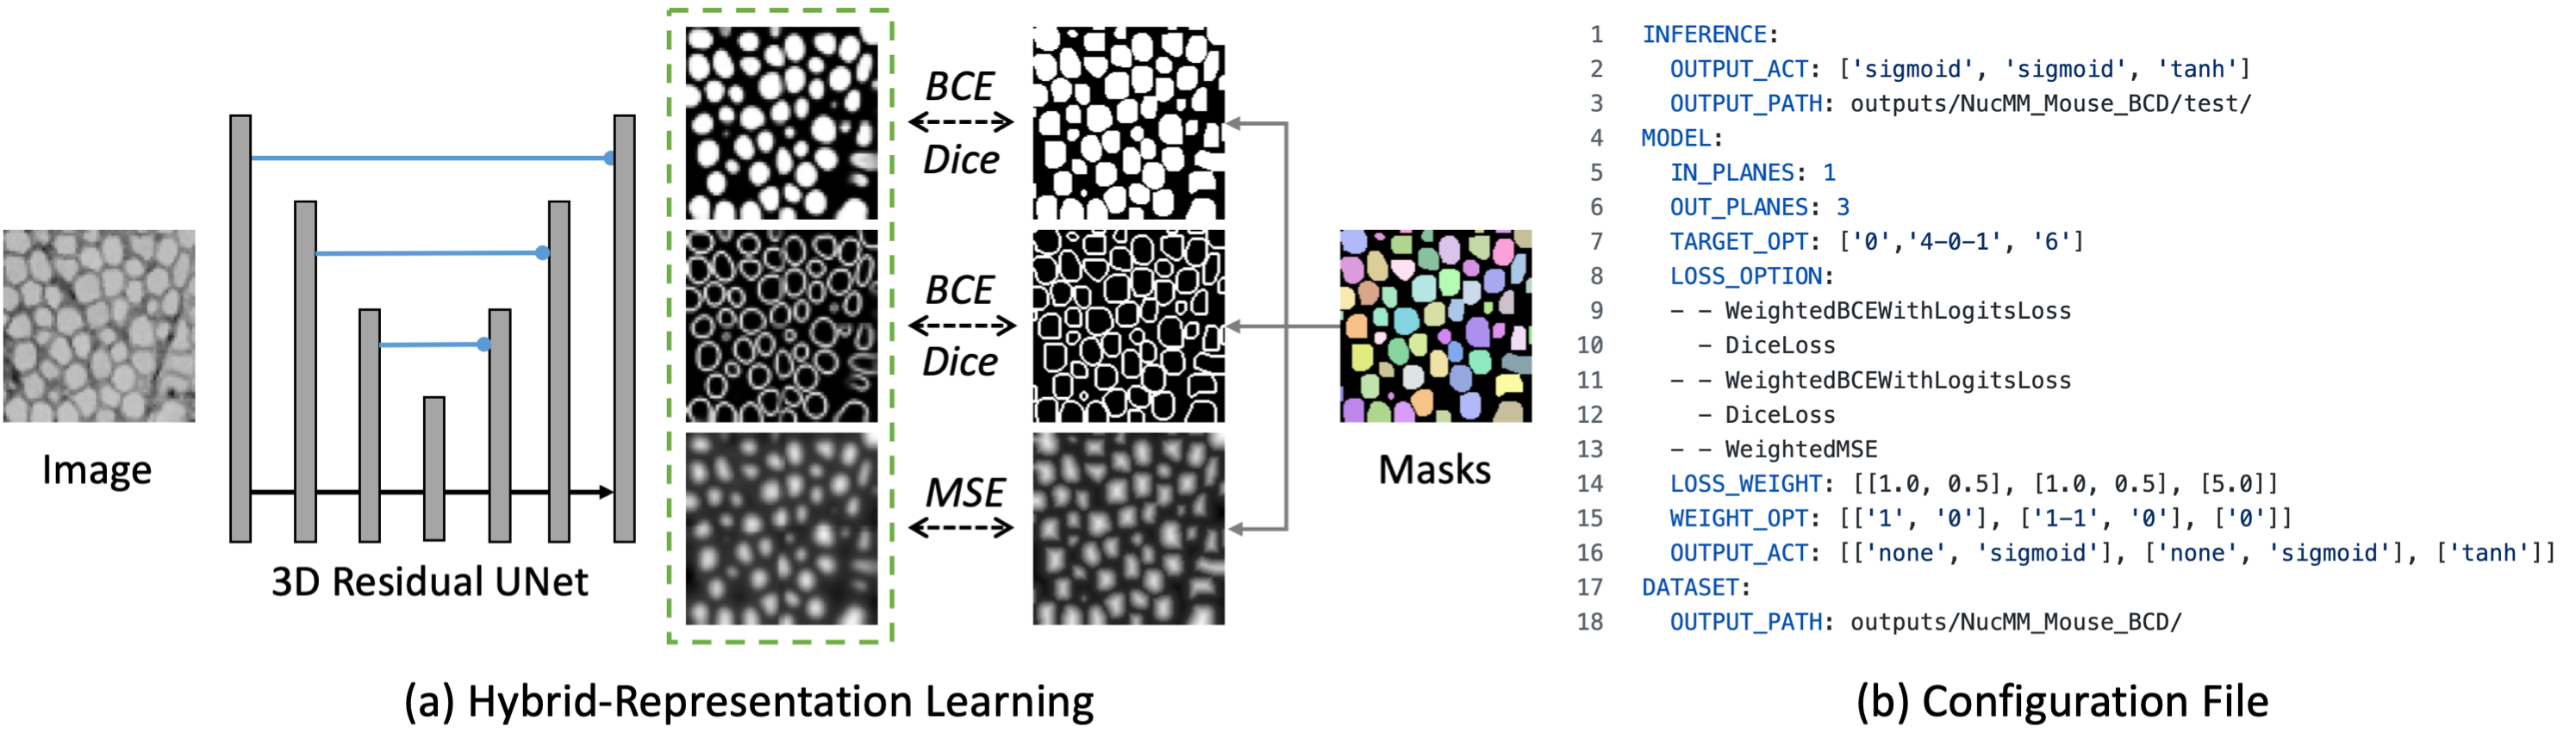
Hybrid-representation learning. We design the framework to handle several semantic and instance segmentation tasks as shown in Figure 1. In existing work, each task only learns one representation calculated from the ground-truth masks, like the 3D affinity graph for neuron segmentation [46, 23, 50], and signed distance transform for synaptic cleft segmentation [18]. Besides implementing individual learning targets in the package, we design and build a hybrid-representation learning framework where researchers can specify an arbitrary number of targets to learn and an arbitrary number of loss functions for each target by only changing the configuration file without any coding (Fig. 4). The weights among different targets and losses are also adjustable based on the downstream application. Our intuition is that simultaneously learning multiple representations using a shared neural network architecture can act as a regularization term to prevent the model from overfitting, and we show in the experiments that this approach performs better for datasets with limited labels.
Active and Semi-supervised Learning. Data annotation for connectomics requires expertise and is time-consuming. Manual annotation becomes feasible with the skyrocketing data scale [40], while the model trained on a restricted labeled dataset does not achieve satisfactory performance on vast unlabeled data. Thus besides supervised training, we also incorporate active and semi-supervised learning workflows in this package. Our active learning method is the two-stream active query suggestion algorithm which combines supervised model output and unsupervised feature extractor outputs to suggest the most informative samples in unlabeled data to get new expert annotation [25] with a limited budget. For semi-supervised learning, we currently support self-training that features a two-stage scheme. In the first stage, we train a supervised model on the labeled set. In the second stage, we first run inference on unlabeled data and then combine labeled and pseudo-labeled samples to finetune the model. Despite the simplicity of the approach, recent work has shown significantly improved performance on natural image segmentation benchmarks [57]. We will show in the experiments that self-training also performs well for synaptic cleft segmentation in connectomics.
Network Architectures. We designed a highly customizable network architecture so that researchers can freely configure 2D and 3D segmentation models like U-Net [38], DeepLab [8] with different numbers of filters, channels, activations, and normalization layers. One main feature of the volumetric image generated by serial-sectioning electron microscopy (EM) is anisotropy: the resolution on the -plane is 4nm, while 30 to 40nm for the -axis [22, 40]. It becomes less reasonable to use symmetric convolutions for all three axes in the model. Therefore the 3D models in our package can also be configured to tackle anisotropic data with mixed 2D and 3D convolutional layers. At an earlier stage of the model, we apply 2D convolutions and only downsample the -plane with pooling or strided convolution. At a later stage, where the downsampled volume becomes roughly isotropic, we apply symmetric 3D convolutions to make use of context in all three directions.
4.3 Training and Inference Parallelism
Distributed Training. Our framework supports multi-GPU training with DataParallel where a batch is split and forward separately on different GPUs and aggregated to calculate the loss, as well as DistributedDataParallel that only communicate gradients between GPUs, powered by PyTorch [37]. We make distributed training the default scheme of our package even for a single node as it avoids the overhead caused by the Python Global Interpreter Lock (GIL). For distributed training where multiple processes are running simultaneously with their data loaders, we add one option to control that each process sees a non-overlap part of a dataset, effectively reducing memory usage. This design has another benefit when using together with rejection sampling describe in Sec. 4.1. Specifically, some datasets have multiple volumes with different foreground densities (\eg, the density of synapses varies in different brain regions). Thus the loader samples fewer data points from volumes with sparse labels by expectation. However, if we distributed those volumes into different processes in distributed training, the number of sampled data points from multiple volumes becomes the same regardless of the foreground density, avoiding overlooking sparse regions.
Inference Parallelism. Our goal is the framework being scalable in inference with an unlimited number of devices. To achieve this, we design an inference workflow where users can specify a manageable size to chunk a large-scale dataset and update the global coordinates of the corresponding chunks in the configuration file. All the chunks are then processed in parallel on different nodes as no communication is required between processes. The prediction volumes are stored with an identifier of the global coordinate. By doing this, we can open only relevant predictions for post-processing and analysis, or combine them using a simple post-processing function to reconstruct a volume of the same size as the input image volume222Example post-processing function for the MitoEM dataset is available at https://github.com/zudi-lin/pytorch_connectomics/tree/master/configs/MitoEM..
| Volume A+ | Volume B+ | Volume C+ | Overall | |||||||||
|---|---|---|---|---|---|---|---|---|---|---|---|---|
| Method | ADGT | ADF | CREMI | ADGT | ADF | CREMI | ADGT | ADF | CREMI | ADGT | ADF | CREMI |
| Isensee et al. [20] | 19.02 | 210.58 | 114.80 | 140.41 | 26.73 | 83.57 | 33.95 | 19.08 | 26.52 | 64.46 | 85.46 | 74.96 |
| Heinrich et al. [18] | 116.59 | 28.32 | 72.46 | 176.83 | 30.41 | 103.62 | 35.57 | 17.65 | 26.61 | 109.67 | 25.46 | 67.56 |
| Lin et al. [25] | 106.41 | 59.88 | 83.15 | 134.66 | 22.37 | 78.51 | 51.84 | 8.34 | 30.09 | 96.14 | 33.05 | 64.59 |
| Ours w/o SSL | 68.62 | 63.63 | 66.13 | 155.40 | 5.43 | 80.42 | 48.94 | 5.35 | 27.14 | 90.99 | 24.81 | 57.90 |
| Liu and Ji [27] | 72.60 | 67.11 | 69.85 | 147.50 | 11.52 | 79.52 | 36.69 | 10.97 | 23.83 | 85.60 | 29.87 | 57.73 |
| Ours | 68.20 | 60.87 | 64.53 | 140.62 | 6.41 | 73.51 | 43.29 | 6.02 | 24.66 | 84.04 | 24.43 | 54.23 |
5 Experiments
To demonstrate the capability of PyTorch Connectomics, we benchmark the performance of our codebase on two semantic and two instance segmentation datasets covering cellular structures including synapses (Sec. 5.1), mitochondria (Sec. 5.2 & 5.3) and neuronal nuclei (Sec. 5.4).
5.1 Synaptic Cleft Detection
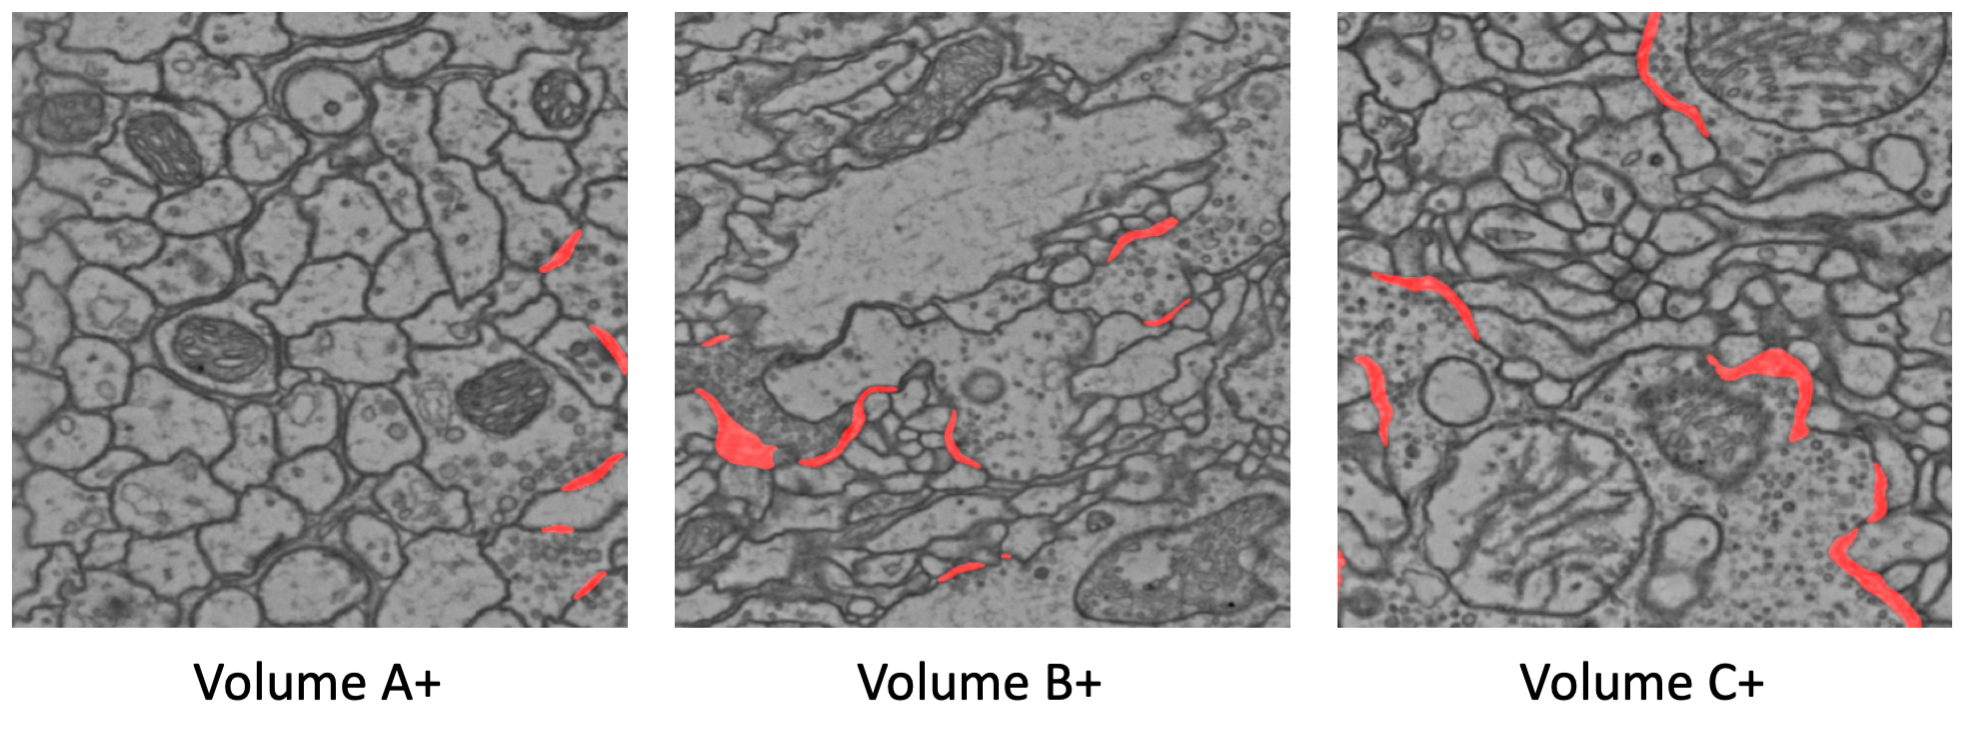
Dataset and Evaluation Metric. We evaluate PyTC on the CREMI Challenge dataset [12], which contains three labeled and three unlabeled volumes of the size voxels. The data is collected from adult Drosophila melanogaster brain tissue with EM at a voxel resolution of . The results are evaluated by two scores: the average distance of any predicted cleft voxel to its closest ground-truth (ADGT) for penalizing false positives and the average distance of any ground-truth cleft voxel to its closest predicted foreground (ADF) for penalizing false negatives. The final ranking criterion (CREMI score) is the mean of ADGT and ADF over the three test volumes.
Training and Inference. The model output has a single channel representing the probability synaptic cleft voxels. We first trained a customized 3D U-Net model using an SGD optimizer with linear warmup and cosine annealing in the learning rate scheduler. We use a weighted binary cross-entropy (BCE) loss and applied rejection sampling to reject samples without synapse during training with a probability of to penalize false negatives. The model input size is in as CREMI is an anisotropic dataset with higher and resolution. The model was optimized for 150K iterations with a batch size of 6 and a base learning rate of 0.02. To further improve the performance, we also use a semi-supervised learning approach called self-training, which generates pseudo-labels on unlabeled images and combines labeled and pseudo-labeled data together in model finetuning. We optimize the model again using the same protocol for 150K iterations.
Results. Table 1 shows comparison with results reported in existing publications, including nnUNet [20] that features a self-adapting framework based on the original U-Net [38], Heinrich et al. [18] that learns a signed distance transform, Lin et al. [25] that employs an asymmetric U-Net architecture, and CleftNet [27] that augments both features and labels for better learning. Our binary segmentation model without semi-supervised learning achieves an overall CREMI score of 57.90, which is comparable with the performance of the existing state-of-the-art approach at 57.73 [27]. Our final model achieves the best overall performance in terms of ADGT, ADF, and CREMI scores. For the overall CREMI score, which is the ranking criterion of the challenge, our result significantly improves previous state-of-the-art by relatively . We also visualize the prediction on the test volumes in Fig. 5. Even including all results on the CREMI leaderboard, our method still ranks 1st among the challenge submissions (by Dec 09, 2021).
5.2 Mitochondria Semantic Segmentation
Dataset and Evaluation Metric. For mitochondria semantic segmentation, we compare the model implemented with our PyTC framework with previous approaches on the EPFL Hippocampus dataset (also widely known as the Lucchi dataset) [30], which contains one training and one test volumes of size voxels. Following previous work [6], we evaluate the prediction using both foreground IoU and overall IoU. Casser et al. [6] provides the annotation from a neuroscience expert, whose performance is compared against the official annotation to define the human annotation performance on this task.
| Method | FG-IoU | IoU |
|---|---|---|
| Oztel et al. [35] | 0.907 | - |
| Xiao et al. [55] | 0.900 | - |
| Lucchi et al. [31] | 0.895 | 0.948 |
| Ours | 0.892 | 0.943 |
| Casser et al. [6] | 0.890 | 0.942 |
| Cheng and Varshney [10] | 0.889 | 0.942 |
| Human Annotation* [6] | 0.884 | 0.938 |
| Cetina et al. [7] | 0.760 | - |
| Márquez-Neila et al. [32] | 0.762 | - |
| Lucchi et al. [29] | 0.741 | - |
Training and Inference. Similar to the CREMI experiments, the model output is the probability map of mitochondria. Since this dataset is isotropic (each voxel is a cube), we use an input size of , and we only use 3D convolutional filters in our custom 3D U-Net architecture instead of a combination of 2D and 3D kernels as for anisotropic data. For training augmentation, we enable transpose between every pair of three axes as the input is cubic. We use both weighted BCE and Dice losses with a ratio of 1:1 and train the model for 100K iterations with a batch size of 8. For post-processing, we applied median filtering with a kernel size of .
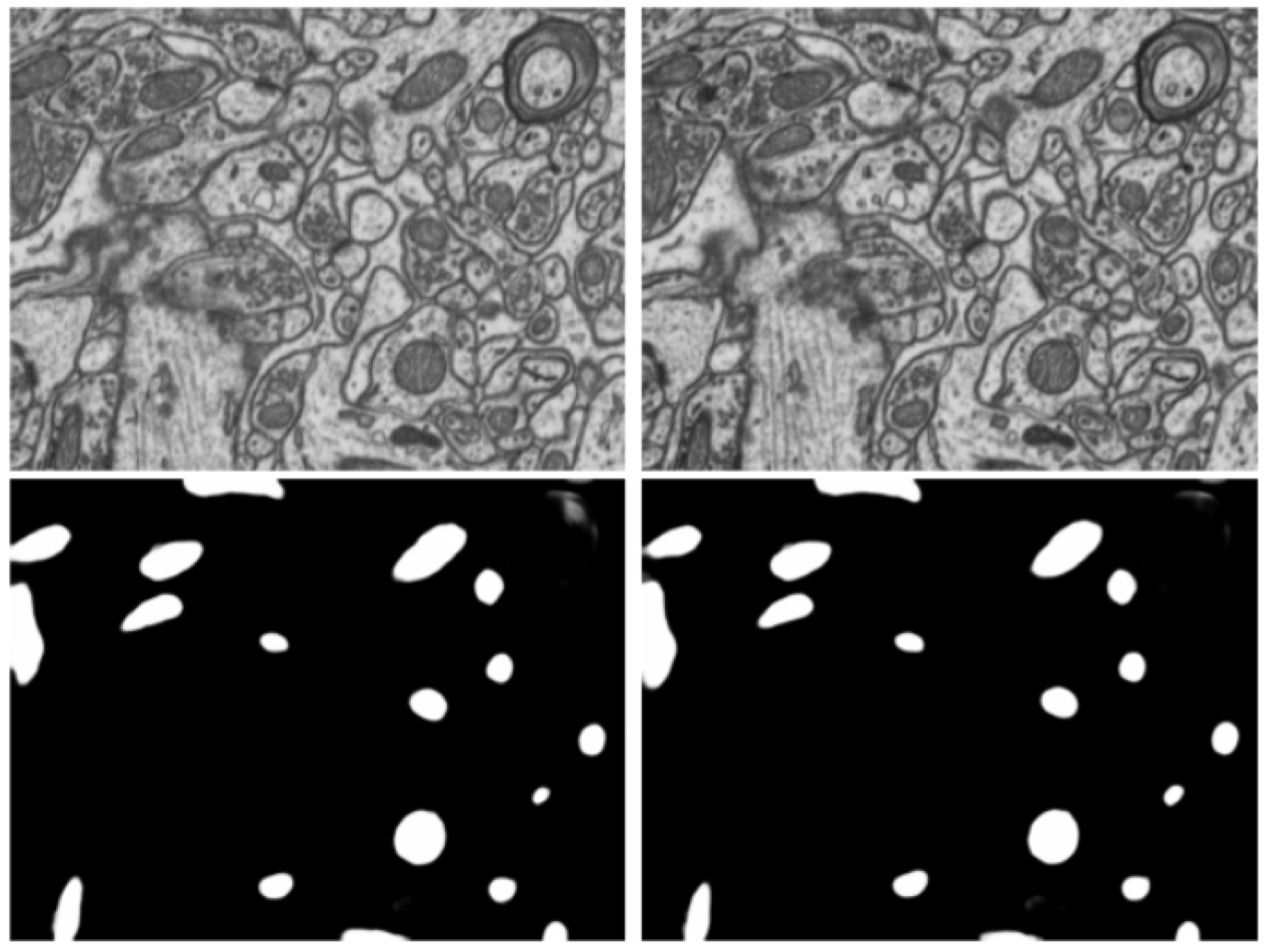
Results. Fig. 6 visualizes the raw model prediction without thresholding or median filtering on the EPFL Hippocampus test volume. In the quantitative comparison with previous state-of-the-art works on this dataset (Table 2), we show that our model surpasses human annotation performance provided by Casser et al. [6]. Besides, different from the best performing method [35] which has a complex post-processing step including watershed-based boundary refinement, we only apply a simple median filtering with a cubic kernel after model inference.
5.3 Mitochondria Instance Segmentation
Dataset and Evaluation Metric. Besides semantic segmentation tasks, including synaptic cleft and mitochondria segmentation, we also work on the more challenging instance segmentation problem, which assigns each object a unique index. Specifically, we use the large-scale MitoEM dataset [51] for segmenting mitochondria instances, which is over larger than the Lucchi dataset [30] and has two volumes covering human (MitoEM-H) and rat (MitoEM-R) brain tissues, respectively. A difficult case for segmentation algorithms is demonstrated in Fig. 6. Both volumes are partitioned into consecutive train, val and test splits with 40%, 10% and 50% of the data. For evaluation, we use the 3D average precision (AP) metric with a mask IoU threshold of 0.75, denoted as AP-75. The test sets are automatically evaluated on the challenge website333IEEE-ISBI 2021 MitoEM challenge: https://mitoem.grand-challenge.org/.
Training and Inference. We use the Tile Dataset to process MitoEM as the volumes are too large to be directly loaded into memory. Different from the binary semantic segmentation models that have only one output channel, we build a U3D-BC architecture [51] that predicts the foreground mask and instance contour map at the same time. The instance contour map is informative in separating closely touching instances. We train the models for 150K iterations from scratch with a batch size of 8 and an input size of as the data is also anisotropic. We train two models for two volumes separately in this comparison. The watershed segmentation algorithm is applied after merging overlapping chunks back to a single volume.
| Method | MitoEM-R | MitoEM-H | Overall |
|---|---|---|---|
| M. Li et al. [24] | 0.851 | 0.829 | 0.840 |
| U3D-BC (Ours) | 0.816 | 0.804 | 0.810 |
| Z. Li et al. | 0.815 | 0.783 | 0.799 |
| C. Pape | 0.770 | 0.770 | 0.770 |
| R. Conrad | 0.662 | 0.679 | 0.671 |
Results. On the MitoEM challenge dataset, our model achieves an AP-75 score of 0.816 for the rat volume and 0.804 for the human volume, which is on average 0.810 and ranks 2nd among the submissions from challenge participants. We noticed that the segmentation performance for small instances (5K voxels) are relatively low (0.311 for rat and 0.426 for human, respectively). We argue this is because small objects are much easier to be ignored than medium (5KK voxels) and large (30K voxels) ones with a similar thickness of predicted instance boundaries. Therefore for future work, we will work on improving the segmentation for small instances without sacrificing accuracy for medium and large instances.
5.4 Neuronal Nuclei Instance Segmentation
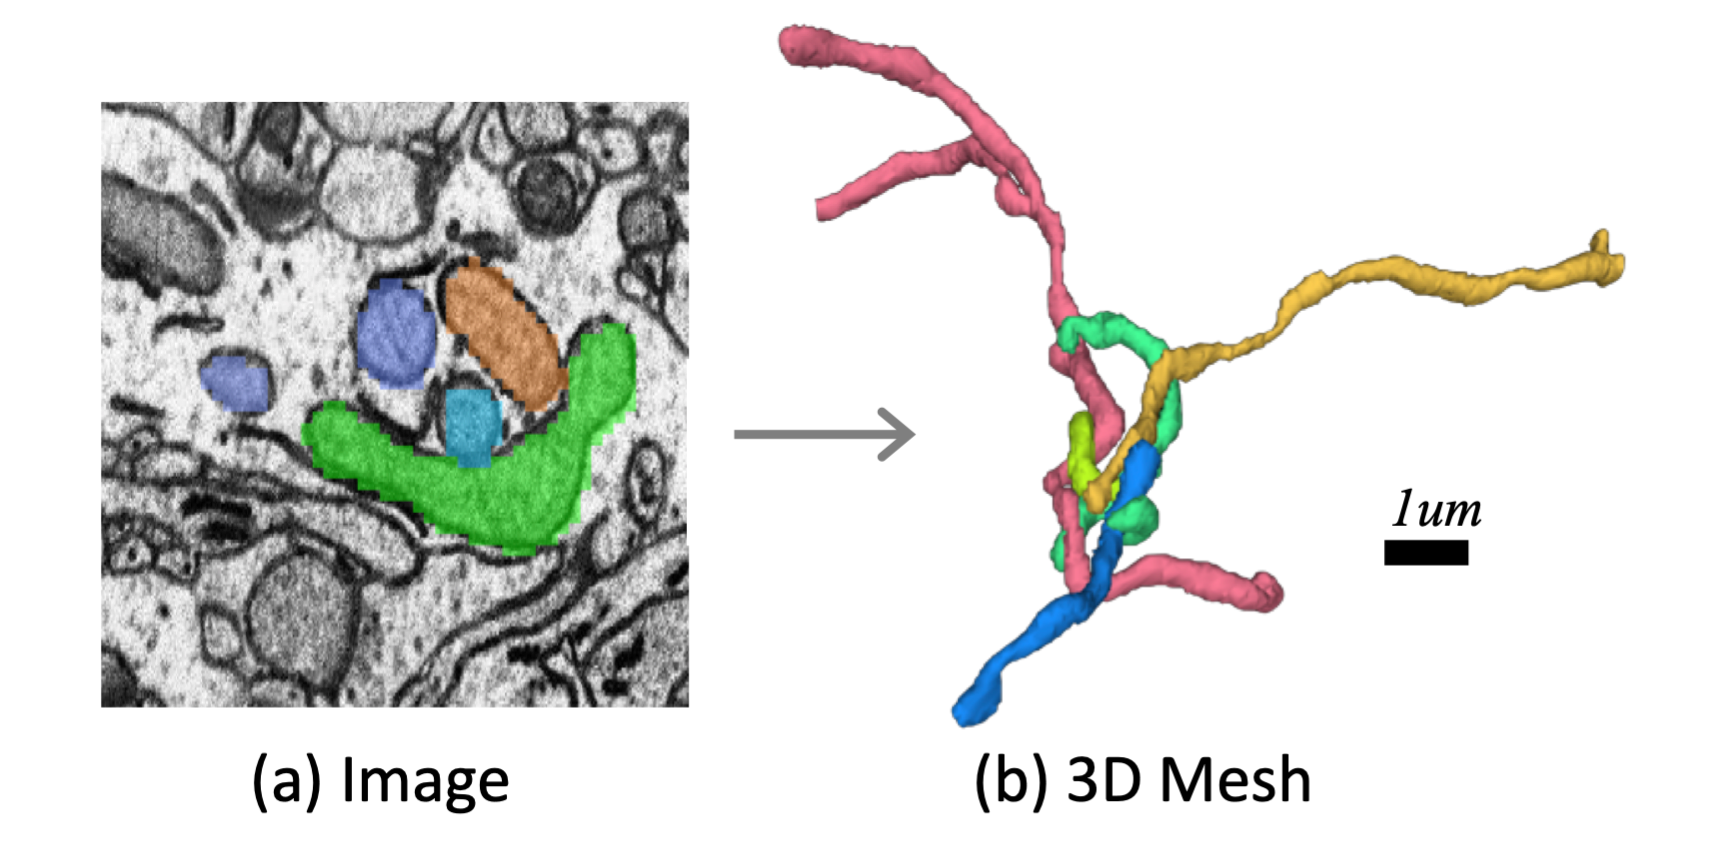
Dataset and Evaluation Metric. We use the NucMM dataset [26] that has one EM volume of zebrafish brain (Fig. 1d) and one micro-CT volume of mouse visual cortex. The numbers of neuronal nuclei are 170K and 7K for two volumes, respectively. Unlike those datasets described above with nanometer resolution, the two volumes have almost isotropic voxels of and , respectively. Each volume is split into training set, validation set, and test set. For evaluation, we use the 3D average precision (AP) metric similar to the MitoEM data for mitochondria instance segmentation [51]. However, instead of using one single IoU threshold of 0.75, we evaluated at both AP-50 and AP-75 as the objects are relatively small (not physically but in terms of the number of voxels).
Training and Inference. We construct two hybrid-representation learning models, including a U3D-BC that learns foreground mask and instance contour at the same time (similar to mitochondria instance segmentation) and a U3D-BCD model that additionally learns a signed distance map (Fig. 4). Specifically, the distance map is
| (1) |
where and denote the foreground and background regions, while and control the scale of the distance. For U3D-BC, we use the default 1.0 weight ratio between the foreground and contour map losses. For U3D-BCD, we set and of the signed distance map to 8 and 50, respectively, without tweaking. The segmentation models are trained separately on both volumes because the image appearances and nuclei distributions are quite distinct. For the U3D-BCD model, all three model predictions are used in the watershed segmentation step to yield the instance masks.
Results. We show the AP scores (AP-50, AP-75, and their average) on the 90 test sets for both volumes after hyperparameter tunning on the validation sets (Table 4). The overall performance is the mean over two NucMM volumes. The results show that both our U3D-BC and U3D-BCD models compare favorably against existing nuclei segmentation methods, including Cellpose [43] and Stardist [52]. Besides, the U3D-BCD model that learns an additional distance map outperforms the U3D-BC model by relatively in overall performance. We argue this is because the signed distance map preserves more information of the instance structure and has more supervision on the background regions as the other two representations treat background pixels close or distant from the foreground equally.
| Method | NucMM-Z | NucMM-M | Overall | ||
|---|---|---|---|---|---|
| AP-50 | AP-75 | AP-50 | AP-75 | ||
| Cellpose [43] | 0.796 | 0.342 | 0.463 | 0.002 | 0.401 |
| StarDist [52] | 0.912 | 0.328 | 0.306 | 0.004 | 0.388 |
| U3D-BC [51] | 0.782 | 0.556 | 0.645 | 0.210 | 0.549 |
| U3D-BCD [26] | 0.978 | 0.809 | 0.638 | 0.250 | 0.669 |
6 Discussion and Future Work
In this paper, we present the PyTorch Connectomics deep learning toolbox that is flexible in constructing appropriate models for diverse tasks and scalable in tackling volumetric microscopy datasets at different sizes. Since connectomics (and the more general microscopy image analysis) is a fast-growing field involving multiple imaging modalities and generates image data at petabyte scales, there are many opportunities and challenges calling for effort from the computer vision and machine learning aspects. For the next step, we identify three directions that will improve the capability of our framework in assisting researchers in biological and medical analysis.
Unsupervised Visual Representation Learning. Recent work on unsupervised representation learning from raw images without any labels [16, 9] has achieved impressive performance in learning meaningful representations, which tackles diverse downstream tasks by finetuning on a small amount of labeled data. The most widely used idea is contrastive learning, which makes two augmentations of the same image close and different images apart in the feature space under some similarity measure (\eg, cosine similarity). Considering the diverse modalities and large scale of connectomics data and the expensiveness in obtaining expert annotations, building generic architectures by unsupervised learning on raw images can be a promising way to improve the finetuning performance for specific supervised learning tasks. It can also be applied together with active learning and semi-supervised learning to utilize vast unlabeled images effectively under an annotation budget.
Improving Training and Inference Efficiency. With the use of multi-beam electron microscopes that image a hexagonal area of about simultaneously at nanometer resolution [40], the training and inference of deep learning models have become a bottleneck in the connectomics workflow. For inference, besides parallel processing on multiple nodes with multiple GPUs, we plan to incorporate recent techniques including network distillation [19], pruning [15] and quantization [11] to significantly improve the inference efficiency without a performance drop. For training, we will implement the multigrid method designed for efficiently optimizing video models [54]. The unsupervised visual representation learning approach described above can also improve training efficiency as fewer iterations are needed to achieve similar or higher performance by starting from such pretrained models.
Semi-automatic Proofreading. Proofreading is a crucial step in data-driven biomedical research because current automatic algorithms do not generate satisfying segmentation results for downstream morphology and network analysis. Without easy-to-use software, both the proofreading and the training of annotators can be time-consuming. Our idea for achieving high proofreading efficiency is to develop robust learning algorithms that can suggest errors in automatic predictions and provide choices of high-quality corrections to effectively decrease the navigation time and the number of required interactions, respectively. For suggesting errors, we will use semi-supervised learning to capture mispredictions in unlabeled data by incorporating them in model optimization. For error correction, we plan to build a shape-representation model that can suggest the fixation of errors based on shape priors learned from annotated masks.
Acknowledgement
Our PyTorch Connectomics is built upon numerous previous projects in the connectomics and computer vision community. Especially, we would like to thank the contributors of the following GitHub repositories: PyGreentea444https://github.com/naibaf7/PyGreentea, DataProvider555https://github.com/torms3/DataProvider and Detectron2666https://github.com/facebookresearch/detectron2. We thank Jason Adhinarta, Siddharth Awasthi, Atmadeep Banerjee, Mourad Belhamissi, Aarush Gupta, Krishna Swaroop K, Emil Krauch, Aayush Kumar, Yuhao Lu, Atharva Peshkar, Pragya Singh, Qijia Shen, Karan Uppal, Zijie Zhao, Chenfan Zhuang, and Silin Zou (sorted by last name) for contributing to this package. We thank our close collaborators Ignacio Arganda-Carreras and Xueying (Snow) Wang for the exciting explorations together. We thank the co-authors of our connectomics-related publications for the effort to make the field more accessible to computer science researchers. Finally, we gratefully acknowledge the support from NSF awards IIS-1835231 and IIS-2124179.
References
- [1] Chris Allan, Jean-Marie Burel, Josh Moore, Colin Blackburn, Melissa Linkert, Scott Loynton, Donald MacDonald, William J Moore, Carlos Neves, Andrew Patterson, et al. Omero: flexible, model-driven data management for experimental biology. Nature methods, 9(3):245–253, 2012.
- [2] J Alexander Bae, Mahaly Baptiste, Agnes L Bodor, Derrick Brittain, JoAnn Buchanan, Daniel J Bumbarger, Manuel A Castro, Brendan Celii, Erick Cobos, Forrest Collman, et al. Functional connectomics spanning multiple areas of mouse visual cortex. bioRxiv, 2021.
- [3] Ilya Belevich, Merja Joensuu, Darshan Kumar, Helena Vihinen, and Eija Jokitalo. Microscopy image browser: a platform for segmentation and analysis of multidimensional datasets. PLoS biology, 14(1):e1002340, 2016.
- [4] Manuel Berning, Kevin M Boergens, and Moritz Helmstaedter. Segem: efficient image analysis for high-resolution connectomics. Neuron, 87(6):1193–1206, 2015.
- [5] Anne E Carpenter, Thouis R Jones, Michael R Lamprecht, Colin Clarke, In Han Kang, Ola Friman, David A Guertin, Joo Han Chang, Robert A Lindquist, Jason Moffat, et al. Cellprofiler: image analysis software for identifying and quantifying cell phenotypes. Genome biology, 7(10):1–11, 2006.
- [6] Vincent Casser, Kai Kang, Hanspeter Pfister, and Daniel Haehn. Fast mitochondria detection for connectomics. In Medical Imaging with Deep Learning, pages 111–120. PMLR, 2020.
- [7] Kendrick Cetina, José M Buenaposada, and Luis Baumela. Multi-class segmentation of neuronal structures in electron microscopy images. BMC bioinformatics, 19(1):1–13, 2018.
- [8] Liang-Chieh Chen, George Papandreou, Iasonas Kokkinos, Kevin Murphy, and Alan L Yuille. Deeplab: Semantic image segmentation with deep convolutional nets, atrous convolution, and fully connected crfs. IEEE transactions on pattern analysis and machine intelligence, 40(4):834–848, 2017.
- [9] Ting Chen, Simon Kornblith, Mohammad Norouzi, and Geoffrey Hinton. A simple framework for contrastive learning of visual representations. In International conference on machine learning, pages 1597–1607. PMLR, 2020.
- [10] Hsueh-Chien Cheng and Amitabh Varshney. Volume segmentation using convolutional neural networks with limited training data. In ICIP, 2017.
- [11] Matthieu Courbariaux, Yoshua Bengio, and Jean-Pierre David. Binaryconnect: Training deep neural networks with binary weights during propagations. In Advances in neural information processing systems, pages 3123–3131, 2015.
- [12] Jan Funke, Stephan Saalfeld, Davi Bock, Srini Turaga, and Eric Perlman. Circuit reconstruction from electron microscopy images, 2016.
- [13] Estibaliz Gómez-de Mariscal, Carlos García-López-de Haro, Wei Ouyang, Laurène Donati, Emma Lundberg, Michael Unser, Arrate Muñoz-Barrutia, and Daniel Sage. Deepimagej: A user-friendly environment to run deep learning models in imagej. Nature Methods, pages 1192–1195, 2021.
- [14] Matthias G Haberl, Christopher Churas, Lucas Tindall, Daniela Boassa, Sébastien Phan, Eric A Bushong, Matthew Madany, Raffi Akay, Thomas J Deerinck, Steven T Peltier, et al. Cdeep3m—plug-and-play cloud-based deep learning for image segmentation. Nature methods, 15(9):677–680, 2018.
- [15] Song Han, Jeff Pool, John Tran, and William J Dally. Learning both weights and connections for efficient neural networks. arXiv preprint arXiv:1506.02626, 2015.
- [16] Kaiming He, Haoqi Fan, Yuxin Wu, Saining Xie, and Ross Girshick. Momentum contrast for unsupervised visual representation learning. In Proceedings of the IEEE/CVF Conference on Computer Vision and Pattern Recognition, pages 9729–9738, 2020.
- [17] Kaiming He, Georgia Gkioxari, Piotr Dollár, and Ross Girshick. Mask r-cnn. In Proceedings of the IEEE international conference on computer vision, pages 2961–2969, 2017.
- [18] Larissa Heinrich, Jan Funke, Constantin Pape, Juan Nunez-Iglesias, and Stephan Saalfeld. Synaptic cleft segmentation in non-isotropic volume electron microscopy of the complete drosophila brain. In MICCAI, 2018.
- [19] Geoffrey Hinton, Oriol Vinyals, and Jeff Dean. Distilling the knowledge in a neural network. arXiv preprint arXiv:1503.02531, 2015.
- [20] Fabian Isensee, Paul F Jaeger, Simon AA Kohl, Jens Petersen, and Klaus H Maier-Hein. nnu-net: a self-configuring method for deep learning-based biomedical image segmentation. Nature methods, 18(2):203–211, 2021.
- [21] Michał Januszewski, Jörgen Kornfeld, Peter H Li, Art Pope, Tim Blakely, Larry Lindsey, Jeremy Maitin-Shepard, Mike Tyka, Winfried Denk, and Viren Jain. High-precision automated reconstruction of neurons with flood-filling networks. Nature methods, 15(8):605, 2018.
- [22] Narayanan Kasthuri, Kenneth Jeffrey Hayworth, Daniel Raimund Berger, Richard Lee Schalek, José Angel Conchello, Seymour Knowles-Barley, Dongil Lee, Amelio Vázquez-Reina, Verena Kaynig, Thouis Raymond Jones, et al. Saturated reconstruction of a volume of neocortex. Cell, 162(3):648–661, 2015.
- [23] Kisuk Lee, Jonathan Zung, Peter Li, Viren Jain, and H Sebastian Seung. Superhuman accuracy on the snemi3d connectomics challenge. arXiv:1706.00120, 2017.
- [24] Mingxing Li, Chang Chen, Xiaoyu Liu, Wei Huang, Yueyi Zhang, and Zhiwei Xiong. Advanced deep networks for 3d mitochondria instance segmentation. arXiv preprint arXiv:2104.07961, 2021.
- [25] Zudi Lin, Donglai Wei, Won-Dong Jang, Siyan Zhou, Xupeng Chen, Xueying Wang, Richard Schalek, Daniel Berger, Brian Matejek, Lee Kamentsky, et al. Two stream active query suggestion for active learning in connectomics. In Computer Vision–ECCV 2020: 16th European Conference, Glasgow, UK, August 23–28, 2020, Proceedings, Part XVIII 16, pages 103–120. Springer, 2020.
- [26] Zudi Lin, Donglai Wei, Mariela D Petkova, Yuelong Wu, Zergham Ahmed, Silin Zou, Nils Wendt, Jonathan Boulanger-Weill, Xueying Wang, Nagaraju Dhanyasi, et al. Nucmm dataset: 3d neuronal nuclei instance segmentation at sub-cubic millimeter scale. In International Conference on Medical Image Computing and Computer-Assisted Intervention, pages 164–174. Springer, 2021.
- [27] Yi Liu and Shuiwang Ji. Cleftnet: Augmented deep learning for synaptic cleft detection from brain electron microscopy. IEEE Transactions on Medical Imaging, 2021.
- [28] Alice M Lucas, Pearl V Ryder, Bin Li, Beth A Cimini, Kevin W Eliceiri, and Anne E Carpenter. Open-source deep-learning software for bioimage segmentation. Molecular Biology of the Cell, 32(9):823–829, 2021.
- [29] Aurélien Lucchi, Carlos Becker, Pablo Márquez Neila, and Pascal Fua. Exploiting enclosing membranes and contextual cues for mitochondria segmentation. In MICCAI, 2014.
- [30] Aurélien Lucchi, Yunpeng Li, Kevin Smith, and Pascal Fua. Structured image segmentation using kernelized features. In ECCV, 2012.
- [31] Aurélien Lucchi, Pablo Márquez-Neila, Carlos Becker, Yunpeng Li, Kevin Smith, Graham Knott, and Pascal Fua. Learning structured models for segmentation of 2d and 3d imagery. IEEE TMI, 2015.
- [32] Pablo Márquez-Neila, Pushmeet Kohli, Carsten Rother, and Luis Baumela. Non-parametric higher-order random fields for image segmentation. In European Conference on Computer Vision, pages 269–284. Springer, 2014.
- [33] Claire McQuin, Allen Goodman, Vasiliy Chernyshev, Lee Kamentsky, Beth A Cimini, Kyle W Karhohs, Minh Doan, Liya Ding, Susanne M Rafelski, Derek Thirstrup, et al. Cellprofiler 3.0: Next-generation image processing for biology. PLoS biology, 16(7):e2005970, 2018.
- [34] Erick Moen, Dylan Bannon, Takamasa Kudo, William Graf, Markus Covert, and David Van Valen. Deep learning for cellular image analysis. Nature methods, 16(12):1233–1246, 2019.
- [35] Ismail Oztel, Gozde Yolcu, Ilker Ersoy, Tommi White, and Filiz Bunyak. Mitochondria segmentation in electron microscopy volumes using deep convolutional neural network. In Bioinformatics and Biomedicine, 2017.
- [36] Ahmad Paintdakhi, Bradley Parry, Manuel Campos, Irnov Irnov, Johan Elf, Ivan Surovtsev, and Christine Jacobs-Wagner. Oufti: an integrated software package for high-accuracy, high-throughput quantitative microscopy analysis. Molecular microbiology, 99(4):767–777, 2016.
- [37] Adam Paszke, Sam Gross, Francisco Massa, Adam Lerer, James Bradbury, Gregory Chanan, Trevor Killeen, Zeming Lin, Natalia Gimelshein, Luca Antiga, Alban Desmaison, Andreas Kopf, Edward Yang, Zachary DeVito, Martin Raison, Alykhan Tejani, Sasank Chilamkurthy, Benoit Steiner, Lu Fang, Junjie Bai, and Soumith Chintala. Pytorch: An imperative style, high-performance deep learning library. In H. Wallach, H. Larochelle, A. Beygelzimer, F. d'Alché-Buc, E. Fox, and R. Garnett, editors, Advances in Neural Information Processing Systems 32, pages 8024–8035. Curran Associates, Inc., 2019.
- [38] Olaf Ronneberger, Philipp Fischer, and Thomas Brox. U-net: Convolutional networks for biomedical image segmentation. In International Conference on Medical image computing and computer-assisted intervention, pages 234–241. Springer, 2015.
- [39] Johannes Schindelin, Ignacio Arganda-Carreras, Erwin Frise, Verena Kaynig, Mark Longair, Tobias Pietzsch, Stephan Preibisch, Curtis Rueden, Stephan Saalfeld, Benjamin Schmid, et al. Fiji: an open-source platform for biological-image analysis. Nature methods, 9(7):676–682, 2012.
- [40] Alexander Shapson-Coe, Michał Januszewski, Daniel R Berger, Art Pope, Yuelong Wu, Tim Blakely, Richard L Schalek, Peter Li, Shuohong Wang, Jeremy Maitin-Shepard, et al. A connectomic study of a petascale fragment of human cerebral cortex. bioRxiv, 2021.
- [41] Arlo Sheridan, Tri Nguyen, Diptodip Deb, Wei-Chung Allen Lee, Stephan Saalfeld, Srini Turaga, Uri Manor, and Jan Funke. Local shape descriptors for neuron segmentation. bioRxiv, 2021.
- [42] Christoph Sommer, Christoph Straehle, Ullrich Koethe, and Fred A Hamprecht. Ilastik: Interactive learning and segmentation toolkit. In 2011 IEEE international symposium on biomedical imaging: From nano to macro, pages 230–233. IEEE, 2011.
- [43] Carsen Stringer, Tim Wang, Michalis Michaelos, and Marius Pachitariu. Cellpose: a generalist algorithm for cellular segmentation. Nature Methods, 18(1):100–106, 2021.
- [44] Stella Stylianidou, Connor Brennan, Silas B Nissen, Nathan J Kuwada, and Paul A Wiggins. Supersegger: robust image segmentation, analysis and lineage tracking of bacterial cells. Molecular microbiology, 102(4):690–700, 2016.
- [45] Abhimanyu Talwar, Zudi Lin, Donglai Wei, Yuesong Wu, Bowen Zheng, Jinglin Zhao, Won-Dong Jang, Xueying Wang, Jeff Lichtman, and Hanspeter Pfister. A topological nomenclature for 3d shape analysis in connectomics. In Proceedings of the IEEE/CVF Conference on Computer Vision and Pattern Recognition Workshops, pages 986–987, 2020.
- [46] Srinivas C Turaga, Kevin L Briggman, Moritz Helmstaedter, Winfried Denk, and H Sebastian Seung. Maximin affinity learning of image segmentation. arXiv preprint arXiv:0911.5372, 2009.
- [47] Hidetoshi Urakubo, Torsten Bullmann, Yoshiyuki Kubota, Shigeyuki Oba, and Shin Ishii. Uni-em: An environment for deep neural network-based automated segmentation of neuronal electron microscopic images. Scientific reports, 9(1):1–9, 2019.
- [48] Tristan Ursell, Timothy K Lee, Daisuke Shiomi, Handuo Shi, Carolina Tropini, Russell D Monds, Alexandre Colavin, Gabriel Billings, Ilina Bhaya-Grossman, Michael Broxton, et al. Rapid, precise quantification of bacterial cellular dimensions across a genomic-scale knockout library. BMC biology, 15(1):1–15, 2017.
- [49] David A Van Valen, Takamasa Kudo, Keara M Lane, Derek N Macklin, Nicolas T Quach, Mialy M DeFelice, Inbal Maayan, Yu Tanouchi, Euan A Ashley, and Markus W Covert. Deep learning automates the quantitative analysis of individual cells in live-cell imaging experiments. PLoS computational biology, 12(11):e1005177, 2016.
- [50] Donglai Wei, Kisuk Lee, Hanyu Li, Ran Lu, J Alexander Bae, Zequan Liu, Lifu Zhang, Márcia dos Santos, Zudi Lin, Thomas Uram, et al. Axonem dataset: 3d axon instance segmentation of brain cortical regions. In International Conference on Medical Image Computing and Computer-Assisted Intervention, pages 175–185. Springer, 2021.
- [51] Donglai Wei, Zudi Lin, Daniel Franco-Barranco, Nils Wendt, et al. MitoEM dataset: Large-scale 3D mitochondria instance segmentation from EM images. In MICCAI, 2020.
- [52] Martin Weigert, Uwe Schmidt, Robert Haase, Ko Sugawara, and Gene Myers. Star-convex polyhedra for 3d object detection and segmentation in microscopy. In Proceedings of the IEEE/CVF Winter Conference on Applications of Computer Vision, pages 3666–3673, 2020.
- [53] Adrian Wolny, Lorenzo Cerrone, Athul Vijayan, Rachele Tofanelli, Amaya Vilches Barro, Marion Louveaux, Christian Wenzl, Sören Strauss, David Wilson-Sánchez, Rena Lymbouridou, et al. Accurate and versatile 3d segmentation of plant tissues at cellular resolution. Elife, 9:e57613, 2020.
- [54] Chao-Yuan Wu, Ross Girshick, Kaiming He, Christoph Feichtenhofer, and Philipp Krahenbuhl. A multigrid method for efficiently training video models. In Proceedings of the IEEE/CVF Conference on Computer Vision and Pattern Recognition, pages 153–162, 2020.
- [55] Chi Xiao, Xi Chen, Weifu Li, Linlin Li, Lu Wang, Qiwei Xie, and Hua Han. Automatic mitochondria segmentation for em data using a 3d supervised convolutional network. Frontiers in neuroanatomy, 12:92, 2018.
- [56] C Shan Xu, Michal Januszewski, Zhiyuan Lu, Shin-ya Takemura, Kenneth Hayworth, Gary Huang, Kazunori Shinomiya, Jeremy Maitin-Shepard, David Ackerman, Stuart Berg, et al. A connectome of the adult drosophila central brain. BioRxiv, 2020.
- [57] Barret Zoph, Golnaz Ghiasi, Tsung-Yi Lin, Yin Cui, Hanxiao Liu, Ekin D Cubuk, and Quoc V Le. Rethinking pre-training and self-training. arXiv preprint arXiv:2006.06882, 2020.