Hard-state optical wind during the discovery outburst of the black-hole X-ray dipper MAXI J1803298
Abstract
We present twelve epochs of optical spectroscopy taken across the discovery outburst of the black hole candidate MAXI J1803298 with the GTC and VLT telescopes. The source followed a standard outburst evolution with hard and soft states. The system displays a triangular shape in the hardness intensity diagram, consistent with that seen in high inclination black hole transients and the previously reported detection of X-ray dips. The two epochs observed during the initial hard state exhibited asymmetric emission line profiles, including a P-Cygni profile simultaneously detected in H and He i 6678, which indicates the presence of an optical wind in the system. The remaining spectra, obtained during the transition to the soft state and the subsequent decay, are instead characterized by narrower, double peaked emission lines embedded into broad absorption components. One epoch (intermediate state) also includes near-infrared coverage, revealing complex line profiles in the Paschen and Bracket series, which suggests that the outflow is still present during the outburst decay through the soft state. The growing list of low-mass X-ray binaries with optical and near-infrared outflow signatures indicates that these are common features. Furthermore, the lowest luminosity spectrum exhibits an H full-width-at-half-maximum of . This, together with previous constraints on the binary parameters, allows us to favor a compact object mass of , further supporting its black hole nature.
1 Introduction
Low-mass X-ray binaries (LMXBs) consist of either a neutron star or a black hole (BH) accreting matter from a Roche-Lobe filling stellar companion () via an accretion disk. The majority of LMXBs are transient systems that spend most of their lives in a faint, quiescent state (), but exhibit short-lived outbursts with heavily enhanced emission (). More than 60 LMXBs are thought to harbor a BH, with only 21 of them confirmed by dynamical studies (for a review see Casares & Jonker 2014; Corral-Santana et al. 2016; also Mata Sánchez et al. 2015; Torres et al. 2021).
During outburst, BH transients show two characteristic X-ray states, hard and soft, as well as outflows in the form of jets and winds (e.g. Fender et al. 2004; Fender & Muñoz-Darias 2016). In particular, accretion disk winds were initially discovered in X-rays as blue-shifted absorptions in transitions of highly ionized species (e.g. Ueda et al. 1998; Miller et al. 2006). These typically appear during the soft state, and are solely detected in high inclination systems (Neilsen & Lee, 2009; Ponti et al., 2012; Díaz Trigo & Boirin, 2016). In the optical range, lower ionization winds have been found in a number of BH transients over the last few years. These are detected as P-Cygni profiles, absorption troughs and broad emission line wings in reference lines such as H and He i (e.g. Muñoz-Darias et al. 2016, 2019).
MAXI J1803298 (hereafter J1803) is a BH candidate discovered on May 1st 2021 (Serino et al., 2021). During a 7-month long outburst, it followed the classic X-ray evolution, with hard and soft states. The detection of periodic dips (lasting ) during the initial stages of the outburst indicates a high orbital inclination and likely orbital period of (Gendreau et al., 2012; Xu & Harrison, 2021). Interestingly, preliminary reports suggested the presence of wind-related features in both the X-ray and optical spectra of the source (Miller & Reynolds, 2021; Buckley et al., 2021).
In this work, we present multi-epoch optical and near-infrared spectroscopic observations of J1803, together with an X-ray monitoring of the outburst.
| Epoch | Date | TSTa | Grism/slit | R | # | Seeingc | g-band | r-band | X-ray stated | FWHMe | |
|---|---|---|---|---|---|---|---|---|---|---|---|
| (dd/mm) | (d) | (/″) | (s) | (″) | (mag) | (mag) | () | ||||
| GTC-1 | 03/05 | 2.179 | R1000B/1.0 | 833 | 8 | 300 | 1.7 | Hard | |||
| GTC-2 | 05/05 | 4.189 | R2500R/1.0 | 2143 | 6 | 450 | 1.6 | Hard | |||
| GTC-3 | 07/05 | 6.194 | R2500R/1.0 | 2143 | 4 | 600 | 1.1 | Hard/HIMS | |||
| GTC-4 | 09/05 | 8.182 | R2500R/1.0 | 2143 | 4 | 600 | 1.1 | Hard/HIMS | |||
| GTC-5 | 15/05 | 14.137 | R2500R/1.0 | 2143 | 6 | 450 | 3.4 | HIMS | |||
| VLT-1 | 15/05 | 14.264 | UVB/1.0 | 5400 | 1 | 581 | 0.82 | HIMS | |||
| VIS/0.9 | 8900 | 1 | 554 | ||||||||
| NIR/0.9 | 5600 | 4 | |||||||||
| GTC-6 | 16/05 | 15.119 | R2500R/1.0 | 2143 | 6 | 450 | 2.0 | HIMS | |||
| GTC-7 | 22/05 | 21.178 | R2500R/1.0 | 2143 | 4 | 600 | 1.9 | SIMS | |||
| GTC-8 | 02/06 | 32.153 | R2500R/1.0 | 2143 | 4 | 600 | 1.7 | Soft | |||
| GTC-9 | 16/06 | 46.053 | R2500R/1.0 | 2143 | 4 | 600 | 1.2 | Soft | |||
| GTC-10 | 02/07 | 62.050 | R2500R/1.0 | 2143 | 4 | 600 | 1.6 | Soft | |||
| GTC-11 | 02/08 | 93.943 | R2500R/1.0 | 2143 | 9 | 600 | 1.4 | Soft |
Note. — a) TST stands for “time since trigger”, defined as the mid-exposure MJD from the average spectrum of each epoch referred to the outburst detection trigger (). b) The exposure time corresponds to the individual exposures within each epoch. c) The seeing value was measured on the g-band acquisition images from each GTC epoch, except for GTC-9, where only r-band acquisition images were available. The seeing value for VLT-1 observations corresponds to the measured image quality. d) The X-ray state associated with each observation was classified attending to the hardness intensity diagram (Fig. 1) and the QPOs detection. e) Full-width-at-half-maximum of a Gaussian fit to the line, as described in Sec.3
2 Observations
The spectroscopic database covers twelve different epochs across the outburst. A standard reduction of the available acquisition images allowed us to derive contemporaneous photometry, which we report as part of the observing log (Table 1).
We obtained 11 epochs (59 spectra) with the 10.4-m Gran Telescopio Canarias (GTC) at the Roque de los Muchachos Observatory (La Palma, Spain), equipped with the Optical System for Imaging and low-Intermediate-Resolution Integrated Spectroscopy (OSIRIS, Cepa et al. 2000). All observations used a slit width. The R1000B grism ( and coverage) was used during the first epoch, and the R2500R grism ( and coverage) for the remaining observations. We reduced the spectra following standard procedures making use of semi-automatic routines based on iraf111IRAF is distributed by the National Optical Astronomy Observatories, operated by the Association of Universities for Research in Astronomy, Inc., under contract with the National Science Foundation. (via pyraf, the python implementation maintained by the community) and molly222MOLLY software developed by T. R. Marsh. tasks.
An additional epoch was observed with the Very Large Telescope (VLT; Paranal Observatory, Chile) equipped with the spectrograph X-Shooter (Vernet et al., 2011). We employed slit widths of , and for the UVB, VIS and NIR arms, which produced spectral resolutions of , and , respectively. The reduction was performed with the latest available version of the official pipeline, and allowed us to obtain a single spectrum covering the wavelength range of .
3 Analysis and Results
3.1 Hardness Intensity Diagram
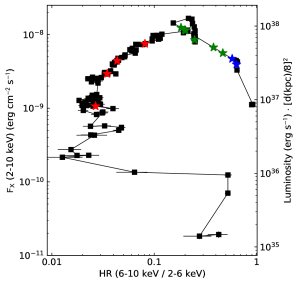
In order to determine the X-ray state of J1803 during the optical observations, we analyzed the publicly available data from the NICER instrument (Neutron star Interior Composition Explorer; Gendreau et al. 2012), following a standard prescription for the data reduction333https://heasarc.gsfc.nasa.gov/docs/nicer/analysis_threads/ (see e.g., Cúneo et al. 2020a). We carried out a phenomenological fit of the observations between days MJD 59336 and MJD 59511 in XSPEC (v.12.12.0, Arnaud 1996) using a multicolor disk (DISKBB; Mitsuda et al. 1984) plus a Comptonization component (NTHCOMP; Zdziarski et al. 1996, Zycki et al. 1999). We used the Tuebingen–Boulder interstellar medium absorption model (TBABS in XSPEC) with cross-sections of Verner et al. (1996) and abundances of Wilms et al. (2000) to account for interstellar absorption. We assumed an equivalent hydrogen column of (Bult et al., 2021). From the fits, we derived fluxes in the keV and keV energy bands to construct the hardness intensity diagram (HID; Homan et al. 2001). This allows for a direct comparison with the BH sample presented in Muñoz-Darias et al. (2013). Since the distance is unknown, we assumed a standard value of 8 kpc to compute the X-ray luminosity in Fig. 1. We note that a detailed X-ray study of the NICER data is beyond the scope of this Letter.
The resulting HID (Fig. 1) shows a q-shaped hysteresis pattern, a behavior typically seen in BH (e.g. Fender et al. 2004) and neutron star (Muñoz-Darias et al., 2014) LMXBs. The HID has triangular shape as well as a spike during the hard-to-soft transition (a.k.a. plume), both distinctive features of high-inclination BH transients (Muñoz-Darias et al. 2013). This is in agreement with the detection of strong X-ray dips, which imply (Frank et al., 1987). We note that the hardness value reached during the soft state is similar to that shown by some mid-to-low inclination BHs in Muñoz-Darias et al. (2013). However, the latter study uses RXTE data, whose high-energy coverage (10 keV) and sensitivity enables an accurate modelling of the Comptonization component. This is not the case for the soft state observations used here, whose hard X-ray band fluxes are most likely underestimated due to NICER lower sensitivity at high energies. Thus, the actual value of the X-ray color during the soft state has to be taken with caution.
Fig. 1 shows the location of the spectroscopic epochs in the HID. GTC-1 and GTC-2 (see Table 1) were obtained during the raise of the outburst in the hard state. Epochs GTC-3 to GTC-6 (including VLT-1) were obtained during either the bright hard state or the hard-intermediate state (HIMS), as shown by the detection of type-C quasi-periodic oscillations (QPOs; Xu & Harrison 2021; Chand et al. 2021). The discovery of type-B QPOs coincident with epoch GTC-7 (Ubach et al., 2021) is a defining trait of a soft-intermediate state (SIMS, e.g. Belloni et al. 2011). The remaining spectra correspond to the soft state.
3.2 Evolution of the optical spectra
We normalized the spectra to their continuum level. We used different masks (in order to avoid emission and telluric lines), explored a range of polynomial orders, and normalized both the full spectra and the particular regions of interest separately. While these resulted in a reliable normalization (see e.g. Fig. 2, 3), we note that the continuum shape was not smooth. The presence of relatively deep, known diffuse interstellar bands (DIBs, such as ) and other unidentified features hampered a better characterization of the spectral continuum, although we stress that this has no impact on the results on this paper.
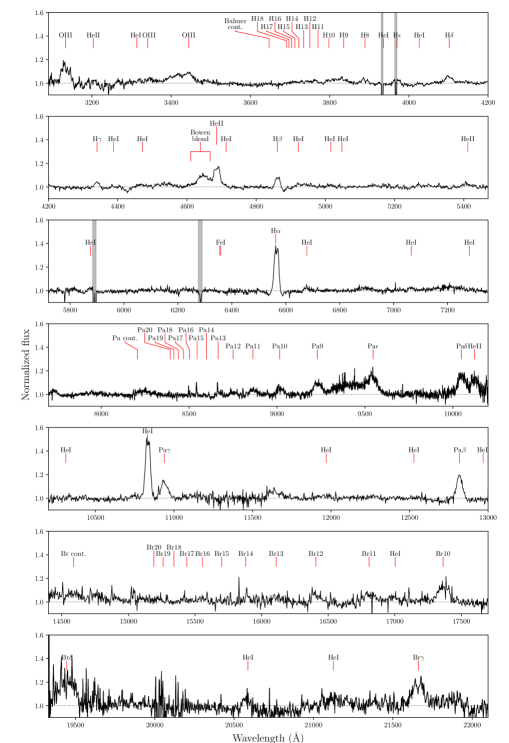
The VLT-1 spectrum covers the widest wavelength range, from near-ultraviolet to the near-infrared (Fig. 2). We identify hydrogen emission lines corresponding to the Balmer, Paschen and Bracket series. He i and ii transitions are also detected in emission, with the strongest examples at and , respectively. Additionally, high excitation lines produced by fluorescence, such as the Bowen blend (composed of a mixture of C, O and N lines), are also identified.
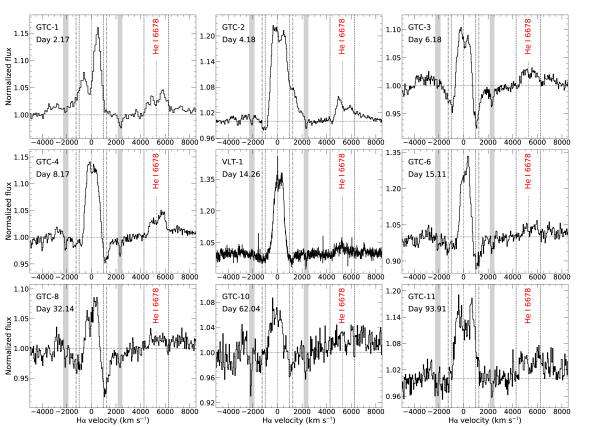
The GTC spectra, while covering a more limited wavelength range, allow us instead to analyze the evolution of line profiles during the outburst. In particular, we focus our analysis on H, a reference line present during the whole event, and also discuss the profile of the adjacent He i line when detected. In order to provide quantitative results on the profile variability, we perform a multi-Gaussian fit to H. We fit to each spectrum two emission Gaussians of the same width (), with variable heights ( and ) and centroid positions, which are conveniently defined in terms of the peak-to-peak separation (DP) and the centroid of the double-peaked structure (). Due to the appearance of broad, absorption components during certain epochs, we also included when necessary a third Gaussian in absorption. All reported uncertainties correspond to a statistical value.
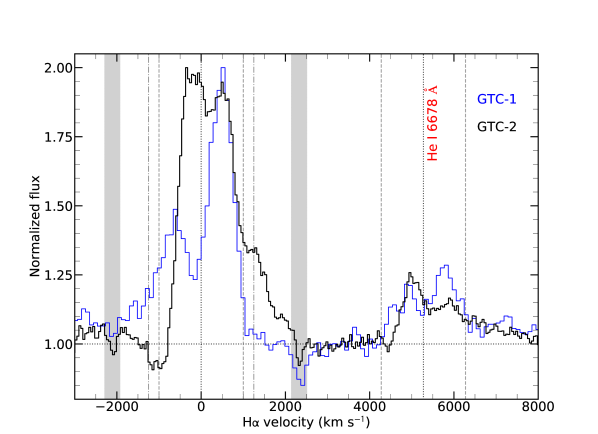
We find dramatic changes in the H profile across the outburst event (Fig. 3), being the most remarkable examples those observed during the hard state (GTC-1 and GTC-2). In GTC-1 the profile is double-peaked with the red peak clearly stronger by a factor 2. The profile also shows a broad, blue wing extending down to , while the red peak reaches the continuum level much more abruptly (). The observed peak-to-peak separation is , and the profile is blue-shifted, with the centroid at . During GTC-2, the profile shows an opposite behavior: the double peak is symmetric, while the peak-to-peak separation has significantly shrunk to , and the center of the 2-Gaussian structure is now red-shifted at . The striking difference between the two profiles is even clearer when we plot both epochs together (Fig. 4). The two red peaks match each other, but the inter-peak depression on GTC-1 coincides with the blue peak in GTC-2. A P-Cygni profile dipping below the continuum level is also shown in GTC-2, with velocities of and for the core and its blue-edge velocity, respectively. The red wing extends now to . A weaker blue-shifted absorption is also observed in the nearby He i line, albeit with a slightly lower blue-edge velocity of .
Epochs GTC-3 to GTC-10, including VLT-1, show double-peaked profiles with peak-to-peak separation () and centroid () closer to that exhibited in GTC-2. They also show a broad absorption, where the emission line is embedded, and whose depth varies between epochs (with the deepest example being GTC-3, reaching below the continuum level), but always constrained within . Similar broad absorptions have been previously observed in a handful of LMXBs (e.g., MAXI J1807132; Jiménez-Ibarra et al. 2019a), but their origin is not well understood yet. Dubus et al. (2001) proposed they are produced in optically thick regions of the disc, mimicking the behavior of a stellar atmosphere. However, this scenario favors the observation of such features in low-inclination systems, which is at odds with their detection in relatively high inclination LMXBs such as XTE J1118+480 (Khargharia et al., 2013), and now J1803. The relative intensity of the red and blue emission peaks is also variable, partly due to the changing depth of the underlying broad absorption, but their height ratio () is never comparable to that seen in GTC-1 (). The base of the emission component is restricted to the range across all epochs, again remarking the striking difference with GTC-1 and GTC-2.
The latest epoch (GTC-11), taken three months after the outburst peak, shows a symmetric profile with larger double peak separation than in previous observations () but not as large as that observed in GTC-1. While this is still a soft state spectrum, the profile is broader than those observed at higher luminosity and similar to typical LMXB quiescent profiles. No obvious absorption component is present at this time.
4 Discussion
J1803 has shown X-ray dipping phenomenology (Xu & Harrison, 2021) similar to that found in other LMXBs (e.g. MAXI J1305704, Shidatsu et al. 2013). Such features are observed in high-inclination systems, a scenario further confirmed by the shape of the HID diagram presented in this paper. The periodicity of the dips serves as a good proxy for the true orbital period of the system. Therefore, we will hereafter consider , as well as a conservative lower limit on the orbital inclination of .
4.1 Optical accretion disk winds
To date, up to six LMXBs have been found to exhibit P-Cygni profiles in their near-infrared and/or optical spectra: GX 131 (Bandyopadhyay et al., 1997), V404 Cyg (Casares et al., 1991; Muñoz-Darias et al., 2016, 2017; Mata Sánchez et al., 2018), V4641 Sgr (Muñoz-Darias et al., 2018), Swift J1858.60814 (Muñoz-Darias et al., 2020), MAXI J1820070 (Muñoz-Darias et al., 2019) and GRS 1716249 (Cúneo et al., 2020b). Our spectroscopy of J1803 showed P-Cygni profiles during GTC-2 in two emission lines (H and He i ). The P-Cygni profiles have (blue-edge) terminal velocities of , which falls within the typical range observed in other LMXBs (). The detection of these optical wind features in J1803, a BH with a proposed orbital period as low as (Xu & Harrison, 2021), shows that these can develop over a wide range of accretion disk sizes (see e.g. Muñoz-Darias et al. 2020).
Another significant feature traditionally associated with outflows is the presence of broad emission wings. These have been previously observed in a handful of LMXBs, sometimes simultaneously with the P-Cygni profiles (e.g. Mata Sánchez et al. 2018). They appear as either symmetric, broad wings, typically detected after a bright flare and accompanied by an enhanced Balmer decrement (Muñoz-Darias et al., 2016; Mata Sánchez et al., 2018); or as a non-symmetric blue-shifted emission wing (e.g., MAXI J1820070; Sánchez-Sierras & Muñoz-Darias 2020). Regarding J1803, the most promising example is shown by the GTC-1 spectrum, with a blue wing extending to , similar in absolute value to the red-wing of the GTC-2 P-Cygni spectrum. The H profile in GTC-1 is particularly unusual, as proven by its large full-width-at-half-maximum (FWHM) and , as well as its asymmetry. A possible interpretation involves the presence of a strong, blue-shifted absorption at low velocity () which cancels the blue-peak, thus producing the observed profile. Low-velocity P-Cygni profiles are intrinsically harder to identify, as they produce a dent on the broad emission from the accretion disk rather than a clear dip below the continuum. The combination of all these features in the GTC-1 J1803 spectrum leads us to conclude that outflows are present since the onset of the outburst, consistent with preliminary reports by Buckley et al. (2021).
Finally, other possible outflow signatures include blue-shifted absorption components during optical dips (e.g., Swift J1357.20933; Jiménez-Ibarra et al. 2019b), broad wing emission components only detected at the end of the outburst (e.g. Rahoui et al. 2014; Panizo-Espinar et al. 2021) and complex profiles such as flat-top or triangular profiles (MAXI J1820070; Sánchez-Sierras & Muñoz-Darias 2020). In this regard, VLT-1 reveals flat-top and triangular profile shapes in near-infrared lines such as Pa or Pa (saw-tooth profile), but also flat-top lines like He ii or Pa9. This leads us to propose that outflows are also present during the soft state, and are preferentially traced by the near-infrared spectrum. A similar conclusion was derived from the study of MAXI J1820070 (Sánchez-Sierras & Muñoz-Darias, 2020). They suggested that this is likely the result of ionization effects rather than intrinsic changes in the outflow rate or geometry.
4.2 On the nature of the compact object
J1803 has been considered as a candidate to harbor a BH attending to the displayed X-ray properties during the outburst. However, only dynamical studies of the source during quiescence enable the determination of the compact object mass, thus confirming its nature. On this regard, Casares (2015) introduced a new method to determine the companion star radial velocity semi-amplitude () from a scaling with the FWHM of the H emission line. Nevertheless, this correlation only holds for spectra obtained during true quiescence, a state occurring from months to years after the outburst (see e.g., Casares 2015). While the study of this parameter during the earlier stages of the event is hampered by the complexity of the profiles (i.e., due to the presence of outflows), soft-state spectra are expected to evolve smoothly towards the quiescence level, as the disk shrinks to its original size.
The H line during the J1803 outburst does indeed show significant variability in FWHM between , an expected behavior as the accretion disk expands. On this regard, our latest observed spectrum (GTC-11, 3 months after the outburst onset) shows the largest , favoring this interpretation for J1803. In an attempt to assess the true quiescence FWHM from the aforementioned value, we inspected the literature to assess typical quiescence to outburst correction ratios (/). We note that larger corrections are required if hard-state or early soft-state epochs are considered, due to a combination of a smaller accretion disk and the influence of outflows. For this reason, we focused on optical spectra at low X-ray luminosity and as late in the event as possible (such as our J1803 GTC-11 epoch). We found the best comparison with the recent outburst of MAXI J1820070, a high-inclination transient BH for which we take (Torres et al., 2020) and a range of , from measurements in Muñoz-Darias et al. (2019) outburst spectra of (epoch 32) and (epoch 33). This corresponds to a conservative range of , consistent with that observed in other transient BHs, e.g. for Swift J1357.20933 (Torres et al., 2015), and for V404 Cyg (Mata Sánchez et al., 2018).
We use the above estimate to construct a uniform distribution of to be combined with a normal distribution for the measured , yielding at the () confidence level. Following Casares (2015), we derive . This, together with , yields a lower limit to the mass of the compact object of , providing further support to its BH nature. In addition, by considering the constraints on the orbital inclination () and assuming a typical range for the binary mass ratio () we obtain . This mass range is consistent with that of the known population of BHs in LMXBs (Casares & Jonker, 2014).
5 Conclusions
We presented a multi-wavelength follow-up of the discovery outburst of the BH candidate MAXI J1803298. We detected P-Cygni profiles in H and He i lines, with a terminal velocity of . We also detected a particularly broad emission line blue wing, together with an apparent peak-to-peak separation much larger than observed during the rest of the outburst. All these features are seen during the initial hard state, indicating the presence of a wind-type outflow during this stage of the outburst. The soft-state spectra are instead characterized by narrower emission lines embedded into broad absorption components. On the other hand, the near-infrared emission lines show more complex profiles, that can also be tentatively associated with outflows. Finally, we provide further support for the identification of the compact object in J1803 as a BH, and propose a mass range of .
References
- Arnaud (1996) Arnaud, K. A. 1996, in Astronomical Society of the Pacific Conference Series, Vol. 101, Astronomical Data Analysis Software and Systems V, ed. G. H. Jacoby & J. Barnes, 17
- Astropy Collaboration et al. (2013) Astropy Collaboration, Robitaille, T. P., Tollerud, E. J., et al. 2013, A&A, 558, A33, doi: 10.1051/0004-6361/201322068
- Bandyopadhyay et al. (1997) Bandyopadhyay, R., Shahbaz, T., Charles, P. A., van Kerkwijk, M. H., & Naylor, T. 1997, MNRAS, 285, 718, doi: 10.1093/mnras/285.4.718
- Belloni et al. (2011) Belloni, T. M., Motta, S. E., & Muñoz-Darias, T. 2011, Bulletin of the Astronomical Society of India, 39, 409. https://arxiv.org/abs/1109.3388
- Buckley et al. (2021) Buckley, D. A. H., Brink, J., Charles, P. A., & Groenewald, D. 2021, The Astronomer’s Telegram, 14597, 1
- Bult et al. (2021) Bult, P. M., Gendreau, K. C., Enoto, T., et al. 2021, The Astronomer’s Telegram, 14602, 1
- Casares (2015) Casares, J. 2015, ApJ, 808, 80, doi: 10.1088/0004-637X/808/1/80
- Casares et al. (1991) Casares, J., Charles, P. A., Jones, D. H. P., Rutten, R. G. M., & Callanan, P. J. 1991, MNRAS, 250, 712, doi: 10.1093/mnras/250.4.712
- Casares & Jonker (2014) Casares, J., & Jonker, P. G. 2014, Space Sci. Rev., 183, 223, doi: 10.1007/s11214-013-0030-6
- Cepa et al. (2000) Cepa, J., Aguiar, M., Escalera, V. G., et al. 2000, in Society of Photo-Optical Instrumentation Engineers (SPIE) Conference Series, Vol. 4008, Optical and IR Telescope Instrumentation and Detectors, ed. M. Iye & A. F. Moorwood, 623–631, doi: 10.1117/12.395520
- Chand et al. (2021) Chand, S., Dewangan, G. C., Thakur, P., Tripathi, P., & Agrawal, V. K. 2021, The Astronomer’s Telegram, 14630, 1
- Corral-Santana et al. (2016) Corral-Santana, J. M., Casares, J., Muñoz-Darias, T., et al. 2016, A&A, 587, A61, doi: 10.1051/0004-6361/201527130
- Cúneo et al. (2020a) Cúneo, V. A., Alabarta, K., Zhang, L., et al. 2020a, MNRAS, 496, 1001, doi: 10.1093/mnras/staa1606
- Cúneo et al. (2020b) Cúneo, V. A., Muñoz-Darias, T., Sánchez-Sierras, J., et al. 2020b, MNRAS, 498, 25, doi: 10.1093/mnras/staa2241
- Díaz Trigo & Boirin (2016) Díaz Trigo, M., & Boirin, L. 2016, Astronomische Nachrichten, 337, 368, doi: 10.1002/asna.201612315
- Dubus et al. (2001) Dubus, G., Kim, R. S. J., Menou, K., Szkody, P., & Bowen, D. V. 2001, ApJ, 553, 307, doi: 10.1086/320648
- Fender & Muñoz-Darias (2016) Fender, R., & Muñoz-Darias, T. 2016, The Balance of Power: Accretion and Feedback in Stellar Mass Black Holes, ed. F. Haardt, V. Gorini, U. Moschella, A. Treves, & M. Colpi, Vol. 905, 65, doi: 10.1007/978-3-319-19416-5_3
- Fender et al. (2004) Fender, R. P., Belloni, T. M., & Gallo, E. 2004, MNRAS, 355, 1105, doi: 10.1111/j.1365-2966.2004.08384.x
- Frank et al. (1987) Frank, J., King, A. R., & Lasota, J. P. 1987, A&A, 178, 137
- Gendreau et al. (2012) Gendreau, K. C., Arzoumanian, Z., & Okajima, T. 2012, in Society of Photo-Optical Instrumentation Engineers (SPIE) Conference Series, Vol. 8443, Space Telescopes and Instrumentation 2012: Ultraviolet to Gamma Ray, ed. T. Takahashi, S. S. Murray, & J.-W. A. den Herder, 844313, doi: 10.1117/12.926396
- Homan et al. (2001) Homan, J., Wijnands, R., van der Klis, M., et al. 2001, ApJS, 132, 377, doi: 10.1086/318954
- Jiménez-Ibarra et al. (2019a) Jiménez-Ibarra, F., Muñoz-Darias, T., Casares, J., Armas Padilla, M., & Corral-Santana, J. M. 2019a, MNRAS, 489, 3420, doi: 10.1093/mnras/stz2393
- Jiménez-Ibarra et al. (2019b) Jiménez-Ibarra, F., Muñoz-Darias, T., Armas Padilla, M., et al. 2019b, MNRAS, 484, 2078, doi: 10.1093/mnras/sty3457
- Khargharia et al. (2013) Khargharia, J., Froning, C. S., Robinson, E. L., & Gelino, D. M. 2013, AJ, 145, 21, doi: 10.1088/0004-6256/145/1/21
- Mata Sánchez et al. (2015) Mata Sánchez, D., Muñoz-Darias, T., Casares, J., Corral-Santana, J. M., & Shahbaz, T. 2015, MNRAS, 454, 2199, doi: 10.1093/mnras/stv2111
- Mata Sánchez et al. (2018) Mata Sánchez, D., Muñoz-Darias, T., Casares, J., et al. 2018, MNRAS, 481, 2646, doi: 10.1093/mnras/sty2402
- Miller et al. (2006) Miller, J. M., Raymond, J., Fabian, A., et al. 2006, Nature, 441, 953, doi: 10.1038/nature04912
- Miller & Reynolds (2021) Miller, J. M., & Reynolds, M. T. 2021, The Astronomer’s Telegram, 14650, 1
- Mitsuda et al. (1984) Mitsuda, K., Inoue, H., Koyama, K., et al. 1984, Publications of the Astronomical Society of Japan, 36, 741. http://adsabs.harvard.edu/abs/1984PASJ...36..741M
- Muñoz-Darias et al. (2013) Muñoz-Darias, T., Coriat, M., Plant, D. S., et al. 2013, MNRAS, 432, 1330, doi: 10.1093/mnras/stt546
- Muñoz-Darias et al. (2014) Muñoz-Darias, T., Fender, R. P., Motta, S. E., & Belloni, T. M. 2014, MNRAS, 443, 3270, doi: 10.1093/mnras/stu1334
- Muñoz-Darias et al. (2018) Muñoz-Darias, T., Torres, M. A. P., & Garcia, M. R. 2018, MNRAS, 479, 3987, doi: 10.1093/mnras/sty1711
- Muñoz-Darias et al. (2016) Muñoz-Darias, T., Casares, J., Mata Sánchez, D., et al. 2016, Nature, 534, 75, doi: 10.1038/nature17446
- Muñoz-Darias et al. (2017) —. 2017, MNRAS, 465, L124, doi: 10.1093/mnrasl/slw222
- Muñoz-Darias et al. (2019) Muñoz-Darias, T., Jiménez-Ibarra, F., Panizo-Espinar, G., et al. 2019, ApJ, 879, L4, doi: 10.3847/2041-8213/ab2768
- Muñoz-Darias et al. (2020) Muñoz-Darias, T., Armas Padilla, M., Jiménez-Ibarra, F., et al. 2020, ApJ, 893, L19, doi: 10.3847/2041-8213/ab8381
- Neilsen & Lee (2009) Neilsen, J., & Lee, J. C. 2009, Nature, 458, 481, doi: 10.1038/nature07680
- Panizo-Espinar et al. (2021) Panizo-Espinar, G., Muñoz-Darias, T., Armas Padilla, M., et al. 2021, A&A, 650, A135, doi: 10.1051/0004-6361/202140323
- Ponti et al. (2012) Ponti, G., Fender, R. P., Begelman, M. C., et al. 2012, MNRAS, 422, L11, doi: 10.1111/j.1745-3933.2012.01224.x
- Rahoui et al. (2014) Rahoui, F., Coriat, M., & Lee, J. C. 2014, MNRAS, 442, 1610, doi: 10.1093/mnras/stu977
- Sánchez-Sierras & Muñoz-Darias (2020) Sánchez-Sierras, J., & Muñoz-Darias, T. 2020, A&A, 640, L3, doi: 10.1051/0004-6361/202038406
- Serino et al. (2021) Serino, M., Negoro, H., Nakajima, M., et al. 2021, The Astronomer’s Telegram, 14587, 1
- Shidatsu et al. (2013) Shidatsu, M., Ueda, Y., Nakahira, S., et al. 2013, ApJ, 779, 26, doi: 10.1088/0004-637X/779/1/26
- Tody (1986) Tody, D. 1986, in Society of Photo-Optical Instrumentation Engineers (SPIE) Conference Series, Vol. 627, Instrumentation in astronomy VI, ed. D. L. Crawford, 733, doi: 10.1117/12.968154
- Torres et al. (2020) Torres, M. A. P., Casares, J., Jiménez-Ibarra, F., et al. 2020, ApJ, 893, L37, doi: 10.3847/2041-8213/ab863a
- Torres et al. (2021) Torres, M. A. P., Jonker, P. G., Casares, J., Miller-Jones, J. C. A., & Steeghs, D. 2021, MNRAS, 501, 2174, doi: 10.1093/mnras/staa3786
- Torres et al. (2015) Torres, M. A. P., Jonker, P. G., Miller-Jones, J. C. A., et al. 2015, MNRAS, 450, 4292, doi: 10.1093/mnras/stv720
- Ubach et al. (2021) Ubach, S., Steiner, J., Homan, J., et al. 2021, The Astronomer’s Telegram, 14660, 1
- Ueda et al. (1998) Ueda, Y., Inoue, H., Tanaka, Y., et al. 1998, ApJ, 492, 782, doi: 10.1086/305063
- Verner et al. (1996) Verner, D. A., Ferland, G. J., Korista, K. T., & Yakovlev, D. G. 1996, ApJ, 465, 487, doi: 10.1086/177435
- Vernet et al. (2011) Vernet, J., Dekker, H., D’Odorico, S., et al. 2011, A&A, 536, A105, doi: 10.1051/0004-6361/201117752
- Wilms et al. (2000) Wilms, J., Allen, A., & McCray, R. 2000, ApJ, 542, 914, doi: 10.1086/317016
- Xu & Harrison (2021) Xu, Y., & Harrison, F. 2021, The Astronomer’s Telegram, 14609, 1
- Zdziarski et al. (1996) Zdziarski, A. A., Johnson, W. N., & Magdziarz, P. 1996, MNRAS, 283, 193
- Zycki et al. (1999) Zycki, P. T., Done, C., & Smith, D. A. 1999, MNRAS, 309, 561, doi: 10.1046/j.1365-8711.1999.02885.x