Spectroscopic orbits of subsystems in multiple stars. VIII.
Abstract
Periods, eccentricities, and masses in hierarchical stellar systems inform us on the formation and early evolution of these fascinating objects. To complement the multiplicity statistics of nearby solar-type stars, 19 new spectroscopic orbits of inner subsystems in 15 hierarchies (10 triples and 5 quadruples) are determined based on high-resolution echelle spectra collected during several years. While previous papers of this series contained mostly short-period orbits, here most periods are on the order of a year. The main components of these hierarchies are HIP 7852, 9148, 12548, 21079, 24320, 27970, 34212, 56282, 57860, 76400, 76816, 81394, 96284, 100420, and HD 108938. Noteworthy systems are HIP 12548 and 24230 (hierarchies of 2+2 architecture with low-mass spectroscopic secondaries), HIP 56282 (a planetary-type 3+1 hierarchy), and HIP 27970 (a compact triple with periods of 15 and 1049 days).
1 Introduction
Observations of spectroscopic subsystems in nearby solar-type stars are motivated by the desire to determine their periods and mass ratios, complementing statistics of hierachies in the solar neighborhood (Tokovinin, 2014). Many subsystems discovered by, e.g. Nordström et al. (2004), lack orbits and therefore confuse the statistics. This paper presents results of the long-term program conducted at the 1.5 m telescope at Cerro Tololo with the CHIRON high-resolution optical echelle spectrograph. Previous publications of this series (Tokovinin, 2016a, b; Tokovinin et al., 2018; Tokovinin, 2018a, b, 2019a, 2020a, 2019b, 2020b) focused primarily on the short-period subsystems. Continued accumulation of the spectra allows calculation of orbits with periods on the order of a year presented here. Knowledge of these orbits adds missing parameters of the nearby hierarchies and contributes to the collection of such data in the Multiple Star Catalog (MSC, Tokovinin, 2018c).
| WDS | Comp. | HIP | HD | Spectral | RV | aaProper motions and parallaxes are from Gaia EDR3 (Gaia Collaboration et al., 2021). Colons mark parallaxes biased by subsystems, in which case the PMs are from Brandt (2018). | ||||
|---|---|---|---|---|---|---|---|---|---|---|
| (J2000) | type | (mag) | (mag) | (mas yr-1) | (km s-1) | (mas) | ||||
| 014100524 | A | 7852 | 10353 | G5V | 8.48 | 1.69 | 69 | 27 | 0.7 | 19.44: |
| B | … | … | K5 | 11.84 | 3.46 | 69 | 26 | 0.4 | 22.03 | |
| 015792851 | A | 9148 | 12068 | G3V | 8.27 | 1.67 | 212 | 57 | 23.2 | 12.45: |
| B | … | … | M: | 13.07 | 3.18 | 212 | 57 | 23.5 | 11.24 | |
| 024157128 | AB | 12548 | 17215 | G6V | 7.82 | 1.76 | 158 | 61 | 45.1 | 18.6:bb Hipparcos parallax (van Leeuwen, 2007). |
| 043114522 | AB | 21079 | 28904 | G3V | 8.29 | 1.71 | 50 | 17 | 3.5 | 21.87: |
| 051315959 | A | 24320 | 34377 | G5V | 8.87 | 1.73 | 30 | 126 | 16.1 | 15.87: |
| B | … | … | … | 10.13 | 2.55 | 19 | 125 | 16.5 | 16.43: | |
| 055501256 | A | 27970 | 39899 | F7V | 7.73 | 1.28 | 23 | 42 | 12.0 | 15.78: |
| 070567116 | A | 34212 | 55197 | F8V | 7.66 | 1.30 | 5 | 267 | 52.1 | 14.39: |
| B | … | … | … | 16.91 | 5.24 | 5 | 270 | … | 16.55 | |
| 113230025 | A | 56282 | 100269 | F8V | 8.09 | 1.35 | 43 | 161 | 8.3 | 15.13: |
| B | … | … | … | 16.23 | 5.15 | 41 | 162 | … | 16.28 | |
| 115204357 | A | 57860 | 103076 | G5V | 9.02 | 1.64 | 20 | 21 | 38.5 | 12.09 |
| B | … | … | … | 9.27 | … | 24 | 25 | 36.4 | 12.31 | |
| 123145659 | AB | … | 108938 | G8V | 8.98 | 2.17 | 45 | 7 | 39.0 | 6.35 |
| 153620623 | A | 76400 | 139059 | G6V | 7.90 | 1.62 | 103 | 179 | 7.3 | 15.28: |
| B | … | … | … | 17.82 | 5.81 | 99 | 174 | … | 15.29 | |
| 154101449 | A | 76816 | 139864 | F8V | 9.47 | 1.62 | 26 | 1 | 39.2 | 3.25 |
| B | … | … | … | 9.74 | 2.50 | 25 | 2 | 40.3 | 3.32 | |
| 163746133 | A | 81394 | 149261 | F5 | 8.54 | 1.28 | 11 | 17 | 15.3 | 5.02 |
| B | 81395 | 149262 | F2 | 9.22 | 1.17 | 11 | 17 | 14.1 | 4.96 | |
| 195835154 | A | 98294 | 188557 | A9IV | 7.40 | 0.54 | 46 | 44 | 5.0 | 10.41 |
| B | 98278 | 188534 | F6V | 8.17 | 1.18 | 46 | 43 | 6.3 | 10.49 | |
| 202183654 | A | 100420 | … | F6V | 8.31 | 0.94 | 2 | 16 | 49.1 | 5.61: |
| B | … | 193465 | … | 9.60 | 1.29 | 2 | 18 | 49.1 | 5.65 | |
The hierarchical systems studied here are listed in Table 1. The data are collected from Simbad and Gaia (Gaia Collaboration et al., 2021, hereafter EDR3), the radial velocities (RVs) are mostly determined in this work. The first column gives the Washington Double Star (WDS, Mason et al., 2001) code based on the J2000 coordinates. The HIP and HD identifiers, spectral types, photometric and astrometric data refer either to the individual stars or to the unresolved subsystems. Parallaxes potentially biased by unresolved subsystems are marked by colons.
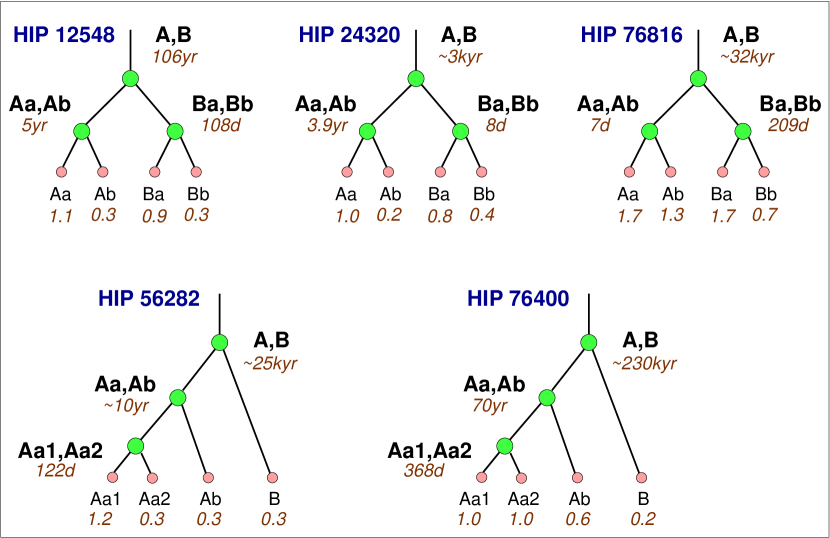
This paper is organized similarly to the previous ones. The data and methods are briefly outlined in section 2, where the orbital elements are also given. Then each multiple system is discussed in section 3. Figure 1 illustrates the architecture of quadruple systems (triples are obvious and do not need illustration). The paper closes with discussion of the results in section 4.
2 Observations and Data Analysis
2.1 Spectroscopic Observations
The spectra used here were taken with the 1.5 m telescope sited at the Cerro Tololo Inter-American Observatory (CTIO) in Chile and operated by the Small and Medium Aperture Telescopes Research System (SMARTS) Consortium. Fifteen hours of observing time were allocated to this program per semester. Observations were made with the fiber-fed CHIRON optical echelle spectrograph (Tokovinin et al., 2013; Paredes et al., 2021) by the telescope operators in service mode. The spectra taken with the image slicer have a resolution of 85,000. They are reduced by the standard CHIRON pipeline. The wavelength calibration is based on the thorium-argon lamp spectra taken after each object.
The RVs are determined from Gaussian fits to the cross-correlation function (CCF) of echelle orders with the binary mask based on the solar spectrum, as detailed in Tokovinin (2016a). The RVs derived by this method rely on the instrument wavelength calibration and should be on the absolute scale, so no instrumental corrections are applied (an offset of km s-1 relative to established RV standards was found in Tokovinin, 2018a). The RV errors depend on several factors such as the width and contrast of the CCF dip, presence of other dips, and signal-to-noise ratio. The rms residuals from the orbits can be as low as 0.01 km s-1 , but typically are between 0.1 and 0.5 km s-1 for the systems studied here. I assign the RV errors (hence weights) to match roughly the residuals, with larger errors for blended or noisy dips. Some blended CCFs are fitted by fixing the width or amplitude of individual components determined from other spectra with better-separated dips. Otherwise, a heavily blended dip is fitted by a single Gaussian, and the resulting biased RV is assigned a large error and a low weight in the orbit fit.
The width of the CCF dip is related to the projected rotation velocity , while its area depends on the spectral type, metallicity, and, for blended spectra of several stars, on the relative fluxes. Table 2 lists average parameters of the Gaussian curves fitted to the CCF dips. It gives the number of averaged measurements (blended CCFs are ignored), the dip amplitude , its dispersion , the product proportional to the dip area (hence to the relative flux), and the projected rotation velocity , estimated from by the approximate formula given in (Tokovinin, 2016a) and valid for km s-1 . The last column indicates the presence or absence of the lithium 6708 Å line in individual components.
| HIP/HD | Comp. | Li | |||||
|---|---|---|---|---|---|---|---|
| (km s-1) | (km s-1) | (km s-1) | 6708Å | ||||
| 7852 | Aa | 7 | 0.359 | 4.228 | 1.52 | 4.5 | Y |
| 9148 | Aa | 7 | 0.370 | 3.634 | 1.35 | 2.3 | Y |
| 9148 | Ab | 7 | 0.090 | 3.764 | 0.34 | 2.9 | N? |
| 12548 | Aa | 15 | 0.330 | 3.773 | 1.25 | 2.9 | N |
| 12548 | Ba | 15 | 0.130 | 3.677 | 0.48 | 2.5 | N |
| 21079 | Aa | 8 | 0.319 | 4.549 | 1.45 | 5.4 | Y |
| 24320 | Aa | 14 | 0.401 | 4.198 | 1.68 | 4.4 | Y? |
| 24320 | Ba | 13 | 0.414 | 4.354 | 1.80 | 4.9 | N |
| 27970 | Aa1 | 6 | 0.299 | 3.751 | 1.12 | 2.8 | Y! |
| 34212 | Aa | 12 | 0.287 | 4.490 | 1.29 | 5.3 | N |
| 56282 | Aa1 | 15 | 0.297 | 3.933 | 1.17 | 3.6 | Y! |
| 57860 | Aa | 7 | 0.187 | 3.551 | 0.66 | 1.8 | N |
| 57860 | Ab | 7 | 0.141 | 3.539 | 0.50 | 1.8 | N |
| 57860 | B | 7 | 0.134 | 3.596 | 0.48 | 2.1 | N |
| 108938 | Aa | 2 | 0.324 | 3.490 | 1.13 | 1.4 | N |
| 108938 | Ab | 2 | 0.048 | 3.130 | 0.15 | 0 | N |
| 108938 | B | 2 | 0.061 | 3.845 | 0.23 | 3.2 | N |
| 76400 | Aa | 9 | 0.234 | 3.735 | 0.88 | 2.8 | N |
| 76400 | Ab | 9 | 0.233 | 3.726 | 0.87 | 2.7 | N |
| 76816 | Ba | 13 | 0.507 | 3.806 | 1.93 | 3.1 | Y? |
| 81394 | Ba | 13 | 0.086 | 7.471 | 0.65 | 12.0 | N |
| 81394 | Bb | 13 | 0.098 | 6.064 | 0.59 | 9.0 | N |
| 98278 | Ba | 8 | 0.070 | 10.68 | 0.75 | 18.2 | Y |
| 98278 | Bb | 8 | 0.029 | 12.75 | 0.37 | 22.1: | … |
| 100420 | Aa | 12 | 0.215 | 4.628 | 1.00 | 5.7 | N |
| 100420 | Ab | 12 | 0.070 | 4.218 | 0.30 | 4.5 | N |
| 100420 | B | 3 | 0.241 | 5.435 | 1.31 | 7.6 | … |
2.2 Orbit Calculation
The orbital elements and their errors are determined by the least-squares fits with weights inversely proportional to the adopted RV errors. The IDL code ORBIT111Codebase: http://www.ctio.noirlab.edu/ãtokovin/orbit/ and https://doi.org/10.5281/zenodo.61119 was used (Tokovinin, 2016c). In some triple systems, the orbits of the outer and inner subsystems are fitted jointly to the RVs and, where available, position measurements using a modification of the same code ORBIT3 (Tokovinin, 2017) described by Tokovinin & Latham (2017). Both codes allow to fix some orbital elements to avoid degeneracies (e.g. for circular or face-on orbits) or to cope with insufficient data (e.g. an incomplete coverage of the outer orbit).
| HIP/HD | System | rms1,2 | ||||||||
|---|---|---|---|---|---|---|---|---|---|---|
| (d) | (JD +24,00,000) | (deg) | (km s-1) | (km s-1) | (km s-1) | (km s-1) | () | |||
| 7852 | Aa,Ab | 1177.9 | 58615.0 | 0.349 | 260.5 | 7.320 | … | 0.677 | 0.014 | 0.98: |
| 3.4 | 16.0 | 0.015 | 3.6 | 0.116 | … | 0.105 | … | 0.43 | ||
| 9148 | Aa,Ab | 1272.3 | 58531.6 | 0.0 | 0.0 | 7.711 | 9.550 | 23.163 | 0.16 | 0.37 |
| 6.0 | 2.2 | fixed | fixed | 0.099 | 0.099 | 0.057 | 0.16 | 0.30 | ||
| 12548 | Aa,Ab | 1851.9 | 59023.7 | 0.544 | 151.7 | 5.02 | … | 45.1 | 0.11 | 1.07: |
| 18.4 | 29.6 | 0.040 | 5.4 | 0.66 | … | fixed | … | 0.32 | ||
| 12548 | Ba,Bb | 108.18 | 59241.648 | 0.823 | 201.3 | 21.36 | … | 47.60 | 0.26 | 0.89: |
| 0.10 | 0.087 | 0.005 | 0.7 | 0.28 | … | 0.12 | … | 0.31 | ||
| 21079 | Aa,Ab | 217.04 | 58044.39 | 0.491 | 336.6 | 5.949 | … | 3.525 | 0.024 | 0.98: |
| 0.23 | 1.66 | 0.008 | 1.1 | 0.103 | … | 0.041 | … | 0.16 | ||
| 24320 | Aa,Ab | 1430.3 | 58800.2 | 0.393 | 136.6 | 3.46 | … | 16.14 | 0.034 | 1.00: |
| 10.6 | 10.2 | 0.018 | 1.5 | 0.03 | … | 0.05 | … | 0.19 | ||
| 24320 | Ba,Bb | 7.94292 | 58190.82 | 0.0240 | 287.5 | 36.76 | … | 16.46 | 0.038 | 0.82: |
| 0.00002 | 0.10 | 0.0005 | 4.5 | 0.11 | … | 0.02 | … | 0.39 | ||
| 27970 | Aa1,Aa2 | 15.3230 | 56600.996 | 0.504 | 197.8 | 25.48 | … | … | 0.22 | 1.25: |
| 0.0001 | 0.041 | 0.007 | 1.3 | 0.36 | … | … | … | 0.35 | ||
| 27970 | Aa,Ab | 1049.4 | 57207.6 | 0.359 | 231.4 | 6.13 | … | 11.95 | 0.22 | 1.60: |
| 4.3 | 11.6 | 0.028 | 5.5 | 0.20 | … | 0.11 | … | 0.44 | ||
| 34212 | Aa,Ab | 1246.7 | 57902.5 | 0.163 | 192.3 | 7.265 | … | 52.051 | 0.015 | 1.24: |
| 2.9 | 12.7 | 0.005 | 3.6 | 0.058 | … | 0.031 | … | 0.53 | ||
| 56282 | Aa1,Aa2 | 122.177 | 58945.35 | 0.046 | 264.9 | 8.284 | … | … | 0.066 | 1.14: |
| 0.058 | 2.23 | 0.006 | 6.6 | 0.063 | … | … | … | 0.24 | ||
| 56282 | Aa,Ab | 3650 | 57233 | 0.056 | 228.5 | 2.527 | … | 8.254 | 0.066 | 1.38: |
| fixed | 1271 | 0.066 | 123.4 | 0.520 | … | 0.455 | … | 0.25 | ||
| 57860 | Aa,Ab | 891.9 | 58137.7 | 0.101 | 6.0 | 11.75 | 12.42 | 38.47 | 0.11 | 0.66 |
| 2.7 | 9.3 | 0.005 | 4.0 | 0.06 | 0.09 | 0.04 | 0.06 | 0.62 | ||
| 108938 | Aa,Ab | 342.48 | 59321.34 | 0.517 | 208.6 | 17.72 | 21.66 | 39.01 | 0.22 | 0.75 |
| 1.20 | 0.82 | 0.018 | 1.3 | 0.32 | 0.32 | 0.30 | 0.41 | 0.61 | ||
| 76400 | Aa,Ab | 368.51 | 58235.66 | 0.137 | 192.0 | 18.64 | 18.70 | 7.28 | 0.05 | 0.96 |
| 0.74 | 3.66 | 0.039 | 3.7 | 0.47 | 0.47 | 0.71 | 0.04 | 0.96 | ||
| 76816 | Ba,Bb | 208.918 | 59185.16 | 0.420 | 43.2 | 15.265 | … | 40.323 | 0.016 | 1.67: |
| 0.011 | 0.34 | 0.005 | 0.9 | 0.082 | … | 0.062 | … | 0.68 | ||
| 81395 | Ba,Bb | 224.804 | 58319.14 | 0.418 | 147.6 | 11.14 | 12.04 | 14.13 | 0.34 | 0.11 |
| 0.028 | 0.46 | 0.006 | 1.2 | 0.21 | 0.08 | 0.06 | 0.12 | 0.10 | ||
| 98278 | Ba,Bb | 236.15 | 58754.64 | 0.574 | 245.2 | 27.22 | 27.95 | 6.32 | 1.20 | 1.14 |
| 0.33 | 0.92 | 0.008 | 1.0 | 0.42 | 0.32 | 0.24 | 0.57 | 1.11 | ||
| 100420 | Aa,Ab | 790.6 | 58395.68 | 0.372 | 73.0 | 14.78 | 17.52 | 49.08 | 0.11 | 1.20 |
| 0.46 | 0.88 | 0.003 | 0.5 | 0.06 | 0.06 | 0.03 | 0.13 | 1.00 |
| HIP | System | Date | RV | (OC) | Comp. | |
|---|---|---|---|---|---|---|
| HD | (JD +24,00,000) | (km s-1) | Instr. | |||
| 7852 | Aa,Ab | 53695.0000 | -6.46 | 0.20 | -0.02 | aC |
| 7852 | Aa,Ab | 54046.6120 | 7.18 | 0.10 | -0.01 | aH |
| 7852 | Aa,Ab | 57319.6410 | -6.93 | 0.20 | 0.01 | a |
| 7852 | Aa,Ab | 57983.8210 | 2.30 | 0.20 | 0.00 | a |
| 7852 | Aa,Ab | 58745.7420 | 6.96 | 0.20 | 0.03 | a |
Table 3 gives elements of the spectroscopic orbits in standard notation. Its last column contains the masses for double-lined binaries. For single-lined systems, the mass of the primary star (listed with colons) is estimated from its absolute magnitude, and the minimum mass of the secondary that corresponds to the 90° inclination is derived from the orbit. Table 4, published in full electronically, provides individual RVs. The Hipparcos or HD number of the primary star and the system identifier (components joined by comma) in the first two columns define the pair. Then follow the Julian date, the RV, its adopted error (blended CCF dips are assigned larger errors), and the residual to the orbit (OC). The last column specifies to which component this RV refers (’a’ for the primary, ’b’ for the secondary) and gives references to the published RVs. The RVs of other visual components are provided, for completeness, in Table 5. It contains the HIP number, the component letter, the Julian date, and the RV. The less accurate RVs derived from blended dips are marked by colons.
| HIP/HD | Comp. | Date | RV |
|---|---|---|---|
| (JD +24,00,000) | (km s-1) | ||
| 57860 | B | 58193.7198 | 36.034 |
| 57860 | B | 58194.6254 | 36.005 |
| 57860 | B | 58195.6408 | 35.973 |
| 57860 | B | 58510.8194 | 35.994: |
| 57860 | B | 58539.7575 | 35.961: |
| 57860 | B | 58559.6517 | 35.942: |
| 57860 | B | 58648.6288 | 36.129: |
| 57860 | B | 59403.4624 | 36.000 |
| 108938 | B | 54576.6567 | 38.212 |
| 108938 | B | 59316.6752 | 37.679 |
| 108938 | B | 59323.6711 | 37.707 |
| 108938 | B | 59404.5562 | 38.227: |
| 100420 | B | 57985.5413 | 49.437 |
| 100420 | B | 57986.5850 | 49.489 |
| 100420 | B | 58549.9038 | 49.408 |
2.3 Other Data
I use here astrometry and photometry from the Gaia third early data release, EDR3 (Gaia Collaboration et al., 2021). For multiple systems, it can be compromised by acceleration and/or unresolved companions because the current astrometric reductions assume single stars. The RUWE parameter (Reduced Unit Weight Error) captures the excessive astrometric noise, helping to identify suspicious astrometry in EDR3. Most (but not all) stars with subsystems studied here have RUWE . Uncertain Gaia parallaxes are marked by colons in Table 1. Detection of astrometric subsystems by the difference (so-called PMA) between the short-term proper motion (PM) measured by Gaia and the long-term PM deduced from the Gaia and Hipparcos positions by Brandt (2018) continued the work by Makarov & Kaplan (2005) at a new level of accuracy. For stars with large RUWE, I use the long-term PMs determined by Brandt in place of the PMs measured by Gaia.
For some systems, spectroscopy is complemented by speckle interferometry of the outer pairs. Most speckle observations used here were made at the Southern Astrophysical Research Telescope (SOAR) and are referred to in the text simply as ‘SOAR data’. The latest observations and references to older publications are found in Tokovinin et al. (2021). Apart from the position measurements, speckle interferometry provides differential photometry of close visual pairs. For binaries wider than 1″, it is complemented by the Gaia photometry. Effective temperatures estimated by Gaia give the spectral types of the visual components, checked by their colors. Spectral types and absolute magnitudes are used to estimate masses of the stars using standard main-sequence relations from Pecaut & Mamajek (2013).
3 Individual Objects
For double and triple-lined systems, Figures in this section show a typical CCF (the Julian date and individual components are marked on the plot) together with the RV curve representing the orbit. For single-lined binaries, only the RV curves are plotted. In the RV curves, green squares denote the primary component, blue triangles denote the secondary component, while the full and dashed lines plot the orbit. Typical error bars are smaller than the symbols. Masses of stars are estimated from absolute magnitudes, orbital periods of wide pairs — from their projected separations (see Tokovinin, 2018c). Semimajor axes of the spectroscopic subsystems are computed using the third Kepler’s law, and the photocenter amplitudes are evaluated based on the estimated masses and fluxes.
3.1 HIP 7852 (Triple)
This is a chromospherically active star EY Cet (Boro Saikia et al., 2018) located at 45 pc distance. Luck (2018) used the archive of high-resolution spectra taken with the HAPRS spectrometer to determine the effective temperature of 5641 K (spectral type G5V), a mild metal deficiency [Fe/H]=0.13, and the projected rotation of km s-1 , in good agreement with 4.5 km s-1 listed in Table 2. The HARPS and CHIRON spectra show a presence of lithium despite the slow rotation and the age of 5.8 Gyr estimated by Luck. The common proper motion (CPM) companion B ( mag, K5, UCAC2 29946080) at 125″ separation is listed in the WDS as TOK 228. Stars A and B are located on the main sequence.
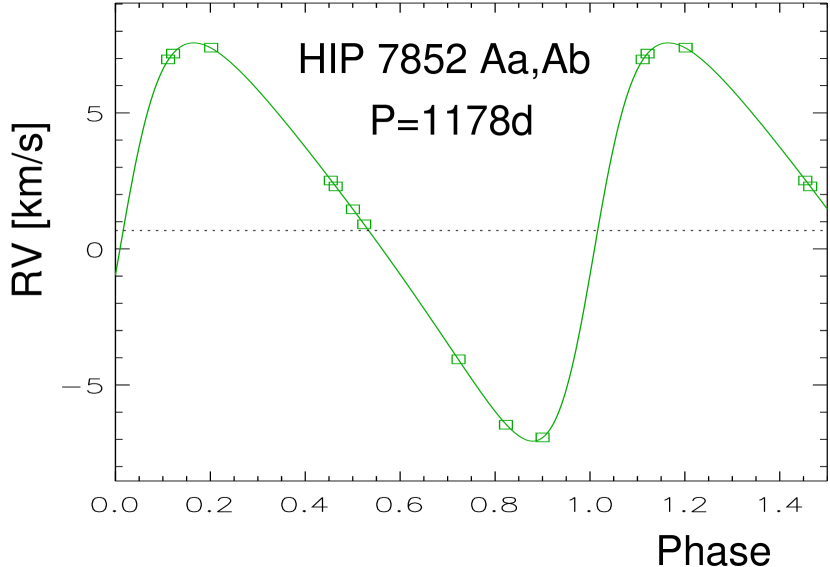
The astrometric acceleration of star A was detected by Hipparcos (Makarov & Kaplan, 2005) and by Brandt (2018); it explains the huge RUWE=15.6 in Gaia EDR3. The star has been placed on the CHIRON program in 2015 to determine the period of Aa,Ab. Eight single-lined spectra accumulated to date indicate yr. This orbit (Figure 2) is strengthened by including the RV deduced from the HARPS spectrum taken in 2006 (JD 2454046.612) and recovered from the ESO archive and the RV measured in 2005 (JD 2453695.0) by Chubak et al. (2012). The rms residuals are only 0.014 km s-1 . The RV from Gaia is not used here because its mean epoch is not known and the error is large (1.9 km s-1 ) owing to variability.
Star Aa has an estimated mass of 0.98 , the minimum mass of Ab is 0.43 , and the semimajor axis of the inner orbit is 47.5 mas. The minimum Ab mass corresponds to the photocenter axis of 14.5 mas. An astrometric orbit will determined by Gaia, leading to an accurate mass of Ab.
3.2 HIP 9148 (Triple)
The outer pair A,B, at 415 separation, has been identified as CPM by Luyten (1941) and is listed in the WDS as LDS 61. Gaia confirms that this high-PM pair is bound. Star B ( mag) has an estimated mass of 0.55 . Its EDR3 parallax of 11.24 mas (distance 89 pc) is not biased by the subsystem. In contrast, star A is a double-lined binary (Nordström et al., 2004). It has a large , the EDR3 RUWE is also large, 17.6, and the EDR3 parallax of 12.45 mas is biased. Like the previous object, the star is chromospherically active (Boro Saikia et al., 2018) and has a detectable lithium line, although the projected axial rotation is slow.
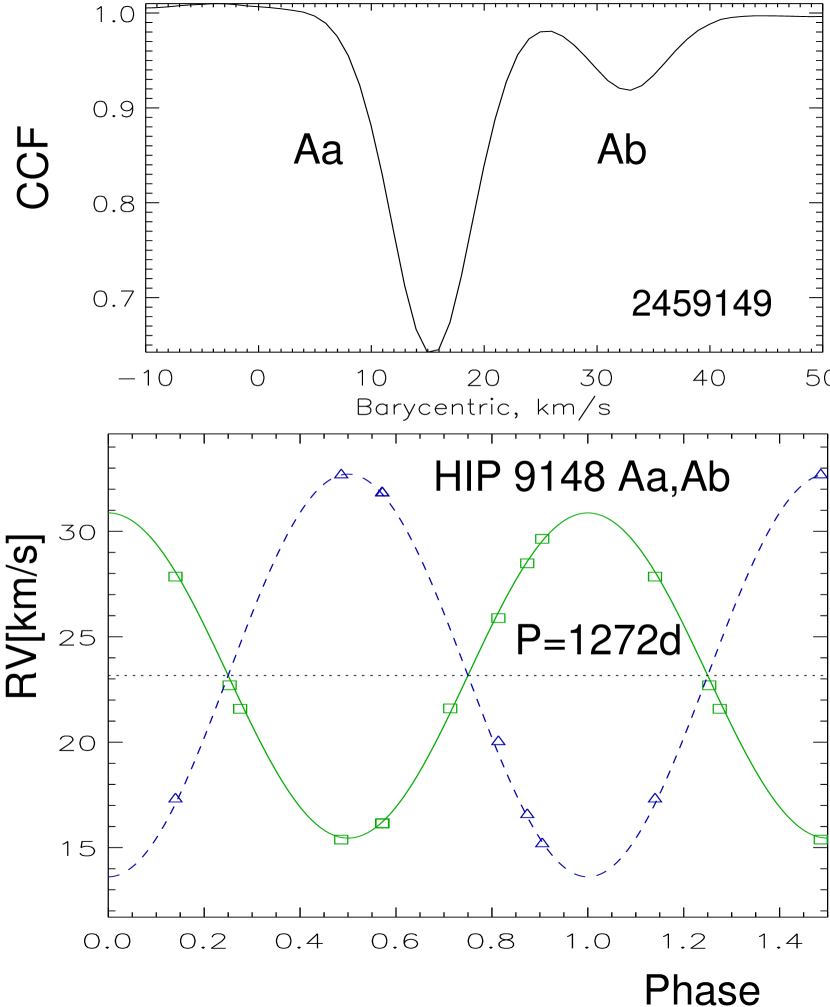
Ten CHIRON spectra acquired since 2017 show double CCFs with unequal dips (Figure 3). The magnitude difference between Aa and Ab deduced from the dip areas is 1.5 mag, hence the magnitudes of Aa and Ab are 8.51 and 10.01 mag, respectively, and correspond to main-sequence stars with masses of 1.23 and 0.95 (ratio 0.77). Aa is brighter than inferred from its spectral type G3V, it is located slightly above the main sequence (evolved), while star B is just below.
The orbit of Aa,Ab with a period of 3.5 yr is circular. A free fit gives and does not reduce the residuals, so the circular orbit is enforced. The spectroscopic mass ratio is similar to the ratio of photometricaly estimated masses, which are much larger than the spectroscopic masses . This means that the Aa,Ab orbit has a large inclination of 42°. The semimajor axis of Aa,Ab is 33 mas, and the estimated photocenter amplitude is about 8 mas.
3.3 HIP 12548 (Quadruple)
The star HIP 12548 (HD 17215, G6V, mag) belongs to the immediate solar neighborhood: the revised Hipparcos parallax of 18.60.8 mas puts it at the 54 pc distance. The Gaia DR2 parallax of 15.80.8 mas is inaccurate, and EDR3 gives no parallax. This is a visual binary B 1923 (WDS J024157128) known since 1931; its orbit with a period of 100 yr and a semimajor axis of 06 is now almost fully covered and well constrained (see below).
Nordström et al. (2004) found that the spectrum is double-lined and, therefore, there is a spectroscopic subsystem. They even determined a mass ratio of 0.26 by assuming that the lines belong to the same spectroscopic system. However, their paper does not contain individual RV measurements, making it impossible to use or check these findings. Only single lines were seen in 2008 at Las Campanas (Tokovinin et al., 2015b) and in 2017 with CHIRON. Occasionally, a double-lined spectrum is observed in a visual binary near periastron of its eccentric orbit; the existence of a spectroscopic subsystem remained thus questionable.
The visual binary was monitored by speckle interferometry at SOAR in 2008-2021, allowing us to improve its orbit. To check for potential spectroscopic subsystems, the object was placed on the CHIRON program in 2017. The observed CCF profiles varied from narrow single to asymmetric or double, confirming the existence of a spectroscopic subsystem. Furthermore, it became clear that the RVs of both components seen in the spectra are variable. Both visual components A and B are close binaries with periods of 5 yr and 108 days, respectively, and this is a quadruple system of 2+2 hierarchy. Discovery of the true nature of this seemingly common visual pair was possible only with high-resolution spectroscopy.
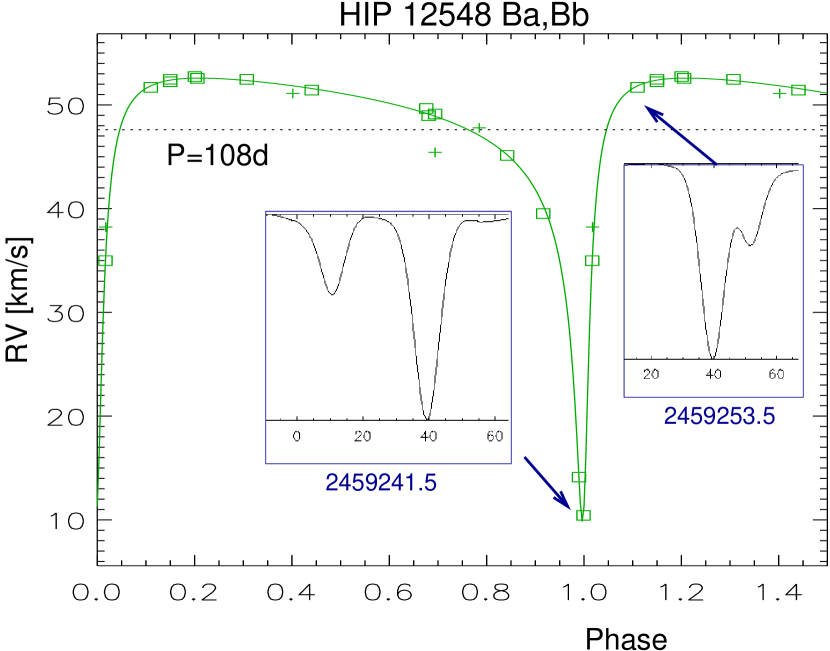
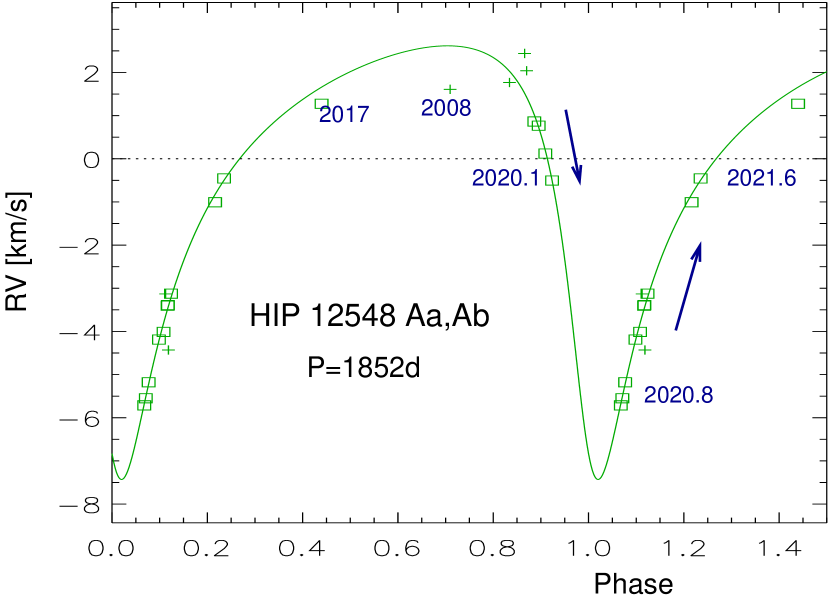
Figure 4 illustrates the single-lined orbits of the subsystems Ba,Bb and Aa,Ab. The orbit of Ba,Bb has a large eccentricity of 0.82. The minimum of its RV curve was covered by regular observations in 2021 January-February. The inserts show the CCFs at the RV minimum on JD 2459241.5, where the weaker dip of Ba was located to the left of the stronger dip of Aa. Twelve days later, on JD 2459253.5, the lines of Ba were already seen on the right side, partially blending with the lines of Aa. The RV of Aa on both dates was around 40 km s-1 .
The RV curve of Aa,Ab is shown in the lower panel of Figure 4. Its descending branch was covered in the fall of 2019. CHIRON was closed for COVID-19 pandemic in the first half of 2020. After its re-opening in 2020 October, the increasing RV was measured. The RVs alone do not fully constrain the orbit, partly because blended dips of Aa and Ba result in poor accuracy. Reliable dip splitting is achieved only near the periastron of the Ba,Bb orbit.
| HIP | System | ||||||||||
|---|---|---|---|---|---|---|---|---|---|---|---|
| (yr) | (yr) | (arcsec) | (deg) | (deg) | (deg) | (km s-1) | (km s-1) | (km s-1) | |||
| 12548 | A,B | 106.3 | 2010.02 | 0.384 | 0.568 | 42.4 | 63.4 | 114.7 | 4.12 | 4.69 | 45.10 |
| 4.6 | 0.19 | 0.020 | 0.012 | 0.4 | 1.6 | 0.4 | 0.44 | 0.88 | fixed | ||
| 12548 | Aa,Ab | 5.07 | 2020.477 | 0.544 | 0.0117 | 70.5 | 151.7 | 79.7 | 5.02 | … | … |
| 0.05 | 0.080 | 0.040 | 0.0009 | 3.2 | 5.4 | 3.2 | 0.66 | … | … | ||
| 76400 | A,B | 70.0 | 2016.26 | 0.420 | 0.374 | 320.3 | 275.5 | 144.7 | 1.41 | … | 7.28 |
| fixed | 0.84 | 0.010 | 0.008 | 11.5 | 21.1 | 2.9 | 0.67 | … | 0.71 |
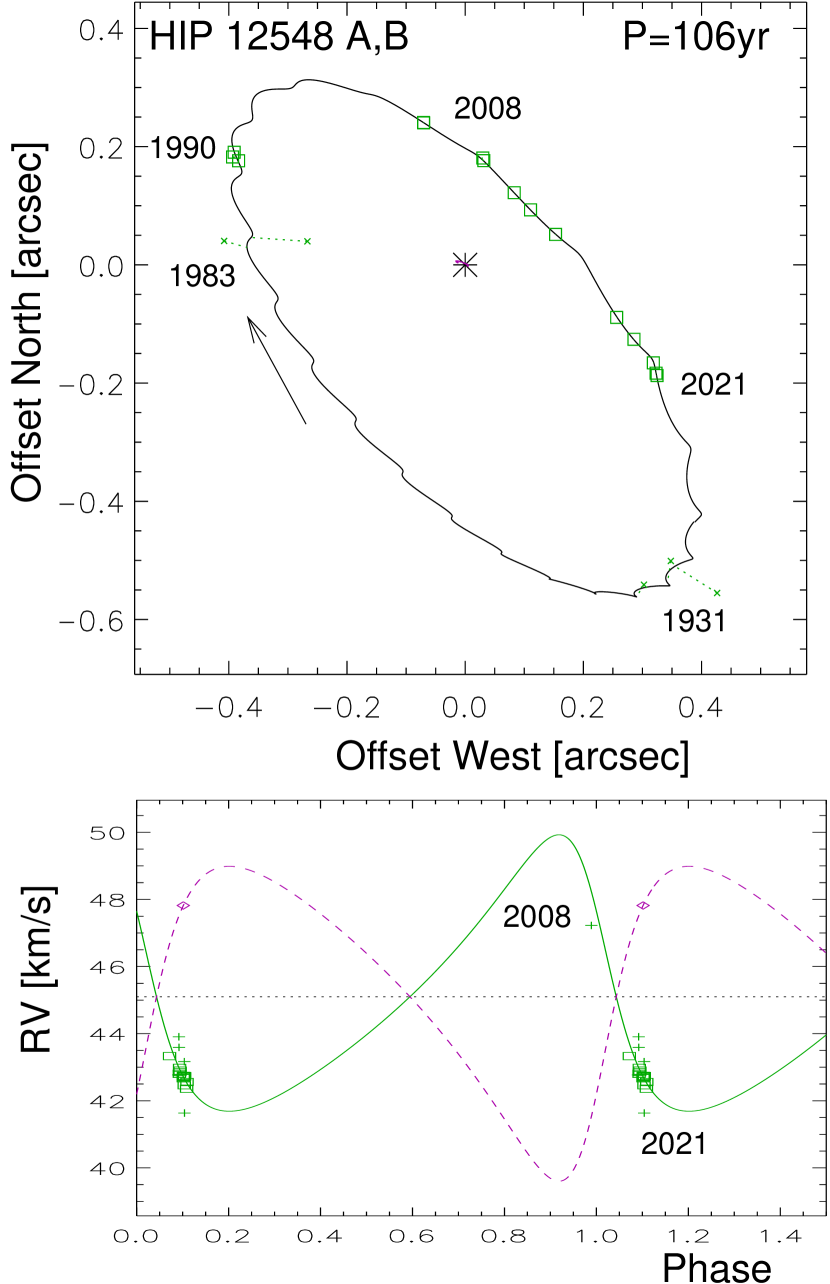
The semimajor axis of Aa,Ab is 61 mas, and the expected photocenter amplitude is 14 mas. Wobble in the motion of A,B caused by the 5-yr subsystem is detectable in accurate speckle-interferometric measurements. The orbits of A,B and Aa,Ab were fitted jointly using both the positions and the RVs. Star B was treated as single (its photocenter amplitude is 2 mas), and its center-of-mass RV is included as a single measurement. The spectroscopic elements of Aa,Ab are listed in Table 3, and the updated visual elements of A,B and their errors are provided in Table 6 together with the astrometric orbit of Aa,Ab. The outer orbit with wobble is illustrated in Figure 5.
The first three micrometric measurements of A,B made by Bos in 1931–1939 are modified here by increasing the separations by a factor of 1.2 to match the orbit (it is well known that micrometric measurements of separations are often burdened by large errors, while the position angles are more accurate). Unfortunately, the pair has not been observed for half a century, until 1983. The Hipparcos and speckle observations in the early 1990s and the SOAR data from 2008–2021, covering the periastron, fully constrain the outer orbit. The outer RV curve plots the systemic RV of B, a single blended measurement in 2008 attributed to Aa, and the CHIRON RVs of Aa with subtracted inner orbit. The weighted rms residuals of SOAR speckle measurements are 0.8 mas in both coordinates, and the fitted wobble amplitude is 11.70.9 mas, in agreement with its estimate. Without the wobble, the position residuals increase to 5 mas. Secure detection of the wobble helps to constrain the Aa,Ab orbit in the joint fit and defines its orientation on the sky. The RV amplitudes of A and B are 4.1 and 4.7 km s-1 , respectively. However, these amplitudes are poorly constrained, and I had to select and fix the systemic velocity of A,B to obtain RV amplitudes that match the estimated masses (see below). The angle between the angular momentum vectors of A,B and Aa,Ab (mutual inclination) is 45°4°.
The magnitudes of A and B are 8.15 and 9.26 mag, respectively (the difference of 1 mag is confirmed at SOAR), and their absolute magnitudes (using the Hipparcos parallax) correspond to the masses of 1.07 and 0.89 for Aa and Ba. The minimum masses of the spectroscopic secondaries Ab and Bb are 0.32 and 0.31 . The actual mass of Ab equals its minimum mass because the orbital inclination is large, 80°. Contribution of the spectroscopic secondaries to the optical fluxes is negligible and their lines are not seen in the spectra. The total estimated mass of the system is thus 2.6 . The outer orbit and mass sum correspond to the dynamical parallax of 18.5 mas, in good agreement with the Hipparcos parallax of 18.6 mas. The estimated masses result in the outer mass ratio .
This quadruple system presents a tough challenge for Gaia. The satellite did not resolve the A,B pair, which moves fast on the outer orbit. Without prior knowledge of the orbits, modeling the non-linear photocenter motion that includes strong wobble signals with periods of 5 yr and 108 days will hardly be possible even in the final Gaia data release. Blended spectra preclude the Gaia RV measurements.
3.4 HIP 21079 (Triple)
This object is a nearby (45 pc) solar-type star. Its astrometric acceleration in Hipparcos (Makarov & Kaplan, 2005) prompted high-resolution observations at Gemini, detecting a faint companion B at 162 separation with and mag (Tokovinin et al., 2012). This pair, TOK 208, was observed at SOAR at similar position and with mag. Its components have separate entries in Gaia, adding mag to the relative photometry.
The absolute magnitude of the primary star A matches its spectral type G3V and corresponds to the mass of 0.98 . According to Bensby & Lind (2018), the effective temperature of A is 579248K, while [Fe/H]=0.110.05. They detected the lithium line in the spectrum and determined the Li abundance of 2.50. The multi-color differential photometry of A,B is consistent with B being an 0.55 star. The projected separation of A,B implies a period on the order of 500 yr, in agreement with the slow observed motion (increasing separation at constant angle). The small astrometric acceleration revealed by the could be produced by this pair.
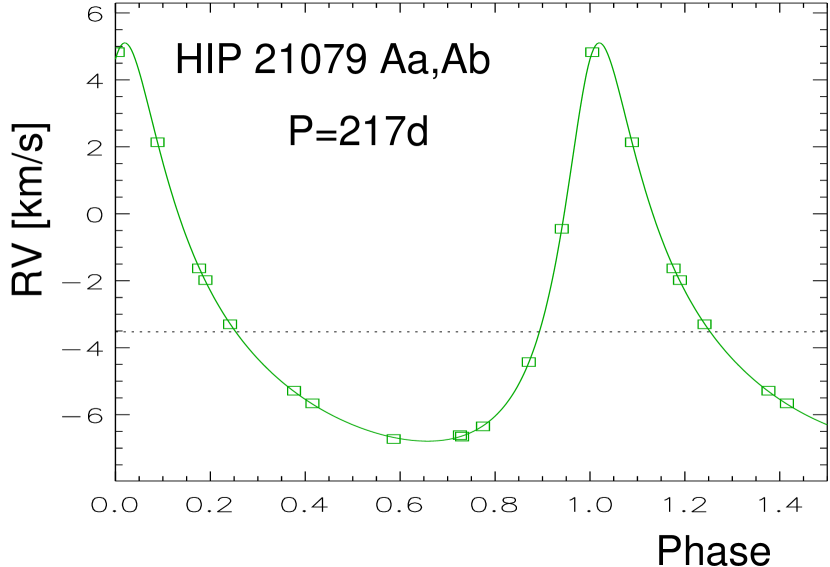
Nordström et al. (2004) found that the RV of HIP 21079 varies with an amplitude of 3.8 km s-1 . The star was placed on the CHIRON program in 2015 with the aim of determining its spectroscopic orbit. The spectra show a weak lithium line and indicate a moderate rotation of km s-1 . A single-lined orbit of Aa,Ab with days is shown in Figure 6. The residuals are 0.024 km s-1 owing to the narrow and high-contrast CCF dip. The minimum mass of Ab is 0.16 , and no traces of its lines are seen in the spectra. The semimajor axis of Aa,Ab is 16.2 mas, and the photocenter amplitude should be 2.3 mas. This system is a planetary-type hierarchy with two low-mass companions orbiting the central solar-type star.
3.5 HIP 24320 (Quadruple)
This is a quadruple system of 2+2 hierarchy. The outer visual pair A,B has a separation of 463 and a magnitude difference , mag. It is cataloged under the name of HJ 3743, having been discovered by J. Herschel in 1835. Stars A and B have individual astrometry in Gaia, proving their physical relation. The estimated period of A,B is 3 kyr.
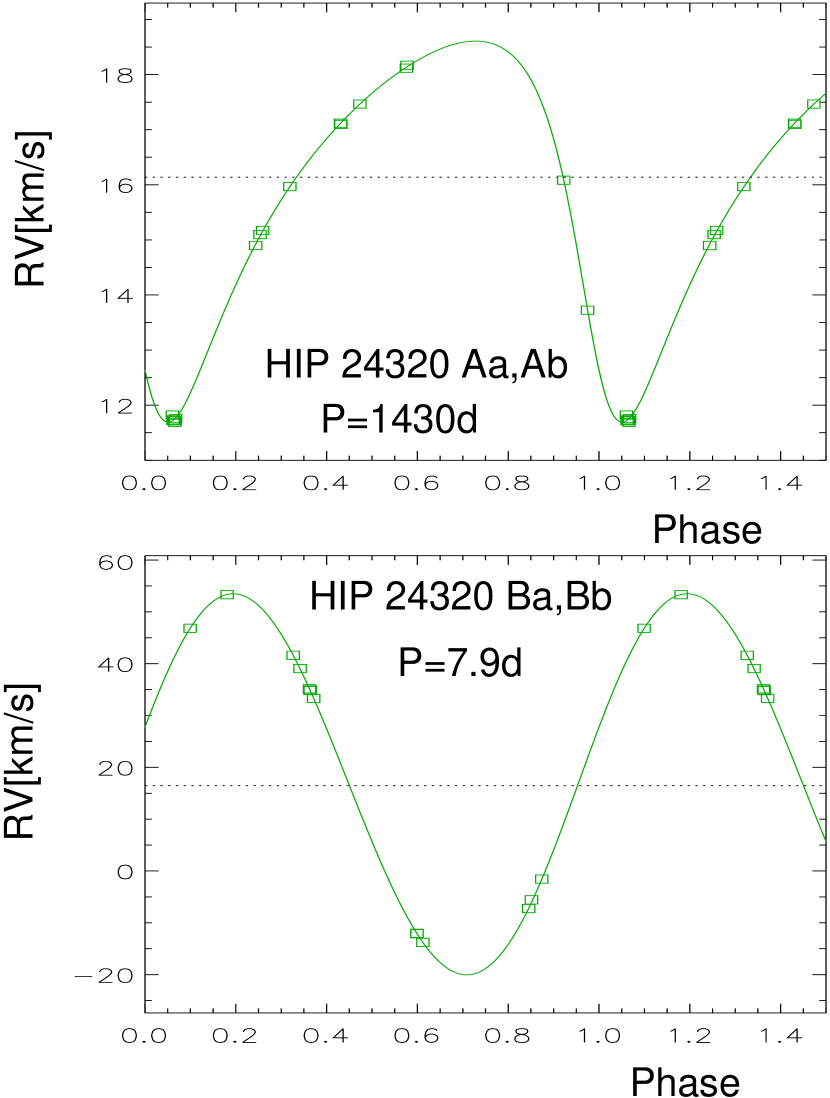
Nordström et al. (2004) indicate that the RV is variable, but do not specify which component of the visual pair was observed. Both components were observed with CHIRON, and both have variable RVs. Their single-lined orbits with periods of 1430 and 7.9 days are illustrated in Figure 7. Despite the short period, the Ba,Bb pair has a measurable eccentricity of 0.024. Adopting the masses of 1.0 and 0.82 for Aa and Ba, appropriate for their absolute magnitudes and spectral types G3V and K2V, the minimum masses of the secondaries are 0.19 and 0.39 , respectively.
The astrometry of A in Gaia EDR3 is likely distorted by the 3.9 yr subsystem: the estimated astrometric wobble amplitude is at least 7 mas. The acceleration of A is evidenced by (Brandt, 2018) and by RUWE=15.0. Future Gaia data releases are expected to contain the astrometric orbit of Aa,Ab.
3.6 HIP 27970 (Triple)
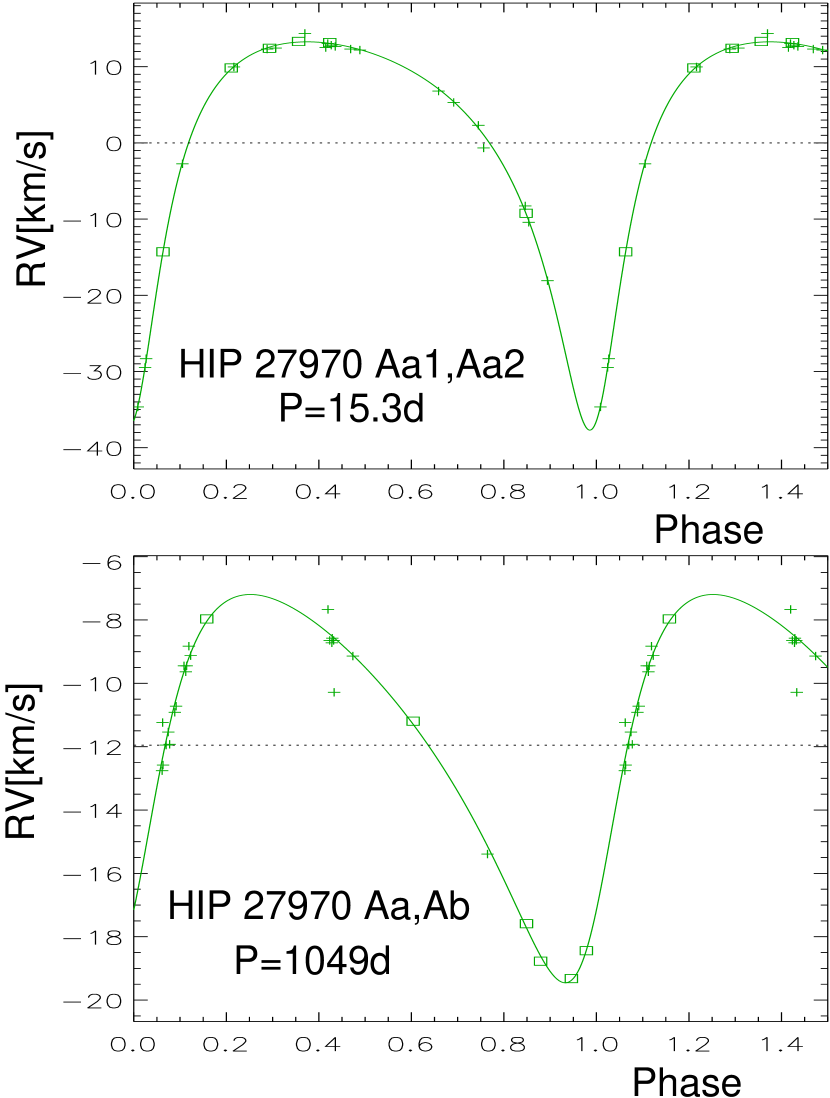
HIP 27970 (HD 39899, F7V, mag) is a spectroscopic triple in the solar neighborhood (distance 60 pc). No visual companions are listed in the WDS and none are found in Gaia within 2′. The Gaia EDR3 parallax of 15.78 mas is biased by the astrometric acceleration, but nevertheless agrees, within errors, with the Hipparcos parallax of 16.01.3 mas. The astrometric acceleration was detected by Hipparcos and confirmed by Brandt (2018).
The RV variability was reported by Nordström et al. (2004). The star was observed in 2012–2016 with the correlation radial-velocity meter by Gorynya & Tokovinin (2018), who determined a single-lined spectroscopic orbit with days. Residuals from this orbit suggested presence of another companion with a longer period that would also explain the acceleration. Additional observations with CHIRON made in 2020 and 2021 are used here to determine the orbit of this tertiary companion with days (2.9 yr). Both orbits were fitted simultaneously using ORBIT3 (Tokovinin & Latham, 2017). The errors of the published RVs were adjusted by adding quadratically the instrumental error of 0.3 km s-1 ; the two most deviant RVs were given larger errors. Another strongly deviant RV from that paper corresponds to the periastron of the outer orbit, explaining the apparent disagreement with the initial orbit. The errors of the CHIRON RVs of 0.2 km s-1 were adopted. The weighted rms residuals are 0.22 km s-1 . Figure 8 shows both RV curves. The inner and outer eccentricities are 0.504 and 0.359, respectively, and the center of mass velocity is km s-1 .
I adopt the mass of 1.25 for the primary component Aa1, estimated from its absolute magnitude and matching the spectral type F7V and the color. The orbits give minimum masses of 0.35 and 0.44 for Aa2 and Ab, respectively. The semimajor axis of Aa,Ab is 40 mas.
Both orbits have substantial inclinations, otherwise the secondary stars should be more massive and then would become detectable in the spectra and add the flux, moving the object above the main sequence in the color-magnitude diagram (in fact it is right on the main sequence). If the actual masses are close to their minimum values, the astrometric semimajor axis of the outer orbit is a 0.22 fraction of the full axis, i.e. 8.6 mas. The PM anomaly measured by Brandt (2018) is mas yr-1, its modulus is 12.3 mas yr-1. The outer orbit with an inclination of 90° predicts a photo-center motion of 18.4 mas yr-1 over the Gaia DR2 time span, in qualitative agreement with this crude estimate. The position angle of the outer node should be around 60∘ to match the direction.
The RV of the center of mass and the long-term PM determined by Brandt (2018) correspond to the Galactic velocity km s-1 . The object thus belongs to the disk population, typical of the solar neighborhood. A very strong lithium line is present in the CHIRON spectra, despite the slow rotation of km s-1 .
3.7 HIP 34212 (Triple)
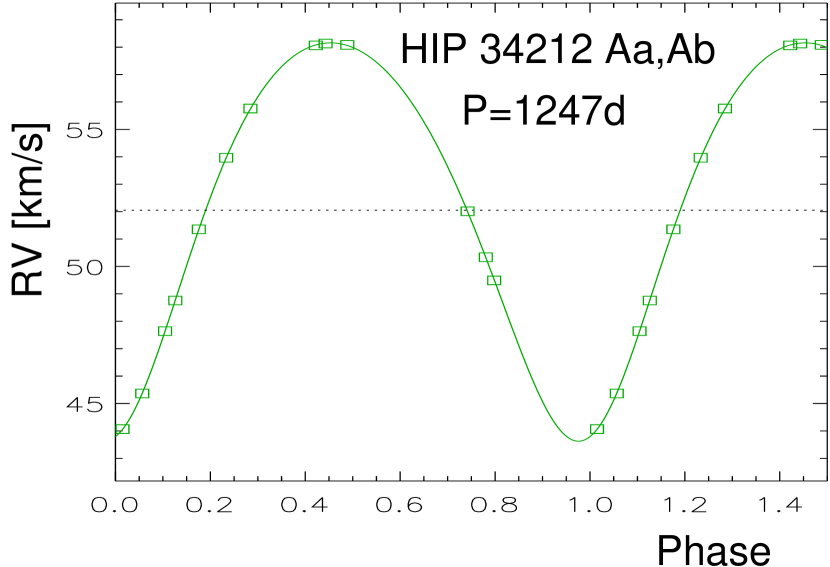
This is yet another typical solar-type triple. The outer 11″ pair A,B (TOK 114) has been identified in (Tokovinin, 2011) and confirmed as CPM by Gaia. The EDR3 parallax of B ( mag) is 16.55 mas (distance 60.4 pc), its estimated mass is only 0.2 . The EDR3 parallax of A, 14.39 mas, is biased by the subsystem Aa,Ab, which has been revealed by variable RV (Nordström et al., 2004) and by astrometric acceleration (Makarov & Kaplan, 2005); the large RUWE of 20.7 is caused by the subsystem.
Star A was observed with CHIRON since 2015. The spectrum has single lines slightly broadened by rotation ( km s-1 ). The orbit of Aa,Ab with yr is illustrated in Figure 9; the residuals are only 0.015 km s-1 . Star Aa (F8V) has an estimated mass of 1.24 , and the minimum mass of Ab is 0.53 . Lines of Ab are not detectable in the spectra. The semimajor axis of Aa,Ab is 45 mas, the photocenter axis is 13.6 mas.
3.8 HIP 56282 (Quadruple)
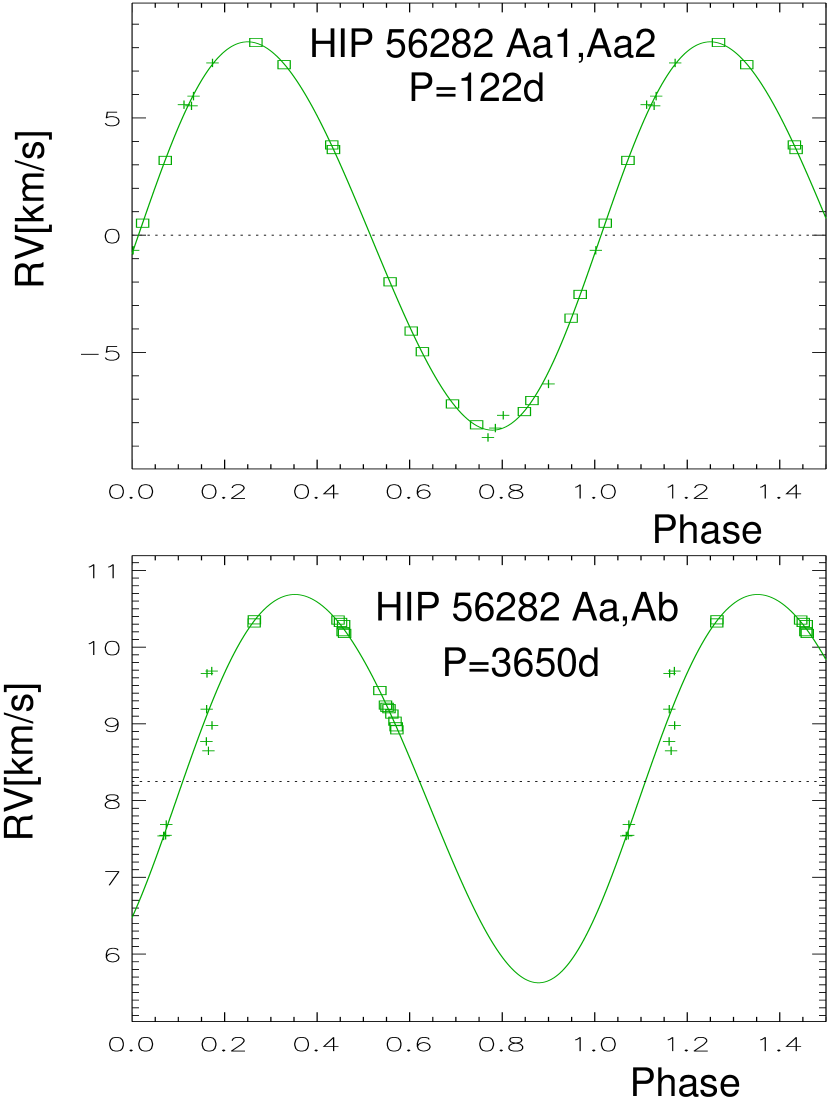
This is a solar-type F8V star located at 61 pc distance. The outer 159 pair A,B was identified in (Tokovinin, 2011) and confirmed as physical by the Gaia astrometry. Star B ( mag) has an estimated mass of 0.30 , and its EDR3 parallax of 16.28 mas defines the distance. Star A contains a subsystem, as follows from the variable RV (Nordström et al., 2004) and the acceleration (Makarov & Kaplan, 2005). Gaia EDR3 gives a biased parallax of 15.13 mas with a large RUWE of 6.4. The long-term PM of A is in excellent agreement with the PM of B, but its short-term PM measured by Gaia is different owing to the subsystem (Brandt, 2018).
The RV of A has been monitored by Gorynya & Tokovinin (2018) since 2016 using a correlation radial-velocity meter to determine the period of the subsystem. The data were not sufficient for the orbit calculation, and it was suspected that star A is triple. This hypothesis is confirmed by the additional CHIRON data presented here. The inner period of 122 days is clearly identified, superposed on a slow RV variation. I designate the innermost subsystem as Aa1,Aa2 and the intermediate one as Aa,Ab. The combined RV data set does not yet fully cover the Aa,Ab orbit, and I adopt a preliminary period of 10 yr while fitting both orbits simultaneously using ORBIT3 (Figure 10). With a coverage of 1841 days, substantially shorter outer periods are excluded. Longer periods, e.g. 15–20 yr, are possible, but they require a larger RV amplitude and a larger mass of Ab (no trace of Ab is seen in the CCF). So, the orbit of Aa,Ab proposed here is hypothetical, but plausible.
The minimum masses of Aa2 and Ab are 0.24 and 0.25 , respectively, if the mass of 1.14 is adopted for Aa1. The semimajor axis of Aa,Ab is 89 mas, and the photocenter axis is 13.6 mas. The Aa,Ab orbit predicts a of the same order as observed, about 5 mas yr-1 (the orbit orientation is unknown, precluding a more detailed comparison).
The innermost orbit is almost circular, and the middle orbit also seems to have a small or zero eccentricity. Thus, the 3+1 quadruple HIP 56282 resembles a planetary system by its quasi-circular orbits and the low masses of all three companions relative to the main star, making it similar to HD 91962 (Tokovinin et al., 2015a).
Star A has a strong lithium line in its spectrum, although the projected rotation is slow, km s-1 . Armstrong et al. (2015) found a flux modulation with an amplitude of 3.17 per cent and no apparent period in the Kepler K2 data. Chaplin et al. (2015) also used the K2 photometry to detect astroseismic signals from solar-type stars; none was found in HIP 56282. They determined stellar parameters from a high-resolution spectrum: K, km s-1 , and [Fe/H] = 0.26.
3.9 HIP 57860 (Triple)
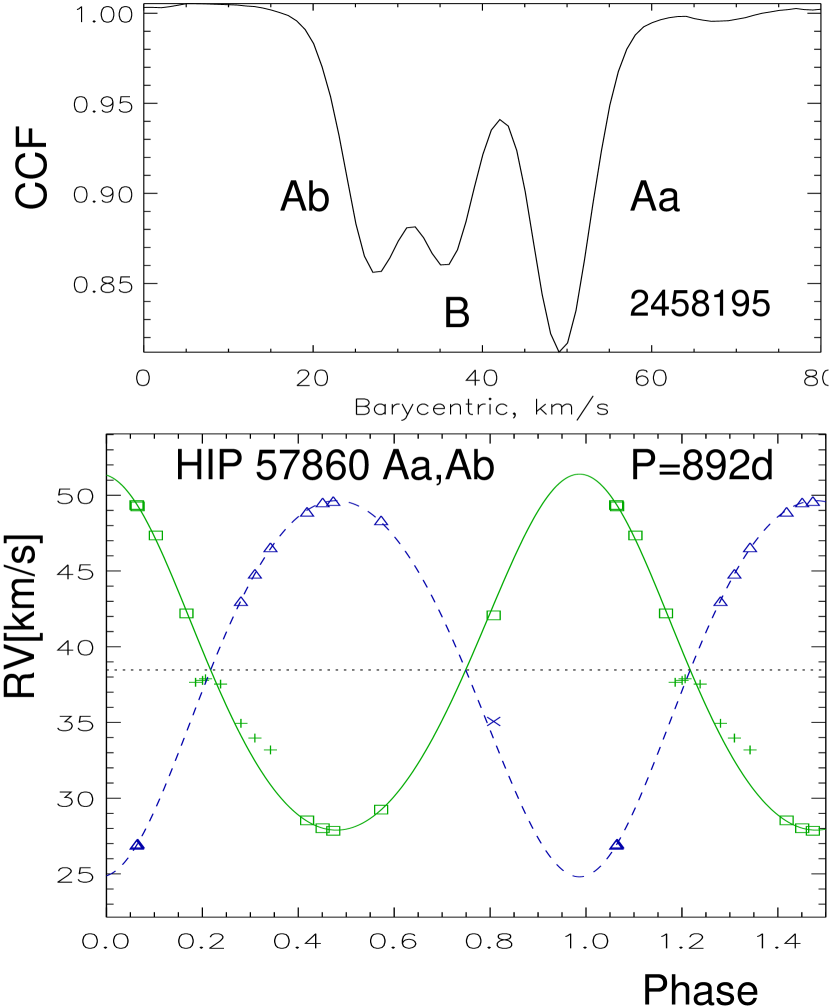
The spectra of this G5V star are triple-lined. The outer pair A,B has been known since 1897 and is designated as SEE 137. The separation is 163. Differential speckle photometry at SOAR yields , mag, Gaia gives mag. The period of A,B is estimated as 900 yr. Gaia measured matching parallaxes and PMs of both components.
Observations with CHIRON lead to a double-lined orbit of Aa,Ab with days and a small eccentricity (Figure 11). The spectroscopic masses of Aa and Ab are 0.66 ans 0.62 , the masses estimated from the absolute magnitudes are 0.97 and 0.92 , suggesting an inclination of 62°. The inner mass ratio is 0.95, the ratio of the dip areas implies mag.
Similar luminosities of Aa and Ab and the estimated semimajor axis of the inner orbit, 28.7 mas, make this pair potentially resolvable by speckle. However, seven observations at SOAR made so far only hint at marginal resolution of the inner subsystem, while the A,B pair is measured.
The RV of the visual secondary B measured from the triple-lined spectra is 36.01 km s-1 with the rms scatter of 0.07 km s-1 . The estimated mass of B is 1.04 , so all three stars in this system are similar. Their lines are narrow, indicating slow axial rotation.
3.10 HD 108938 (Triple)
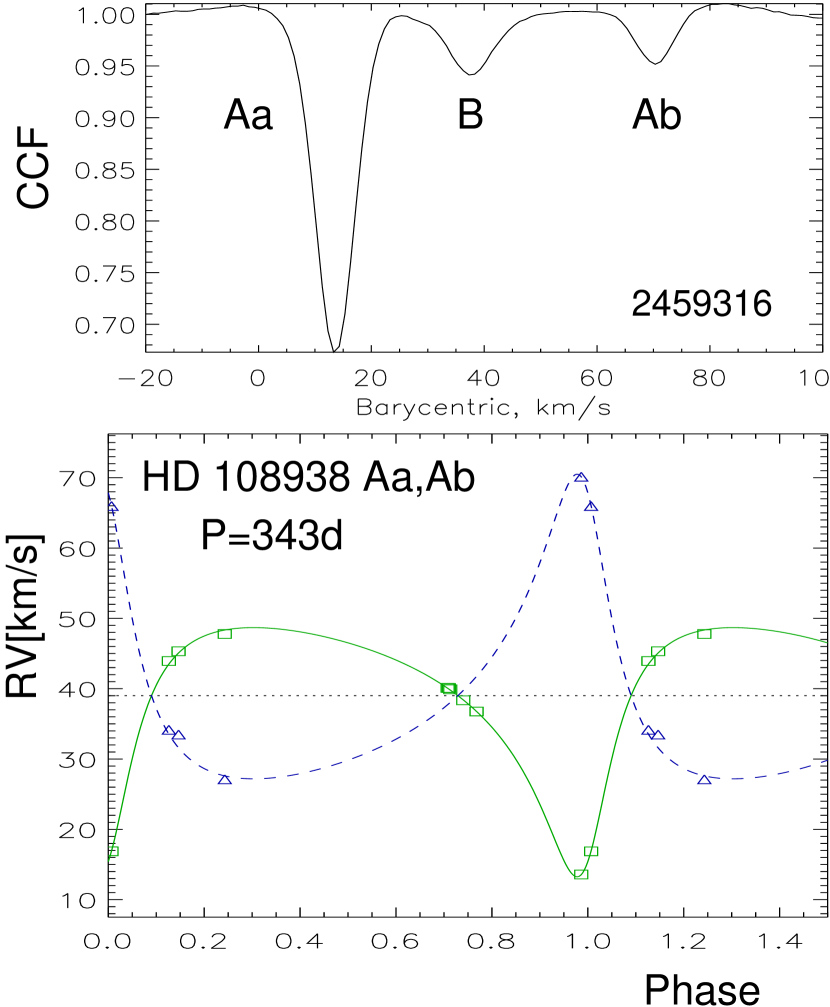
This system is an analogue of the previous one, i.e. a classical visual binary with a triple-lined spectrum. The outer 123 pair A,B has been known since 1934 and is designated as RST 2802. The magnitude differences are mag (SOAR) and mag (Gaia), and the estimated period of A,B is 1.4 kyr. Gaia EDR3 gives a biased parallax of 5.82 mas for A (RUWE=7.1), so the parallax of B, 6.35 mas, is adopted.
The orbit of the subsystem Aa,Ab with days is illustrated in Figure 12. The mass ratio is 0.82 and the magnitude difference estimated from the ratio of the dip areas is mag. The estimated semimajor axis of Aa,Ab is only 8.4 mas, making resolution of the subsystem by speckle an unlikely prospect. However, its astrometric orbit is expected in the future Gaia releases. Comparison of with the estimated masses of Aa and Ab (1.43 and 1.16 ) leads to an inclination of 53°. Stars Aa, Ab, and B are less similar between themselves in comparison to HIP 57860, but also rotate slowly and do not have detectable lithium lines in their spectra. The estimated masses are larger than expected for the spectral type, so the primary might be leaving the main sequence.
3.11 HIP 76400 (Quadruple)
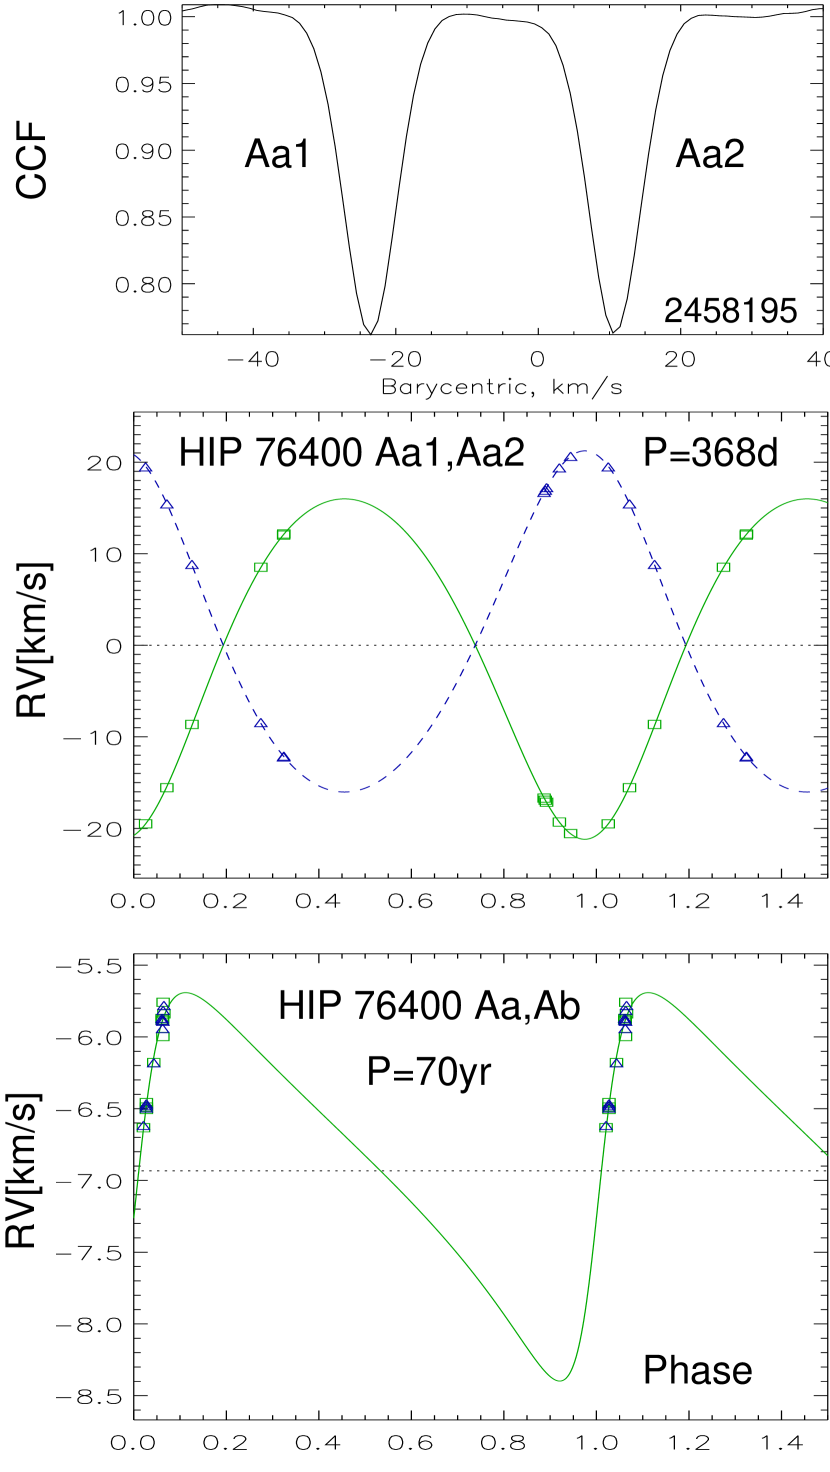
This is a quadruple system of 3+1 hierarchy. A faint ( mag) CPM companion B at 804 separation was discovered from the ground-based data and confirmed by Gaia. The estimated period of this pair is 230 kyr. Astrometric acceleration of the main star (Makarov & Kaplan, 2005) prompted its high-resolution observations at SOAR in 2014, revealing another companion Ab at 019 separation with mag. This companion has been independently found in 2011 by Horch et al. (2017). A preliminary visual orbit of this pair with yr and a 034 axis based on the 140° arc observed in 2011–2021 was determined by the author. Motion of the photocenter predicted by this orbit in 1991.25 and 2015.5 matches the actual , strengthening the orbit and suggesting a mass ratio of 0.25. The masses of B and Ab estimated from their absolute magnitudes are 0.17 and 0.61 respectively.
Nordström et al. (2004) noted that this star had double lines. Monitoring with CHIRON leads to the orbit of the inner pair Aa1,Aa2 with a period of one year shown in Figure 13. The mass ratio of Aa1,Aa2 equals one within error, the CCF dips have the same width and contrast, so this is a perfect twin. No astrometric wobble is expected, therefore the Gaia EDR3 parallax can be trusted (indeed, it equals the parallax of B within errors). Masses of Aa1 and Aa2 estimated from the absolute magnitudes are 1.03 , the spectroscopic masses are 0.96 , hence the inner orbital inclination is 77° or 103°. To account for the small RV trend caused by motion in the visual orbit, I fitted it jointly with the inner orbit using ORBIT3. As the observed arc does not yet constrain the period, I fixed it to 70 yr to match the EDR3 parallax and the estimated mass sum, 2.67 . The outer RV amplitude of 1.4 km s-1 reproduces the observed trend of the systemic velocity of Aa1,Aa2, as shown in the lower panel of Figure 13. The elements of this tentative Aa,Ab orbit are given in table 6; the inclination of 144° indicates that the two orbits are not coplanar.
3.12 HIP 76816 (Quadruple)
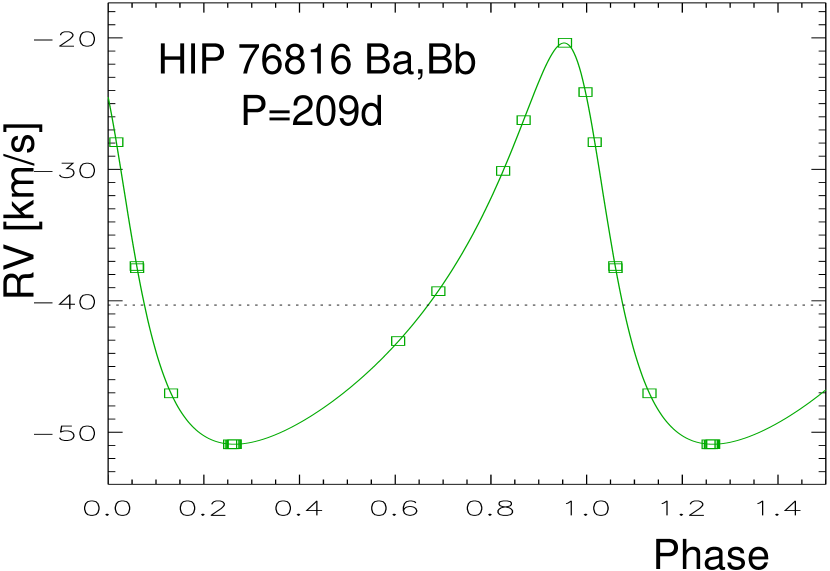
This quadruple system has been presented in Paper 4 of this series (Tokovinin, 2018b), where the double-lined orbit of Aa,Ab with days has been determined. The outer pair A,B (ADS 9743) has a separation of 55. Gaia EDR3 gives concordant parallaxes and PMs of A and B, placing the system at a distance of 308 pc; the estimated period of A,B is 32 kyr. Both A and B are evolved, well above the main sequence.
Early CHIRON observations gave a strong evidence that the RV of star B is variable. Continued monitoring of this component leads to its orbit with days presented in Figure 14. One RV from Desidera et al. (2006) is used to increase the period accuracy. The residuals are very small, 0.016 km s-1 . The estimated mass of Ba is 1.67 , and the minimum mass of Bb is then 0.68 . For reference, the masses of Aa and Ab are 1.72 and 1.27 , respectively. The semimajor axes of the inner subsystems are 0.3 and 2.6 mas, none has been resolved by speckle interferometry at SOAR, and only B gives a marginal evidence of increased astrometric noise in Gaia (RUWE of A and B are 1.1 and 1.6, respectively).
3.13 HIP 81394+81395 (Triple)
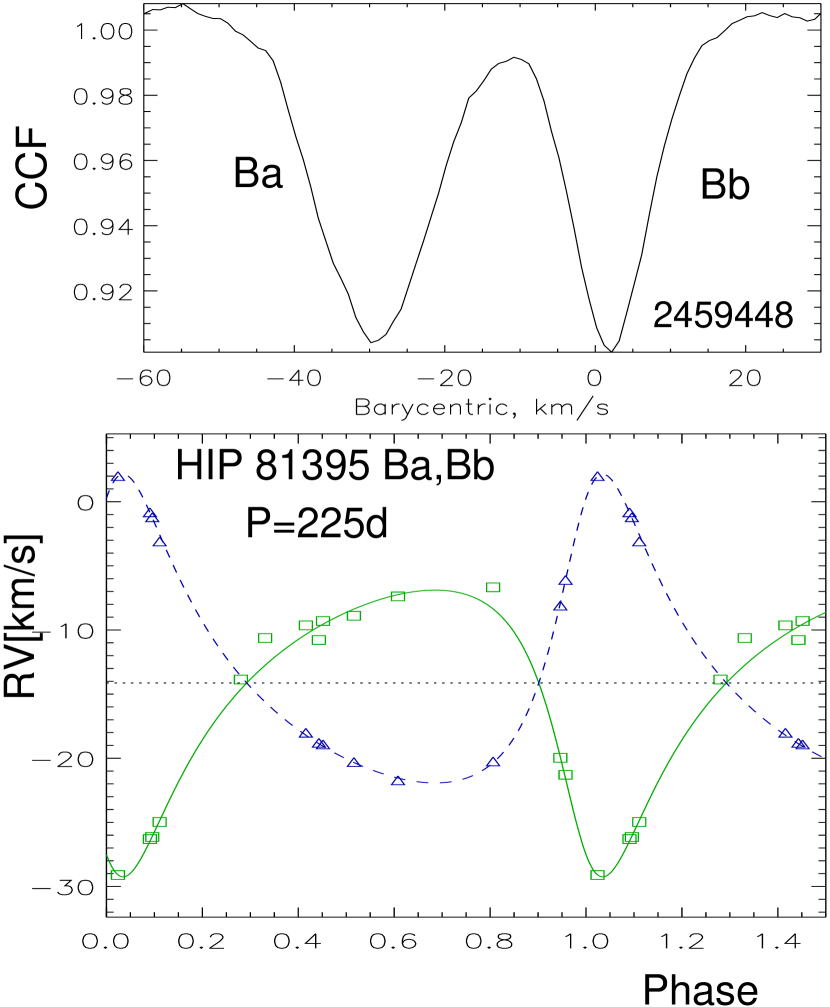
The outer 109 pair of this triple system, HJ 4862, has been first measured by J. Herschel in 1835. Its components have matching parallaxes and PMs in Gaia EDR3, without astrometric acceleration or increased astrometric noise (RUWE of 1.3 and 1.6). The small of these stars computed by Brandt (2018) are marginally significant, but one has to bear in mind that the Hipparcos astrometry of such visual binaries has systematic errors caused by the satellite’s measuring system design.
Double lines in star B were noted by Desidera et al. (2006), prompting its monitoring with CHIRON since 2017. The orbit of Ba,Bb with days is presented in Figure 15. The CCF dips are broad and of low contrast, while the RV amplitudes are small. Reliable fitting of the double dips is possible only near the periastron; in other orbital phases, the RVs derived from the blended dips are uncertain, and they were given low weights in the orbit fit, which also uses the RVs from Desidera et al.
The small RV amplitudes of Ba and Bb are explained by the low inclination of 25°, estimated by comparing the expected mass of Ba, 1.35 , with . The semimajor axis of Ba,Bb is 5 mas. This star was observed by speckle interferometry at SOAR and found unresolved. Stars A and B are evolved (above the main sequence), and A is slightly redder than B.
3.14 HIP 98294 + 98278 (Triple)
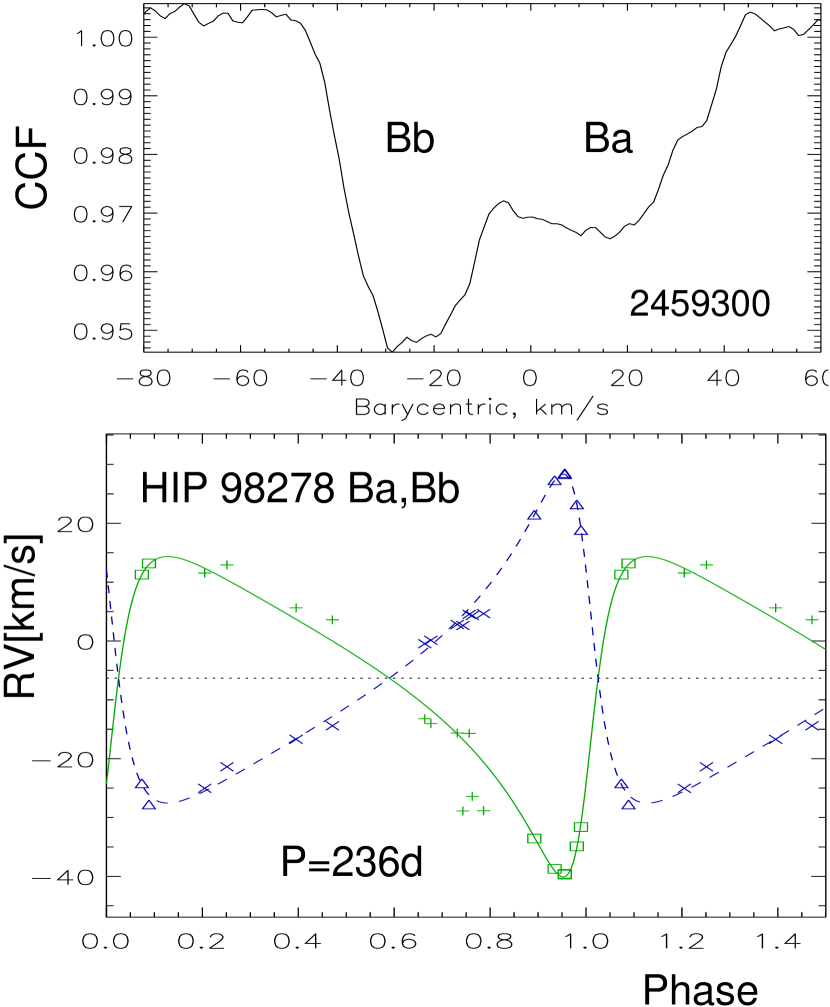
The A9IV star HIP 98294 and the F6V star HIP 98278, at 806 from each other, have common PMs and parallaxes and form a physical pair DUN 229 with an estimated period of 400 kyr.
Nordström et al. (2004) noted that star B has double lines. The CCFs of CHIRON spectra (Figure 16) have shallow, broad, and partially blended dips that are more or less separated only around periastron. The RVs of blended dips were determined by fixing the amplitude of the wide dip belonging to Ba and are given a lower weight in the orbit fit. The residuals are unusually large, as can be appreciated in the RV curve.
The ratio of the dip areas gives a crude estimate of the magnitude difference mag, hence the individual magnitudes are 8.6 and 9.4, and the masses are 1.25 and 1.08 (ratio 0.86). The spectroscopic masses are only slightly less, so the inclination is high, ; the spectroscopically measured mass ratio is 0.97. The semimajor axis of Ba,Bb is 10.5 mas. A small of star B, 0.67 mas yr-1 (Brandt, 2018), is presumably caused by the wobble of the photocenter.
The double-lined pair B is located above the main sequence, as expected, while A is not elevated (unevolved), despite its spectral type A9IV. Lithium lines are detectable in the spectrum of B, confirming relative youth of this system. Assuming that A and B are single stars, Bochanski et al. (2018) estimated an age of 1 Gyr and masses of 1.49 and 1.27 for both components by fitting models to the multi-color photometry. Typically, researchers interested in wide binaries tend to ignore the fact that many of them contain inner subsystems.
3.15 HIP 100420 (Triple)
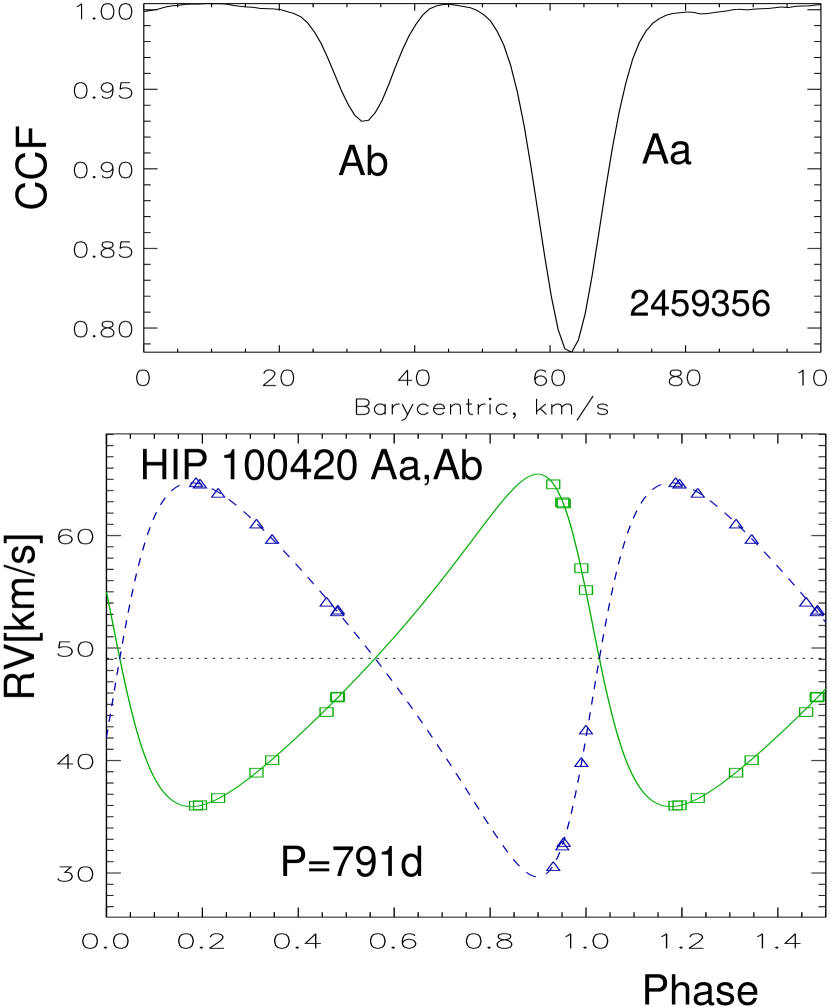
This is a typical triple system, where double lines were found by Nordström et al. (2004) in a visual binary HJ 5189. Its components A and B are separated by 7518 and have a magnitude difference of mag. The period of A,B is 25 kyr. The Gaia astrometry yields common PMs and parallaxes of the components.
Observations of component A with CHIRON confirm is double-lined nature and lead to the orbit with days presented in Figure 17. The mass ratio of the inner pair Aa,Ab is 0.84, and the magnitude difference between Aa and Ab deduced from the dip areas is 1.3 mag. The mass of Aa estimated from the absolute magnitude is 1.53 , larger than expected for an F6V star, and this component is slightly evolved (above the main sequence). The spectroscopic masses of Aa and Ab, , are 1.20 and 1.00 , and the estimated inclination is .
The astrometric acceleration of A detected by Brandt (2018) is likely caused by the 2-yr spectroscopic subsystem. Its semimajor axis is about 13 mas. The center of mass RV of A, 49.1 km s-1 , matches the RV of B, measured from three CHIRON spectra and also by Gaia. It is thus unlikely that star B hosts a subsystem.
4 Discussion
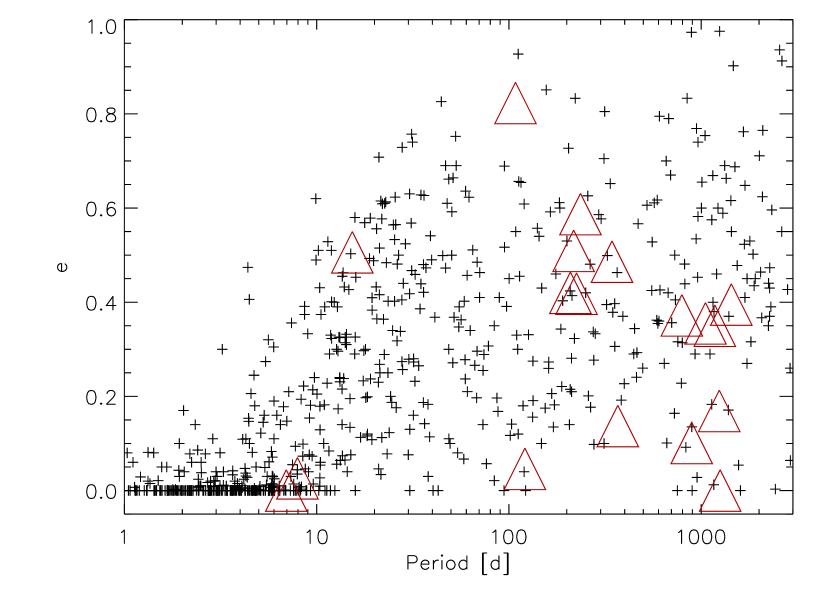
Figure 18 contains a period-eccentricity plot for inner subsystems in hierarchies, updating a similar plot from paper 6. One can appreciate how the accumulation of CHIRON data during several years results in orbits with periods longer than 100 days. The time span needed to compute such orbits must exceed their periods, sometimes substantially. Annual visibility cycles can restrict coverage of certain orbital phases. This is particularly important for the eccentric orbits: a missed periastron must be re-observed in the next cycle(s). The closure of CHIRON in 2020 due to the COVD-19 pandemic also had a negative impact on this program (note the missing coverage of the periastron of a 5-yr orbit in the lower panel of Figure 4). Several preliminary orbits with long periods determined with CHIRON still await additional coverage before becoming publishable (e.g. HIP 41171B, 967 days; HIP 75663A, 623 days; HIP 78163B, 2082 days). The next (and last) paper of this series will present the long-period orbits and the RVs of stars where orbit determination was not possible.
The goal of this program is to obtain a complete orbital statistics for subsystems with periods below 1000 days in nearby solar-type hierarchies. The difficulty of computing such orbits means that many still remain unknown, especially those with large eccentricities. Two orbits presented here occupy the upper envelope of the relation in Figure 18, namely HIP 27970 Aa1,Aa2 ( days, ) and HIP 12548 Ba,Bb ( days, ). Both subsystems have small mass ratios and outer companions on relatively compact orbits. The origin of binary eccentricities is still debated, there are no models of their distribution. Hopefully, the unbiased statistics delivered by this program will help to develop such models. The diverse architecture of stellar hierarchies and its relation to their formation are discussed further in Tokovinin (2021).
The Gaia mission provides a wealth of information on stars, including multiples. This work highlights the caveats of the Gaia astrometry related to multiplicity, namely the missing or biased data. In many cases the future Gaia data releases will rectify this by including orbital motion in the astrometric model. However, the presence of additional nearby companions and motion on several orbits will still present problems. Meanwhile, an elevated RUWE remains a useful diagnostic of potentially problematic Gaia astrometry, as demonstrated here.
References
- Armstrong et al. (2015) Armstrong, D. J., Kirk, J., Lam, K. W. F., et al. 2015, A&A, 579, A19
- Bensby & Lind (2018) Bensby, T., & Lind, K. 2018, A&A, 615, A151
- Bochanski et al. (2018) Bochanski, J. J., Faherty, J. K., Gagné, J., et al. 2018, AJ, 155, 149
- Boro Saikia et al. (2018) Boro Saikia, S., Marvin, C. J., Jeffers, S. V., et al. 2018, A&A, 616, A108
- Brandt (2018) Brandt, T. D. 2018, ApJS, 239, 31
- Chaplin et al. (2015) Chaplin, W. J., Lund, M. N., Handberg, R., et al. 2015, PASP, 127, 1038
- Chubak et al. (2012) Chubak, C., Marcy, G., Fischer, D. A., et al. 2012, arXiv e-prints, arXiv:1207.6212 https://arxiv.org/abs/1207.6212
- Desidera et al. (2006) Desidera, S., Gratton, R. G., Lucatello, S., Claudi, R. U., & Dall, T. H. 2006, A&A, 454, 553
- Gaia Collaboration et al. (2021) Gaia Collaboration, Brown, A. G. A., Vallenari, A., et al. 2021, A&A, 649, A1
- Gorynya & Tokovinin (2018) Gorynya, N. A., & Tokovinin, A. 2018, MNRAS, 475, 1375
- Horch et al. (2017) Horch, E. P., Casetti-Dinescu, D. I., Camarata, M. A., et al. 2017, AJ, 153, 212
- Luck (2018) Luck, R. E. 2018, AJ, 155, 111
- Luyten (1941) Luyten, W. J. 1941, Publications of the Astronomical Observatory University of Minnesota, 3, 1
- Makarov & Kaplan (2005) Makarov, V. V., & Kaplan, G. H. 2005, AJ, 129, 2420
- Mason et al. (2001) Mason, B. D., Wycoff, G. L., Hartkopf, W. I., Douglass, G. G., & Worley, C. E. 2001, AJ, 122, 3466
- Nordström et al. (2004) Nordström, B., Mayor, M., Andersen, J., et al. 2004, A&A, 418, 989
- Paredes et al. (2021) Paredes, L. A., Henry, T. J., Quinn, S. N., et al. 2021, AJ, 162, 176
- Pecaut & Mamajek (2013) Pecaut, M. J., & Mamajek, E. E. 2013, ApJS, 208, 9
- Tokovinin (2011) Tokovinin, A. 2011, AJ, 141, 52
- Tokovinin (2014) —. 2014, AJ, 147, 87
- Tokovinin (2016a) —. 2016a, AJ, 152, 11
- Tokovinin (2016b) —. 2016b, AJ, 152, 10
- Tokovinin (2016c) —. 2016c, Orbit: IDL Software For Visual, Spectroscopic, And Combined Orbits, Zenodo, doi: 10.5281/zenodo.61119
- Tokovinin (2017) —. 2017, ORBIT3: Orbits of Triple Stars, Zenodo, doi: 10.5281/zenodo.321854
- Tokovinin (2018a) —. 2018a, AJ, 156, 48
- Tokovinin (2018b) —. 2018b, AJ, 156, 194
- Tokovinin (2018c) —. 2018c, ApJS, 235, 6
- Tokovinin (2019a) —. 2019a, AJ, 157, 91
- Tokovinin (2019b) —. 2019b, AJ, 158, 222
- Tokovinin (2020a) —. 2020a, AJ, 159, 88
- Tokovinin (2020b) —. 2020b, AJ, 160, 69
- Tokovinin (2021) —. 2021, Universe, 7, 352
- Tokovinin et al. (2018) Tokovinin, A., Corbett, H., Fors, O., et al. 2018, AJ, 156, 120
- Tokovinin et al. (2013) Tokovinin, A., Fischer, D. A., Bonati, M., et al. 2013, PASP, 125, 1336
- Tokovinin et al. (2012) Tokovinin, A., Hartung, M., Hayward, T. L., & Makarov, V. V. 2012, AJ, 144, 7
- Tokovinin & Latham (2017) Tokovinin, A., & Latham, D. W. 2017, ApJ, 838, 54
- Tokovinin et al. (2015a) Tokovinin, A., Latham, D. W., & Mason, B. D. 2015a, AJ, 149, 195
- Tokovinin et al. (2021) Tokovinin, A., Mason, B. D., Mendez, R. A., et al. 2021, AJ, 162, 41
- Tokovinin et al. (2015b) Tokovinin, A., Pribulla, T., & Fischer, D. 2015b, AJ, 149, 8
- van Leeuwen (2007) van Leeuwen, F. 2007, A&A, 474, 653