Role of the companion lensing galaxy in the CLASS gravitational lens B1152+199
Abstract
We reinvestigate the Cosmic Lens All-Sky Survey (CLASS) gravitational lens B1152+199 using archived Hubble Space Telescope (HST) data and Very Long Baseline Interferometry (VLBI) data. A consistent luminosity ratio within effective radius between the host galaxy and the X-galaxy is measured from HST tri-band images, which leads to a mass ratio between the two galaxies as . To determine the role of the X-galaxy in the lens system, we modelled the dual-lens system with constraints from the VLBI-resolved jet components and the HST images. The 8.4-GHz global-VLBI data currently provide the most stringent constraints to the mass model, especially to the radial power-law slope. The optimized models for this two-image three-component radio lens favour a steeper-than-isothermal inner slope. The jet bending in image B was also investigated and it turned out to be rather a misalignment than a curvature. The goodness of fit indicates that the role of the X-galaxy is crucial in the lens system if three pairs of resolved jet components are to be fitted. When we imported the optimal model from radio constraints to optical modelling with the HST tri-band data, the optimization kept the consistency of the optimal model and successfully reproduced the features observed in the HST images. This implies that the diffuse emission discovered in the HST images is actually a detection of the secondary lensing effects from the companion lens.
keywords:
gravitational lensing: strong – galaxies: jets – galaxies: structure – dark matter1 Introduction
Gravitational lensing is an effect of light deflection caused by gravitational fields due to the distribution of lensing masses. According to the different lensing strengths, it can be categorized as strong or weak regimes, where the multiple images or distorted shapes of background galaxies are produced respectively. The strong gravitational lensing provides a dynamics-independent method to infer substructures of mass distribution in lensing galaxies, regardless of whether they are dark or luminous. While the Lambda cold dark matter (CDM) cosmological model has enjoyed great success in predicting large-scale structures in the cosmic microwave background (CMB) observations (Hinshaw et al., 2007), -body simulations in this paradigm tend to over-predict the amount of substructures in smoothed dark matter halos (Navarro et al., 1996) that is yet to be confirmed by observational evidence, especially at galactic scales. Recently, there has been some progress that a large number of dwarf galaxies in the Milky Way have been detected with the Sloan Digital Sky Survey (SDSS) and the Dark Energy Survey (DES) (Bechtol et al., 2015). The galactic-scale hydrodynamical simulations have also been done to investigate the subhalo existence (Despali et al., 2016; Despali & Vegetti, 2017), as well the line-of-sight structures (Gilman et al., 2018; Despali et al., 2018). The tension between CDM model and observations seems mitigated with more newfound Milky Way dwarfs. However, the underdetected substructures in extragalactic early-type galaxies still leave the discrepancy.
Generally, substructures can be inferred from mass modelling, provided the discrete lensing mass can be verified. The direct observable phenomena include the flux-ratio anomalies (Mao & Schneider, 1998; Bradač et al., 2002; Keeton et al., 2003; Biggs et al., 2004; Keeton et al., 2006) and surface brightness anomalies (Vegetti et al., 2012), as well as the time-delay anomalies which is more difficult to detect. The flux-ratio anomaly happens in the event of a caustic crossing in a quad-image system, which violates the cusp or fold relations, while the surface brightness anomaly takes place on the arc or Einstein ring. It should be noticed that there is evidence of galactic-scale discs may account for the flux-ratio anomalies from both the observational and the theoretical perspectives (Hsueh et al., 2016, 2017; Hsueh et al., 2018; Gilman et al., 2018). It is also possible to observe morphological distortions due the presence of a substructure, i.e. the gravitational millilensing (Wambsganss & Paczynski, 1992; Metcalf, 2002). Then, indirect inference can be drawn about the lensing mass, either via a mass or potential reconstruction with non-parametric methods, such as extended structures (arcs and rings) reconstruction via Maximum Likelihood (ML) methods (Koopmans, 2005, e.g.) and point-like structure ensemble modelling (Saha & Williams, 1997). There has been extensive work on non-parametric gravitational potential reconstruction from lensing (Vegetti & Koopmans, 2009; Vegetti et al., 2010, 2012; Vegetti & Vogelsberger, 2014; Vegetti et al., 2018; Ritondale et al., 2019).
There have been several luminous cases in which faint dwarf galaxies have been found, and whereby models were fit to the observables: one is the anomalous flux-ratio in B2045+265 (McKean et al., 2007), another is the single perturbing mass (object X) model in MG0414+0534 (Ros et al., 2000; Kochanek, 2006; MacLeod et al., 2013; Stacey & McKean, 2018), and yet another possible case is MG2016+112 (Koopmans et al., 2002; More et al., 2009; Spingola et al., 2019b). To be noticed, there are still interesting anomaly cases like B1422+231 (Patnaik et al., 1992) in which the perturbing object has not been identified. Additionally, Cohn & Kochanek (2004) have shown that image multiplicities in lenses were mostly produced by substructure-perturbed systems, and many previously discovered simple lens system were detected with satellites (Ros et al., 2000; More et al., 2009; MacLeod et al., 2013; Spingola et al., 2018).
The gravitational lens B1152+199 was discovered through the CLASS survey (Myers et al., 1999) and investigated (Rusin et al., 2002; Metcalf, 2002) as a primary dual-image lens with a possible substructure inference. Higher-frequency radio interferometric observations have also been studied recently (Asadi et al., 2020) to testify the bending significance of the jet. In Rusin et al.’s investigation, there is a faint blob identified as the X galaxy west to the lens galaxy. Due to the inadequate number of observables, there is a degeneracy between the mass profile and the perturber mass. Therefore, no significant effect of the X galaxy on the model could be addressed.
In this paper, we reinvestigate the optical and radio interferometric observations of B1152+199 to date and present the data analysis and lens modellings with regard to the impacts of detected arc-shaped diffuse emission and multi-component images. The role of the satellite galaxy in the lensing configuration is prudently examined, which was not shown in previous literature. Section 2 analyses the HST and VLBI data and raises the question about the diffuse emission and the role of the X-galaxy. Then the answers to the question are inferred by the mass modelling with both point and image constraints in Section 3. Section 4 discusses the observation and modelling results and their implications. Section 5 summarizes our findings and proposes future investigations.
2 Data
2.1 HST observations and data reduction
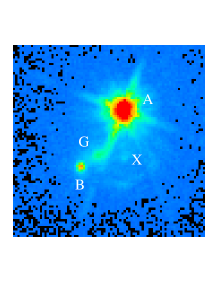
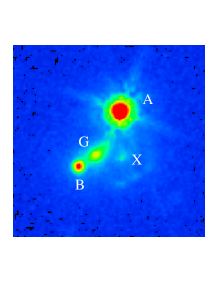
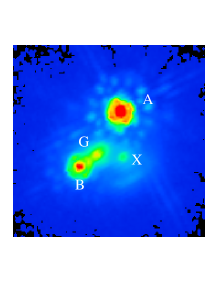
Since the lensing galaxy has not been proved to be radio-loud with interferometric detections, the optical observations then become very useful to provide extra constraints on the lens position and mass profile, as well as to spectroscopically determine the redshifts of images and lenses. To study the lensing configuration of B1152+199, there were several HST observations carried out including imaging with the Wide Field and Planetary Camera 2 (WFPC2) using -band (F555W) and -band (F814W) filters in 2000 (8248, PI: Wilkinson), and imaging with the Near Infrared Camera and Multi-Object Spectrometer (NICMOS) using -band (F160W) filter in 2004 (9744, PI: Kochanek). The lensing galaxy (G) and a satellite galaxy (X) were detected with HST/WFPC2 -band image of this dual-image (A and B) system, and the redshifts of the lens and the source were measured with the Keck II telescope as =0.439 and =1.019 respectively (Rusin et al., 2002). The CfA-Arizona Space Telescope LEns Survey of gravitational lenses (CASTLES) (Kochanek et al., 1999) has maintained an up-to-date catalogue of the HST optical lenses with introductory measurements including B1152+199.
The mass ratio between the lensing galaxy and the X-galaxy is conventionally derived from the Faber-Jackson relation () and the mass-velocity dispersion relation (), together with the magnitude relation (), as done by Rusin et al. (2002). Since the photometry is essential to speculate the mass scale of the X-galaxy, we re-measured the WFPC2 /-band and NICMOS -band photometries of both the lens galaxy and the X-galaxy with the drizzled image data from Hubble Legacy Archive 111 Based on observations made with the NASA/ESA Hubble Space Telescope, and obtained from the Hubble Legacy Archive, which is a collaboration between the Space Telescope Science Institute (STScI/NASA), the Space Telescope European Coordinating Facility (ST-ECF/ESA) and the Canadian Astronomy Data Centre (CADC/NRC/CSA).. Both observations had a long total exposure time (/-band: 2000 sec, -band: 5311 sec), but the integration times are not as long as the total the exposure time, since the HST produces multiple frames for removing cosmic rays, bad pixels and so that the point spread function (PSF) can be better sampled from dithered observations. We found it is difficult to remove the point spread function (PSF) effect in the image merely by fitting the bright point source with the convolution kernel. This is in part due to the dynamic range limitations from having a coarsely sampled PSF, as well as the PSF used will likely not match the colour of the lensed emission, and therefore, the luminosity weighted width of the PSF as a function of frequency will be poorly known. This means there is a mismatch between the PSF and the point-source emission from quasars.
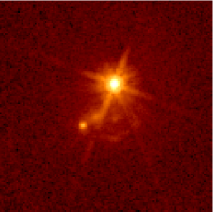
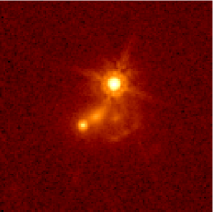
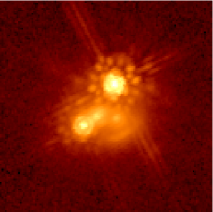
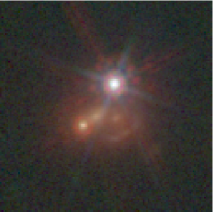
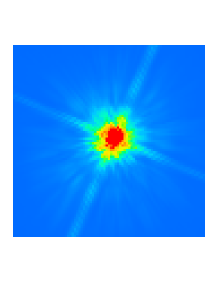
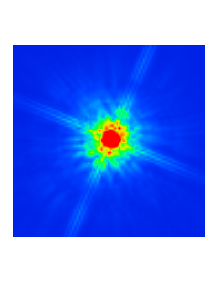
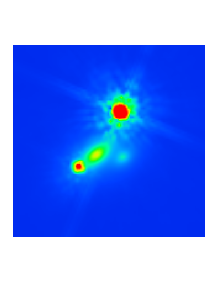
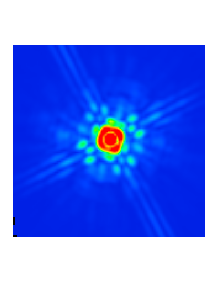
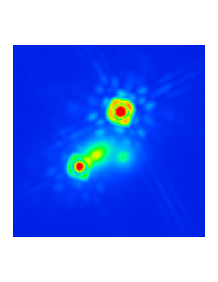
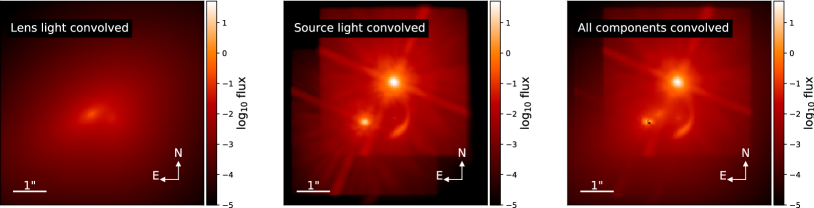
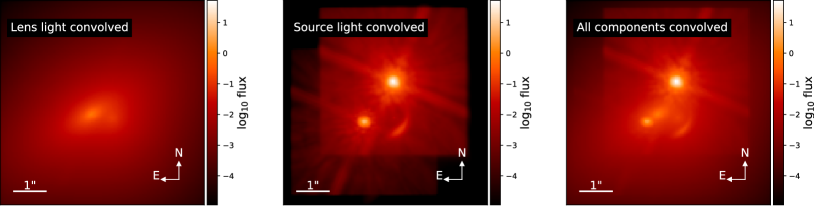
We composed the NICMOS -band and WFPC2 - and -band images into the RGB channels and formed a pseudo-colour image as seen in Fig. 1. From the RGB image, we can notice there are a noticeable amount of emissions around the lens galaxy and the X-galaxy, especially in the - and - band images. The intrinsic emissions from the galaxies are blended with the spread of the lensed light from both A and B images. We have utilized the tinytim222The Hubble Space Telescope PSF generating program by John Krist at STSCI. (Krist, 1993) to generate the PSF of WFPC2 and NICMOS, then convolve and subtracted the models in the HST images retrieved from the Hubble Legacy Archive (HLA). The image-plane model fitting is carried out with the Galfit devised by Peng et al. (2002, 2010). The foreground galaxies were fitted against the Sérsic model and the background quasar images were fitted by the PSF kernel. Obvious the primary image was not representable by a simple PSF due to saturation, and there is a tendency for the X-galaxy to fit the spurious emissions spread from the lensed images with a bigger effective radius. So we masked a significant amount of pixels around the galaxies including all lensed images and the surrounding diffuse emission to reduce the PSF effect. The galfit image models and residuals of tri-band data are shown in Fig. 2. We here list the newly measured photometry and derived mass ratios in Table 1. Their error estimates are the projected covariances as quoted in Galfit (Peng et al., 2002). It is noticeable that the new mass ratio between the host galaxy and the satellite is consistently around 2 across three bands, rather than ranging broadly from 3 to 5 in the previous measurements. This leads to different estimations about the X-galaxy’s total mass and conceivably affects the lens modelling. Though it is arguable whether the optical luminosity of the lensing galaxy is compromised with uncertainty due to dust extinction, we note there the positional angle of fitted Sérsic profiles of the host galaxy and the perturber here in Table 2.
| G mag | 20.880.17 | 20.500.09 | 19.120.02 |
|---|---|---|---|
| X mag | 23.250.38 | 22.140.76 | 20.520.14 |
| 2.980.58 | 2.130.74 | 1.900.12 |
| Host galaxy | X-galaxy | |
|---|---|---|
| (0.44”, 0.89, 0.37, -54.24∘) | (0.17”, 0.62, 0.58, -46.85∘) | |
| (0.08”, 0.13, 0.03, 1.65∘) | (0.06”, 0.39, 0.11, 12.27∘) | |
| (0.35”, 1.39, 0.46, -51.75∘) | (0.29”, 1.68, 0.63, -52.95∘) | |
| (0.03”, 0.12, 0.01, 1.64∘) | (0.23”, 1.00, 0.10, 13.48∘) | |
| (0.29”, 1.72, 0.53, -51.38∘) | (0.17”, 1.14, 0.85, -65.60∘) | |
| (0.01”, 0.05, 0.01, 1.30∘) | (0.03”, 0.25, 0.05, 15.62∘) |
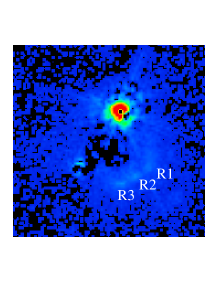
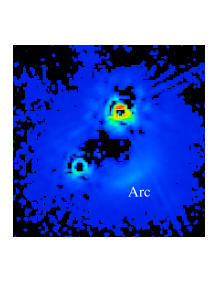
Rusin et al. (2002) had already mentioned the detected diffuse emission to the west of image B in the -band image. To quantitatively estimate whether this extended structure will play a role in the overall lens modelling, we need more observational evidence. As we see in HST multiband images, the diffuse west to image B is barely visible in -band image, when we go to longer wavelengths like I and H bands, it starts to be noticeable. The diffuse emission roughly runs along the tangential direction around the X-galaxy which may form an arc shape. In the -band image, the arc shape is resolved into three faint blobs which resemble a lensing case of the cusp-crossing quad. Comparing the cleaned images to the original drizzled images, we can see that some emissions are restored around the arc region. It could be possible that the arc-shaped emission is purely produced by surrounding interstellar dust, however the recent spectroscopic study on the damped Ly absorption together with the metallicity estimation from the X-ray observation (Dai et al., 2020) found no adequate evidence for the dust existence and thus disfavoured this scheme.
2.2 VLBI observations and data reduction
Precisely measured observables of lensed images are crucial for lens modelling, especially when the substructures are to be identified therein. The Very Long Baseline Interferometry (VLBI) is currently the most powerful method to get highly resolved images for extragalactic radio sources. Since the light extinction is entirely negligible at centimetre wavelengths, the positional and flux constraints obtained from radio interferometry can be used to determine the lens model with more accuracy compared to those in the optical bands. High-resolution VLBI images thus constrain the lens model the most and have been utilized to detect deviations from a smooth mass model (Ros et al., 2000; Bradač et al., 2002; Biggs et al., 2004; Spingola et al., 2018), galactic central profile (Zhang et al., 2007; Quinn et al., 2016), Hubble constant (Biggs et al., 2003; Wucknitz, 2004; Wucknitz et al., 2004), jet proper motion (Spingola et al., 2019b) and new lens discovery survey (Spingola et al., 2019a).
2.2.1 C-band VLBI observations
There have been several VLBI observations carried out on the target of B1152+199 in recent years. Hence, we collected and reduced the archived 5-GHz data from the VLBA333The Very Long Baseline Array is a radio interferometric network run by the National Radio Astronomy Observatory (NRAO) and the EVN444European VLBI Network is coordinated by the Joint Institute for VLBI in Europe (JIVE) in order to obtain milli-arcsecond-scale astrometry of the dual-image lensing systems. The data set includes the VLBA observation (BB133, PI: Biggs) from 2001, the global-VLBI observation (GJ010, PI: Jackson) from 2003 and the High-Sensitive Array (HSA) observation (BW084, PI: Winn) from 2005. All data were recorded with four contiguous 8-MHz intermediate frequencies (IF) and correlated with a channel resolution of 0.5 MHz and a time resolution of 2 s. The global-VLBI observation (GJ010) was recorded only with left circular polarization (LCP), while the other two were obtained with dual circular polarization. The effective on-source integration time of BB133, GJ010 and BW084 was 3.4, 7.7 and 3.5 hours respectively.
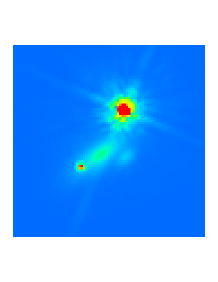
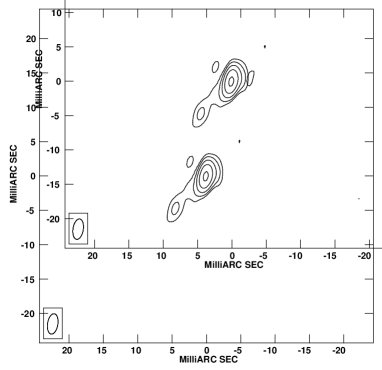
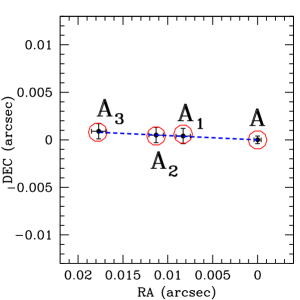
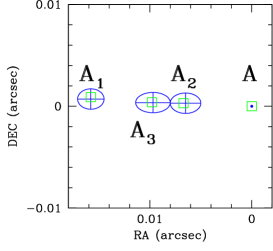
To cross-check the observations, we re-reduced the visibility data of the three epochs to obtain high-dynamic-range images. The data calibration was carried out with aips555The Astronomical Image Processing System distributed by NRAO (National Radio Astronomy Observatory).. Standard procedures for data inspection and flagging, as well as calibration of amplitude, phase and bandpass, and multi-source splitting, have been applied to the three sets of VLBI data using appropriate aips tasks. The self-calibration and deconvolution procedures were carefully used in each case, especially when mapping the jet in image B. To maintain the highest resolution and suppress extended features, we cleaned the uniformly weighted data before self-calibration. The three-epoch cleaned images are shown in Fig. 3. All images are restored to the same 31.5 mas2 beam, and the root mean squared (RMS) map noise was cleaned down to the noise level respectively. The jet in image A has been resolved into at least two components, while in image B there is only one distinguishable component. With the highest sensitivity and resolving power of the HSA, we can see that there is a third jet component just barely resolved between the outermost and innermost components in image A. There were up to three jet components resolved in image A, while there was only one unresolved jet emission protruding out in image B. The discrete jet components were model-fitted in the image plane with aips task jmfit and the errors were estimated by the beam size over signal-to-noise ratio, as shown in Table 3.
It is noticeable that the contour lines of the jet in image B show a slight bending trend, even when the contour lines are raised over 100 Jy bm-1. The slight bending impression is mainly guided by outer contours, so it might come from a non-circular restoring beam and the presence of any unresolved asymmetric structures. To investigate the fidelity of observing a bent jet, we use a flip-subtraction method to check the collimation of a jet (Section A.1). The result shows the jet bending is merely marginal at the first contour level. Metcalf (2002) has elaborately shown that this subtle deflection of the jet can be a strong indication of the existence of local substructures. Undoubtedly, it is possible to add a local compact perturber to account for the local image morphology without changing the overall lensed image properties. Recently Asadi et al. (2020) has also confirmed that the jet bending in image B is non-significant with higher-frequency (22 GHz and 8.4 GHz) VLBI observations.


2.2.2 X-band global-VLBI observation
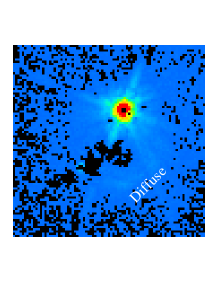
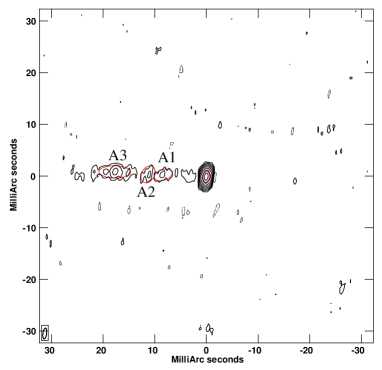
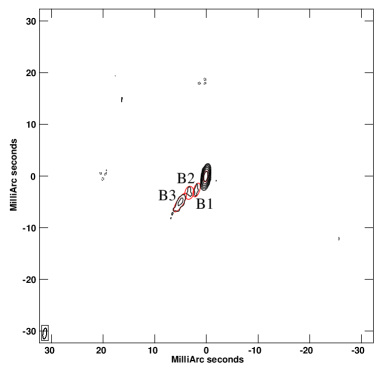
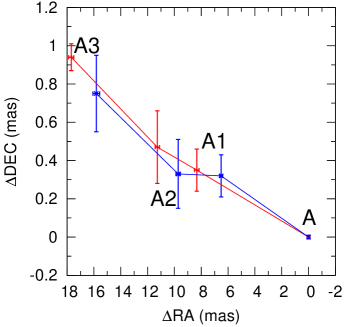
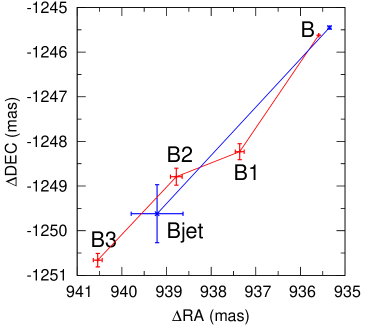
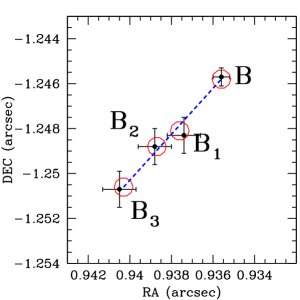
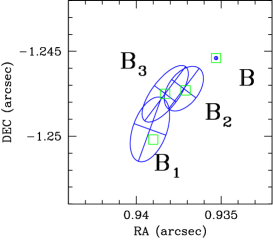
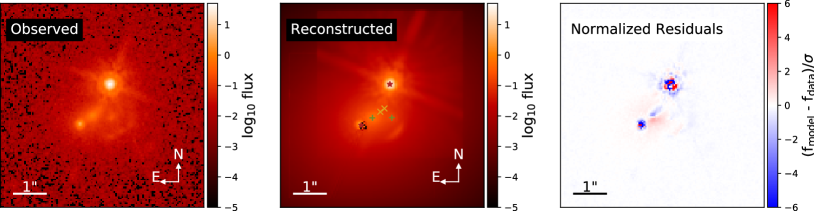
The 8.4-GHz global-VLBI observation (GA036, PI: Asadi) of B1152+199 from 2015 was carried out by Asadi et al. (2020) . It was a full-track observation with 22 telescopes from both EVN and VLBA. The effective on-source integration time of GA036 was around 11 hours. In the original paper of Asadi et al. (2020), the radio jet in image B was resolved into 3 discrete components, which match to the jet components in image A. However, the authors only used the image for morphological comparison between the curvature translations in the A and B images. To extract the observables from each component as mass modelling constraints, we re-reduced the data and produced maps of the A and B images from the archived data. The data came out from the correlator as two passes of pipeline-calibrated data. We found the phase centers of the two passes offset and used aips task uvfix to rectify it and combined the two data set together with task dbcon. Multiple rounds of self-calibrations of solution intervals from two hours down to one minute were applied to solve the phase error and achieve the highest dynamic range. The self-calibration task we used is scimg. The uniform weighting leads to a mottled feature as seen in Asadi et al. (2020), so we use the Briggs weighting scheme with a robustness parameter equal to 4 (Briggs, 1995). The images were restored with a 2.10.7 mas2 beam and the background noise is cleaned down to 29 Jy bm-1. The cleaned images are shown in Fig. 4 and the observables measured from image-plane model-fitting with a 2-dimensional Gaussian are shown in Table 3. The cleaning and image-plane model-fitting are carried out with the aips task imagr and jmfit. We can notice from Fig. 5 that the jet position angle seems not changed over a decade.
| HSA | Flux | RA offset | DEC offset |
|---|---|---|---|
| (5 GHz) | (mJy) | (mas) | (mas) |
| A | 33.41 0.20 | 0.00 0.01 | 0.00 0.01 |
| A1 | 3.91 0.41 | 6.51 0.12 | 0.32 0.11 |
| A2 | 1.92 0.56 | 9.72 0.16 | 0.33 0.18 |
| A3 | 8.73 1.15 | 15.82 0.25 | 0.75 0.20 |
| B | 11.91 0.21 | 935.35 0.01 | -1245.45 0.02 |
| Bjet | 5.07 2.01 | 939.21 0.58 | -1249.62 0.65 |
| g-VLBI | Flux | RA offset | DEC offset |
| (8.4 GHz) | (mJy) | (mas) | (mas) |
| A | 33.95 0.07 | 0.000 0.001 | 0.000 0.001 |
| A1 | 1.24 0.16 | 8.33 0.17 | 0.35 0.11 |
| A2 | 1.14 0.18 | 11.27 0.16 | 0.47 0.19 |
| A3 | 3.63 0.29 | 17.69 0.19 | 0.94 0.07 |
| B | 10.78 0.07 | 935.590 0.001 | -1245.620 0.003 |
| B1 | 0.48 0.11 | 937.36 0.10 | -1248.23 0.18 |
| B2 | 0.58 0.13 | 938.78 0.13 | -1248.79 0.19 |
| B3 | 1.31 0.16 | 940.54 0.10 | -1250.66 0.15 |
3 Lens mass modelling
3.1 Modelling of VLBI data
A typical softened power-law ellipsoid (SPLE) model with elliptical symmetry can be written as a two-dimensional convergence:
| (1) |
where is the power-law index, and for the isothermal case; is the mass scaling factor, i.e. the so-called Einstein radius for circular symmetry; is the core size (for SIE =0); and is the axial ratio. It has been clearly shown from the optical survey from the Sloan Lens Advanced Camera for Survey (SLACS) (Koopmans et al., 2006), the lensing galaxy most likely has an isothermal mass profile. Besides, the core parameter is proved to be insensitive to outer image constraints of a dual-image lens (Zhang et al., 2007). Thus, in our modelling, we fixed and to check in detail to see how the positional observables gradually constrained the primary singular isothermal ellipsoid model.
The HST/WFPC2 -band and HST/NICMOS -band image have both already shown the presence of a lensing galaxy as well as the perturber galaxy X. As such, we defined an object function with complete constraints from observables, including the discrepancies between the observed and predicted image positions and fluxes, the galaxy positions and the mass ratio of the perturber galaxy to the host galaxy, to minimize in the image plane as:
| (2) | ||||
where the observed image positions and fluxes are noted as (,
, ), and the observed galaxy positions are noted as
(, ); all the modelled counterparts are noted without the
prime symbol. The mass ratio derived from photometry is also used as a
constraint, which is reflected in the total . The ratio
between the mass scales of the lensing galaxy () and the X-galaxy
() is noted as . The denominators are the observational
errors, noted as with a subscript corresponding to their
nominators respectively. The in the image plane explicitly
defines the variance between the observational and theoretical
data. The constraints from the multiple jet components are logically
complete. So other lensing properties like image parities, jet
curvatures and position angles can be derived from the alignment of
the jet components. We use the direct observables rather than
the derived constraints in our study because the derived
constraints can have degeneracy and introduce
ambiguity. For example, the same positional angle can be formed with a
reverse alignment of the components which have opposite parity. If
we consider the number of degrees of freedom (NDF
666The NDF calculation:
Para:
Cons:
N.B. the lensing galaxy positions are considered as observable
constraints in this paper.=), the reduced
(=) is approaching 1, if the extent of
the match between observations and estimates is in accord with the
error variance.
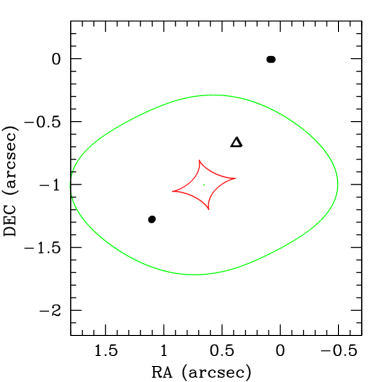
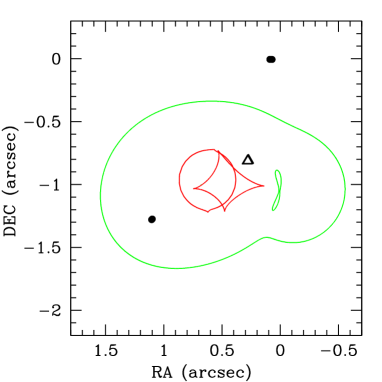
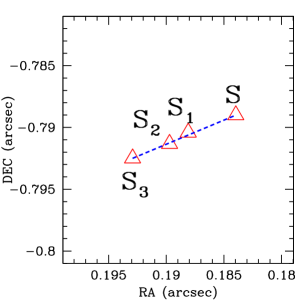
The X-band global-VLBI observation currently provides the highest resolution of this lens system. As the jet components in both image A and image B were resolved at 8.4 GHz, it offers very strong positional and flux constraints to the mass model. The modelling was carried out with the comprehensive modelling program gravlens a.k.a. lensmodel developed by Keeton (2001). Since the radially aligned jet components in image B are sensitive to the radial mass profile, we have tried to optimize the mass model using SIE and SPLE plus external shear, with and without a second perturber respectively. The optimized model parameters are shown in Table 4. We can notice that, the presence of the X-galaxy as a second perturber does give a better fit, while if the slope of the power-law model is allowed to vary, the fit improves but not significantly. The optimal power-law profiles indicate the mass distribution is steeper than isothermal. With the presence of a second perturber, the profile can be steeper, as the mass distribution is sort of compensated by the perturber. The critical curves and caustics of the optimized power-law models are shown in Fig. 6. We can see from the curve configurations that there are degeneracies between ellipticity, external shear and the present mass of the X-galaxy. As the goodness of fit indicated, the X-galaxy is needed to fit the constraints from the three resolved jet components in the 8.4-GHz VLBI images. The best fit is given by a power-law model with an SIS perturber, with a reduced close to unity. The predicted image and source configurations are shown in Fig. 7. As we can see, all modelled jet components are aligned linearly very well, except the B1 component has a slight offset from the alignment.
| SIE + | ||
| = 0.7536 | = 21.73 | |
| = 0.5396 | = 10 | |
| = -0.9645 | ||
| = 0.4596 | ||
| = 84.48 | ||
| = 0.1238 | ||
| = 5.9306 | ||
| SIE + SIS + | ||
| = 0.5516 | = 0.2518 | = 13.87 |
| = 0.5609 | = -0.0564 | = 12 |
| = -0.9752 | = -1.0284 | |
| = 0.4513 | ||
| = 58.64 | ||
| = 0.0826 | ||
| = -45.02 | ||
| SPLE + | ||
| = 0.7530 | = 11.68 | |
| = 0.5321 | = 9 | |
| = -0.9792 | ||
| = 0.5006 | ||
| = -87.53 | ||
| = 0.1012 | ||
| = 20.18 | ||
| = 0.8031 | ||
| SPLE + SIS + | ||
| = 0.6136 | = 0.2328 | = 11.26 |
| = 0.5538 | = -0.0572 | = 11 |
| = -0.9767 | = -1.0260 | |
| = 0.2410 | ||
| = 46.26 | ||
| = 0.1000 | ||
| = -83.44 | ||
| = 0.6716 |
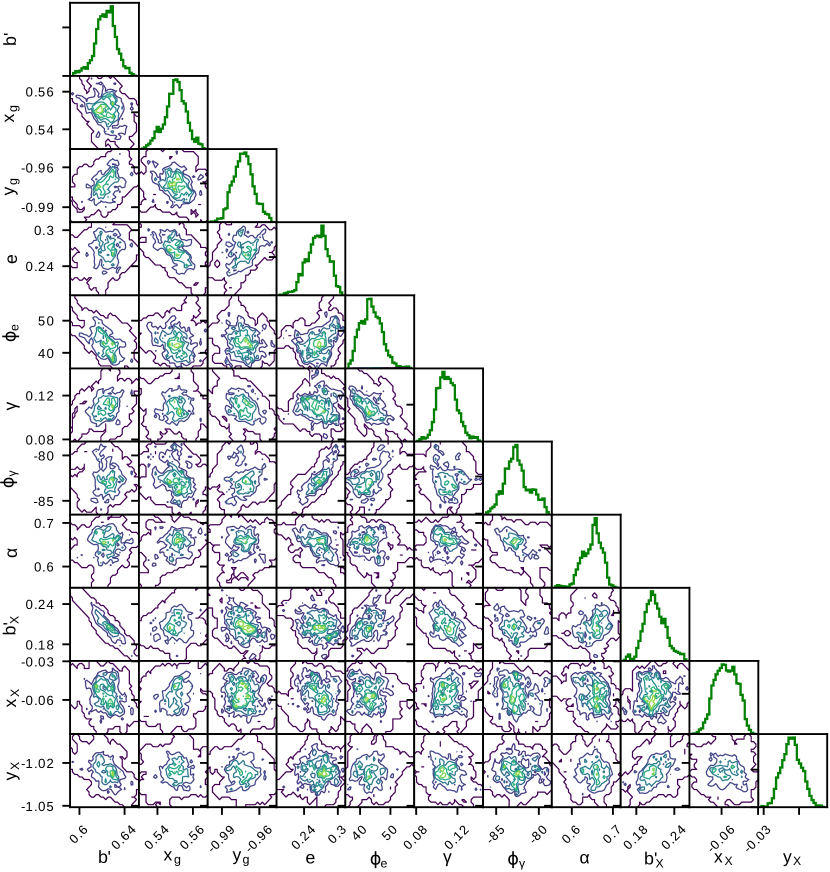
To estimate the uncertainty of optimized parameters, we deploy a Markov chain Monte Carlo (MCMC) realization with 13 adaptive random walks and a maximum step of 10000 through the multi-parameter space. Uniform priors are used for input uncertainties of all observables. The multivariate probability distributions of the lens parameters for the optimal SPLE+SIS+777To avoid the symbol overload confusion, the external shear and power-law index use the slant () and upright () Greek letters respectively. model are shown in Fig. 8. The marginalized posterior distributions of lens parameters are illustrated as the histograms along the diagonal. Other panels show the joint posterior densities of all coupled parameters and resemble the realistic covariances.
3.2 Modelling of HST data
The photometric measurements showed a significant existence of the X-galaxy. The derived photometric mass of this companion galaxy is nearly half of the primary lens’ mass and its impact on the lens system should be checked with lens modelling. Since the discrete blobs and the arc-shape emission are detected in the WFPC2 -band and NICMOS -band images respectively, we need the mass modelling to check its consistency with a dual-lens system.
We carried out the modelling with the lenstronomy program, by using the entire emission from the extended images as constraints. It is a multi-purpose Python package to model strong gravitational lenses which is presented in Birrer & Amara (2018) and is based on Birrer et al. (2015). It does light profile decomposition onto a shapelet basis rather than direct pixelation, which gives it advantages to be used in describing an arbitrary profile within a limited parameter space. Since every pixel in the image is helping to constrain the model, we can investigate a bigger parameter space.
So we did combinatorial modelling trials, by assuming the lens mass model of the host and the companion X-galaxy as a model pair of any two of the following mass model pairs: (SIE, SIS), (SIE, SIE), (SPEP, SPEP) and (SPEMD, SPEMD), where SIS denotes a singular isothermal spheroid mass, SIE denotes a singular isothermal ellipsoid mass, SPEP denotes a softened power-law potential, and SPEMD denotes a smooth power-law mass density. The softening core or smoothing scale was set to approach zero to act as the singular case. All trials were carried out both with external shear and without it. The central position and ellipticity of a mass profile and its light profile are set to be consistent during optimization. The power-law potential and mass density profiles were also tested with varying slopes. Since the source must have a non-delta light profile to contribute the extended emissions in lens modelling, in the optimization, the source profiles were set to Sérsic ellipses. Besides, the lensed images were used as position constraints but they were assigned Sérsic profiles to optimize the light modelling. However, we found it difficult to converge to the same optimal parameters as obtained from the VLBI data modelling with gravlens. This is because the light profiles of the lenses and source need to be optimized simultaneously in lenstronomy, the increased parameter space leads to non-unique solutions especially when the model constraining strength is weak.
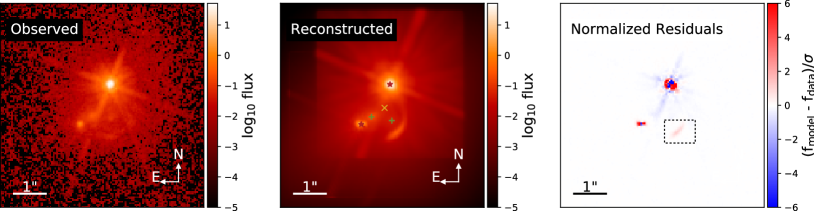
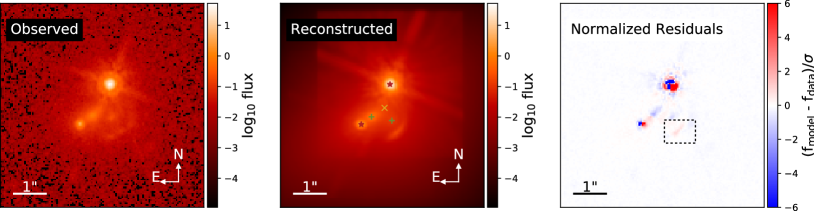
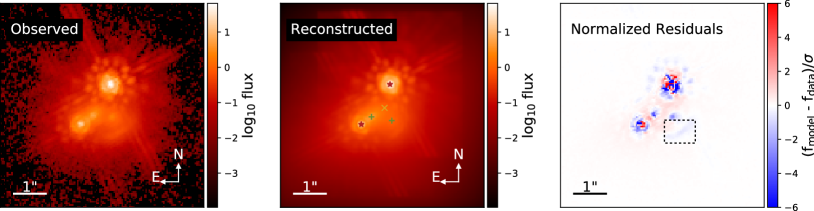
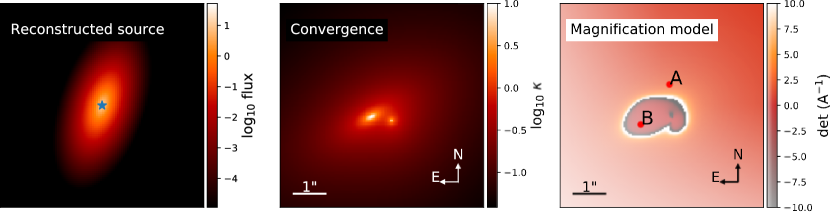
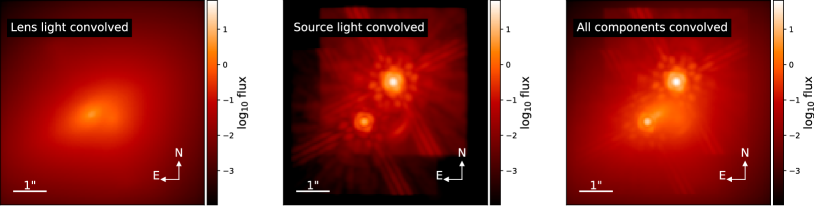
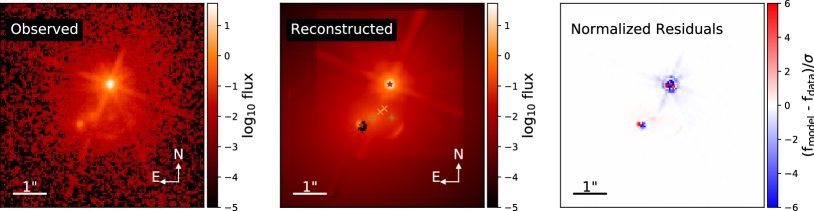
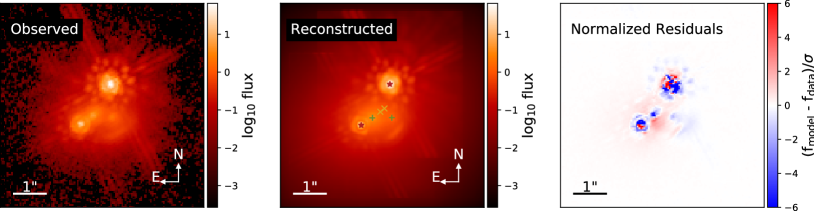
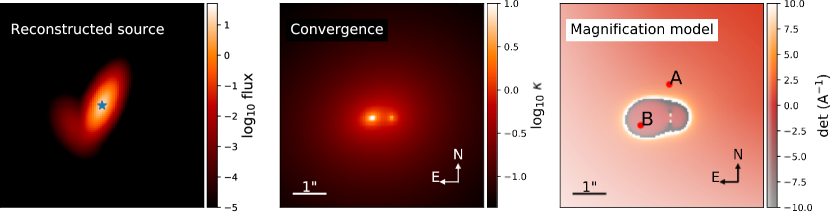
As the lensing objects are the same at the radio and optical bands, the same lens model must reproduce both observations. So we imported the optimal gravlens model for the VLBI 8.4-GHz observation to lenstronomy, and kept the optimized parameters confined within a certain threshold, to see how similar to the HST images that the positions and fluxes of can be reproduced. To keep the dimensionality of the parameter space low, we assumed there is only one background source. The active galactic nucleus (AGN) contributes to the compact emissions in both radio and optical bands, while its host galaxy contributes to the extended emissions in the optical band. All tri-band HST data were used for simultaneous optimization. The optimized results are shown in Fig. 9 and 10, the statistics and optimized model parameters are listed in Table 5 and Table 6. Ideally, the reduced should be close to unity. From the reconstructed source light in the image plane, as shown in Fig. 10, we can see the Einstein ring around the X-galaxy is distorted by the primary lens and the detected diffuse emission is actually a part of the ring. We can notice that the optimal lens model slightly overfitted the HST - and -band data. The average residuals over three bands at the targeted diffuse arc area have been reduced to about 0.7. Taking the source position as a free parameter, we found that the optimized source positions with the radio and optical observations are slightly offset as shown in Table 7.
| Residuals () | |||
|---|---|---|---|
| Full image | Arc box | ||
| -band | 0.81 | 0.90 | 0.27 |
| -band | 0.67 | 0.82 | 0.55 |
| -band | 1.02 | 1.01 | 1.25 |
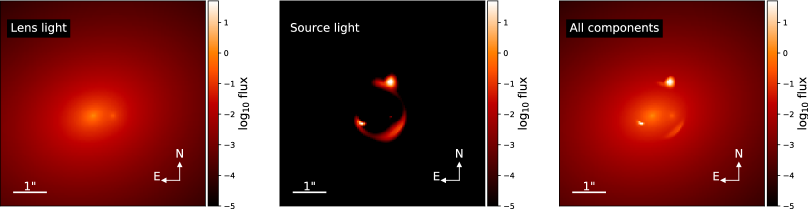
We can see that with a secondary lens - the X-galaxy, the reconstructed tri-band images can practically resemble arc-shaped emission at the observed location. This implies the diffuse emission are highly likely from the lensed background source rather than intrinsically from the host galaxy, such as a spiral arm. From Table 2 and 6, we can see the fitted Sérsic index tends to be non-flattish but not significantly far from a flat index () of a disk galaxy over a bulge-dominated system. Recently Mao et al. (2017) detected differential polarization and Faraday rotation in the two lensed images, which suggests a fairly significant axisymmetric magnetic field in the host galaxy. So, the possibility for the non-smooth light structure of the host galaxy to interfere with the lens system has not totally been ruled out.
| Mass | |||||||
|---|---|---|---|---|---|---|---|
| G | 0.630 | 0.182 | -0.291 | 0.337 | -0.360 | 2.328 | |
| X | 0.233 | -0.299 | -0.480 | ||||
| -0.048 | -0.040 | ||||||
| Light | |||||||
| G | 211.070 | 0.630 | 2.503 | 0.182 | -0.291 | 0.337 | -0.360 |
| X | 53.138 | 0.716 | 1.530 | -0.299 | -0.480 | ||
| S | 4.464e4 | 0.047 | 1.095 | -0.274 | -0.209 | -0.074 | -0.082 |
| Radio (VLBI) | Optical (HST) | |
|---|---|---|
| RA (′′) | 0.1840.020 | 0.1800.006 |
| DEC (′′) | -0.7890.012 | -0.7090.009 |
3.3 Comparison between models for optical and radio datasets
Ideally, the optical models for optical and radio data should converge to the same point in the parameter space. However, this only applies when there is a unique minimization of the model on the same dimensionality of the parameter space and the constraining strength of the observables. Our combinatorial trials have shown the chance to get a consistent model independently from radio and optical data is low.
Fitting to the light profiles in HST images utilizes information from all pixels. Besides the lens mass model, the light profiles of the lens and the source need to be constrained at the same time. The increased observable constraints are competing with the expanded parameter space then. Due to the degeneracy between model parameters, the optimization will face more local minima when the parameter space increases. Advanced algorithms like particle swarm optimization (PSO) hardly mitigate this. Intuitively, different image features imply different optimal models. Unlike the radio emissions, in a galaxy lens, the optical emissions are easily affected by many factors, like the blending between foreground and background emissions, the dust absorptions and even the instrumental deficiency. As we have noticed, the diffuse emission looks different in the HST -band and -band images. Compared with the arc-shape emission in the -band image, the discrete blobs in the -band image give an impression of a quad-image configuration. If we fit each band individually, it is easy to reach the modelling inconsistency. Provided with multi-band data, it is better to optimize the model over the whole bands simultaneously to avoid the discrepancy between individual bands. Nevertheless, the different image features at different bands still need to be explained, such as, by noise or resolution limits. The different appearances of the diffuse emission in HST images are probably due to the instrumentation effect, as the -band image has a lower signal-to-noise ratio but a higher resolution than the -band image.
Unlike the HST image modelling, the modelling of VLBI data utilize accurate positional and flux constraints from the resolved jet components in radio images. Given only the mass model of the lens to be constrained, the VLBI data can help to determine the mass model parameters more precisely with the image-plane optimization, especially with the multi-image multi-component lens examples, like B1152+199. Since the lens model is the same, a practical approach is to use the high-resolution radio observables to constrain the lens mass model first and feed the optimal model to the optical optimization to get the optimal light models of the lenses and source second.
The parametric modelling has shown that the X-galaxy does improve the modelling, given the tight constraints from the 8.4-GHz global VLBI observation. If the pow-law profile is let to vary, the optimal mass model of the primary lens tends to have a steeper-than-SIE slope. When the X-galaxy perturber is added, its mass profile becomes even steeper to compensate for the mass profile extension due to the presence of the X-galaxy. This is consistent with the previous investigation done by Rusin et al. (2002) and Auger (2008).
4 Discussions
Here we propose some topics on the lenses, images, sources, mass and light models with regard to the observations and lens modelling, that need to be discussed as follows.
4.1 Contribution of the X-galaxy
The arc-shaped emission detected in HST/NICMOS -band data conjured up an image of secondarily lensed arc in the lens system. Its convergence centre coincides with the location of the surrounded X-galaxy. Our detailed mass modelling with both HST -, - and -band observations have shown that the X-galaxy does contribute to the optical morphology in the lensed optical images. That means the diffuse emission in HST images is actually the detection of the lensing effects of the companion galaxy.
As we can see from the optical modelling, the diffuse arc is mainly contributed by the extended structure from the host galaxy of the source. So there is no direct lensing effect of the X-galaxy detected in the radio observation. The lensed images are well resolved and serval discrete sub-components can be identified in the 8.4-GHz global VLBI observation. So the observables from those three resolved jet components of this dual-image lens add up to the constraining strength and make it possible to find the subtle contribution of the X-galaxy in fitting to the constraints. Our parametric mass modelling shows that the X-galaxy is required to achieve an optimal fitting to all the observables, especially when handling the misalignment of the jet components in image B. If the radial profile is left as a free parameter, the optimal mass model of the primary lens turns to have a steeper profile as the presented SIS perturber can contribute part of the extended mass distribution in the whole lens system. This could be explained merely as a modelling degeneracy if the direct lensing effects of companion lens have not been detected. In other words, the up-to-date optical and radio observations testify the role of the X-galaxy in this lens system is not ignorable.
4.2 Evidence for a bent jet
B1152+199 is a particularly controversial lensing system, which first provided evidence for substructure lensing because of a bending jet in one of the lensed images and recently was found to not have such change in the jet direction. The possible bent radio jet in one of the lensed images was seen as evidence for a local perturbation in the mass model by CDM substructure (Metcalf, 2002). This has motivated a number of recent observations like Asadi et al. (2020). The 8.4-GHz global VLBI observation has resolved the sub-components in the lensed images with a position accuracy down to about 0.1 mas, as seen in Fig. 4 and 7. We may notice that the sub-components line up very well in each image, except that there is a very slight misalignment for component B1 in image B. The orthogonal distance between B1 and the collimation line is about 0.5 mas. The optimized lens model also reflects this small offset in its predicted image positions. However, it is arguable whether this small offset is enough to depict a bent jet. As asserted by Asadi et al. (2020), it exhibits no apparent milliarcsecond-scale curvature. Nevertheless, our modelling has shown that the lens model can easily tackle this slight misalignment within the given measurement errors, as long as the X-galaxy perturber is considered in the mass model, i.e., no jet curvature or extra substructure is needed for that. This is different from Metcalf (2002)’s approach. We have provided a toy model to produce an evidently bent jet with an SIE+SIS+ lensing configuration in Section A.2.
4.3 Source structures
As the diffuse emission is considered as a secondary lensed feature, it is natural to speculate there is a secondary lensed source, as either independent or attached to the primary one by a certain structure. Assuming that the background source is an AGN abiding in an elliptical host galaxy, our optical modelling shows that the extended structure of the host galaxy spread over the caustics and forms the lensed arc. The radio observations see the radio emissions from the AGN and the optical observations see the optical emissions from both the AGN and the host galaxy.
There are also other possibilities, such as that the compact radio quasar just has an extended companion galaxy to contribute to the diffuse lensed features with itself not being so extended. We should point out that, either the case of an extended host galaxy or the case of an extended companion, is merely a projection along the line of sight. The source components could be in different source planes but coincidentally align along the line of sight, as a discovered case by Gavazzi et al. (2008). We show the modelling of a two-source case in Section A.4.
The light centroid of the background source is roughly 80 mas offset from the position of the radio core as seen in Table 7. This corresponds to a distance scale of 625 pc in the source plane888A flat CDM cosmological model is used ad hoc as , and kms-1Mpc-1.. It is not uncommon to find radio-optical offsets in AGNs (Orosz & Frey, 2013), even in the (CLASS) lens samples (Skipper & Browne, 2018; Spingola & Barnacka, 2020). In the gravitational lens modelling, the source position is self-constrained by ray-tracing image positions back from the image plane to the source plane. The positional observables in the image plane build up a self-relative reference frame. Our lens modelling is proven to be an independent method to measure the relative offset without resorting to an absolute celestial reference frame. Since the offset between the radio and optical core positions of AGNs may indicate a profound evolutionary scenario of the central black hole and the dark matter halo in the host galaxy, the gravitational lensing thus becomes an effective research tool on this topic.
It needs to be mentioned that in the optimized two-source configuration, the optimized source light profile becomes flatter, while the X-galaxy light profile becomes steeper; the radio-optical offset of the primary source is then lowered to 60 mas. Since the secondary source mainly contributes to the extended emissions along the Einstein ring which blends with the emissions from the lens and the bright images of the lensed AGN, its presence does not violate the image number theorem. We can notice from Fig. 10 that, one extra central image is blended with the X-galaxy.
4.4 Inner power-law slope
The CDM halo density profile, as applied to clusters, is shallower than isothermal near the centre and steeper than isothermal near the virial radius (Navarro et al., 2004). While down to the galactic scale, the statistical results from the Sloan SLACS survey (Koopmans et al., 2006) shows that the inner regions of lens galaxies exhibit isothermal density profiles. The optimal lens model obtained from the 8.4-GHz VLBI data modelling has inferred a steeper-than-isothermal inner slope of the primary lens galaxy, which is also verified by the optical modelling with tri-band HST data. Its inconsistency with the statistical results implies the lens galaxy is at a different stage of evolution. It has been found that the lens system with a companion is more likely to have steeper density profiles (Auger, 2008). From the lens modelling point of view, in a nearly-isothermal lens system, if a companion is included in the modelling, the optimization will steepen the inner slope of the primary lens to compensate for the added extended mass profile by the companion. This modelling degeneracy can be broken when the extra lensing effects due to the companion lens are detected. The detection of the diffuse arc in the lens B1152+199 has put the claim of a steeper inner slope on a solid foothold. Dobke et al. (2007) used N-body simulation to demonstrate that the steepening of the density profile is due to the temporary interactions within galaxy groups and will return to isothermality eventually.
4.5 Quad, arc or ring
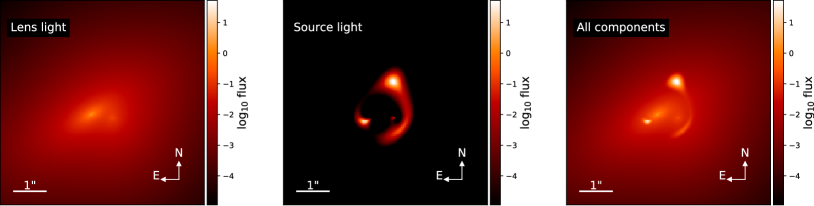
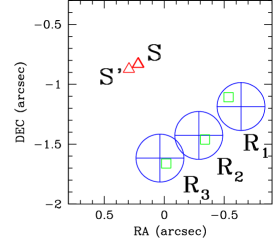
Though the current modelling restores the optical observation to the greatest extent, we still notice that there are subtle differences between the observed diffuse features and the reconstructed emissions. The source light reconstruction in the image plane does show a fractured ring. After the convolution with the PSFs, only the diffuse arc remains visible since other parts of emissions are totally buried in the glows of the two quasar images. As limited by the sensitivities and resolutions of current observations, there is no compact core resolved from the diffuse emission, so it is hard to tell whether the lensing configuration is a quad, arc or ring. Nevertheless, we can notice that the shape of the fractured ring does resemble a quad configuration, which verified our naive speculation from the HST -band image. The only difference is that the model resembles a fold-crossing rather than a cusp-crossing case. As the arc is composed of two extended images (R2, R3) and other two images (including R1) (refer to Fig. 2) are shifted close the primarily lensed images A and B, due to the presence of the primary lens.
If the diffuse arc can be resolved into discrete images, it will definitely add up to the positional observables and help to constrain the lens model to another level. The high-sensitivity infrared observation with the upcoming James Webb Space Telescope (JWST) can definitely have a deeper insight into this lens system.
5 Conclusions
In this paper, we reinvestigated the archived HST/WFPC2 -band and HST/NICMOS -band data as well as the 5-GHz and 8.4-GHz VLBI data of the target lens CLASS B1152+199. Our re-analysis and lens modelling of the archival data, has shown that improved observations are important for astronomers to understand this lens system.
The resolved radio sub-components in lensed images give more direct constraints on the parametric lens model and the image-plane optimization gives more precise estimations on the model parameters. Currently, the 8.4-GHz global-VLBI observation now offers the highest resolution of the discrete jet components in the A and B images. The collimation of the jet components in image B dismisses the previous debate over the jet bending (Asadi et al., 2020). Actually, the jet bending can be proved non-significant with lower resolution data from 5-GHz observation, as shown in Section A.1. Nevertheless, a slight misalignment within 0.5 mas of a B jet component can still be detected. Meanwhile, the model fitting of resolved components gives the strongest up-to-date constraints on the macro mass model. Especially, the radial mass profile may be inferred from the radially aligned jet components. So we tested the observables with SIE and SPLE models plus external shear both with and without an SIS perturber. The optimal models tell us that the companion X-galaxy is needed for better optimization and a steeper-than-isothermal mass profile is thus preferred.
The photometric measurements from tri-band images give a consistent luminosity ratio between the host galaxy and the X-galaxy, which is different from the previous study by Rusin et al. (2002). This leads to a different estimation of the mass ratio between two galaxies, which affects the mass model considerably. Our attention was brought to the diffuse emission that was detected in the HST -band and -band images around the X-galaxy. A careful inspection has revealed that the diffuse arc-shaped emission in the -band image is resolved into three faint blobs in the -band image. We utilized the shapelet modelling program lenstronomy to investigate the possibility of the diffuse emission as a secondary lensed feature by the presence of the X-galaxy. Optical modelling is very useful to reconstruct the morphology of the observed image. However, as there are light profiles of the lens and the source to be constrained at the same time, the expanded parameter space makes its determination of the mass model less effective. So we imported the optimal lens model from the radio modelling to the optical modelling as a reference model to keep the optimizations consistent. The optimization with optical data shows that a power-law ellipsoid with external shear, plus an isothermal spheroid companion, can reproduce the optical features observed in HST images.
An under-constrained lens system leads to parameter degeneracy, so that a subtle observed effect may be explained by many possibilities. It is risky to draw conclusions without considering all the components detected in the lens system. The X-galaxy and diffuse optical emissions were detected from the first discovery of the B1152+199 lens (Rusin et al., 2002). However, it is until the sub-components are fully resolved by the 8.4-GHz globally VLBI observation that the X-galaxy can finally find its role in this lens system. So a high-sensitivity full-track global VLBI follow-up observation is still the most powerful tool to probe the mass distribution of those radio lenses.
Though it is favoured by current mass modelling that the dubious diffuse emission around the X-galaxy in HST images are lensed features from the source, the diffuse emission may still play an important role in further determining the light and mass profiles of the lens and source when a higher-sensitivity-and-resolution observation is achieved. Hence future investigations of this specific lens system with more powerful or technically advanced ground-based or space-based optical telescopes are needed. As shown in the work of Lagattuta et al. (2012), the Keck adaptive optics can provide better constraints than the HST. Proved by the mass modelling, the X-galaxy, as a massive companion satellite of the host galaxy, does play a consequential role in the overall mass model. This kind of companion galaxies are not rare in CLASS lenses, such identified samples as B1608+656 (Myers et al., 1995), B2108+213 (McKean et al., 2005) and B1359+154 (Myers et al., 1999). As a matter of fact, we don’t even know the redshift of the X-galaxy (Rusin et al., 2002), not even mention the redshift of the diffuse emission. The spectrographs of very faint galaxies (30 mag) have been successfully taken by the HST slitless grism and Keck-I Multi-Object Spectrometer For Infra-Red Exploration (MOSFIRE) (Schmidt et al., 2014). Even the detection of the arc-blob emission in another HST filter will give a crude first-order inference on the photometric redshift with the colours. Yet the redshifts of the primary lensing galaxy and the X-galaxy have not been confirmed the same until the present.
Acknowledgements
MZ is grateful to the anonymous referee for the constructive and informative suggestions which helped to improve the paper. We also thank Simon Birrier for his practical insider advice about the lenstronomy code’s behaviours. This work was supported by the National Science Foundation of China (12173078 and 11773062) and the West Light Foundation of Chinese Academy of Sciences (2017-XBQNXZ-A-008). The VLBA is an instrument of the National Radio Astronomy Observatory, a facility of the National Science Foundation operated by Associated Universities, Inc. The European VLBI Network is a joint facility of independent European, African, Asian, and North American radio astronomy institutes. The scientific results from data presented in this publication are derived from the following EVN project codes: BB133, GJ010, BW084 and GA036. This research used observations made with the NASA/ESA Hubble Space Telescope, obtained from the data archive at the Space Telescope Science Institute. STScI is operated by the Association of Universities for Research in Astronomy, Inc. under NASA contract NAS 5-26555.
Data availability
The data underlying this article are available in the Hubble Legacy Archive at https://hla.stsci.edu and the NRAO Science Data Archive at https://archive.nrao.edu.
References
- Asadi et al. (2020) Asadi S., Zackrisson E., Varenius E., Freeland E., Conway J., Wiik K., 2020, MNRAS, 492, 742
- Auger (2008) Auger M. W., 2008, MNRAS, 383, L40
- Bechtol et al. (2015) Bechtol K., et al., 2015, ApJ, 807, 50
- Biggs et al. (2003) Biggs A. D., Wucknitz O., Porcas R. W., Browne I. W. A., Jackson N. J., Mao S., Wilkinson P. N., 2003, MNRAS, 338, 599
- Biggs et al. (2004) Biggs A. D., Browne I. W. A., Jackson N. J., York T., Norbury M. A., McKean J. P., Phillips P. M., 2004, MNRAS, 350, 949
- Birrer & Amara (2018) Birrer S., Amara A., 2018, Physics of the Dark Universe, 22, 189
- Birrer et al. (2015) Birrer S., Amara A., Refregier A., 2015, ApJ, 813, 102
- Bradač et al. (2002) Bradač M., Schneider P., Steinmetz M., Lombardi M., King L. J., Porcas R., 2002, A&A, 388, 373
- Briggs (1995) Briggs D. S., 1995, PhD thesis, New Mexico Institute of Mining and Technology, United States
- Cohn & Kochanek (2004) Cohn J. D., Kochanek C. S., 2004, ApJ, 608, 25
- Dai et al. (2020) Dai X., Bhatiani S., Chen B., 2020, MNRAS, 495, 460
- Despali & Vegetti (2017) Despali G., Vegetti S., 2017, MNRAS, 469, 1997
- Despali et al. (2016) Despali G., Giocoli C., Angulo R. E., Tormen G., Sheth R. K., Baso G., Moscardini L., 2016, MNRAS, 456, 2486
- Despali et al. (2018) Despali G., Vegetti S., White S. D. M., Giocoli C., van den Bosch F. C., 2018, MNRAS, 475, 5424
- Dobke et al. (2007) Dobke B. M., King L. J., Fellhauer M., 2007, MNRAS, 377, 1503
- Gavazzi et al. (2008) Gavazzi R., Treu T., Koopmans L. V. E., Bolton A. S., Moustakas L. A., Burles S., Marshall P. J., 2008, ApJ, 677, 1046
- Gilman et al. (2018) Gilman D., Birrer S., Treu T., Keeton C. R., Nierenberg A., 2018, MNRAS, 481, 819
- Hinshaw et al. (2007) Hinshaw G., et al., 2007, ApJS, 170, 288
- Hsueh et al. (2016) Hsueh J. W., Fassnacht C. D., Vegetti S., McKean J. P., Spingola C., Auger M. W., Koopmans L. V. E., Lagattuta D. J., 2016, MNRAS, 463, L51
- Hsueh et al. (2017) Hsueh J. W., et al., 2017, MNRAS, 469, 3713
- Hsueh et al. (2018) Hsueh J.-W., Despali G., Vegetti S., Xu D. a., Fassnacht C. D., Metcalf R. B., 2018, MNRAS, 475, 2438
- Keeton (2001) Keeton C. R., 2001, ArXiv Astrophysics e-prints: astro-ph/0102340,
- Keeton et al. (2003) Keeton C. R., Gaudi B. S., Petters A. O., 2003, ApJ, 598, 138
- Keeton et al. (2006) Keeton C. R., Burles S., Schechter P. L., Wambsganss J., 2006, ApJ, 639, 1
- Kochanek (2006) Kochanek C. S., 2006, in Meylan G., Jetzer P., North P., Schneider P., Kochanek C. S., Wambsganss J., eds, Saas-Fee Advanced Course 33: Gravitational Lensing: Strong, Weak and Micro. pp 91–268
- Kochanek et al. (1999) Kochanek C. S., Falco E. E., Impey C. D., Lehár J., McLeod B. A., Rix H.-W., 1999, in Holt S., Smith E., eds, American Institute of Physics Conference Series Vol. 470, After the Dark Ages: When Galaxies were Young (the Universe at 2<Z<5). pp 163–175 (arXiv:astro-ph/9811111)
- Koopmans (2005) Koopmans L. V. E., 2005, MNRAS, 363, 1136
- Koopmans et al. (2002) Koopmans L. V. E., Garrett M. A., Blandford R. D., Lawrence C. R., Patnaik A. R., Porcas R. W., 2002, MNRAS, 334, 39
- Koopmans et al. (2006) Koopmans L. V. E., Treu T., Bolton A. S., Burles S., Moustakas L. A., 2006, ApJ, 649, 599
- Krist (1993) Krist J., 1993, in Hanisch R. J., Brissenden R. J. V., Barnes J., eds, Astronomical Society of the Pacific Conference Series Vol. 52, Astronomical Data Analysis Software and Systems II. p. 536
- Lagattuta et al. (2012) Lagattuta D. J., Vegetti S., Fassnacht C. D., Auger M. W., Koopmans L. V. E., McKean J. P., 2012, MNRAS, 424, 2800
- MacLeod et al. (2013) MacLeod C. L., Jones R., Agol E., Kochanek C. S., 2013, ApJ, 773, 35
- Mao & Schneider (1998) Mao S., Schneider P., 1998, MNRAS, 295, 587
- Mao et al. (2017) Mao S. A., et al., 2017, Nature Astronomy, 1, 621
- McKean et al. (2005) McKean J. P., et al., 2005, MNRAS, 356, 1009
- McKean et al. (2007) McKean J. P., et al., 2007, MNRAS, 378, 109
- Metcalf (2002) Metcalf R. B., 2002, ApJ, 580, 696
- More et al. (2009) More A., McKean J. P., More S., Porcas R. W., Koopmans L. V. E., Garrett M. A., 2009, MNRAS, 394, 174
- Myers et al. (1995) Myers S. T., et al., 1995, ApJ, 447, L5
- Myers et al. (1999) Myers S. T., et al., 1999, AJ, 117, 2565
- Navarro et al. (1996) Navarro J. F., Frenk C. S., White S. D. M., 1996, ApJ, 462, 563
- Navarro et al. (2004) Navarro J. F., et al., 2004, MNRAS, 349, 1039
- Orosz & Frey (2013) Orosz G., Frey S., 2013, A&A, 553, A13
- Patnaik et al. (1992) Patnaik A. R., Browne I. W. A., Walsh D., Chaffee F. H., Foltz C. B., 1992, MNRAS, 259, 1P
- Peng et al. (2002) Peng C. Y., Ho L. C., Impey C. D., Rix H.-W., 2002, AJ, 124, 266
- Peng et al. (2010) Peng C. Y., Ho L. C., Impey C. D., Rix H.-W., 2010, AJ, 139, 2097
- Quinn et al. (2016) Quinn J., et al., 2016, MNRAS, 459, 2394
- Ritondale et al. (2019) Ritondale E., Vegetti S., Despali G., Auger M. W., Koopmans L. V. E., McKean J. P., 2019, MNRAS, 485, 2179
- Ros et al. (2000) Ros E., Guirado J. C., Marcaide J. M., Pérez-Torres M. A., Falco E. E., Muñoz J. A., Alberdi A., Lara L., 2000, A&A, 362, 845
- Rusin et al. (2002) Rusin D., Norbury M., Biggs A. D., Marlow D. R., Jackson N. J., Browne I. W. A., Wilkinson P. N., Myers S. T., 2002, MNRAS, 330, 205
- Saha & Williams (1997) Saha P., Williams L. L. R., 1997, MNRAS, 292, 148
- Schmidt et al. (2014) Schmidt K. B., et al., 2014, ApJ, 782, L36
- Skipper & Browne (2018) Skipper C. J., Browne I. W. A., 2018, MNRAS, 475, 5179
- Spingola & Barnacka (2020) Spingola C., Barnacka A., 2020, MNRAS, 494, 2312
- Spingola et al. (2018) Spingola C., McKean J. P., Auger M. W., Fassnacht C. D., Koopmans L. V. E., Lagattuta D. J., Vegetti S., 2018, MNRAS, 478, 4816
- Spingola et al. (2019a) Spingola C., McKean J. P., Lee M., Deller A., Moldon J., 2019a, MNRAS, 483, 2125
- Spingola et al. (2019b) Spingola C., McKean J. P., Massari D., Koopmans L. V. E., 2019b, A&A, 630, A108
- Stacey & McKean (2018) Stacey H. R., McKean J. P., 2018, MNRAS, 481, L40
- Vegetti & Koopmans (2009) Vegetti S., Koopmans L. V. E., 2009, MNRAS, 400, 1583
- Vegetti & Vogelsberger (2014) Vegetti S., Vogelsberger M., 2014, MNRAS, 442, 3598
- Vegetti et al. (2010) Vegetti S., Koopmans L. V. E., Bolton A., Treu T., Gavazzi R., 2010, MNRAS, 408, 1969
- Vegetti et al. (2012) Vegetti S., Lagattuta D. J., McKean J. P., Auger M. W., Fassnacht C. D., Koopmans L. V. E., 2012, Nature, 481, 341
- Vegetti et al. (2018) Vegetti S., Despali G., Lovell M. R., Enzi W., 2018, MNRAS, 481, 3661
- Wambsganss & Paczynski (1992) Wambsganss J., Paczynski B., 1992, ApJ, 397, L1
- Wucknitz (2004) Wucknitz O., 2004, MNRAS, 349, 1
- Wucknitz et al. (2004) Wucknitz O., Biggs A. D., Browne I. W. A., 2004, MNRAS, 349, 14
- Zhang et al. (2007) Zhang M., Jackson N., Porcas R. W., Browne I. W. A., 2007, MNRAS, 377, 1623
Appendix A Extra materials
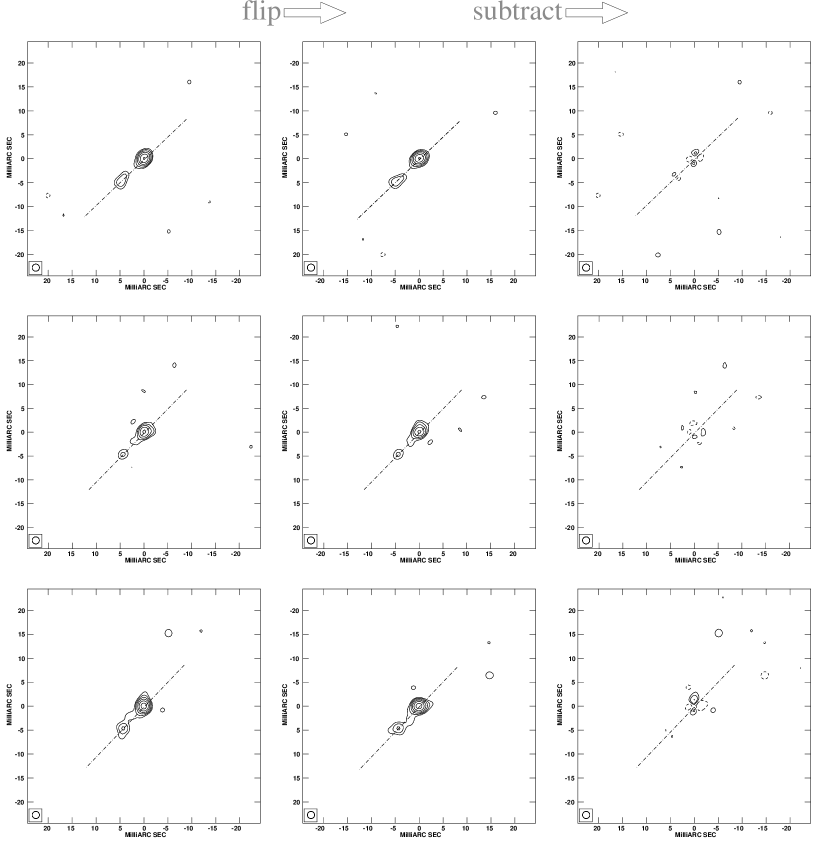
A.1 Jet flip-subtraction
For collimated jet emission, if we flip the image along the collimation axis and subtract mirrored image from the original one, we will find the flux along the collimation axis cancelled. However, if a jet is really bent, its flux cannot be cancelled by flip-subtraction no matter how the collimation axis is chosen. The systematics of the residuals with mirrored parities should be detected for a flip-subtracted bent structure, see Fig. 11. So, rather than using an elliptical beam, we chose a circular beam to restore image B to check for any unbiased shape perception (Fig. 12). The radius of the circular beam is chosen as the minor axis of the original elliptical beam calculated from coverage. Along the major axis direction, the image is thus slightly super-resolved, which may help to trace unresolved components. The collimating axis was determined by the peak positions of the image components. We can see that, when restored with a circular beam, the jet in image B from VLBA and global-VLBI observations looks less bent than that restored with the elliptical beam shown in Fig. 3. Though a slightly noticeable bend can be seen from the contour connection between the core and the jet component in the HSA observation, after flip-subtraction, the marginal jet bending is only at a detection level.

A.2 Toy model to produce a bent jet
Here present a toy model to show that with the companion galaxy as a secondary lens, the macro lens model can produce a bent jet without any extra substructure local to the jet. The exaggerated error ellipses are used to give a greater relaxation for the lens model to move around the image positions. We can see from the middle panel in Fig. 13, merely an SIE+SIS+ model is adequate enough to produce a bent jet if the lensing strength of the companion is emphasized. The diffuse emission as a lensing effect can be treated as a partial Einstein ring, an arc or a quad-image case.
A.3 Parameter translation between gravlens and lenstronomy
We summarize here the parameter conventions of the two modelling
software packages and the conversion between them to facilitate
cross-check and clarify the use of symbols. The gravlens Alpha
model’s parameter set is { , (, ), (,
), }, while the lenstronomy SPEMD
model’s parameter set is accordingly { , (, ),
(, ), }.
Convergence:
| (3) | ||||
| (4) | ||||
| (5) |
Mass scale (1-dimensional):
| (6) | |||
| (7) | |||
| (8) |
Ellipticity:
| (9) | |||
| (10) | |||
| (11) |
External shear:
| (12) |
Power-law index:
| (13) |
A.4 Model case with two background sources
Here we present an example model with two lensed background sources which is optimized with tri-band HST images (see Fig 14). Since the secondary source also contributes to forming the Einstein ring, the primary source needs not to be so extended as shown in Fig. 9 and 10. The optimized model parameters are shown in Table 8
| Mass | |||||||
|---|---|---|---|---|---|---|---|
| G | 0.627 | 0.112 | -0.086 | 0.310 | -0.393 | 2.328 | |
| X | 0.233 | -0.302 | -0.391 | ||||
| -0.094 | -0.007 | ||||||
| Light | |||||||
| G | 178.803 | 0.698 | 2.111 | 0.112 | -0.086 | 0.310 | -0.393 |
| X | 79.702 | 0.279 | 2.161 | -0.302 | -0.391 | ||
| S1 | 1.434e5 | 0.042 | 0.712 | -0.258 | -0.309 | -0.070 | -0.100 |
| S2 | 240.880 | 0.057 | 0.592 | -0.090 | 0.203 | 0.060 | -0.204 |