CH3CN deuteration in the SVS13-A Class I hot corino, SOLIS XV
Abstract
Context. Deuteration is a precious tool for investigating the origin and formation routes of interstellar complex organic molecules in the different stages of the star formation process. Methyl cyanide (CH3CN) is one of the most abundant interstellar complex organic molecules (iCOMs); it is of particular interest because it is among the very few iCOMs detected not only around protostars but also in protoplanetary disks. However, its formation pathways are not well known and only a few measurements of its deuterated isotopologue (CH2DCN) have been made to date.
Aims. We studied the line emission from CH3CN and its deuterated isotopologue CH2DCN towards the prototypical Class I object SVS13-A, where the deuteration of a large number of species has already been reported. Our goal is to measure the CH3CN deuteration in a Class I protostar, for the first time, in order to constrain the CH3CN formation pathways and the chemical evolution from the early prestellar core and Class 0 to the evolved Class I stages.
Methods. We imaged CH2DCN towards SVS13-A using the IRAM NOEMA interferometer at 3mm in the context of the Large Program SOLIS (with a spatial resolution of 1.′′8 1.′′2). The NOEMA images were complemented by the CH3CN and CH2DCN spectra collected by the IRAM-30m Large Program ASAI, which provided an unbiased spectral survey at 3mm, 2mm, and 1.3mm. The observed line emission was analysed using local thermodynamic equilibrium (LTE) and non-LTE large velocity gradient (LVG) approaches.
Results. The NOEMA/SOLIS images of CH2DCN show that this species emits in an unresolved area centred towards the SVS13-A continuum emission peak, suggesting that methyl cyanide and its isotopologues are associated with the hot corino of SVS13-A, previously imaged via other iCOMs. In addition, we detected 41 and 11 ASAI transitions of CH3CN and CH2DCN, respectively, which cover upper level energies (Eup) from 13 to 442 K and from 18 K to 200 K. The non-LTE LVG analysis of the CH3CN lines points to a kinetic temperature of (14020) K, a gas density n 107 cm-3, and an emitting size of 3, in agreement with the hypothesis that CH3CN lines are emitted in the SVS13-A hot corino. The derived [CH2DCN]/[CH3CN] ratio is 9%. This value is consistent with those measured towards prestellar cores and a factor 2-3 higher than those measured in Class 0 protostars.
Conclusions. Contrarily to what expected for other molecular species, the CH3CN deuteration does not show a decrease in SVS13-A with respect to measurements in younger prestellar cores and Class 0 protostars. Finally, we discuss why our new results suggest that CH3CN was likely synthesised via gas-phase reactions and frozen onto the dust grain mantles during the cold prestellar phase.
Key Words.:
Stars: formation – ISM: abundances – ISM: molecules – ISM: individual objects: SVS13-A1 Introduction
In the context of the star formation process, Class I protostars (see e.g. André et al. 1993; Caselli & Ceccarelli 2012, and references therein), with a typical age of 105 yr, are a bridge between the youngest Class 0 protostars (around 104 yr), where the bulk of the material feeding the protostar is still in the envelope, and the protoplanetary disks (around 106 yr). In addition, recently, ALMA showed gaps and rings in the distribution of millimetre dust grains in disks associated with less than 1 Myr, which are thought to be connected with the earliest phases of planet formation (e.g. ALMA Partnership et al., 2015; Sheehan & Eisner, 2017; Fedele et al., 2018; Segura-Cox et al., 2020). These findings suggest that planet formation may occur already in the Class I stage. It is then promising to investigate the physical and chemical properties of the first stages of a Sun-like star and compare them with those found in our Solar System to reveal its early history. In particular, it is not clear yet if the chemical complexity observed in our Solar System is, at least partially, inherited from the prestellar and protostellar phases or if instead there is a substantial chemical evolution. Measuring molecular deuteration (i.e. the abundance of the deuterated form of a molecule, [XD]) with respect to its undeuterated form ([XH]) at the different formation stages of a Sun-like star can help us to address this question.
Emission due to deuterated molecules is commonly observed in all the evolutionary stages, from the prestellar core phase until the formation of a Sun-like star (e.g. Caselli & Ceccarelli 2012, and references therein). These observations can be used to efficiently trace the chemical evolution along the star formation process, as suggested by water deuteration, which decreases with time from protostars to the bodies of our Solar System (Ceccarelli et al., 2014; Furuya et al., 2017; Jensen et al., 2021). More specifically, deuteration is an important tool for the study of hot corinos, which are compact regions around protostars (¡ 100 au) where the temperature is high enough ( 100 K) to sublimate the molecules frozen onto dust mantles in the gas phase. Given the high temperature in the hot corino, the deuteration there is a fossil, a precious record of the processes that occurred at the time of the dust mantle formation when the source was in cold conditions (e.g. Taquet et al. 2012; Aikawa et al. 2012; Codella et al. 2012; Bianchi et al. 2019a, and references therein). Of particular interest is deuteration of interstellar complex organic molecules (iCOMs; Ceccarelli et al., 2017; Herbst & van Dishoeck, 2009), which are the building blocks contributing to prebiotic chemistry. Since the deuteration process is very sensitive to the gas physical conditions, measurements of iCOM deuteration provide important constraints on their origin and formation pathways (e.g. Coutens et al., 2016; Skouteris et al., 2017; Taquet et al., 2019; Manigand et al., 2019; Agúndez, M. et al., 2021). Regarding Class I objects, few sources have been observed using D-species (e.g. Le Gal et al., 2020). Among them, only the SVS13-A hot corino was extensively investigated using several molecular tracers by Codella et al. (2016) and Bianchi et al. (2017, 2019a). These authors showed that H2CO, H2CS, and HC3N have a deuteration similar to that measured towards Class 0 protostars, while CH3OH presents a molecular deuteration that seems to decrease by at least one order of magnitude. We definitely need to measure the molecular deuteration in other species to obtain a more complete and hopefully coherent picture, and to be able to efficiently use astrochemical models (see e.g. Aikawa et al. 2012; Taquet et al. 2019). A step ahead in the comprehension of how deuteration evolves during the star formation process can be obtained using CH3CN. This species can be considered one of the most abundant iCOMs in low-mass star-forming regions. It is also one of the few iCOMs detected in Class 0/I and protoplanetary disks (Codella et al., 2009; Öberg et al., 2014, 2015; Bergner et al., 2018; Loomis et al., 2018; Taquet et al., 2015; Belloche et al., 2020; Yang et al., 2021). In addition, CH3CN has been detected in comets, including towards 67/P in the context of the Rosetta mission (Le Roy et al., 2015; Altwegg et al., 2019). On the other hand, measurement of both CH3CN and CH2DCN in young solar analogues have been reported so far only towards a limited number of objects (Calcutt et al., 2018; Taquet et al., 2019; Agúndez et al., 2019; Cabezas et al., 2021; Yang et al., 2021; Nazari et al., 2021). However, to our knowledge, no specific study on the CH3CN deuteration has been performed yet.
The SVS13-A Class I laboratory: SVS13-A is a young star located in the well-known NGC1333 cluster in the Perseus region at a distance of 299 14 pc, as recently measured by the mission Gaia111http://www.esa.int/Science_Exploration/Space_Science/Gaia_overview(Zucker et al., 2018). The source has been subject of a large number of observational campaigns in different spectral windows (see e.g. Chini et al. 1997; Bachiller et al. 1998; Looney et al. 2000; Chen et al. 2009; Tobin et al. 2016; Lefloch et al. 2018; Ceccarelli et al. 2017; Maury et al. 2019; Diaz-Rodriguez et al. 2021, and references therein). SVS13-A has a bolometric luminosity 50 and a bolometric temperature 188 K, is classified as a Class I source (at least 105 yr, e.g. Chini et al. 1997), and is in turn a close binary source (VLA4A, VLA4B with 03 separation; Anglada et al. 2000). The SVS13-A system is still associated with a large envelope (Lefloch et al., 1998), and it is driving an extended molecular outflow (Lefloch et al., 1998; Codella et al., 1999), as well as the Herbig-Haro chain 7–11 (Reipurth et al., 1993). More recently, a chemically rich hot corino has been detected towards SVS13-A using deuterated water and iCOM line emission (Codella et al., 2016; De Simone et al., 2017; Bianchi et al., 2019b; Belloche et al., 2020; Yang et al., 2021). The hot corino was imaged by De Simone et al. (2017) using HCOCH2OH (glycolaldehyde) emission lines and its size was estimated to be about 90 au (300 mas). In addition, Lefèvre et al. (2017) suggests that the chemical richness observed towards SVS13-A is associated with the VLA4A object. This has been confirmed by Diaz-Rodriguez et al. (2021) using high-angular resolution observations. Very recently, several studies have been focused on the molecular deuteration of SVS13-A, using HDO, CH2DOH, HDCO, D2CO, HDCS, and DC3N (Codella et al., 2016; Bianchi et al., 2017, 2019a). These studies show some conflicting results: they do not suggest a dramatic decrease in deuteration in the observed molecules with respect to the earlier stages represented by the Class 0 protostars, with the exception of methanol. However, no firm conclusion could be drawn, calling for a more extensive study of molecular deuteration in other species.
We present here the first study of CH3CN deuteration in a Class I protostar. The paper is organised as follows. In Sect. 2 we describe the observations. In Sect. 3 we present our results on the CH2DCN spatial distribution and we derive the gas properties (excitation temperature, column density) for CH3CN and CH2DCN, using a non-local thermodynamic equilibrium (LTE) large velocity gradient (LVG) analysis and a LTE rotational diagram analysis, respectively. We discuss in Section 4 the obtained CH3CN deuteration, and we compare it with measurements in other sources. We discuss the possible chemical formation routes in light of our results. Finally, we present our conclusions in Sect. 5.
2 Observations
In this paper we analyse the observations from two complementary datasets. The observations were taken towards SVS13-A, at the coordinates = 03h 29m 0376, = +31 16 030. The first dataset was obtained with the IRAM/NOEMA interferometer222http://www.iram-institute.org/ as part of the Large Program Seeds of Life in Space333http://solis.osug.fr/ (SOLIS; Ceccarelli et al., 2017) and provides high spatial resolution maps of two lines from singly deuterated methyl cyanide (CH2DCN), – and –, whose spectroscopic parameters are reported in Table 1. The second dataset was obtained with the IRAM-30m2 single-dish telescope as part of the Large Program Astrochemical Survey At Iram444http://www.oan.es/asai/ (ASAI; Lefloch et al., 2018) and contains several lines from methyl cyanide and its singly deuterated isotopologue.
2.1 NOEMA/SOLIS
The observations were obtained during two tracks of 1.9 hr and 6.4 hr using nine antennas in A configuration on March 16 and March 24, 2018. The shortest and longest projected baselines are 64 and 760 m, respectively. The field of view is about 60, while the largest angular scale (LAS) is about 4. We used the Polyfix correlator, which covered two frequency ranges, about 80–88 and 96–104 GHz, respectively, with a spectral resolution of 2.0 MHz (6–7 km/s). The calibration was performed following the standard procedures, using GILDAS-CLIC555http://www.iram.fr/IRAMFR/GILDAS. The bandpass was calibrated on 3C84, while the absolute flux was calibrated by observing LkH101, MWC249, and the phase using 0333+321. The final uncertainty on the absolute flux scale is 10. The phase rms was 50∘, the typical precipitable water vapour (pwv) about 5-15 mm, and the system temperature about 50-150 K. The data were self-calibrated in phase only, and the solutions applied to the data spectral cube. Line images were produced by subtracting the continuum image (derived using line-free channels), using natural weighting, and restored with a clean beam of 1.′′8 1.′′2 (PA= 39∘). The rms noise in the broad-band cubes at the CH2DCN frequencies is 0.7 mJy/beam.
2.2 IRAM/ASAI
The reported observations were obtained during several runs between 2012 and 2014, as described by Lefloch et al. (2018). They provide an unbiased spectral survey towards SVS13-A of the 3 mm (80–116 GHz), 2 mm (129–173 GHz), and 1.3 mm (200–276 GHz) bands accessible with IRAM-30m. In this work, we report and analyse all the CH3CN, and CH2DCN lines falling in these bands. The telescope half power beam width (HPBW) ranges from 9 at 276 GHz to 30 at 80 GHz. The observations were acquired in wobbler switching mode with a 180 throw. The broad-band EMIR receivers were used, connected to the FTS200 backends, which provide a spectral resolution of 200 kHz, corresponding to channels of 0.7 (at 3 mm) to 0.2 km/s (1 mm). The pointing error was found to be less than 3, while the uncertainty on the calibration is from 10% (3 mm) to 20% (1 mm). At the frequencies of the observed CH3CN and CH2DCN lines, the rms noise (in scale) ranges from 2 (3 mm) to 35 mK (1 mm).
3 Results
3.1 NOEMA/SOLIS results: CH2DCN emission maps.
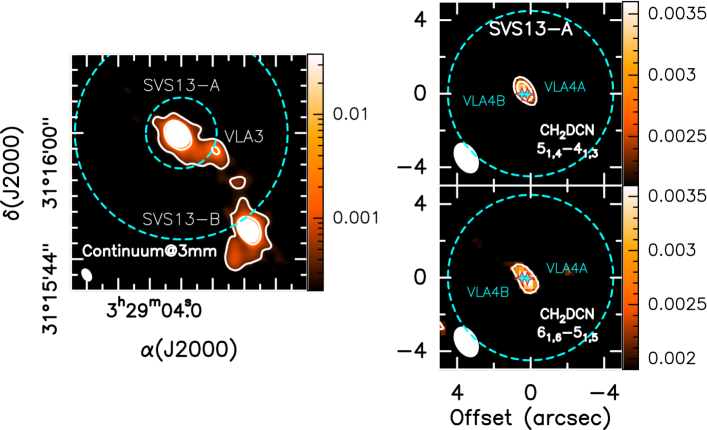
Figure 1 shows the spatial distribution of the dust continuum emission at 3 mm. In addition to SVS13-A, two other Class 0 objects, VLA3 and SVS13-B, are detected in the primary beam of NOEMA observations. All measured positions are in agreement with those previously derived at millimetre wavelengths (e.g. Maury et al., 2019): SVS13-A: 03h29m03s.757, +31∘16′0374; VLA3: 03h29m03s.386, +31∘16′0156; SVS13-B: 03h29m03s.064, +31∘15′5150. The continuum towards SVS13-A has a roundish shape with a diameter of about 4′′, corresponding to about 1200 au. This emission very likely probes the dense and warm inner envelope surrounding the central protostar. In the same figure we show the spatial distribution of the emission from the two CH2DCN lines, whose spectroscopic parameters are reported in Table LABEL:table:CH3CN-lines. Figure 2 shows the spectra extracted at the peak position. Contrarily to the continuum, the line emission is only detected towards SVS13-A and it is unresolved by the NOEMA beam at 3mm; it has a diameter of less than about 15 or 450 au. This suggests that the CH2DCN lines trace the inner part of the envelope and/or the hot corino of SVS13-A, where icy dust grain mantles sublimate, releasing their content in the gas phase. The hypothesis that the emitting region of methyl cyanide and its isotopologue is the hot corino region is further confirmed by the CH3CN non-LTE analysis (Sect. 3.3).
3.2 IRAM/ASAI results: CH3CN and CH2DCN
The full coverage of the 3, 2, and 1 mm bands with the IRAM-30m antenna enabled the detection of 41 lines from CH3CN and 7 lines from CH2DCN covering 11 transitions. Line identification was performed using the Jet Propulsion Laboratory (JPL666https://spec.jpl.nasa.gov/; Pickett et al. 1998) and Cologne Database for Molecular Spectroscopy (CDMS777https://cdms.astro.uni-koeln.de/; Müller et al. 2005) molecular data bases, and double-checked with the GILDAS Weeds package (Maret et al., 2011). For CH3CN, all the detected lines have a signal-to-noise ratio higher than 5, while for CH2DCN four of the detected lines have a signal-to-noise ratio higher than 5 while other three have a signal-to-noise ratio between 5 and 3. Since the beam is a function of the frequency, lines from different bands probe different regions, as shown in Fig. 1. While the beams in the 3 and 2 mm band also intercept emission from VLA3 and SVS13-B, the emission from lines lying in the 1 mm band is dominated by SVS13-A. Finally, we carefully checked that these lines are not blended with emission due to other species.
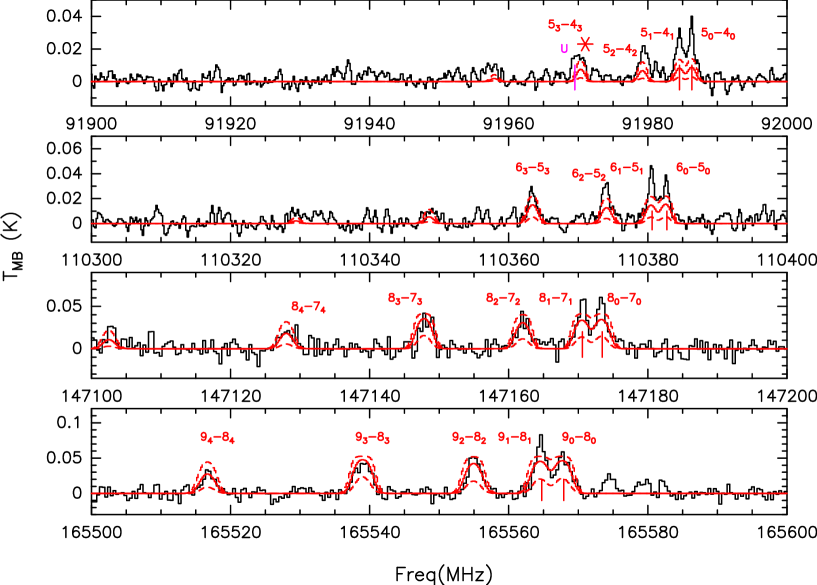
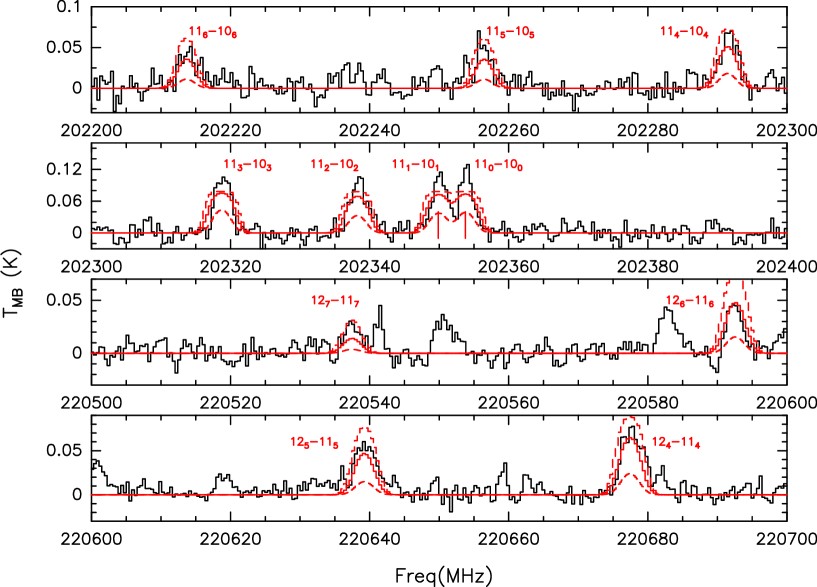
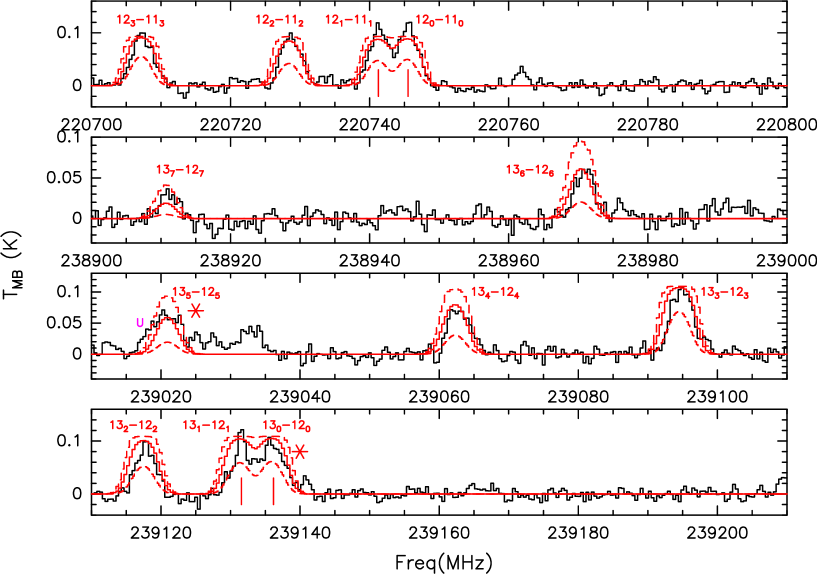
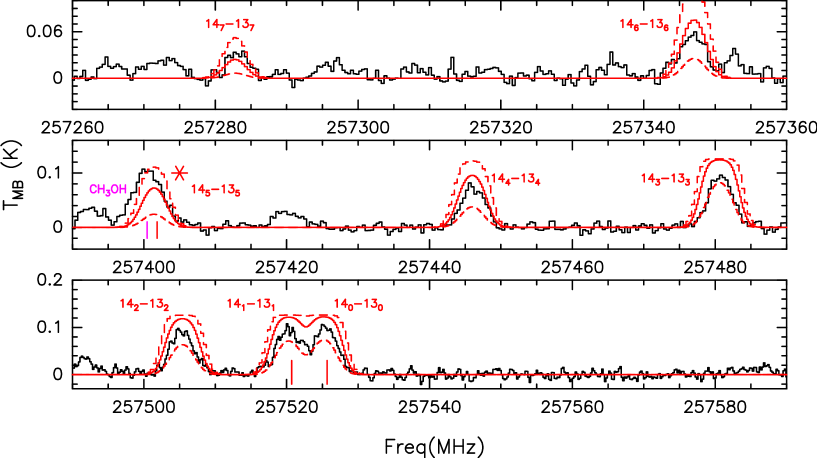
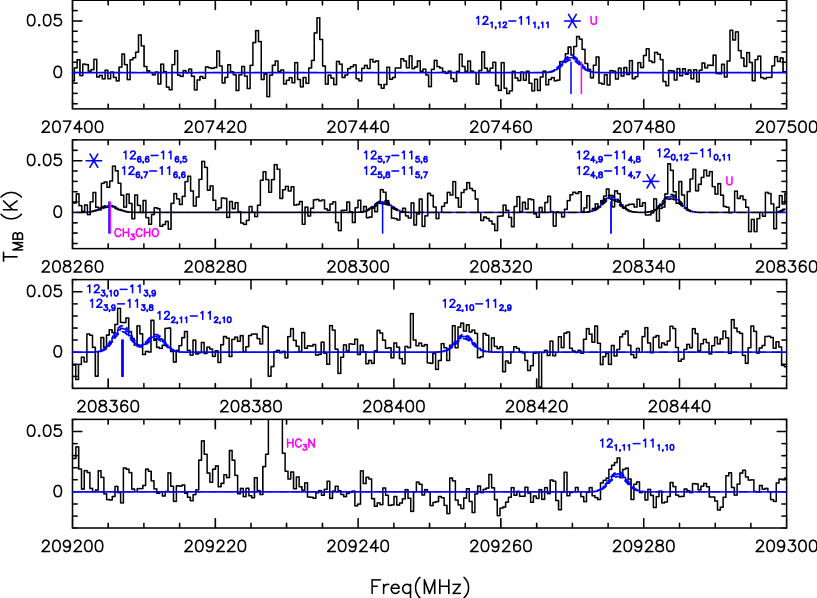
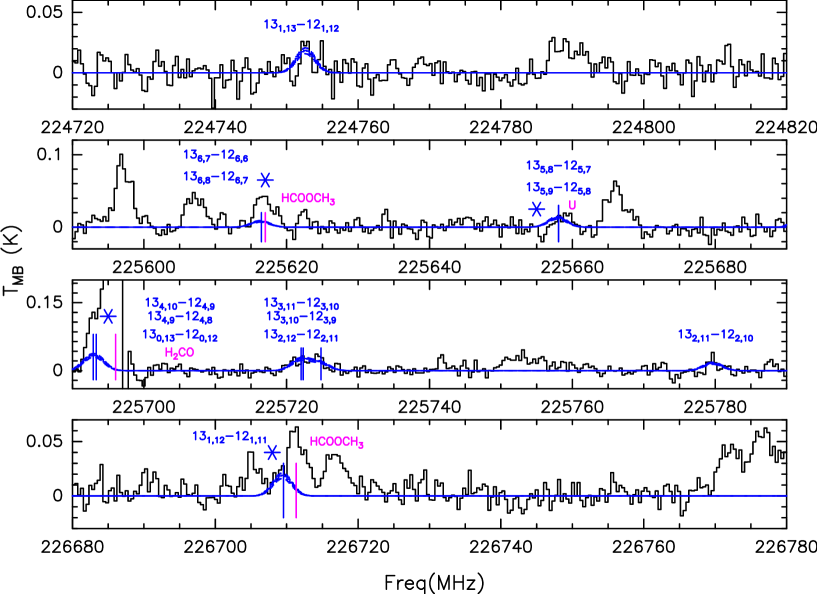
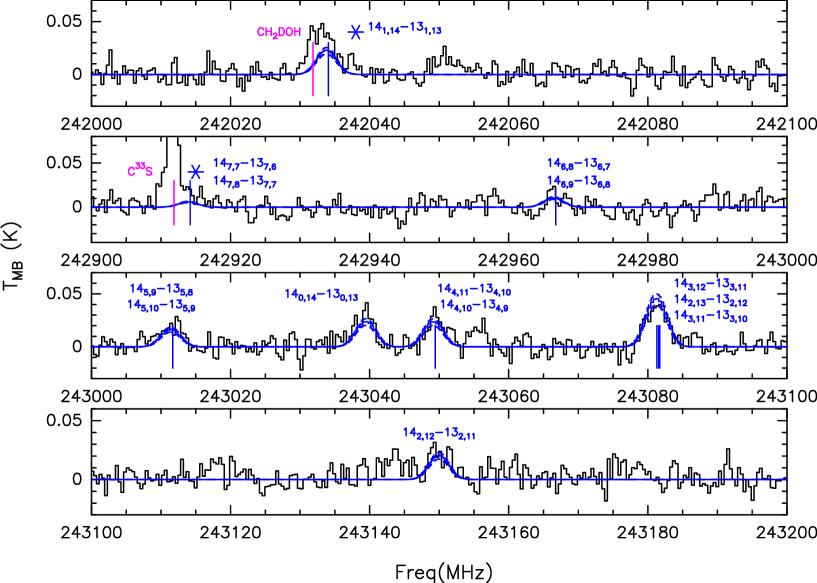
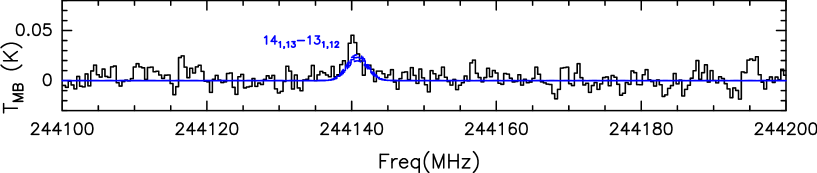
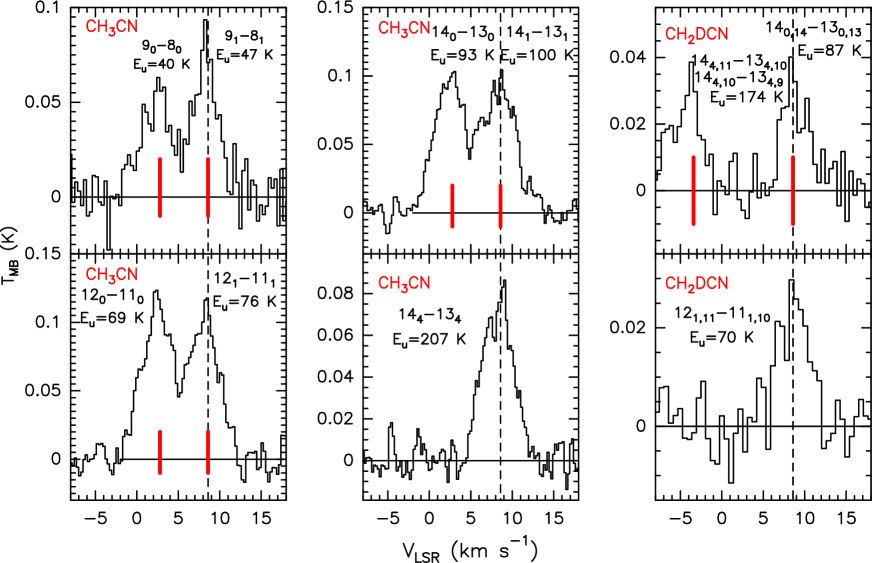
All the detected lines were fitted using the GILDAS5 CLASS package and assuming Gaussian profiles. All the lines peak at velocities close to the SVS13-A systemic velocity vsys = +8.6 km s-1 (e.g. Chen et al., 2009). Figure 3 shows a representative sample of the detected lines, while Table LABEL:table:CH3CN-lines reports the list of all detections with their spectroscopic and derived line parameters, namely the integrated line intensity (), the line full width at half maximum (FWHM), the line peak velocity (), and the main beam temperature (in scale). The whole ASAI CH3CN and CH2DCN spectra are shown in the Appendix (see Fig. 11 and Fig. 12).
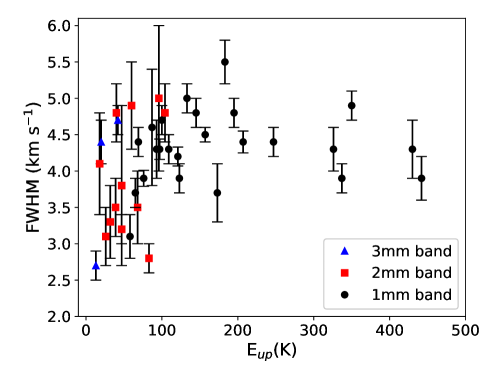
The detected CH3CN lines cover the 5K–4K to 14K–13K spectral ladders and their upper level energies (Eup) range from 13 K to 442 K. They are detected in all three of the ASAI bands, even though most of them (24/41) are detected at 1 mm. The observed CH3CN line emission could be associated with the relatively extended cold envelope and the sum of SVS13-A, SVS13-B, and VLA3 in the bands at 3 and 2 mm, whereas the band at 1 mm encompasses only SVS13-A. A different origin of the line emission in the three bands is also suggested by the FWHM of the CH3CN lines which ranges from 2.7 km s-1 to 5.5 km s-1. In order to better constrain the spatial origin of the CH3CN line emission in the ASAI dataset, we plotted the line FWHM as a function of the line upper level energy in Fig. 4. A trend is evident: while the highest excitation lines (up to more than 400 K) always show line widths larger than 4 km s-1, the lowest excitation lines show a large spread in the line width distribution, with values down to 2.7 km s-1. This suggests that low-excitation lines can be contaminated by the extended cold envelope (see e.g. Ceccarelli et al., 2003). We note that all the lines observed in the 1 mm band have upper level energy higher than 60 K and larger FWHMs, indicating that they are dominated by emission from the SVS13-A hot corino. The CH2DCN lines are only detected in the 1 mm band and they all have high upper level energies, between 70 and 200 K. Therefore, they are very likely exclusively emitted in the hot corino of SVS13-A (see also § 3.1). The two CH2DCN lines detected with NOEMA/SOLIS are not detected by the ASAI survey. We verified that this is due to beam dilution (the comparison between SOLIS and ASAI spectra is shown in Fig. 10).

3.3 CH3CN non-LTE analysis
In order to estimate the physical conditions of the methyl cyanide emitting gas, namely gas temperature, density, and CH3CN column density, we used the non-LTE LVG code grelvg described in Ceccarelli et al. (2003). We used the collisional coefficients of CH3CN with H2, scaled from He, computed by Green (1986) between 20 and 140 K and for J25. The coefficients were retrieved from the LAMDA888https://home.strw.leidenuniv.nl/~moldata/ database (Schöier et al., 2005), where values are extrapolated for temperatures higher than 140 K. We assumed a semi-infinite slab geometry to compute the line escape probability (Scoville & Solomon, 1974) and adopted a line width equal to 4.5 km s-1, as indicated by the observations (see Table LABEL:table:CH3CN-lines and Fig. 4).
We consider for our analysis the CH3CN lines in the 1 mm band, specifically with frequencies higher than 202 GHz, in order to avoid possible emission from SVS13-B, which falls in the 27 beam at 3mm, and to probe only the gas in the hot corino of SVS13-A. We ran a large grid of models (3000) varying the kinetic temperature Tkin from 50 to 200 K, the H2 density n from 105 to 108 cm-3, and the CH3CN column density N(CH3CN) from 1015 to 1018 cm-2. We then fitted the measured CH3CN velocity-integrated line intensities via comparison with those predicted by the grelvg model, leaving Tkin, n, N(CH3CN), and the emitting size as free parameters. We note that, in the fitting, we added 20% of calibration uncertainty to the statistical errors listed in Table LABEL:table:CH3CN-lines.
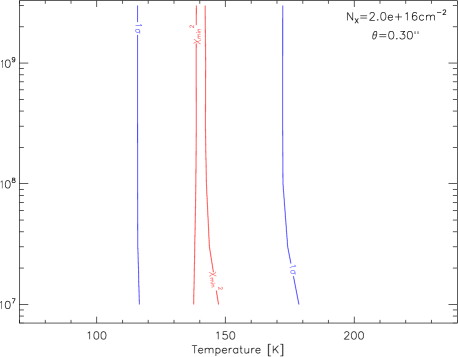
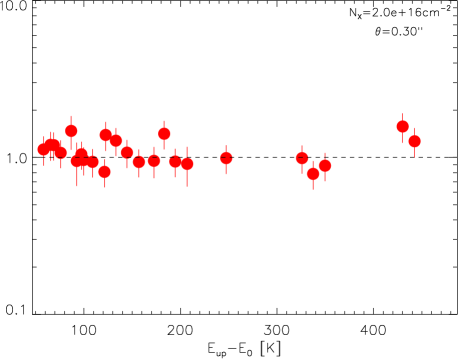
The best fit ( = 0.79) of the data is obtained with N(CH3CN) = cm-2 and an emitting size of 03 in diameter. The reduced is less than unity for N(CH3CN) between 5 1015 and 5 1016 cm-2. Figure 5 (upper panel) shows the density–temperature contour plot of the at the best fit of N(CH3CN) and size. The kinetic temperature is very well constrained at (140 20) K, and we can determine the density, cm-3, being the levels LTE populated. The vast majority of the lines are optically thick, with optical depths of up to 5. Only three lines, namely the 126–116, 125–115, and 147–137 transitions, have optical depths of less than unity (the lowest value being 0.3). Figure 5 (lower panel) also shows the ratio of the observed to predicted intensity as a function of the upper level energy of the line. All the observed velocity-integrated line intensities are very well reproduced by the LVG modelling, with no line more than 2 away from the best fit.
The high density obtained from the LVG modelling ensures that LTE is a good approximation for CH3CN. For this reason, we generated LTE synthetic spectra, using the gas temperature and column density and the associated errors, as derived from the best LVG model. The synthetic spectra, generated using the GILDAS Weeds package, are overlaid on the observations in Fig. 11. The comparison shows a reasonable agreement considering the observed FWHMs distribution (see Fig. 4 and Table LABEL:table:CH3CN-lines). We note that some low-K transitions show a hint of emission from a narrow component (see Fig. 11), likely indicating the presence of emission from a colder extended envelope. Further observations mapping the large-scale envelope in both CH3CN and its deuterated form are required to correctly disentangle the different contributions.
3.4 CH2DCN column density
Since no collision coefficients exist for the CH2DCN–H2 system, in order to derive the CH2DCN column density we carried out a rotation diagram LTE analysis. We used only four lines detected in ASAI, which consist of a single transition, namely: 121,11–111,10, 132,11–122,10, 140,14–130,13, and 141,13–131,12. We assumed that CH2DCN is emitted from the same region that emits in CH3CN, namely the hot corino region, as suggested by the SOLIS maps (see Sect. 3.1). Consequently, we used an emitting size of 03 in diameter and a temperature of 140 K. The derived column density is cm-2. The error considers a range of assumed temperatures between 120 and 160 K. Varying the assumed temperature from 50 to 200 K, the CH2DCN column density is always higher than 1.5 1015 cm-2. Under these conditions all the lines are predicted to be optically thin, with opacities lower than 0.2. The results do not change if we include in the rotation diagram the two SOLIS lines. The results of the analysis are summarised in Table 1. LTE synthetic spectra are generated for the best fit model and the associated error, and they are overlaid on the observed spectra in Fig. 12 for CH2DCN.
| Species | Tkin | Nxa | [XD]/[XH] |
|---|---|---|---|
| (K) | (cm-2) | (%) | |
| CH3CN | 140 (20) | (5 – 50) | – |
| CH2DCN | 120-160b | (2.0 – 2.7) | 4 – 54 |
a Derived assuming an emitting size of 03.
b Assumed from CH3CN.
3.5 CH3CN deuteration in SVS13-A
A first estimate of CH3CN deuteration was obtained by computing the ratio of the CH2DCN to the CH3CN column densities, assuming the same temperature for both species. With this method we derived a range of CH3CN deuteration between 4 and 54 (see Table 1), with a best value of 10.
We also derived the CH3CN deuteration using a second method, dividing the intensities of lines with the same quantum number in the two species and similar upper-level energies, following the same procedure adopted for HC3N and H2CS in Bianchi et al. (2019a) (see also Kahane et al. 2018). In general, this method allows a straightforward derivation of the abundance ratio, which does not depend on the assumed temperature, and therefore is affected by lower uncertainty.
While CH3CN is a symmetric top molecule, CH2DCN is a near prolate asymmetric top molecule. This means that the CH3CN transitions are described by two rotational quantum numbers: the total angular momentum, , and its projection on the symmetry axes, . For CH2DCN there is no symmetry axis and the rotational quantum numbers are denoted ; in particular, for prolate rotors the quantum state is . Therefore, for each CH3CN transition, we have two corresponding CH2DCN transitions, called the K-type doublet, with the same and , if 0, and only one CH2DCN transition if = 0. For example, the intensity of the CH2DCN line at 243.0512 GHz, composed of the two transitions 144,11–134,10 and 144,10–134,9 (Eup = 174 K), is divided for the intensity of the 144–134 CH3CN line at 257.4481 GHz (Eup= 207 K). With the same method we calculated the CH2DCN/CH3CN ratio using the 140,14–130,13 CH2DCN transition at 243.0415 GHz (Eup= 87 K). For the other three CH2DCN lines, the 121,11–111,10 transition (Eup= 70 K), the 132,11–122,10 transition (Eup= 97 K), and the 141,13–131,12 transition (Eup= 93 K), only one of the K-doublet transitions is exploitable for the analysis since the other one is blended (see Table LABEL:table:CH3CN-lines and Fig. 12). In this case, we multiplied the line intensity by two since we expected the same intensity from the K-doublet lines.
We note that, given the presence of a pair of identical hydrogen nuclei, CH2DCN presents two sets of nuclear-spin functions corresponding to ortho and para states: three functions for ortho and one for para. However, these ortho and para nuclear-spin functions do not couple to the specific rotational wave functions. Since the rotation motion cannot interchange the two hydrogen nuclei for CH2DCN, the restriction of the Fermi statistics to the rotational states is not applied. Therefore, the spin statistics (ortho/para) does not appear in the rotational states of CH2DCN and no correction is required. For CH3CN the 120 and 240 rotation can exactly interchange the two pairs of hydrogen nuclei. In this case, the total wave function must be symmetric with respect to the 120 and 240 rotation, according to the Fermi statistics. Considering that the states, except for =0, are doubly degenerated (i.e. ), the statistical weight of CH3CN lines is 2 for =3n (for n0), and 1 for =3n 1. All the CH3CN lines considered in our analysis have a statistical weight of 1, so no further correction is applied. Finally, the line ratios are corrected for a factor (1-e-τ)/ to account for the CH3CN optical depths estimated from the LVG analysis described in Sect. 3.3.
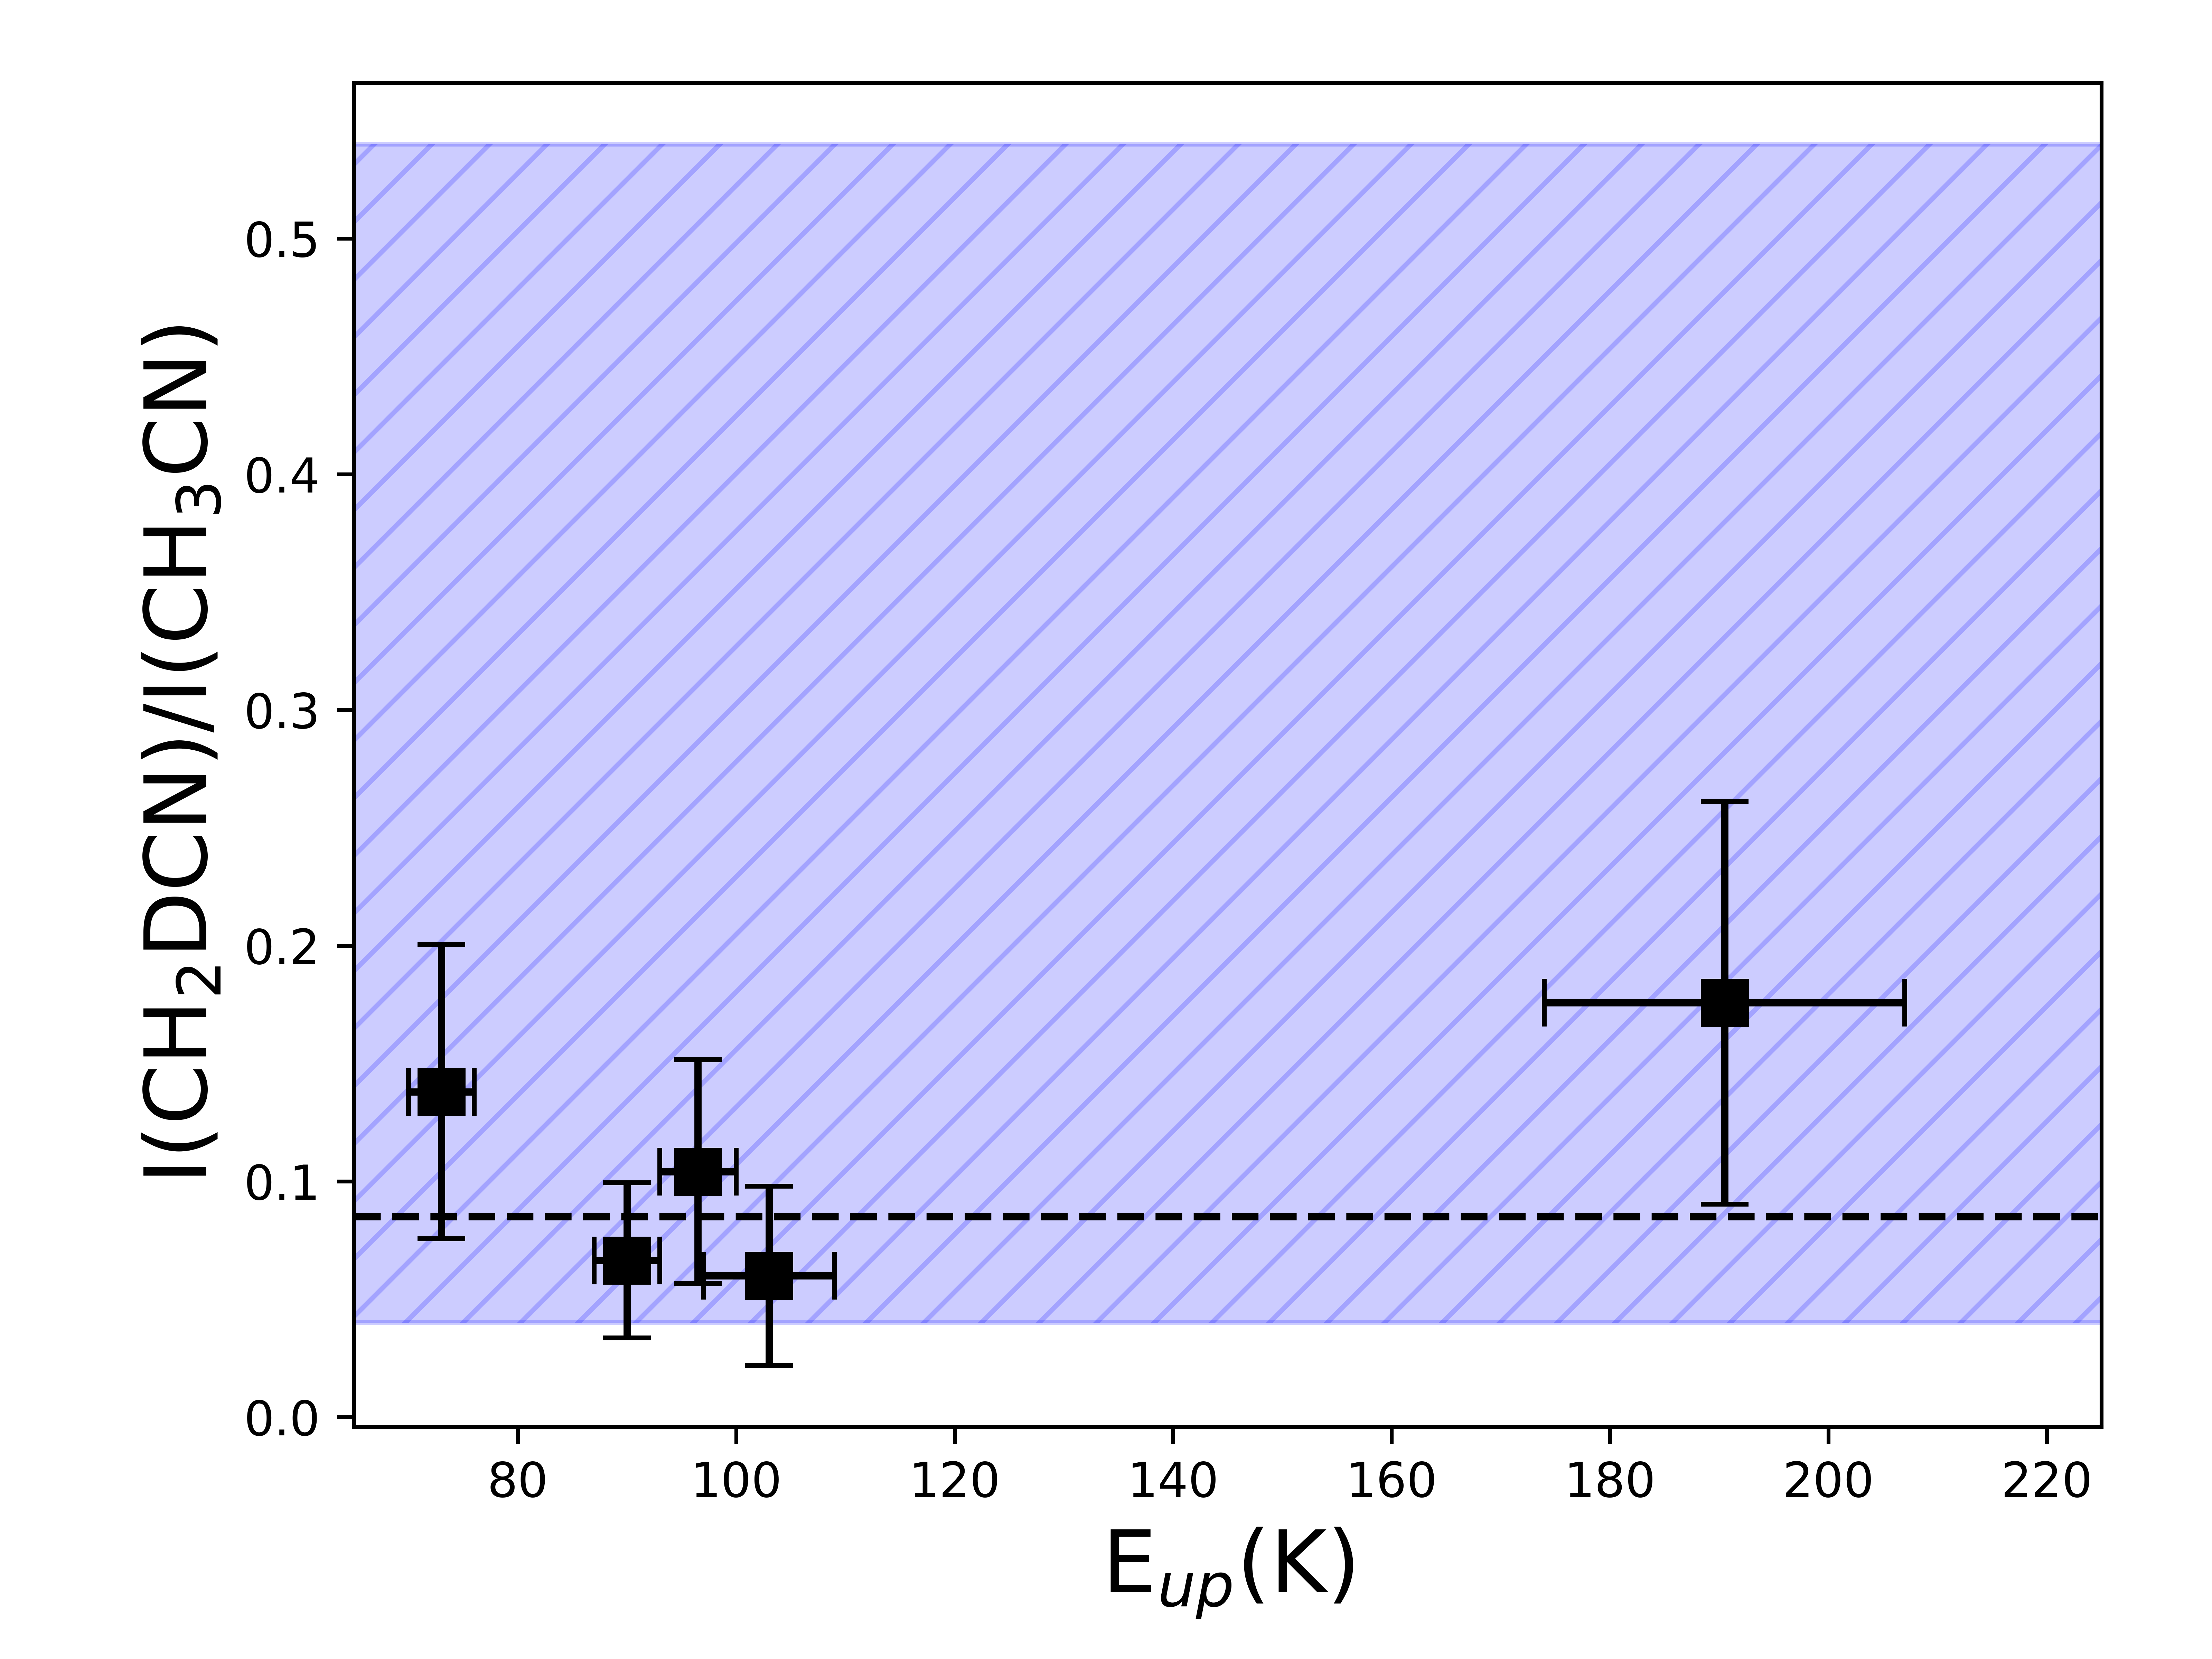
Figure 6 shows the [CH2DCN]/[CH3CN] derived with the method described above (i.e. from the intensity ratios) as a function of the upper level energy of the transition. The weighted average of the [CH2DCN]/[CH3CN] is , consistent with the values derived by dividing the CH2DCN and CH3CN column densities (i.e. 4 – 54), but with a smaller error bar (as expected). Considering the presence of three H atoms, the enhancement of the elemental [D]/[H] is about 3.
CH3CN has been recently detected towards SVS13-A also in the CALYPSO survey with the PdBI (Belloche et al., 2020) and in the PEACHES survey with ALMA (Yang et al., 2021), even though with a lower number of detected lines (CALYPSO: 6; PEACHES: 3). The CH3CN column density derived by these two studies is perfectly consistent with the value derived in our analysis: cm-2 and cm-2, respectively, once scaled to the source size of 03, derived by our non-LTE analysis. The PEACHES survey also reports the detection of two CH2DCN transitions and a column density of cm-2, which is very close to our value of cm-2.
4 Discussion
4.1 CH3CN deuteration: Class 0 versus Class I hot corinos
While CH3CN is very easily detected in young protostars, its deuterated isotopologue is not. We have detections of CH2DCN in a handful of low-mass cold cores and protostars, so that the information about the degree of deuteration of this molecule is rather sparse.
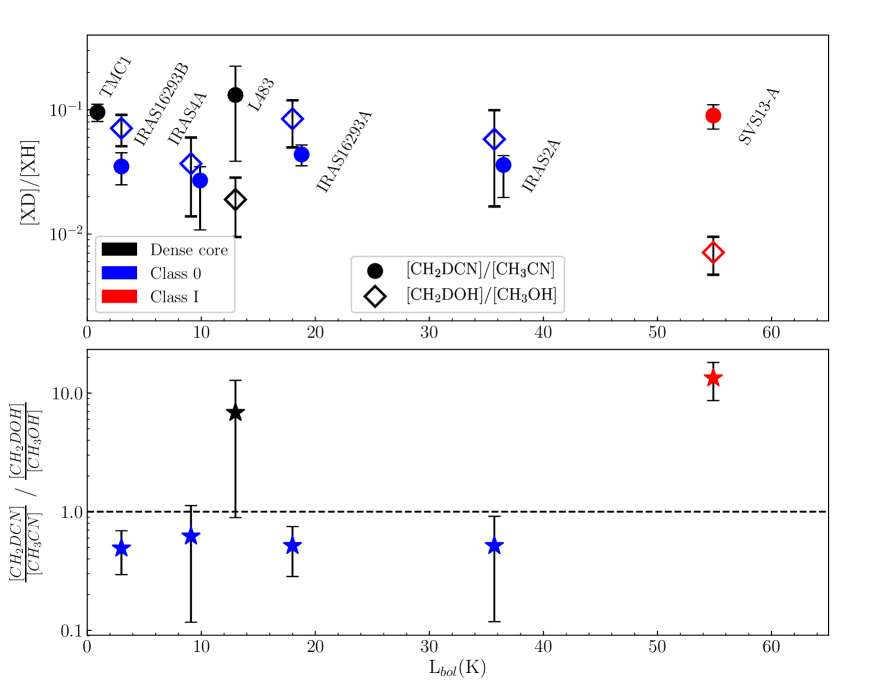
To our best knowledge, in addition to except for SVS13-A, the deuteration of CH3CN has been measured so far only towards the high-mass star-forming region Sgr B2 (Belloche et al., 2016), and towards a limited number of Sun-like star-forming regions, namely: L483 (Agúndez et al., 2019), TMC-1 (Cabezas et al., 2021), IRAS16293-2422 A and B (Calcutt et al., 2018), and NGC1333 IRAS 4A and IRAS 2A (Taquet et al., 2019). L483 is an optical dark cloud core hosting a Class 0 protostar. However, the measurement by Agúndez et al. (2019) refers to single-dish observations of the dense core around the protostar. The low rotational temperatures, the narrow FWHMs for the detected lines, and the high IRAM-30m beam dilution at 3mm further suggest that emission is arising mainly from the ambient cloud and not from the Class 0 protostar. In IRAS16293-2422 the [CH2DCN]/[CH3CN] abundances ratio is 4.4 for protostar A and 3.5 for B. In NGC1333 IRAS 4A it is 2.7 and in IRAS 2A 3.6. In the L483 dense cold core it is 13 and in the cold core TMC-1 it is 9. The situation is summarised in Fig. 7 (upper panel).
The comparison between the above sources leads to two results. First, cold cores seem to possess a higher deuteration degree than protostars. Second, SVS13-A also seems to have a CH3CN deuteration higher by a factor of 2-3 with respect to Class 0 protostars. We note that IRAS 2A and IRAS 4A are in the same star-forming region as SVS13-A, NGC 1333, so that in principle they experienced the same past thermal history. In other words, if the CH3CN deuteration was governed by the sublimation of the grain mantles, in principle there should not be a difference between these sources.
Finally, Yang et al. (2021) found a very tight correlation between methyl cyanide and methanol in the Class 0/I protostars of the Perseus molecular cloud to which SVS13-A belongs, which may imply a common origin of the two species. Therefore, Fig. 7 (upper panel) also shows the deuteration of methanol as measured on the methyl group, [CH2DOH]/[CH3OH], in the same sources where the [CH2DCN]/[CH3CN] was measured (with the exception of TMC-1 for which methanol deuteration is not measured). Interestingly, the two values are approximately the same in Class 0 sources within the error bars, marginally different in the cold core L483, and different in SVS13-A. Specifically, in SVS13-A, the [CH2DCN]/[CH3CN] ratio is about 14 times higher than the [CH2DOH]/[CH3OH] value. This would bring into question a possible common origin for the two species. However, methanol deuteration was derived in SVS13-A using only single-dish observations (Bianchi et al., 2017). High angular resolution interferometric observations are required to confirm this result.
4.2 Chemistry of CH3CN and CH2DCN
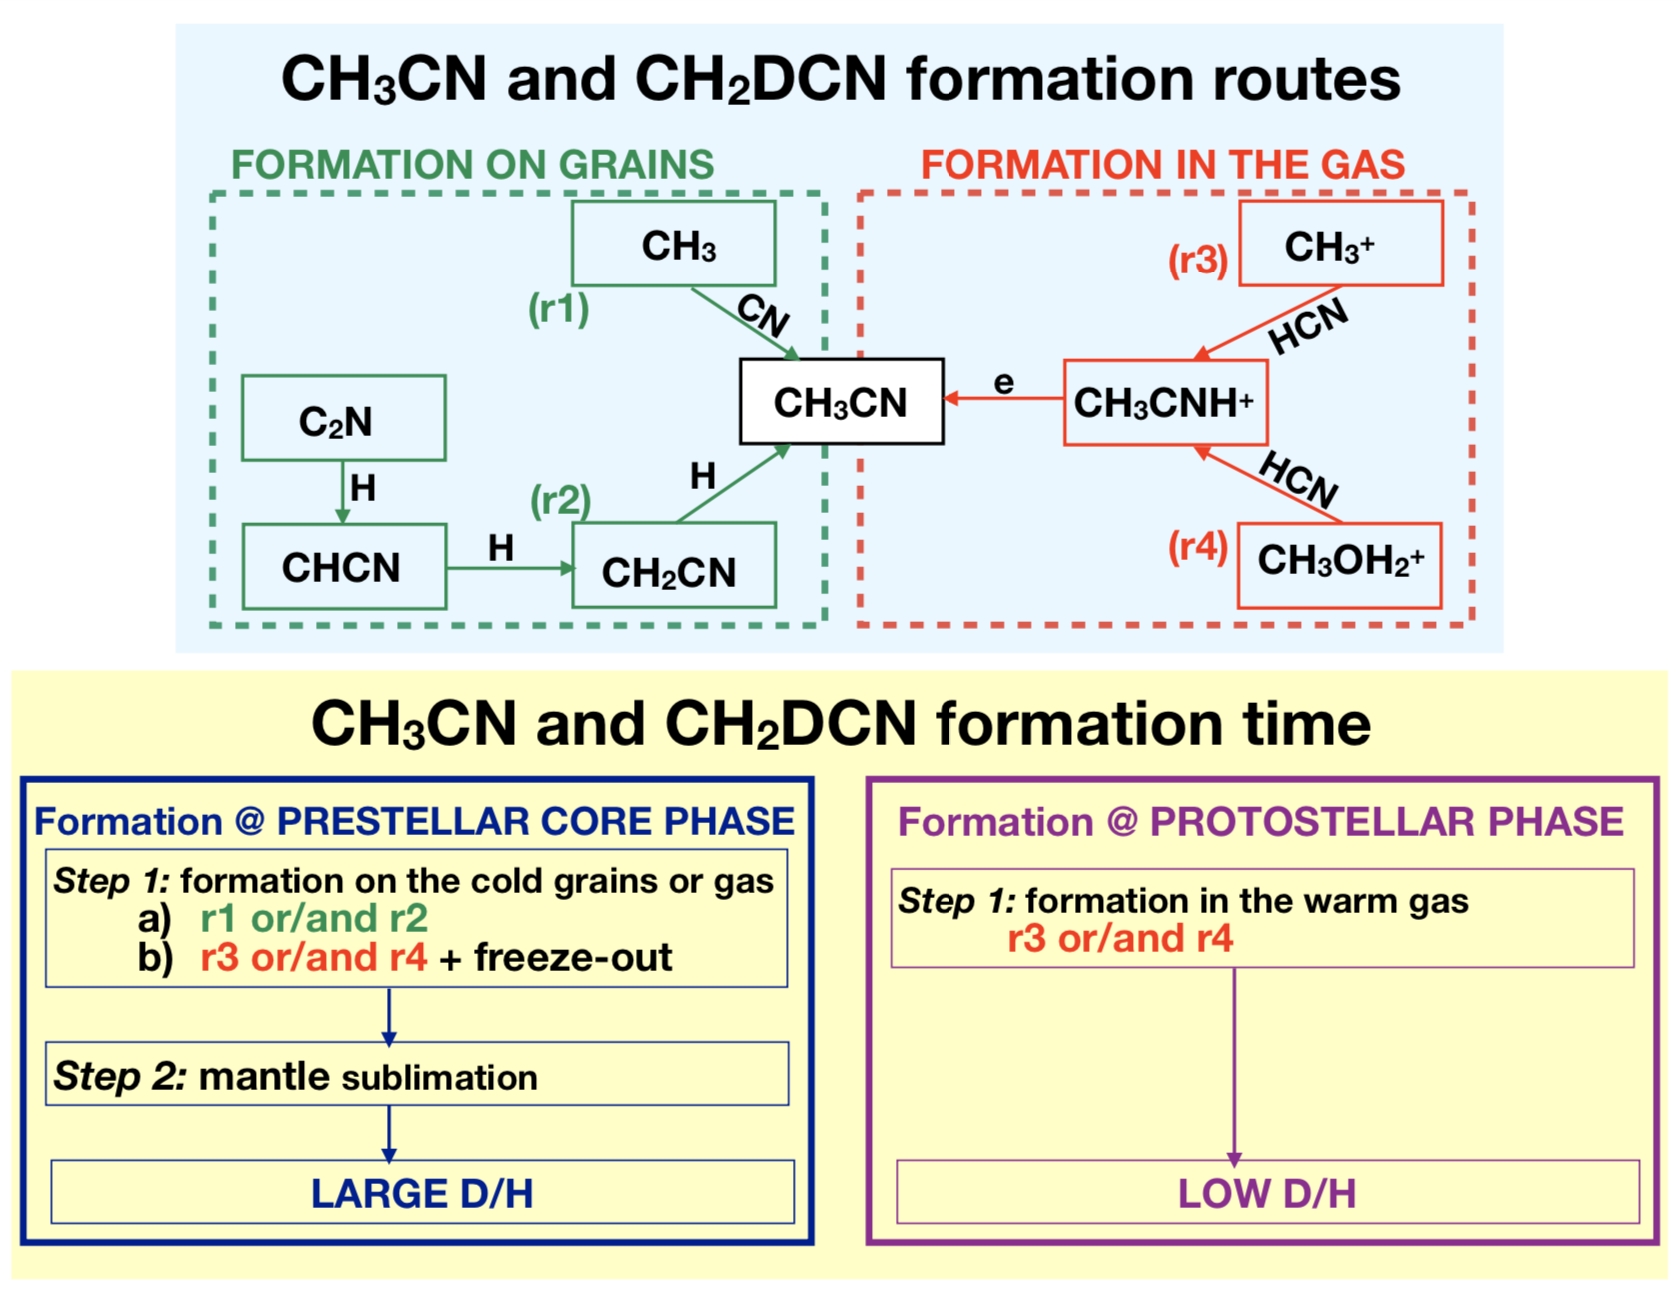
In the literature two routes of methyl cyanide formation are invoked, either in the gas phase or on the surfaces of the grain mantles during the cold prestellar phase or in the warm protostellar phase. Figure 8 provides a scheme of these various possibilities and their combination. In the following we review these possibilities and whether the measured CH3CN deuteration can help to assess the dominant routes and the time of formation of CH3CN and CH2DCN.
4.2.1 Formation routes of CH3CN
Formation in the gas: As shown in the upper right panel of Fig. 8, two possible routes are invoked in the literature. The first involves the dissociative recombination of CH3CNH+ (Vigren et al., 2008; Plessis et al., 2012), which is in turn formed via the radiative association of CH and HCN, whose rate constant is poorly known (e.g. Herbst, 1985; Le Gal et al., 2019, and references therein). In addition, the reaction between protonated methanol and HCN is also a possible important route of CH3CN formation (Meot-Ner & Karpas, 1986), where abundant methanol and proton donors, such as H or H3O+, are present.
Formation on grains: As shown in the upper left panel of Fig. 8, methyl cyanide can be formed either by the combination of the two radicals CH3 and CN or by the hydrogenation of C2N (Garrod et al., 2008). Unfortunately, experimental or theoretical data are not available for either of these two routes, so their rate of formation in the current astrochemical models are estimated to have efficiency 1. While this is certainly true for the C2N hydrogenation, it is not clear that this is the case for the CH3 and CN combination. Ab initio theoretical studies have shown that the combination of two radicals on the icy grain surfaces can have barriers that reduce the efficiency of the reaction (e.g. Rimola et al., 2018; Enrique-Romero et al., 2019). Even though these authors did not explicitly study the CH3CN case, their results caution on the assumption that radical-radical reactions always end up in iCOMs.
4.2.2 Destruction of CH2DCN in the gas phase
In the gas phase, neutral species are predominantly destroyed by the most abundant molecular ions, such as H or H2DO+, the latter where water is abundant, for example in warm regions. Therefore, in the warm gas of Class 0/I protostars, the [CH2DCN]/[CH3CN] deuteration ratio tends to the values of [H2D+]/[H] and/or [H2DO+]/[H3O+]. Since H2D+ and H are, by definition, formed in warm gas, their [H2D+]/[H] abundance ratio is low (e.g. Charnley et al., 1997; Ceccarelli et al., 2014). The same applies to the protonated water, as it is mainly formed by the reaction of H with H2O, which is much less deuterated than CH3CN (e.g. Coutens et al., 2012). The re-formation of CH3CN and CH2DCN in the gas phase via reaction r4 shown in Fig. 8, will therefore tend to lower the [CH2DCN]/[CH3CN] abundance ratio.
4.2.3 Formation time
Since molecular deuteration is strongly impacted by temperature, it is often used to disentangle whether a species is formed during the prestellar cold phase, frozen on the grain mantles, and then injected into the gas phase during the warm protostellar phase, or rather directly synthesised in the warm gas (e.g. Walmsley et al., 1989; Ceccarelli et al., 2007), as illustrated in the lower panel of Fig. 8. In the first case, large deuteration factors are expected due to the low temperatures and CO depletion of the gas and dust, whereas the direct formation of molecules in warm gas leads to a much smaller deuteration factor (see e.g. Ceccarelli et al., 2014).
The relatively high measured [CH2DCN]/[CH3CN] ratio (Fig. 6) in the Class 0/I sources plays in favour of a formation of CH3CN and CH2DCN during the cold prestellar phase and their injection into the gas phase from the grain mantles once the protostar is formed. Once CH3CN and CH2DCN are injected into the gas phase, reactions with H will slowly decrease the [CH2DCN]/[CH3CN] ratio. The possibly higher [CH2DCN]/[CH3CN] ratio in cold cores with respect to that measured in Class 0 protostars perfectly agree with this hypothesis. Likewise, the similar large deuteration of methanol in the same sources supports the formation of the two species during the cold prestellar phase.
Even so, it remains to be seen whether the sublimated CH3CN and CH2DCN, observed in cold dense cores and Class 0/I protostars, are grain-surfaces products or rather the result of the freezing-out of CH3CN and CH2DCN onto the grain mantles, as indicated in the left lower panel of Fig. 8. The two cases are discussed separately in the following because, in principle, different routes could be dominant in the two classes of objects.
Cold dense cores: The presence of gaseous CH3CN in the cold cores favours the gas-phase formation hypothesis because an additional process would be needed to extract methyl cyanide from the iced mantles at 10 K, a process that is not entirely clear. Often, the non-thermal desorption caused by the residual reaction energy not absorbed by the grains is invoked, and called chemical desorption (e.g. Duley & Williams, 1993; Minissale et al., 2016). However, ab initio molecular dynamics computations on HCO challenge the idea that a large fraction of the species formed on the grain icy surfaces can be released in the gas as the ices are very efficient in absorbing the reaction energy (Pantaleone et al., 2020, 2021). Finally, further support to the gas-phase synthesis in cold cores is provided by the modelling performed by Cabezas et al. (2021), which claims that methyl cyanide and the measured [CH2DCN]/[CH3CN] ratio in TMC-1 are quite well reproduced by gas-phase formation routes.
Class 0/I protostars: The situation in Class 0/I protostars is more complicated than that in the cold dense cores. The similar deuteration of methyl cyanide and methanol and the tight correlation between CH3OH and CH3CN seen by Yang et al. (2021) in Class 0/I protostars would favour the hypothesis that either methyl cyanide is formed on the grain surfaces or the gas-phase reaction of HCN with protonated methanol is its major formation route. However, since the deuteration during the cold prestellar core is governed by the enhancement of H2D+ with respect to H, regardless of the formation of the species on the grain surfaces (such as methanol) or in the gas phase (such as, possibly, CH and HCN) (e.g. Ceccarelli et al., 2014), the similar deuteration degree of methyl cyanide and methanol cannot be used to discriminate between whether methyl cyanide is formed on the grains or in the gas.
Intriguingly, in SVS13-A both the [CH2DCN]/[CH3CN] and [CH2DOH]/[CH3OH] ratios are different from those of the Class 0 sources (Fig. 7): the first is about two to three times higher while the second is about ten times lower. This would lead to thinking that either deuterated methyl cyanide and methanol are differently affected by gas-phase reactions or they were different already on the grain mantles. As discussed in § 4.2.2, it is indeed possible that deuterated methyl cyanide and methanol are differently affected by gas-phase reactions. However, methyl cyanide deuteration should diminish faster than that of methanol, contrarily to what we observe.
It seems in SVS13-A, therefore, that methyl cyanide and methanol possess a different deuteration already on the grain surfaces. Since the grain-surface synthesis of methyl cyanide involves CH3 (+ CN), where CH3 is a radical from the photolysis and/or radiolysis of methanol (e.g. Garrod et al., 2008), the deuteration of methyl cyanide cannot differ from that of methanol if this is the major route. A similar argument applies if CH3CN is formed on the grain surfaces by the hydrogenation of C2N. It would then remain the possibility that methyl cyanide is more deuterated because it was formed during the prestellar phase in the gas phase by the reactions chain started by CH (see above). Since the deuteration from CH2D+ is active at higher temperatures than those where H2D+ is, this would explain the higher deuteration of CH3CN with respect to CH3OH in SVS13-A.
In summary, it seems likely that methyl cyanide in SVS13-A was synthesised in the gas phase of the cold prestellar phase and frozen out onto the grain mantles, from which it was injected into the gas phase again when the dust temperature reached the mantle’s sublimation temperature.
4.3 Structure of the SVS13-A hot corino
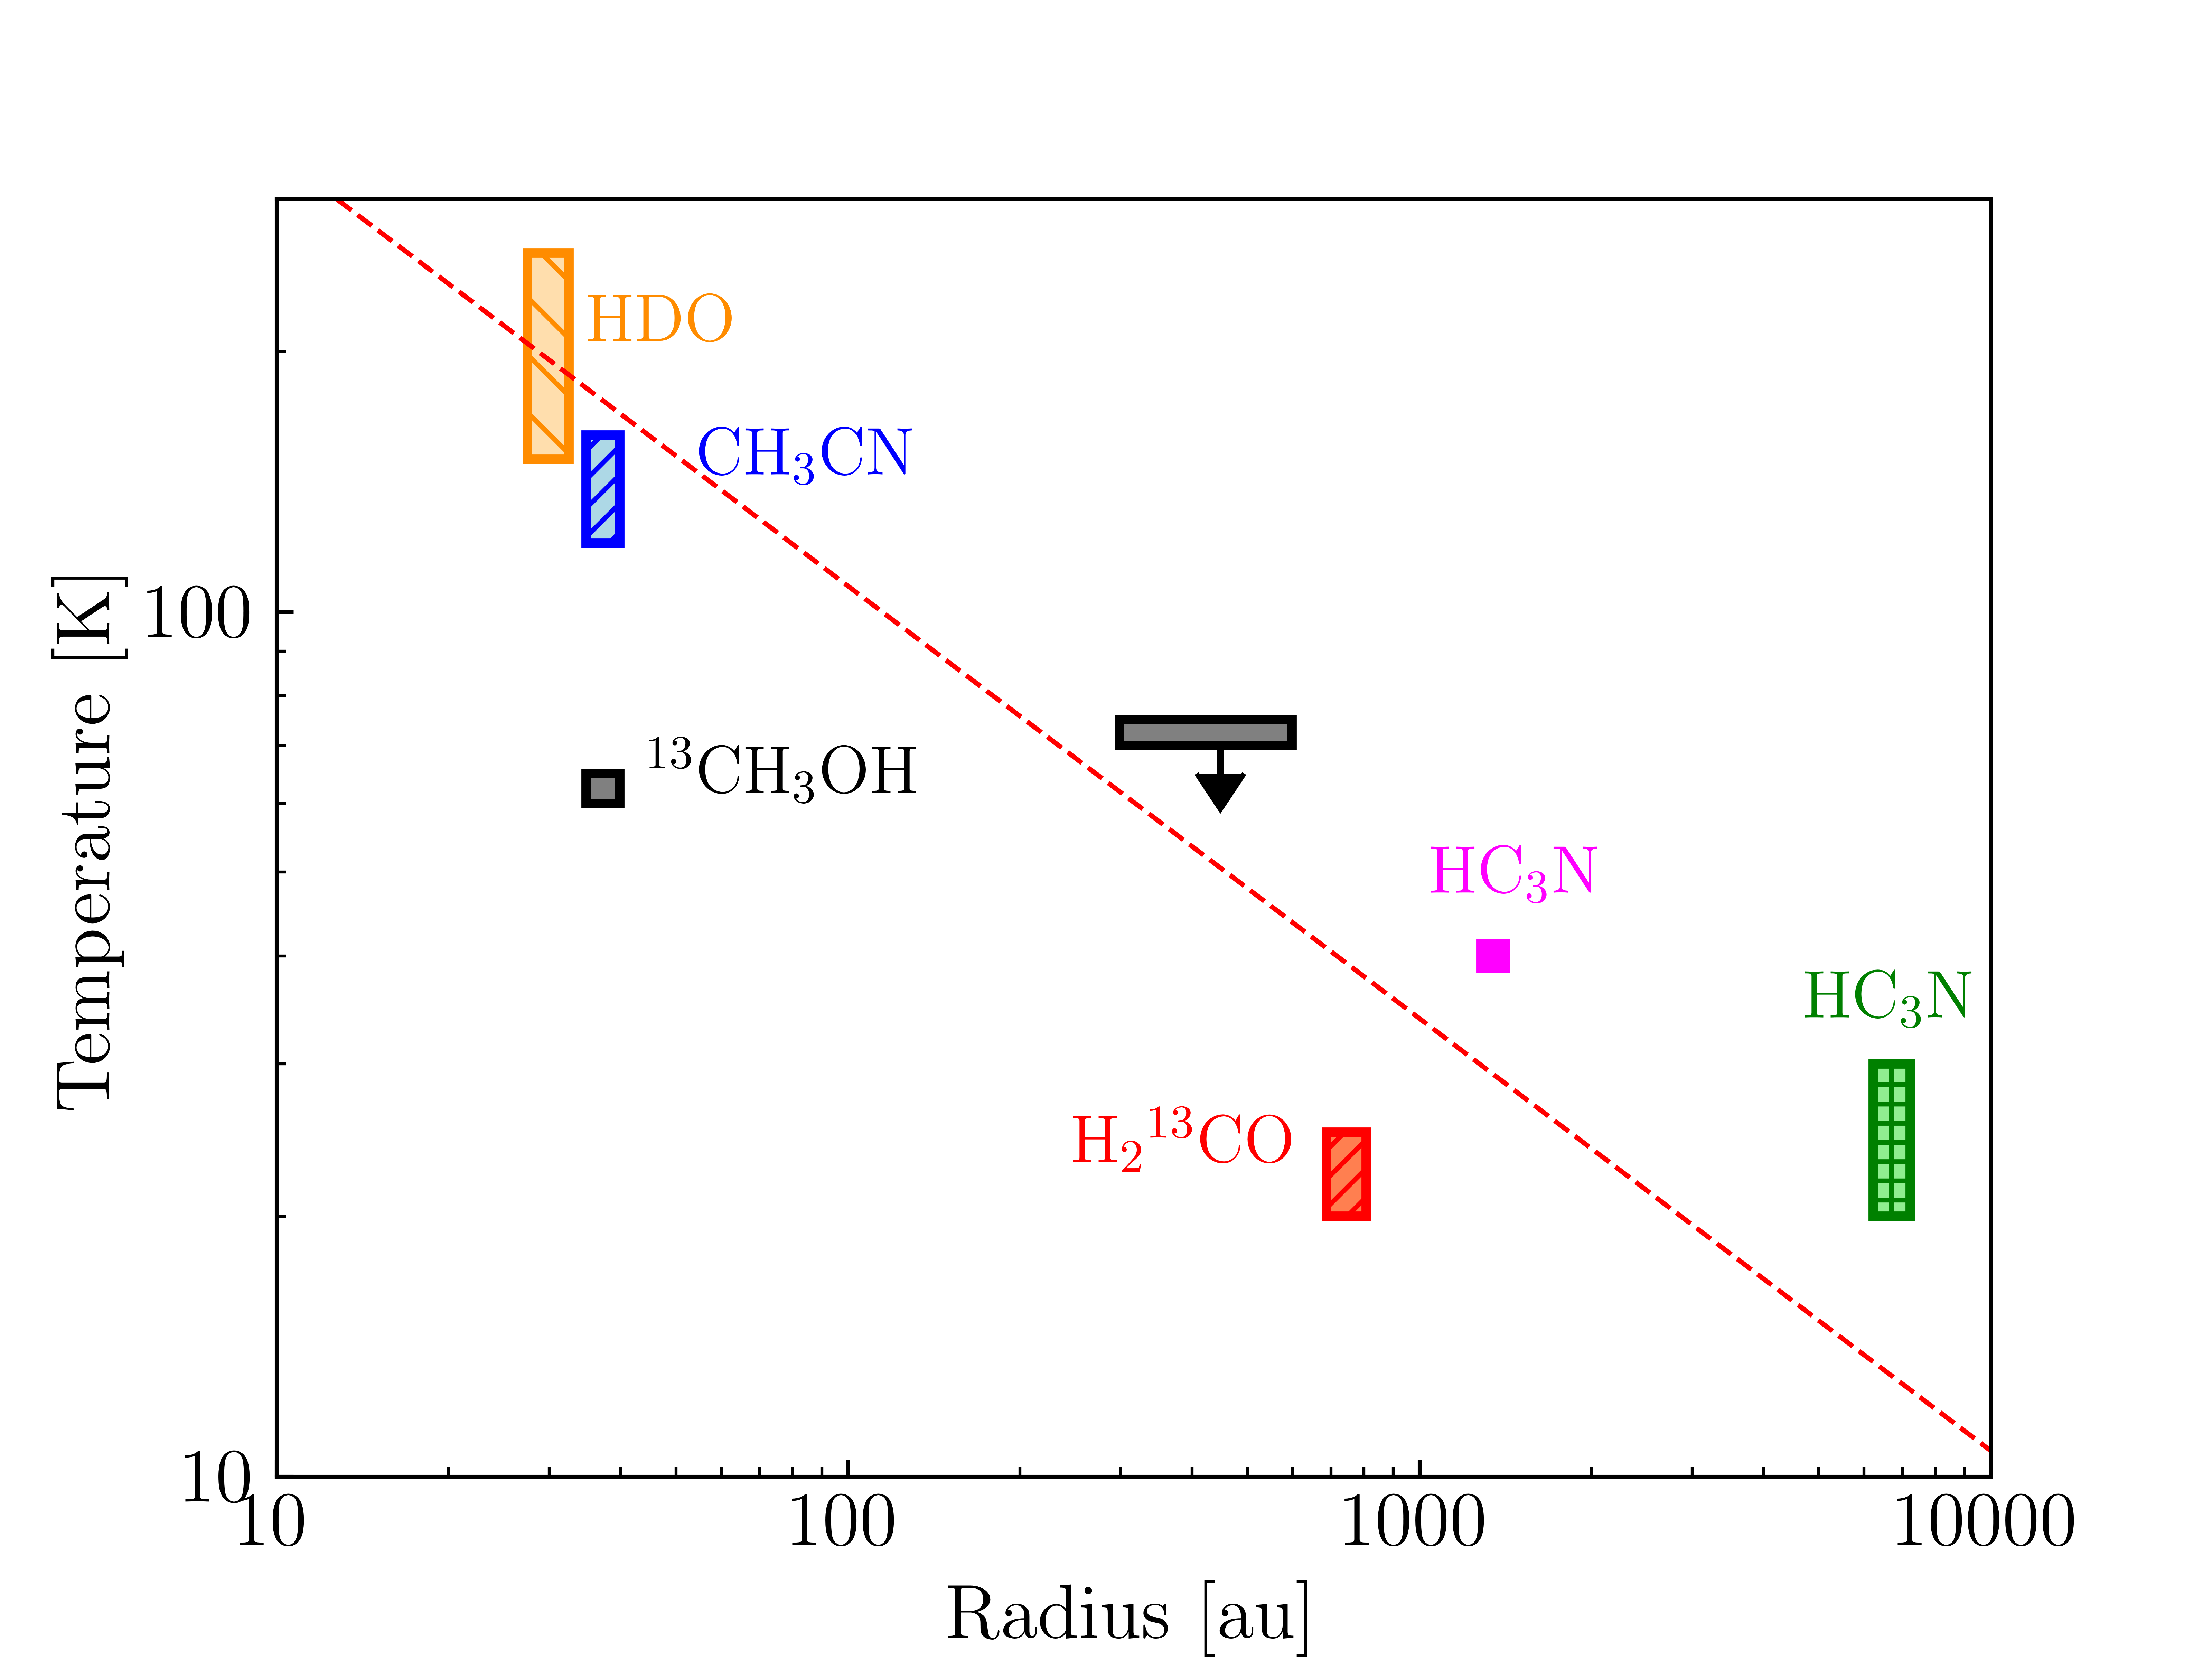
SVS13-A is one of the few young protostars for which an extensive analysis of different molecular tracers has been performed (Lefloch et al., 1998; Codella et al., 2016; Bianchi et al., 2017; Lefèvre et al., 2017; De Simone et al., 2017; Bianchi et al., 2019b, a). The non-LTE LVG analysis of formaldehyde, deuterated water, methanol, methyl cyanide, and cyanoacetylene offers an invaluable opportunity to reconstruct its envelope temperature profile, as each species samples a different region of it. Figure 9 shows the derived gas temperature profile as a function of the radius, as reconstructed putting together the various results. In the same figure the dashed red line is the theoretical temperature profile for the bolometric luminosity of SVS13-A (Lbol = 54.9 L⊙ from Tobin et al. 2016, and scaled to the recently revised NGC1333 distance of 299 pc Zucker et al. 2018). The observational measurements are from Bianchi et al. (2017), Codella et al. (2016), Bianchi et al. (2019a), and this paper. CH3CN traces the region where the abundances of (deuterated) water and methanol are also enhanced due to the hot corino activity ( 03, T 80 K). Methanol also has a warm component ( 70 K) emitted in a region of 300-600 au in radius. For radii larger than 100 au, the molecular emission allows us to reconstruct the temperature profiles and highlights the onion-like structure of the protostellar envelope (Crimier et al., 2010; Jørgensen et al., 2002). In particular, HC3N traces one cold ( 20 K) extended component, probably associated with the protostellar envelope, and a second lukewarm component ( 40 K). HCO is emitted from a region of 750 au in radius and it has a Tkin between 20 and 25 K. In the inner 100 au the physical structure is indeed more complex, since the source is known to be a close binary system (Anglada et al., 2000). In summary, the chemical differentiation as observed towards SVS13-A is consistent with a temperature gradient due to protostellar heating. Clearly, a proper modelling on scales of less than 50 au will be done after sampling the chemical richness around the two protostars of the SVS13-A system.
5 Conclusions
We analysed the CH3CN and CH2DCN emission in the Class I protostar SVS13-A, in the framework of the IRAM/NOEMA SOLIS and IRAM-30m ASAI Large Programs. Our conclusions can be summarised as follows:
-
-
We detected 41 lines of CH3CN and 7 lines of CH2DCN, covering upper level energies (Eup) from 13 K to 442 K and from 18 K to 200 K, respectively. The majority of the lines were detected using the IRAM-30m antenna, while two CH2DCN lines were mapped using the IRAM/NOEMA interferometer.
-
-
The NOEMA maps show that the emission is concentrated towards SVS13-A and unresolved in a beam of 15, consistent with the hypothesis that the CH2DCN emission originates from the hot corino region.
-
-
We performed a non-LTE large velocity gradient analysis of the CH3CN lines and derived a kinetic temperature of (14020) K, a column density of (0.5-5) 1016 cm-2, a gas density of n 107 cm-3, and an emitting size of 03. Therefore, the non-LTE analysis confirms that CH3CN is also emitted from the hot corino region. The CH3CN lines are predicted to be optically thick, with up to 5.
-
-
We performed a LTE rotation diagram analysis of the CH2DCN lines assuming the same temperature (140 20 K) and size (03) derived by the CH3CN analysis. The CH2DCN column density is cm-2. The lines are predicted to be optically thin, with opacities lower than 0.2.
-
-
We derived CH3CN deuteration, for the first time in a Class I protostar, using two different methods: from the CH2DCN/CH3CN column density ratio and using the intensity ratio from lines with the same quantum number. The first method gives an methyl cyanide deuteration between 0.04 and 0.54 with a best value of 0.1. The second method allows us to better constrain the methyl cyanide deuteration because it does not depend on the gas temperature. It yields a methyl cyanide deuteration CH2DCN/CH3CN equal to (0.090.02).
-
-
The CH2DCN/CH3CN measured in SVS13-A is consistent with that observed in prestellar cores but it is a factor of 2–3 higher than the values observed in Class 0 protostars. We conclude that CH3CN deuteration does not show a drastic decrease from the prestellar and Class 0 to the more evolved Class I phases. In addition, the methyl cyanide deuteration in IRAS 4A and IRAS 2A, two Class 0 protostars located in the same cloud as SVS13-A, NGC1333, is also about a factor of 2 lower than in SVS13-A. This suggests that the SVS13-A greater methyl cyanide deuteration is not related to environmental conditions, such as the temperature in the NGC1333 region, at the epoch of ice formation.
-
-
In SVS13-A, the CH3CN deuteration is higher than for methanol, while they are approximately the same in Class 0 sources. This seems to question a common origin for the two species. We speculate that, in SVS13-A, methyl cyanide was synthesised in the gas phase by the reaction chain started from CH in the cold prestellar phase, condensed onto the grain mantles, and was then injected back into the gas phase when the dust temperature reached the mantles sublimation temperature.
-
-
Thanks to the analysis of different molecular tracers we reconstructed the source temperature profile, from the inner hot corino region to the extended envelope ( 10000 au). The temperature gradient is consistent with the SVS13-A bolometric luminosity of 55 L.
The physical structure of the inner regions will be further investigated by sampling the chemical complexity of the SVS13-A binary system on spatial scales smaller than 50 au.
Acknowledgements.
While the paper was under the review process the detection of CH2DCN has been also reported towards the source by Diaz-Rodriguez et al. (2021). Moreover, a measurement of CH3CN deuteration in another Class I source (Ser-emb11) has been reported by Martin-Domenech et al. (2021). We are very grateful to all the IRAM staff, whose dedication allowed us to carry out the SOLIS project. We are also grateful to Prof. Sonia Melandri for illuminating discussion on the spectroscopy of CH3CN and CH2DCN. This project has received funding within the European Union’s Horizon 2020 research and innovation programme from the European Research Council (ERC) for the project “The Dawn of Organic Chemistry” (DOC), grant agreement No 741002, and from the Marie Sklodowska-Curie for the project ”Astro-Chemical Origins” (ACO), grant agreement No 811312. This work was supported by the PRIN-INAF 2016 ”The Cradle of Life - GENESIS-SKA (General Conditions in Early Planetary Systems for the rise of life with SKA)”.References
- Agúndez et al. (2019) Agúndez, M., Marcelino, N., Cernicharo, J., Roueff, E., & Tafalla, M. 2019, A&A, 625, A147
- Agúndez, M. et al. (2021) Agúndez, M., Marcelino, N., Tercero, B., et al. 2021, A&A, 649, L4
- Aikawa et al. (2012) Aikawa, Y., Wakelam, V., Hersant, F., Garrod, R. T., & Herbst, E. 2012, ApJ, 760, 40
- ALMA Partnership et al. (2015) ALMA Partnership, Brogan, C. L., Pérez, L. M., et al. 2015, ApJ, 808, L3
- Altwegg et al. (2019) Altwegg, K., Balsiger, H., & Fuselier, S. A. 2019, ARA&A, 57, 113
- André et al. (1993) André, P., Ward-Thompson, D., & Barsony, M. 1993, ApJ, 406, 122
- Anglada et al. (2000) Anglada, G., Rodríguez, L. F., & Torrelles, J. M. 2000, ApJ, 542, L123
- Bachiller et al. (1998) Bachiller, R., Guilloteau, S., Gueth, F., et al. 1998, A&A, 339, L49
- Belloche et al. (2020) Belloche, A., Maury, A. J., Maret, S., et al. 2020, A&A, 635, A198
- Belloche et al. (2016) Belloche, A., Müller, H. S. P., Garrod, R. T., & Menten, K. M. 2016, A&A, 587, A91
- Bergner et al. (2018) Bergner, J. B., Guzmán, V. G., Öberg, K. I., Loomis, R. A., & Pegues, J. 2018, ApJ, 857, 69
- Bianchi et al. (2019a) Bianchi, E., Ceccarelli, C., Codella, C., et al. 2019a, ACS Earth and Space Chemistry, 3, 2659
- Bianchi et al. (2017) Bianchi, E., Codella, C., Ceccarelli, C., et al. 2017, MNRAS, 467, 3011
- Bianchi et al. (2019b) Bianchi, E., Codella, C., Ceccarelli, C., et al. 2019b, MNRAS, 483, 1850
- Cabezas et al. (2021) Cabezas, C., Endo, Y., Roueff, E., et al. 2021, A&A, 646, L1
- Calcutt et al. (2018) Calcutt, H., Jørgensen, J. K., Müller, H. S. P., et al. 2018, A&A, 616, A90
- Caselli & Ceccarelli (2012) Caselli, P. & Ceccarelli, C. 2012, A&A Rev., 20, 56
- Cazzoli & Puzzarini (2006) Cazzoli, G. & Puzzarini, C. 2006, Journal of Molecular Spectroscopy, 240, 153
- Ceccarelli et al. (2014) Ceccarelli, C., Caselli, P., Bockelée-Morvan, D., et al. 2014, Protostars and Planets VI, 859
- Ceccarelli et al. (2017) Ceccarelli, C., Caselli, P., Fontani, F., et al. 2017, ApJ, 850, 176
- Ceccarelli et al. (2007) Ceccarelli, C., Caselli, P., Herbst, E., Tielens, A. G. G. M., & Caux, E. 2007, Protostars and Planets V, 47
- Ceccarelli et al. (2003) Ceccarelli, C., Maret, S., Tielens, A. G. G. M., Castets, A., & Caux, E. 2003, A&A, 410, 587
- Charnley et al. (1997) Charnley, S. B., Tielens, A. G. G. M., & Rodgers, S. D. 1997, ApJ, 482, L203
- Chen et al. (2009) Chen, X., Launhardt, R., & Henning, T. 2009, ApJ, 691, 1729
- Chini et al. (1997) Chini, R., Reipurth, B., Sievers, A., et al. 1997, A&A, 325, 542
- Codella et al. (1999) Codella, C., Bachiller, R., & Reipurth, B. 1999, A&A, 343, 585
- Codella et al. (2009) Codella, C., Benedettini, M., Beltrán, M. T., et al. 2009, A&A, 507, L25
- Codella et al. (2020) Codella, C., Ceccarelli, C., Bianchi, E., et al. 2020, A&A, 635, A17
- Codella et al. (2016) Codella, C., Ceccarelli, C., Bianchi, E., et al. 2016, MNRAS, 462, L75
- Codella et al. (2012) Codella, C., Ceccarelli, C., Lefloch, B., et al. 2012, ApJ, 757, L9
- Coutens et al. (2016) Coutens, A., Jørgensen, J. K., van der Wiel, M. H. D., et al. 2016, A&A, 590, L6
- Coutens et al. (2012) Coutens, A., Vastel, C., Caux, E., et al. 2012, A&A, 539, A132
- Crimier et al. (2010) Crimier, N., Ceccarelli, C., Maret, S., et al. 2010, A&A, 519, A65
- De Simone et al. (2017) De Simone, M., Codella, C., Testi, L., et al. 2017, A&A, 599, A121
- Diaz-Rodriguez et al. (2021) Diaz-Rodriguez, A. K., Anglada, G., Blázquez-Calero, G., et al. 2021, arXiv e-prints, arXiv:2111.11787
- Duley & Williams (1993) Duley, W. W. & Williams, D. A. 1993, MNRAS, 260, 37
- Enrique-Romero et al. (2019) Enrique-Romero, J., Rimola, A., Ceccarelli, C., et al. 2019, ACS Earth and Space Chemistry, 3, 2158
- Fedele et al. (2018) Fedele, D., Tazzari, M., Booth, R., et al. 2018, A&A, 610, A24
- Furuya et al. (2017) Furuya, K., Drozdovskaya, M. N., Visser, R., et al. 2017, A&A, 599, A40
- Garrod et al. (2008) Garrod, R. T., Widicus Weaver, S. L., & Herbst, E. 2008, ApJ, 682, 283
- Green (1986) Green, S. 1986, ApJ, 309, 331
- Herbst (1985) Herbst, E. 1985, ApJ, 291, 226
- Herbst & van Dishoeck (2009) Herbst, E. & van Dishoeck, E. F. 2009, ARA&A, 47, 427
- Jensen et al. (2021) Jensen, S. S., Jørgensen, J. K., Kristensen, L. E., et al. 2021, A&A, 650, A172
- Jørgensen et al. (2018) Jørgensen, J. K., Müller, H. S. P., Calcutt, H., et al. 2018, A&A, 620, A170
- Jørgensen et al. (2002) Jørgensen, J. K., Schöier, F. L., & van Dishoeck, E. F. 2002, A&A, 389, 908
- Kahane et al. (2018) Kahane, C., Jaber Al-Edhari, A., Ceccarelli, C., et al. 2018, ApJ, 852, 130
- Kristensen et al. (2012) Kristensen, L. E., van Dishoeck, E. F., Bergin, E. A., et al. 2012, A&A, 542, A8
- Le Gal et al. (2019) Le Gal, R., Brady, M. T., Öberg, K. I., Roueff, E., & Le Petit, F. 2019, ApJ, 886, 86
- Le Gal et al. (2020) Le Gal, R., Öberg, K. I., Huang, J., et al. 2020, ApJ, 898, 131
- Le Roy et al. (2015) Le Roy, L., Altwegg, K., Balsiger, H., et al. 2015, A&A, 583, A1
- Lefèvre et al. (2017) Lefèvre, C., Cabrit, S., Maury, A. J., et al. 2017, A&A, 604, L1
- Lefloch et al. (2018) Lefloch, B., Bachiller, R., Ceccarelli, C., et al. 2018, MNRAS, 477, 4792
- Lefloch et al. (1998) Lefloch, B., Castets, A., Cernicharo, J., Langer, W. D., & Zylka, R. 1998, A&A, 334, 269
- Loomis et al. (2018) Loomis, R. A., Cleeves, L. I., Öberg, K. I., et al. 2018, ApJ, 859, 131
- Looney et al. (2000) Looney, L. W., Mundy, L. G., & Welch, W. J. 2000, ApJ, 529, 477
- Manigand et al. (2019) Manigand, S., Calcutt, H., Jørgensen, J. K., et al. 2019, A&A, 623, A69
- Maret et al. (2011) Maret, S., Hily-Blant, P., Pety, J., Bardeau, S., & Reynier, E. 2011, A&A, 526, A47
- Martin-Domenech et al. (2021) Martin-Domenech, R., Bergner, J. B., Oberg, K. I., et al. 2021, arXiv e-prints, arXiv:2109.11512
- Maury et al. (2019) Maury, A. J., André, P., Testi, L., et al. 2019, A&A, 621, A76
- Meot-Ner & Karpas (1986) Meot-Ner, M. & Karpas, Z. 1986, The Journal of Physical Chemistry, 90, 2206
- Minissale et al. (2016) Minissale, M., Dulieu, F., Cazaux, S., & Hocuk, S. 2016, A&A, 585, A24
- Müller et al. (2009) Müller, H. S. P., Drouin, B. J., & Pearson, J. C. 2009, A&A, 506, 1487
- Müller et al. (2005) Müller, H. S. P., Schlöder, F., Stutzki, J., & Winnewisser, G. 2005, Journal of Molecular Structure, 742, 215
- Nazari et al. (2021) Nazari, P., van Gelder, M. L., van Dishoeck, E. F., et al. 2021, A&A, 650, A150
- Öberg et al. (2015) Öberg, K. I., Guzmán, V. V., Furuya, K., et al. 2015, Nature, 520, 198
- Öberg et al. (2014) Öberg, K. I., Lauck, T., & Graninger, D. 2014, ApJ, 788, 68
- Pantaleone et al. (2021) Pantaleone, S., Enrique-Romero, J., Ceccarelli, C., et al. 2021, ApJ, 917, 49
- Pantaleone et al. (2020) Pantaleone, S., Enrique-Romero, J., Ceccarelli, C., et al. 2020, ApJ, 897, 56
- Pickett et al. (1998) Pickett, H. M., Poynter, R. L., Cohen, E. A., et al. 1998, J. Quant. Spec. Radiat. Transf., 60, 883
- Plessis et al. (2012) Plessis, S., Carrasco, N., Dobrijevic, M., & Pernot, P. 2012, Icarus, 219, 254
- Reipurth et al. (1993) Reipurth, B., Chini, R., Krugel, E., Kreysa, E., & Sievers, A. 1993, A&A, 273, 221
- Rimola et al. (2018) Rimola, A., Skouteris, D., Balucani, N., et al. 2018, ACS Earth and Space Chemistry, 2, 720
- Rimola et al. (2014) Rimola, A., Taquet, V., Ugliengo, P., Balucani, N., & Ceccarelli, C. 2014, A&A, 572, A70
- Schöier et al. (2005) Schöier, F. L., van der Tak, F. F. S., van Dishoeck, E. F., & Black, J. H. 2005, A&A, 432, 369
- Scoville & Solomon (1974) Scoville, N. Z. & Solomon, P. M. 1974, ApJ, 187, L67
- Segura-Cox et al. (2020) Segura-Cox, D. M., Schmiedeke, A., Pineda, J. E., et al. 2020, Nature, 586, 228
- Shannon et al. (2013) Shannon, R. J., Blitz, M. A., Goddard, A., & Heard, D. E. 2013, Nature Chemistry, 5, 745
- Sheehan & Eisner (2017) Sheehan, P. D. & Eisner, J. A. 2017, ApJ, 851, 45
- Skouteris et al. (2017) Skouteris, D., Vazart, F., Ceccarelli, C., et al. 2017, MNRAS, 468, L1
- Taquet et al. (2019) Taquet, V., Bianchi, E., Codella, C., et al. 2019, A&A, 632, A19
- Taquet et al. (2012) Taquet, V., Ceccarelli, C., & Kahane, C. 2012, ApJ, 748, L3
- Taquet et al. (2015) Taquet, V., López-Sepulcre, A., Ceccarelli, C., et al. 2015, ApJ, 804, 81
- Tobin et al. (2016) Tobin, J. J., Looney, L. W., Li, Z.-Y., et al. 2016, ApJ, 818, 73
- Vigren et al. (2008) Vigren, E., Kamińska, M., Hamberg, M., et al. 2008, Physical Chemistry Chemical Physics (Incorporating Faraday Transactions), 10, 4014
- Walmsley et al. (1989) Walmsley, C. M., Henkel, C., Jacq, T., & Baudry, A. 1989, The Physics and Chemistry of Interstellar Molecular Clouds - mm and Sub-mm Observations in Astrophysics, ed. G. Winnewisser & J. T. Armstrong, Vol. 331, 107
- Watanabe & Kouchi (2002) Watanabe, N. & Kouchi, A. 2002, ApJ, 571, L173
- Yang et al. (2021) Yang, Y.-L., Sakai, N., Zhang, Y., et al. 2021, ApJ, 910, 20
- Zucker et al. (2018) Zucker, C., Schlafly, E. F., Speagle, J. S., et al. 2018, ApJ, 869, 83
Appendix A List of transitions and line properties of the CH2DCN and CH3CN emission.
| Transition | a | a | a | rms | b | b | b | b | |
|---|---|---|---|---|---|---|---|---|---|
| (GHz) | () | (K) | (D2) | (mK) | (mK) | (km s-1) | (km s-1) | (mK km s-1) | |
| CH3CN - ASAI | |||||||||
| CH3CN 53–43c | 91.9711 | 27 | 78 | 136 | 3 | 15 (2) | +9.50 (0.33) | 6.0 (0.8) | 95 (11) |
| CH3CN 52–42 | 91.9800 | 27 | 42 | 89 | 2 | 20 (2) | +7.77 (0.09) | 4.7 (0.2) | 100 (4) |
| CH3CN 51–41 | 91.9853 | 27 | 20 | 102 | 2 | 26 (2) | +8.23 (0.11) | 4.4 (0.3) | 119 (6) |
| CH3CN 50–40 | 91.9871 | 27 | 13 | 106 | 2 | 34 (2) | +8.48 (0.06) | 2.7 (0.2) | 98 (5) |
| CH3CN 63–53 | 110.3644 | 22 | 83 | 191 | 2 | 22 (2) | +8.63 (0.09) | 2.8 (0.2) | 65 (4) |
| CH3CN 62–52 | 110.3750 | 22 | 47 | 113 | 3 | 29 (3) | +8.73 (0.04) | 3.8 (1.1) | 117 (25) |
| CH3CN 61–51 | 110.3814 | 22 | 26 | 124 | 4 | 40 (4) | +8.29 (0.12) | 3.1 (0.4) | 131 (13) |
| CH3CN 60–50 | 110.3835 | 22 | 18 | 127 | 4 | 30 (4) | +8.41 (0.16) | 4.1 (0.7) | 131 (17) |
| CH3CN 84–74d | 147.1292 | 17 | 146 | 127 | 10 | 24 | - | - | - |
| CH3CN 83–73 | 147.1491 | 17 | 96 | 291 | 10 | 43 (14) | +7.86 (0.38) | 5.0 (1.0) | 231 (37) |
| CH3CN 82–72 | 147.1632 | 17 | 60 | 159 | 10 | 40 (10) | +8.27 (0.24) | 4.9 (0.6) | 208 (22) |
| CH3CN 81–71 | 147.1718 | 17 | 39 | 167 | 10 | 60 (10) | +8.28 (0.14) | 3.5 (0.4) | 223 (19) |
| CH3CN 80–70 | 147.1746 | 17 | 32 | 170 | 10 | 67 (10) | +8.61 (0.13) | 3.3 (0.5) | 231 (25) |
| CH3CN 94–84d | 165.5181 | 15 | 154 | 153 | 10 | 28 | - | - | - |
| CH3CN 93–83 | 165.5404 | 15 | 104 | 339 | 10 | 43 (10) | +8.39 (0.20) | 4.8 (0.4) | 222(18) |
| CH3CN 92–82 | 165.5563 | 15 | 68 | 181 | 10 | 55(10) | +8.27 (0.17) | 3.5 (0.5) | 209 (24) |
| CH3CN 91–81 | 165.5659 | 15 | 47 | 188 | 8 | 77 (8) | +8.33 (0.09) | 3.2 (0.2) | 261 (16) |
| CH3CN 90–80 | 165.5691 | 15 | 40 | 191 | 8 | 52 (8) | +8.34 (0.14) | 4.8 (0.4) | 264 (19) |
| CH3CN 116–106d | 202.2154 | 12 | 315 | 328 | 17 | 36 | - | - | - |
| CH3CN 115–105d | 202.2582 | 12 | 237 | 185 | 16 | 45 | - | - | - |
| CH3CN 114–104 | 202.2932 | 12 | 173 | 202 | 16 | 60 (14) | +8.18 (0.19) | 3.7 (0.4) | 236 (24) |
| CH3CN 113–103 | 202.3204 | 12 | 123 | 432 | 18 | 117 (20) | +8.21 (0.11) | 3.9 (0.2) | 478 (28) |
| CH3CN 112–102 | 202.3399 | 12 | 87 | 225 | 16 | 98 (16) | +8.16 (0.30) | 4.6 (0.8) | 475 (65) |
| CH3CN 111–101 | 202.3516 | 12 | 65 | 231 | 14 | 101 (17) | +8.08 (0.10) | 3.7 (0.2) | 399 (22) |
| CH3CN 110–100 | 202.3555 | 12 | 58 | 233 | 18 | 120 (19) | +8.30 (0.10) | 3.0 (0.3) | 383 (27) |
| CH3CN 127–117d | 220.5393 | 11 | 419 | 168 | 8 | 23 | - | - | - |
| CH3CN 126–116 | 220.5944 | 11 | 326 | 382 | 7 | 53 (7) | +8.58 (0.09) | 4.3 (0.3) | 245 (12) |
| CH3CN 125–115 | 220.6411 | 11 | 247 | 210 | 7 | 49 (7) | +8.27 (0.11) | 4.4 (0.2) | 226 (11) |
| CH3CN 124–114 | 220.6793 | 11 | 183 | 226 | 9 | 75 (9) | +8.00 (0.11) | 5.5 (0.3) | 439 (19) |
| CH3CN 123–113 | 220.7090 | 11 | 133 | 477 | 8 | 99 (8) | +8.26 (0.07) | 5.0 (0.2) | 525 (16) |
| CH3CN 122–112 | 220.7303 | 11 | 97 | 247 | 7 | 90 (7) | +8.19 (0.06) | 4.3 (0.1) | 407 (12) |
| CH3CN 121–111 | 220.7430 | 11 | 76 | 253 | 7 | 103 (7) | +8.26 (0.05) | 3.9 (0.1) | 490 (6) |
| CH3CN 120–110 | 220.7473 | 11 | 69 | 254 | 7 | 105 (7) | +8.21 (0.02) | 4.4 (0.2) | 488 (18) |
| CH3CN 137–127 | 238.9127 | 10 | 430 | 196 | 8 | 37 (8) | +7.90 (0.15) | 4.3 (0.4) | 170 (12) |
| CH3CN 136–126 | 238.9724 | 10 | 337 | 434 | 9 | 59 (9) | +7.79 (0.11) | 3.9 (0.2) | 248 (14) |
| CH3CN 135–125c | 239.0229 | 10 | 259 | 235 | 9 | 72 (9) | +8.81 (0.13) | 7.3 (0.3) | 560 (21) |
| CH3CN 134–124 | 239.0643 | 10 | 195 | 249 | 9 | 72 (9) | +7.80 (0.10) | 4.8 (0.2) | 365 (15) |
| CH3CN 133–123 | 239.0965 | 10 | 145 | 522 | 10 | 105 (10) | +7.97 (0.08) | 4.8 (0.2) | 532 (18) |
| CH3CN 132–122 | 239.1195 | 10 | 109 | 269 | 11 | 98 (11) | +8.07 (0.08) | 4.3 (0.2) | 445 (17) |
| CH3CN 131–121e | 239.1333 | 10 | 87 | 274 | 9 | - | - | - | - |
| CH3CN 130–120e | 239.1379 | 10 | 80 | 276 | 9 | - | - | - | - |
| CH3CN 147–137 | 257.2849 | 10 | 442 | 223 | 6 | 35 (6) | +8.08 (0.12) | 3.9 (0.3) | 146 (9) |
| CH3CN 146–136 | 257.3492 | 10 | 350 | 484 | 6 | 55 (6) | +8.58 (0.09) | 4.9 (0.2) | 290 (11) |
| CH3CN 145–135f | 257.4036 | 10 | 271 | 259 | 6 | - | - | - | - |
| CH3CN 144–134 | 257.4481 | 10 | 207 | 273 | 7 | 76 (7) | +8.33 (0.06) | 4.4 (0.2) | 360 (10) |
| CH3CN 143–133 | 257.4828 | 10 | 157 | 566 | 5 | 97 (5) | +8.38 (0.04) | 4.5 (0.1) | 462 (9) |
| CH3CN 142–132 | 257.5076 | 10 | 121 | 291 | 6 | 86 (6) | +8.65 (0.05) | 4.2 (0.1) | 385 (10) |
| CH3CN 141–131 | 257.5224 | 10 | 100 | 295 | 8 | 93 (8) | +8.44 (0.09) | 4.7 (0.2) | 467 (15) |
| CH3CN 140–130 | 257.5274 | 10 | 93 | 297 | 8 | 103 (8) | +8.55 (0.52) | 4.3 (0.4) | 468 (15) |
| CH2DCN - SOLIS & ASAI | |||||||||
| CH2DCN 51,4–41,3g | 87.2115 | 1.5 | 18 | 74 | 38 | 306 (25) | +9 (7) | – | 2226 (140) |
| CH2DCN 61,6–51,5g | 103.7486 | 1.3 | 23 | 90 | 26 | 290 (30) | +9 (6) | – | 1836 (200) |
| CH2DCN 121,12–111,11c | 207.4715 | 12 | 70 | 183 | 8 | - | - | - | - |
| CH2DCN 126,6–116,5 h | 208.2668 | 12 | 259 | 138 | 8 | - | - | - | - |
| CH2DCN 126,7–116,6h | |||||||||
| CH2DCN 125,7–115,6i | 208.3052 | 12 | 200 | 152 | 7 | 23 (4) | +8.34 (0.36) | 1.6 (0.8) | 38 (17) |
| CH2DCN 125,8–115,7i | |||||||||
| CH2DCN 124,9–114,8d | 208.3372 | 12 | 151 | 164 | 8 | 19 | - | - | - |
| CH2DCN 124,8–114,7d | |||||||||
| CH2DCN 120,12–110,11c | 208.3456 | 12 | 65 | 184 | 8 | - | - | - | - |
| CH2DCN 123,10–113,9d | 208.3636 | 12 | 114 | 173 | 8 | 23 | - | - | - |
| CH2DCN 123,9–113,8d | |||||||||
| CH2DCN 122,11–112,10d | 208.3684 | 12 | 87 | 179 | 8 | 23 | - | - | - |
| CH2DCN 122,10–112,9d | 208.4116 | 12 | 87 | 179 | 8 | 21 | - | - | - |
| CH2DCN 121,11–111,10 | 209.2781 | 12 | 70 | 183 | 7 | 26 (8) | +8.65 (0.32) | 4.3 (0.7) | 118 (18) |
| CH2DCN 131,13–121,12d | 224.7545 | 11 | 81 | 199 | 8 | 23 | - | - | - |
| CH2DCN 136,7–126,6j | 225.6182 | 11 | 270 | 157 | 8 | - | - | - | - |
| CH2DCN 136,8–126,7j | |||||||||
| CH2DCN 135,8–125,7d | 225.6598 | 11 | 211 | 170 | 8 | 18 | - | - | - |
| CH2DCN 135,9–125,8d | |||||||||
| CH2DCN 134,10–124,9k | 225.6946 | 11 | 162 | 181 | 13 | - | - | - | - |
| CH2DCN 134,9–124,8k | |||||||||
| CH2DCN 130,13–120,12k | 225.6951 | 11 | 76 | 200 | 13 | - | - | - | - |
| CH2DCN 133,11–123,10e | 225.7238 | 11 | 124 | 189 | 9 | - | - | - | - |
| CH2DCN 133,10–123,9e | 225.7241 | ||||||||
| CH2DCN 132,12–122,11e | 225.7265 | 11 | 97 | 195 | |||||
| CH2DCN 132,11–122,10 | 225.7815 | 11 | 97 | 195 | 7 | 30 (10) | +8.59 (0.13) | 1.8 (1.0) | 60 (23) |
| CH2DCN 131,12–121,11l | 226.7113 | 11 | 82 | 199 | 8 | - | - | - | - |
| CH2DCN 141,14–131,13m | 242.0358 | 10 | 93 | 214 | 8 | - | - | - | - |
| CH2DCN 147,7–137,6n | 242.9159 | 10 | 351 | 161 | 11 | - | - | - | - |
| CH2DCN 147,8–137,7n | |||||||||
| CH2DCN 146,8–136,7d | 242.9685 | 10 | 281 | 175 | 11 | 20 | - | - | - |
| CH2DCN 146,9–136,8d | |||||||||
| CH2DCN 145,9–135,8d | 243.0134 | 10 | 222 | 188 | 10 | 21 | - | - | - |
| CH2DCN 145,10–135,9d | |||||||||
| CH2DCN 140,14–130,13 | 243.0415 | 10 | 87 | 215 | 8 | 31 (8) | +8.84 (0.27) | 4.3 (1.1) | 140 (30) |
| CH2DCN 144,11–134,10 | 243.0512 | 10 | 174 | 198 | 10 | 32 (6) | +8.79 (0.39) | 4.0 (1.0) | 134 (27) |
| CH2DCN 144,10–134,9 | |||||||||
| CH2DCN 143,12–133,11 | 243.0830 | 10 | 136 | 205 | 8 | 40 (5) | +8.42 (0.21) | 4.6 (0.5) | 197 (17) |
| CH2DCN 142,13–132,12 | 243.0833 | 10 | 109 | 211 | 8 | ||||
| CH2DCN 143,11–133,10 | 243.0835 | 10 | 136 | 205 | 8 | ||||
| CH2DCN 142,12–132,11d | 243.1520 | 10 | 109 | 211 | 8 | 20 | - | - | - |
| CH2DCN 141,13–131,12 | 244.1428 | 10 | 93 | 214 | 9 | 36 (7) | +9.26 (0.13) | 2.4 (0.5) | 90 (14) |
a Frequencies and spectroscopic parameters have been provided by Cazzoli & Puzzarini (2006) and Müller et al. (2009) and by the Jet Propulsion Laboratory molecular database Pickett et al. (1998) for CH3CN, while they were provided by Müller et al. (2009) and retrieved from the Cologne Database for Molecular Spectroscopy (Müller et al. 2005) for CH2DCN. b The errors in brackets are the Gaussian fit uncertainties. c Blended with unidentified line (see Fig. 11 and Fig. 12) and thus excluded from the further analysis. d Excluded from further analysis since the line peak is below the detection threshold (S/N 3 see Sec. 2.2). e Conservatively excluded from the analysis since the line profiles are broad (composed of different transitions close in frequency, see Fig. 11 and 12). f Blended with CH3OH 183,16–182,17 A, 257.4021 GHz, Eup= 447 K. g These transitions are only detected by the NOEMA/SOLIS observations. The low spectral resolution (6–7 km s-1) does not allow us to safely estimate the line width. A Gaussian fit is not performed given the unresolved line profiles. We note that all the expected CH2DCN transitions are detected in the NOEMA/SOLIS dataset, but we consider conservatively only these two lines which are not contaminated by other molecular species. h Blended with CH3CHO 110,11–100,10 A, 208.2670 GHz, Eup= 60 K. i These transitions have the highest upper level energy of all the detected transitions, while others with similar intensities and lower energies are not detected. To be conservative we decided to exclude the line from the analysis. jBlended with HCOOCH3 193,17–183,16 A, 225.6187 GHz, Eup= 117 K. kBlended with H2CO 31,2–21,1, 225.6978 GHz, Eup= 33 K. l Blended with HCOOCH3 202,19–192,18 E, 226.7131 GHz, Eup= 120 K. m Blended with CH2DOH 112,9–111,10 o1, 242.0336 GHz, Eup= 177 K. n Blended with C33S 5–4, 242.9136 GHz, Eup= 35 K.
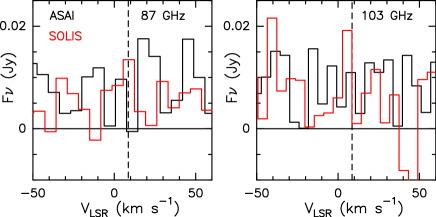
Appendix B ASAI versus SOLIS spectra of CH2DCN
Figure 10 shows the comparison between the IRAM-30m 3mm spectrum obtained in the context of the ASAI Large Program Lefloch et al. (2018) and the spectra derived by integrating the emission in the NOEMA-SOLIS images in a region equal to the HPBW of the IRAM-30m (28 at 87 GHz, and 24 at 103 GHz).
Appendix C ASAI spectra
Figures 11 and 12 show the ASAI spectra overlaid with the synthetic spectra derived for the CH3CN and CH2DCN emission. The best fit model (see Sects. 3.3 and 3.4) and the uncertainties are shown.