Magnetocaloric performance of RE11Co4In9 (RE = Tb, Er)
Abstract
The magnetocaloric effect in RE11Co4In9 (RE = Tb, Er) has been studied by means of magnetometric measurements in the function of temperature and applied magnetic field. The maximum magnetic entropy change () at magnetic flux density change () 0-9 T has been determined to be 5.51 JkgK-1 at 47.4 K for Tb11Co4In9 and 14.28 JkgK-1 at 12.3 K for Er11Co4In9, while temperature averaged entropy change (TEC) with 3 K span equals 5.50 and 14.14 JkgK-1 for RE = Tb and Er, respectively. The relative cooling power (RCP) and refrigerant capacity (RC) equal respectively 522.1 and 391.2 Jkg-1 in Tb11Co4In9 and 605.2 and 463.1 Jkg-1 in Er11Co4In9.
keywords: rare earth intermetallics, magnetocaloric effect, magnetic entropy change, relative cooling power, refrigerant capacity
I Introduction
Magnetocaloric effect (MCE) is nowadays of great scientific interest due to its application in magnetic refrigeration (MR) [1]. Recently, promising magnetocaloric properties have been reported for RE11Co4In9 (RE = Gd, Dy, Ho) [2].
The RE11Co4In9 (RE = Gd–Er) intermetallics are known to crystallize in an orthorhombic crystal structure of the Nd11Pd4In9-type (space group ) [3, 2, 4]. Within the -plane, the structure consists of the RECo2 (AlB2-type) and REIn (CsCl-type) fragments in the 9:2 ratio [5]. Along the -axis, the layers composed of the rare earth atoms () are separated by layers containing the Co and In atoms . In this complex crystal structure the rare earth atoms occupy five nonequivalent Wyckoff sites.
The measurements of magnetization vs temperature, undertaken at magnetic flux density of 2 T (20 kOe), show a transition from para- to ferromagnetic state at 86, 37 and 20 K for RE = Gd, Dy and Ho, respectively [2]. The more recent measurements, performed at a low magnetic flux density of 0.005 T (50 Oe), reveal a cascade of magnetic transitions at 95, 85, 70 and 35 K (RE = Tb), 88, 28 and 19 K (RE = Dy), 33 and 10 K (RE = Ho) with only exception for RE = Er, where a single transition, characteristic of formation of an antiferromagnetic order below 5.4 K, is observed [4]. The effective magnetic moments in RE11Co4In9 (RE = Gd–Er) are close to the values expected for the free RE3+ ions, indicating that magnetism in the investigated compounds is related to the rare earth magnetic moments while the Co atoms remain either non-magnetic or their magnetic moments are tiny and negligible when compared to high rare earth moments. Isothermal magnetization curves do not show saturation for RE = Gd, Dy and Ho at K and T (70 kOe) [2] as well as for RE = Tb, Dy, Ho and Er at K and T (90 kOe) [4]. It is worth noting that the primary isothermal magnetization curve for RE = Er, collected at 2 K, shows a metamagnetic transition at 0.06 T (0.6 kOe), indicating that the low-temperature antiferromagnetic order can be turned into a ferromagnetic one by application of relatively low magnetic field [4].
The magnetocaloric properties have been reported only for RE = Gd, Dy and Ho [2]. In the vicinity of the respective Curie temperature, the magnetic entropy change reaches 10.95, 4.66 and 12.29 JkgK-1 for RE = Gd, Dy and Ho, respectively. The temperature averaged entropy change (TEC) with 3 K span shows the values of 10.93 (RE = Gd), 4.64 (Dy) and 12.09 JkgK-1 (Ho). Relative cooling power (RCP) and refrigerant capacity (RC) are found to be 538.1 and 405.9 Jkg-1 (RE = Gd), 213.9 and 165.9 Jkg-1 (Dy) and 475.2 and 357.4 Jkg-1 (Ho).
In this work, the magnetocaloric properties of Tb11Co4In9 and Er11Co4In9 are reported, as derived from measurements of magnetization in the function of temperature and applied magnetic field (up to 9 T). These results extend the knowledge on magnetocaloric properties to all members of the RE11Co4In9 (RE = Gd–Er) family of compounds.
II Materials and methods
The samples investigated in this work are the same samples as those reported in the previous study [4]. The reader interested in synthesis procedure and crystal structure parameters can find all this information in Ref. [4].
The magnetocaloric effect in RE11Co4In9 (RE = Tb, Er) has been investigated with the use of a vibrating sample magnetometer (VSM) option of the Physical Properties Measurement System by Quantum Design, equipped with a superconducting magnet running up to 9 T. In order to collect the data, the following procedure has been performed:
-
•
Demagnetization in the paramagnetic state by decreasing oscillating magnetic field.
-
•
Cooling down to 2 K.
-
•
Setting the desired value of magnetic flux density (the data were collected at 0.5, 1.0, …, 9.0 T).
-
•
Collecting magnetization vs temperature data up to 200 K (Tb11Co4In9) or 70 K (Er11Co4In9).
-
•
Repetition of the above steps for the next value of magnetic flux density.
III Results and discussion
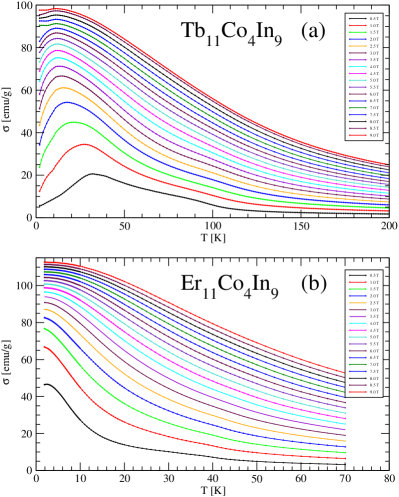
Fig. 1 shows the magnetization vs temperature curves collected for RE11Co4In9 (RE = Tb, Er) at selected values of magnetic flux density. All the curves have an inflection point characteristic of the transition from para- to ferro-/ferrimagnetic state. A maximum visible in the curves for Tb11Co4In9 indicates the development of an antiferromagnetic contribution to the magnetic structure at low temperatures. With the increase of the applied magnetic field, the maximum shifts to lower temperatures and finally disappears, indicating the suppression of the antiferromagnetic component by applying a high magnetic field.
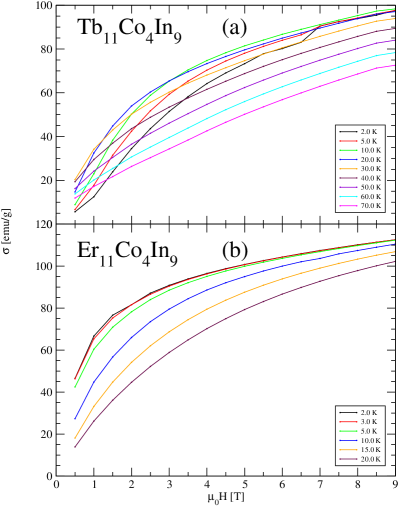
This result is in agreement with the magnetization vs magnetic flux density curves presented in Fig. 2. The curves for Tb11Co4In9, collected at the lowest temperatures, show a distinct metamagnetic transition indicating that antiferromagnetic contribution to the magnetic order is turned into the ferro/ferrimagnetic one by application of the external magnetic field. The metamagnetic transition disappears with increasing temperature.
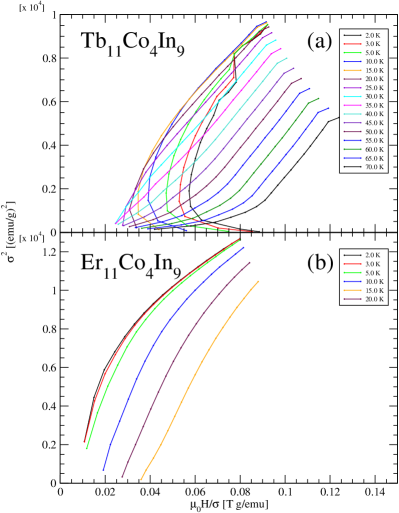
In order to ensure that the magnetic transition corresponding to the maximum magnetic entropy change is the second-order phase transition (SOPT), not the first-order phase transition (FOPT), and therefore no thermal hysteresis of magnetic entropy change is expected, the Arrott curves at selected temperatures have been calculated (see Fig. 3). The theory predicts that the sign of the slope of Arrott curve corresponds to the character of the magnetic phase transition, i.e. it is positive for SOPT and negative for FOPT [6]. It is clearly visible in Fig. 3 that all curves for Er11Co4In9 have positive slope and only some low-temperature curves for Tb11Co4In9 have negative slope within a limited range. Therefore, the FOPT in Tb11Co4In9 is related to the appearance of the low-temperature antiferromagnetic contribution to the magnetic order. It has to be mentioned that all Arrot curves in the vicinity of temperatures at which magnetic entropy change reaches its maximum (i.e. 47.4 K in Tb11Co4In9 and 12.3 K in Er11Co4In9 for magnetic flux density change 0-9 T) have positive slope, indicating that the corresponding magnetic phase transition is SOFT.
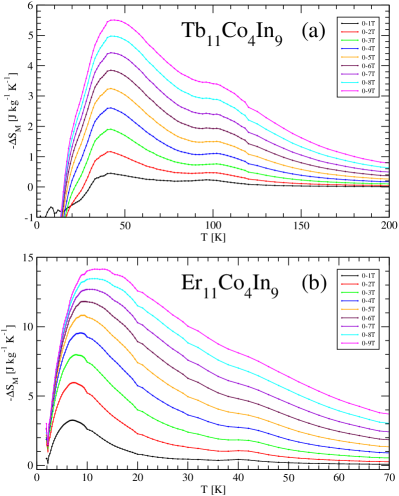
In order to calculate the magnetic entropy change under isothermal conditions, the following well-known equation has been used:
| (1) |
where is a change of the magnetic flux density, defined as a difference between the final () and initial () flux densities, while is a derivative of magnetization over temperature at fixed magnetic flux density [7]. As it is commonly assumed to report magnetic entropy change with respect to the initial magnetic flux density equal to zero (), the same convention is used in the current study. Fig. 4 shows magnetic entropy change in function of temperature for selected values of the magnetic flux density change. The maximum magnetic entropy change for = 0-9 T reaches 5.51 JkgK-1 at 47.4 K for Tb11Co4In9 and 14.28 JkgK-1 at 12.3 K for Er11Co4In9. The values of maximum magnetic entropy change for different magnetic flux density changes between 0-1 up to 0-9 T are listed in Table 1.
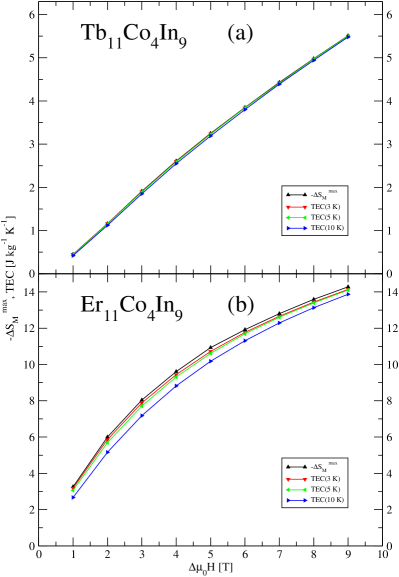
Another, recently introduced parameter characterizing a magnetocaloric material is the temperature averaged magnetic entropy change () over a given temperature span (), defined by the following equation [8]:
| (2) |
where the integral is maximized with respect to the parameter which is a center of the temperature span (). Fig. 5 shows maximum magnetic entropy change () together with temperature averaged magnetic entropy change () over 3, 5 and 10 K in function of magnetic flux density change for RE11Co4In9 (RE = Tb, Er). The values of and for the whole RE11Co4In9 (RE = Gd-Er) series of intermetallics is listed in Table 1. While comparing and at magnetic flux density change of 0-7 T for compounds with different chemical compositions, it is well visible that the values of (3 K) are very close to those of and they slightly decrease with increasing temperature span . However, even for K, the corresponding temperature averaged magnetic entropy changes ((10 K)) equal at least 94 % of the respective , indicating that RE11Co4In9 (RE = Gd-Er) show good magnetocaloric performance over wide temperature span.
Gd11Co4In9 (data from Ref. [2])
| TEC(3 K) | TEC(5 K) | TEC(10 K) | ||
|---|---|---|---|---|
| [JkgK-1] | [JkgK-1] | [JkgK-1] | [JkgK-1] | |
| 0-1 | 2.92 | 2.79 | 2.68 | 2.41 |
| 0-2 | 5.03 | 4.96 | 4.88 | 4.59 |
| 0-3 | 6.55 | 6.52 | 6.48 | 6.22 |
| 0-4 | 7.86 | 7.83 | 7.79 | 7.55 |
| 0-5 | 9.01 | 8.92 | 8.88 | 8.70 |
| 0-6 | 10.02 | 10.01 | 9.93 | 9.72 |
| 0-7 | 10.95 | 10.93 | 10.85 | 10.65 |
Tb11Co4In9 (this work)
| TEC(3 K) | TEC(5 K) | TEC(10 K) | ||
|---|---|---|---|---|
| [JkgK-1] | [JkgK-1] | [JkgK-1] | [JkgK-1] | |
| 0-1 | 0.45 | 0.45 | 0.44 | 0.42 |
| 0-2 | 1.16 | 1.16 | 1.15 | 1.12 |
| 0-3 | 1.91 | 1.90 | 1.89 | 1.85 |
| 0-4 | 2.61 | 2.60 | 2.59 | 2.55 |
| 0-5 | 3.25 | 3.24 | 3.23 | 3.19 |
| 0-6 | 3.85 | 3.84 | 3.84 | 3.80 |
| 0-7 | 4.43 | 4.42 | 4.41 | 4.39 |
| 0-8 | 4.98 | 4.97 | 4.97 | 4.94 |
| 0-9 | 5.51 | 5.50 | 5.50 | 5.48 |
Dy11Co4In9 (data from Ref. [2])
| TEC(3 K) | TEC(5 K) | TEC(10 K) | ||
|---|---|---|---|---|
| [JkgK-1] | [JkgK-1] | [JkgK-1] | [JkgK-1] | |
| 0-1 | 0.38 | 0.37 | 0.37 | 0.34 |
| 0-2 | 1.14 | 1.12 | 1.18 | 1.12 |
| 0-3 | 2.09 | 2.06 | 2.02 | 1.94 |
| 0-4 | 2.88 | 2.84 | 2.80 | 2.71 |
| 0-5 | 3.53 | 3.51 | 3.47 | 3.38 |
| 0-6 | 4.09 | 4.08 | 4.05 | 3.98 |
| 0-7 | 4.66 | 4.64 | 4.61 | 4.55 |
Ho11Co4In9 (data from Ref. [2])
| TEC(3 K) | TEC(5 K) | TEC(10 K) | ||
|---|---|---|---|---|
| [JkgK-1] | [JkgK-1] | [JkgK-1] | [JkgK-1] | |
| 0-1 | 0.91 | 0.90 | 0.88 | 0.83 |
| 0-2 | 2.95 | 2.90 | 2.86 | 2.74 |
| 0-3 | 5.23 | 5.11 | 5.03 | 4.81 |
| 0-4 | 7.34 | 7.17 | 7.06 | 6.78 |
| 0-5 | 9.22 | 9.00 | 8.87 | 8.55 |
| 0-6 | 10.84 | 10.61 | 10.47 | 10.13 |
| 0-7 | 12.29 | 12.09 | 11.90 | 11.54 |
Er11Co4In9 (this work)
| TEC(3 K) | TEC(5 K) | TEC(10 K) | ||
|---|---|---|---|---|
| [JkgK-1] | [JkgK-1] | [JkgK-1] | [JkgK-1] | |
| 0-1 | 3.26 | 3.18 | 3.06 | 2.67 |
| 0-2 | 6.00 | 5.86 | 5.69 | 5.16 |
| 0-3 | 8.04 | 7.88 | 7.71 | 7.18 |
| 0-4 | 9.61 | 9.44 | 9.31 | 8.82 |
| 0-5 | 10.93 | 10.72 | 10.61 | 10.18 |
| 0-6 | 11.92 | 11.77 | 11.69 | 11.31 |
| 0-7 | 12.80 | 12.66 | 12.60 | 12.29 |
| 0-8 | 13.59 | 13.44 | 13.39 | 13.13 |
| 0-9 | 14.28 | 14.14 | 14.10 | 13.87 |
Apart from the above discussed and TEC, there are two more parameters that provide useful information about MCE in a given material – these are: refrigerant capacity (RC) [9] and relative cooling power (RCP) [10], defined as follows:
| (3) |
| (4) |
where denotes full width at half-maximum of the curve while and refer respectively to the lower and higher limits of the range.
The values of RC and RCP for the whole RE11Co4In9 (RE = Gd–Er) family of compounds are listed in Table 2. For a fixed value of the flux density change (), RC and RCP decrease with the increasing number of the electrons, reaching a local minimum for RE = Dy, and afterwards for RE = Ho, Er they increase to the values comparable with those found for RE = Gd.
The magnetocaloric performance of the RE11Co4In9 (RE = rare earth) intermetallics is comparable to that of the best known magnetocaloric materials [11, 12], making RE11Co4In9 good candidates for low-temperature magnetocaloric refrigeration.
| Material | RCP [Jkg-1] | RC [Jkg-1] | Ref. | ||||
|---|---|---|---|---|---|---|---|
| 0-2 T | 0-5 T | 0-9 T | 0-2 T | 0-5 T | 0-9 T | ||
| Gd11Co4In9 | 106.3 | 357.9 | 81.5 | 269.9 | [2] | ||
| Tb11Co4In9 | 44.6 | 179.5 | 522.1 | 34.5 | 139.5 | 391.2 | this work |
| Dy11Co4In9 | 27.1 | 128.4 | 20.4 | 97.8 | [2] | ||
| Ho11Co4In9 | 87.4 | 306.7 | 66.1 | 228.7 | [2] | ||
| Er11Co4In9 | 84.6 | 265.1 | 605.2 | 66.2 | 205.3 | 463.1 | this work |
IV Conclusions
The magnetocaloric effect in RE11Co4In9 (RE = Tb, Er) has been investigated by magnetometric measurements in the function of temperature and applied magnetic field. Based on these data, the following parameters characterizing magnetocaloric performance have been determined: , TEC, RC and RCP. Comparison of these parameters for the whole RE11Co4In9 (RE = Gd–Er) family of compounds leads to the conclusion that the intermetallics with RE = Gd, Ho and Er show high and comparable one to another magnetocaloric performance, much higher than that found for RE = Tb and Dy. It is worth noting that although the parameters characterizing MCE in RE = Gd, Ho and Er take similar values, the corresponding maximum magnetic entropy changes appear at different temperatures which are closely related to the magnetic transition temperatures of individual compounds. The maximum of is found around 90, 20 and 10 K for RE = Gd, Ho and Er, respectively.
Declaration of Competing Interest
The authors declare no conflict of interest.
Acknowledgements
The research was partially carried out with the equipment purchased thanks to the financial support of the European Regional Development Fund in the framework of the Polish Innovation Economy Operational Program (contract no. POIG.02.01.00-12-023/08).
References
- Franco et al. [2018] V. Franco, J. S. Blázquez, J. J. Ipus, J. Y. Law, L. M. Moreno-Ramírez, A. Conde, Magnetocaloric effect: From materials research to refrigeration devices, Prog. Mater. Sci. 93 (2018) 112–232. 10.1016/j.pmatsci.2017.10.005.
- Zhang et al. [2020] Z. Zhang, P. Wang, N. Wang, X. Wang, P. Xu, L. Li, Structural and cryogenic magnetic properties of rare earth rich RE11Co4In9 (RE= Gd, Dy and Ho) intermetallic compounds, Dalton Trans. 49 (2020) 8764–8773. 10.1039/D0DT01212B.
- Yu. Tyvanchuk et al. [2012] Yu. Tyvanchuk, M. Dzevenko, Ya. Kalychak, R11Co4In9 (R = Gd, Tb, Dy, Ho, Er) – the first representatives of Nd11Pd4in9 structure type in R–Co–In systems, Visnyk Lviv Univ., Series Chem. 53 (2012) 127–132. Ukrainian.
- Baran et al. [2021] S. Baran, Yu. Tyvanchuk, A. Szytuła, Crystal structure and magnetic properties of R11Co4In9 (R = Tb, Dy, Ho and Er) compounds, Intermetallics 130 (2021) 107065. 10.1016/j.intermet.2020.107065.
- Sojka et al. [2008] L. Sojka, M. Manyako, R. Černý, M. Ivanyk, B. Belan, R. Gladyshevskii, Ya. Kalychak, Nd11Pd4In9 compound – a new member of the homological series based on AlB2 and CsCl types, Intermetallics 16 (2008) 625–628. 10.1016/j.intermet.2008.01.001.
- Banerjee [1964] B. K. Banerjee, On a generalised approach to first and second order magnetic transitions, Phys. Lett. 12 (1964) 16–17. 10.1016/0031-9163(64)91158-8.
- Tishin and Spichkin [2003] A. M. Tishin, Y. I. Spichkin, The Magnetocaloric Effect and its Applications, Institute of Physics Publishing, Bristol (UK) and Philadelphia (PA), 2003.
- Griffith et al. [2018] L. D. Griffith, Y. Mudryk, J. Slaughter, V. K. Pecharsky, Material-based figure of merit for caloric materials, J. Appl. Phys. 123 (2018) 034902. 10.1063/1.5004173.
- Wood and Potter [1985] M. E. Wood, W. H. Potter, General analysis of magnetic refrigeration and its optimization using a new concept: maximization of refrigerant capacity, Cryogenics 25 (1985) 667–683. 10.1016/0011-2275(85)90187-0.
- K. A. Gschneidner, Jr. and Pecharsky [2000] K. A. Gschneidner, Jr., V. K. Pecharsky, Magnetocaloric materials, Annu. Rev. Mater. Sci. 30 (2000) 387–429. 10.1146/annurev.matsci.30.1.387.
- K. A. Gschneidner, Jr. et al. [2005] K. A. Gschneidner, Jr., V. K. Pecharsky, A. O. Tsokol, Recent developments in magnetocaloric materials, Rep. Prog. Phys. 68 (2005) 1479–1539. 10.1088/0034-4885/68/6/R04.
- Lyubina [2017] J. Lyubina, Magnetocaloric materials for energy efficient cooling, J. Phys. D: Appl. Phys. 50 (2017) 053002. 10.1088/1361-6463/50/5/053002.