A Dynamical Evolution Study of the Open Clusters: Berkeley 10, Berkeley 81, Berkeley 89 and Ruprecht 135
Abstract
By utilising Gaia EDR3 photometric/astrometric data, we studied the dynamical evolution from the obtained astrophysical, structural and dynamical parameters of the open clusters (OCs), Berkeley 10 (Be 10), Berkeley 81 (Be 81), Berkeley 89 (Be 89), and Ruprecht 135 (Ru 135). The Gaia EDR3 photometric distances from the isochrone fitting method are smaller than the ones of Gaia EDR2. The relaxation times of four OCs are smaller than their ages, in this regard, they are dynamically relaxed. Their steep overall mass function slopes mean that their low mass stars outnumber their massive ones. Their large /relatively small values imply an advanced mass segregation. Therefore, they seem to have lost their low-mass stars much to the field. Be 89’s outer parts indicate an expansion with time. However, Be 10 and Be 81 show the relatively shrinkage core/cluster radii due to dynamical evolution. Ru 135 (1.0 Gyr) may have a primordial origin, instead of shrinking in size and mass with time. Be 89’s tidal radius is less than its cluster radius. This means that its member stars lie within its tidal radius, in the sense it is gravitationally bound to the cluster. For the rest OCs, the cluster members beyond their tidal radii are gravitationally unbound to the clusters, which are more influenced by the potential of the Galaxy.
keywords:
(Galaxy:) open clusters and associations:general , (Galaxy:) open clusters and associations: individual , Galaxy: stellar content[i1]organization=İstanbul University Faculty of Science, Department of Astronomy and Space Sciences, addressline=İstanbul Üniversitesi Merkez Kampüsü, city=İstanbul, postcode=34116, state=Türkiye, country=TR
1 Introduction
Cluster members of the OCs evolve dynamically due to internal (mass loss during stellar evolution, mass segregation, evaporation) and external perturbations such as encounters with the disk and Giant Molecular Clouds (GMCs), spiral arm shocks, and tidal stripping due to the galactic potential. The OCs lose a significant fraction of their primordial masses through via these processes (Lamers & Gieles, 2006) and (Gieles et al., 2007). As emphasized by Converse & Stahler (2011), inner cores of star clusters contract, and thus their outer parts expand by transferring energy to the outer skirts. In the sense mass segregation drives the low mass stars to the outer parts of the clusters. Most of the original mass are lost to the field because of dynamical effects along the several Myrs since their formation.
From the analysis of Gaia EDR3 data of 389 OCs, Tarricq et al. (2021) report that the cluster dimensions and mass segregation depend on cluster ages, in this regard, their core radii are on the average small for old OCs. They also state that mass segregation is more effective in old OCs.
In this paper we study the dynamical evolution of Be 81, Ru 135, Be 10, and Be 89 from Gaia EDR3 photometric/astrometric data. The first two are located in the inner galaxy and the other two are outside the solar circle. These old-aged OCs have been selected as representatives of first and second galactic quadrants in Fig. 1, where their positions relative to the spiral arms are displayed. Location criterion is important due to the survival rate of the OCs. As discussed by Bonatto & Bica (2007b) and Güneş et al. (2017), the majority of OCs with Gyr lie outside the solar circle. The OCs inside the solar circle are scarce in the direction of galactic centre, due to the effects of strong absorption/crowding/dissolution by GMCs. Bonatto & Bica (2007b) reported a deficiency of OCs older than 0.85 Gyr inside solar radius. Within the framework of these issues, the astrophysical parameters (reddening, distance, age), structural parameters , tidal radii (), overall masses, mass function slopes (, MFs), time scales (relaxation time , evolutionary parameter , dissociation time ) of these OCs have been derived. Our sample OCs were studied before in the literature with 2MASS JHKs and UBVRI photometries (Table 2). Cantat-Gaudin et al. (2020) also provided their astrophysical parameters from Gaia DR2 data.
The organization of this paper is as follows. The separation of the cluster members is explained in Section 2. The determination of reddenings, distance moduli/distances, ages, and structural parameters of four OCs is given in Section 3. Masses/mass function slopes, time scales (relaxation and dissolution times and evolutionary parameters), tidal radii, half-mass radii of four OCs are presented in Sections 4-5. Kinematics and orbital parameters are given in Section 6. A Discussion/Conclusion is presented in Section 7.
2 Separation of the Cluster Members
To separate the cluster members of our sample OCs from the field stars, their Gaia EDR3 astrometric/photometric data Brown et al. (2018) have been downloaded for a large-area (10 arcmin) from
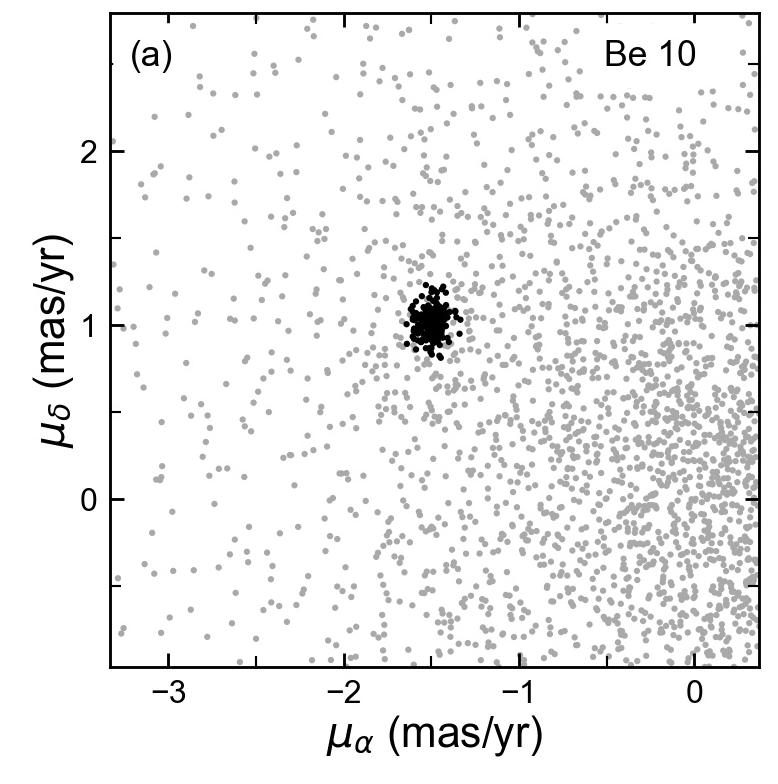
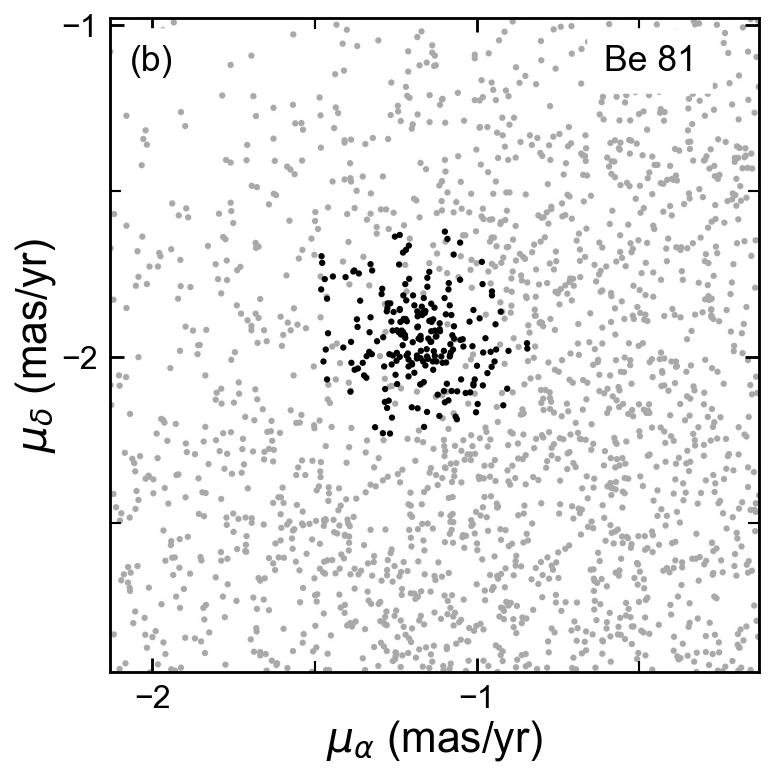
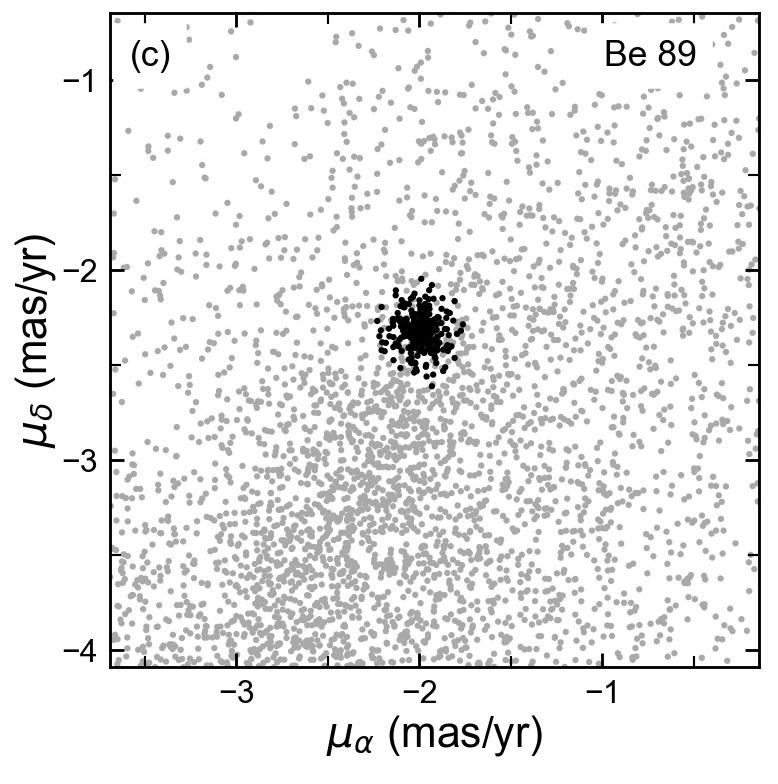
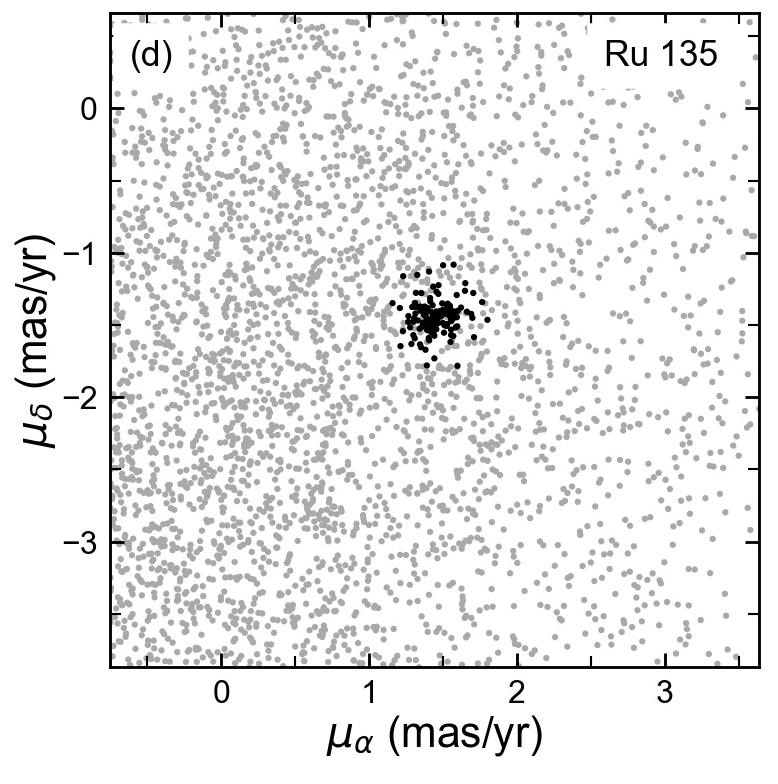
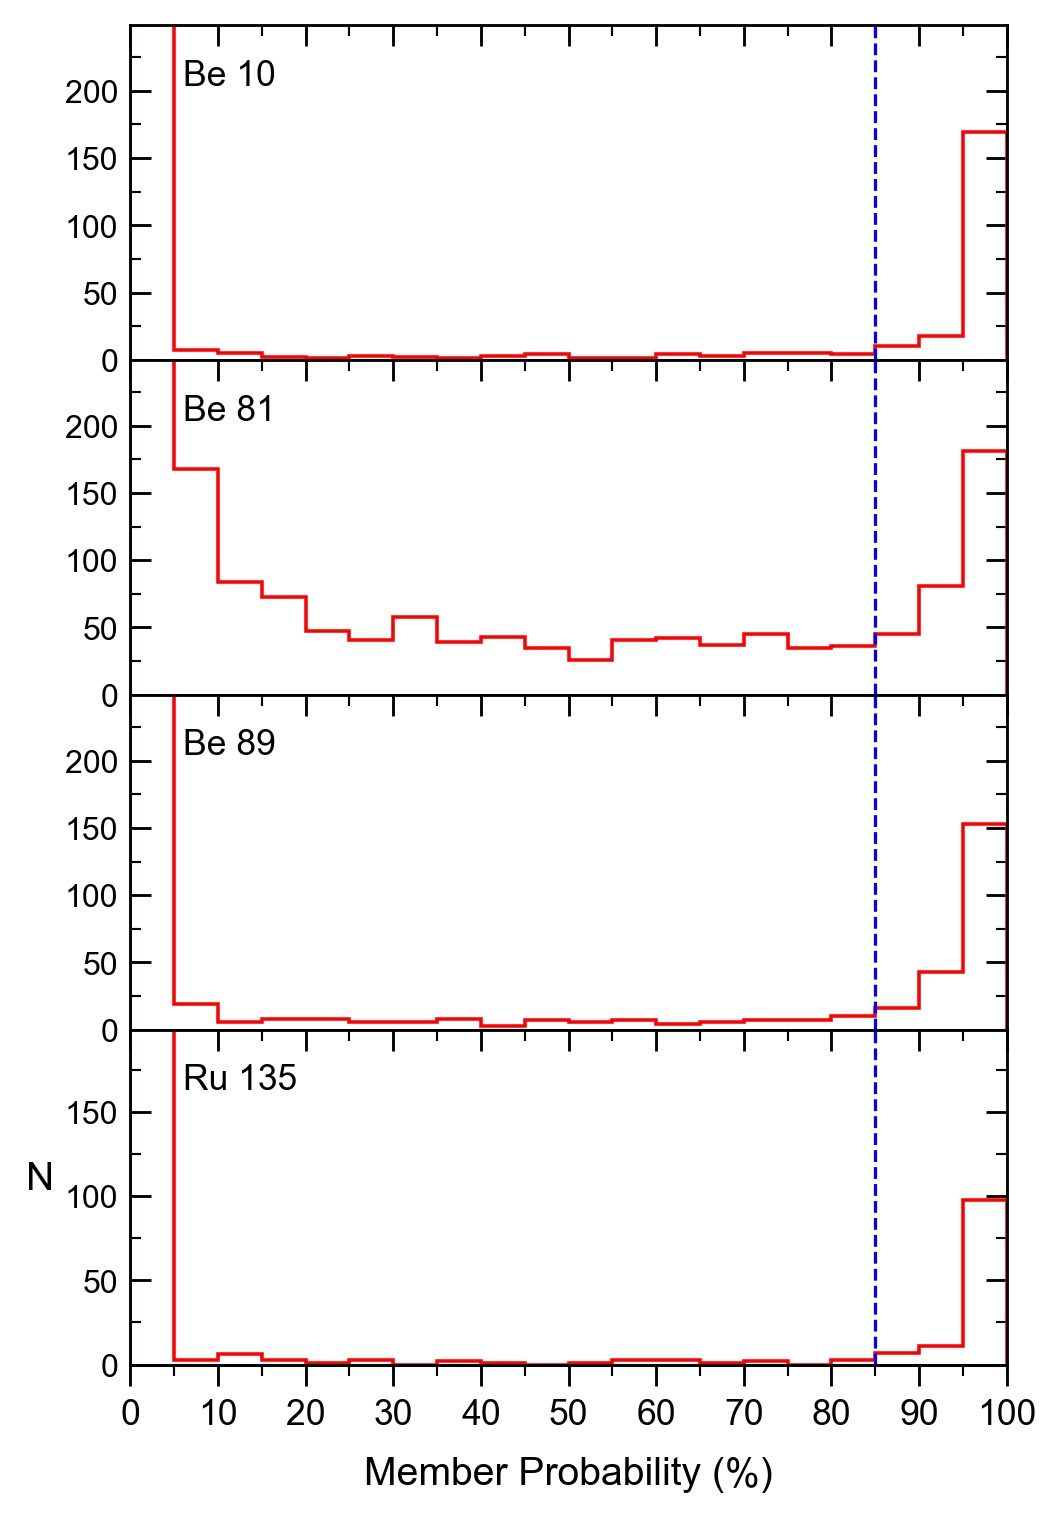
VizieR111http://vizier.u-strasbg.fr/viz-bin/VizieR?-source=II/246.. On the (, ) diagrams (Fig. 2), the potential cluster members show a more concentrated structure, whereas field stars have a more scattered distribution. We have applied Gaussian Mixture Model (GMM) (Pedregosa et al., 2011) to the cluster stars. During GMM model trials, more than two suitable components were selected to clearly obtaion the central density in the vector point diagrams. Thus, the membership probabilities P(%) of each cluster have been determined appropriately. The first significant rise in Fig. 3 is taken into account as the membership percentage (vertical dashed blue line). From Fig. 3, the probable members of four OCs seem to have greater than 85. The GMM 222 is defined /. Here is the total probability distribution. c and f subscripts for cluster and field parameters, respectively. The used parameters for estimation of and are , , , , , . model considers that the distribution of proper motions of the stars in a cluster’s region can be represented by two elliptical bivariate Gaussians. For the used parameters, see the papers of Balaguer-Nunez et al. (1998), Wu et al. (2002), Sariya et al. (2012) and Dias et al. (2018).
Cluster (mas/yr) (mas/yr) (mas) N Be 10 3 39 30.9 66 29 08.7 138.61 8.88 197 Be 81 19 01 41.2 -00 27 25.7 33.69 -2.49 171 Be 89 20 24 24.9 46 02 03.1 83.13 4.84 221 Ru 135 17 57 59.4 -11 39 59.8 16.38 6.27 119 Be 10 179 Be 81 127 Be 89 176 Ru 135 48
The median proper motion components, the median parallaxes/distances, and the member numbers of four OCs are presented in Table 1. Instead of the inverse of Gaia EDR3 parallaxes, we averaged the parallaxes of cluster stars and then get the posterior probability density functions(PDFs) from those reduced errors, given by Bailer-Jones et al. (2018, 2021). For this, the global zero point is taken as 0.017 mas (Lindegren et al., 2021). Within the uncertainties, all the values are consistent with each other within the uncertainties, as compared to Cantat-Gaudin et al. (2018, 2020) (bottom row). The estimated median equatorial coordinates from the likely members of our OCs and their corresponding galactic coordinates are listed in Table 1. These coordinates are similar to those of WEBDA (Mermilliod, 1992).
3 Astrophysical and Structural Parameters


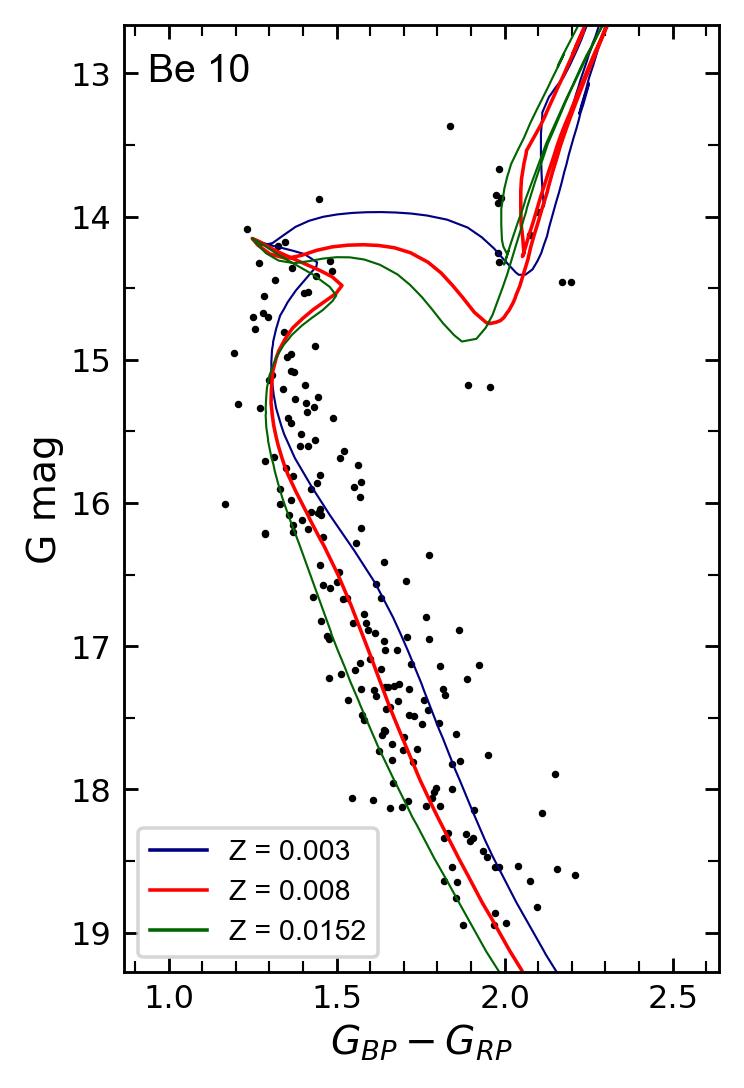
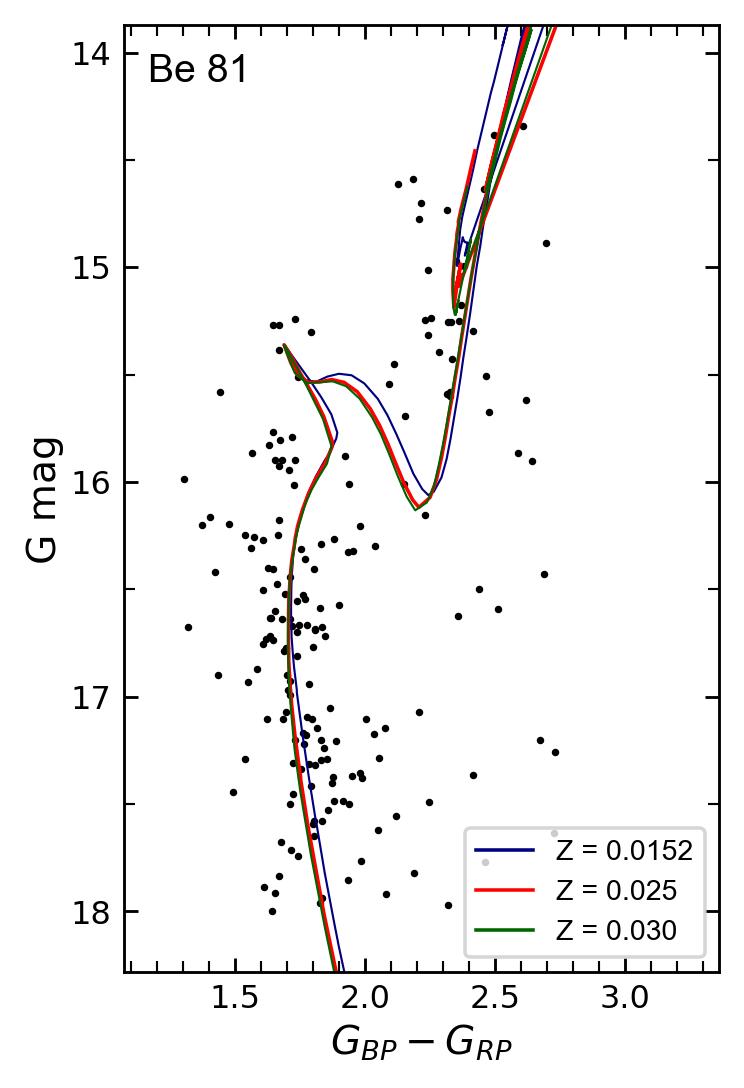
The astrophysical parameters from the probable members of four OCs have been determined by fitting the observational colour-magnitude diagrams (CMDs) to the PARSEC isochrones of Bressan et al. (2012) (hereafter B12). Magrini et al. (2015) give the spectroscopic metal abundance of Be 81 as . This corresponds to heavy element abundance . For the rest OCs, their spectroscopic metal abundances are not available in the literature. Therefore, several iterations by taking the isochrones of three heavy element abundances () together with an appropriate age are performed on the Gaia CMDs. The isochrones with (0.008, 1350) for Be 10, (0.025, 1600) for Be 81, (0.0152, 3200) for Be 89, and (0.0152, 1000) for Ru 135, respectively provide satisfactory fits (Figs. 4-5). The PARSEC isochrones are shifted both vertically and horizontally on the Gaia CMDs to obtain the best fit to the observed main sequence, as well as the RG/RC (Red Giant/Red Clump) sequence, according to the interstellar reddening values of (Col. 2 of Table 2). Thus, distance modulus and age are obtained. The distance moduli , distances d(pc) and ages (Myr) of four OCs are given in Cols. 5-7 of Table 2. Their ’s are converted from their ’s via (Wang & Chen, 2019).
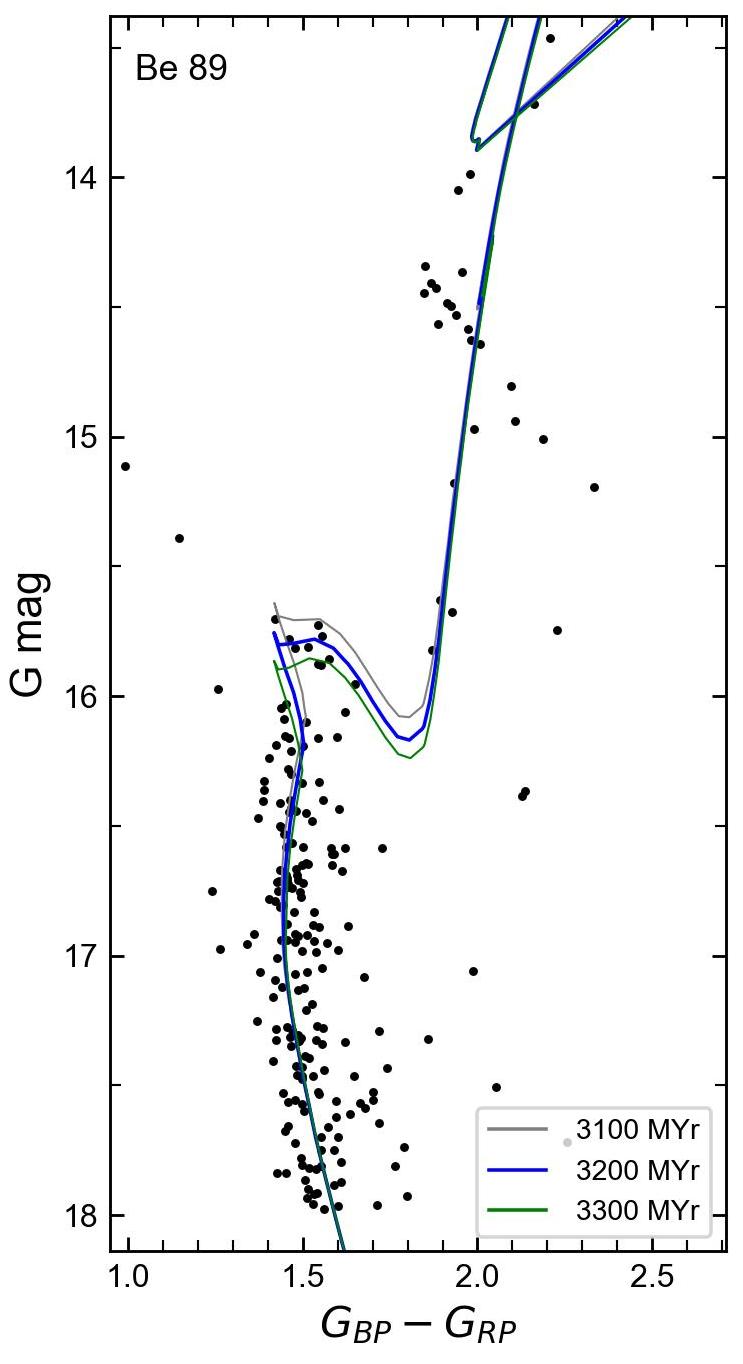

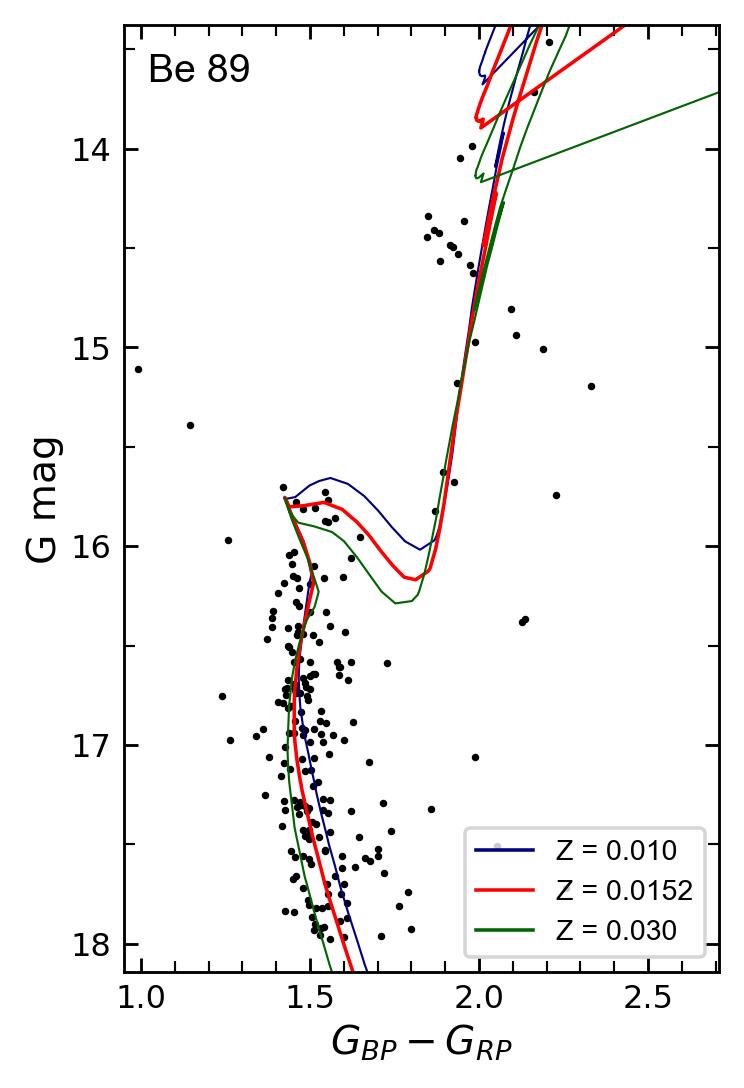
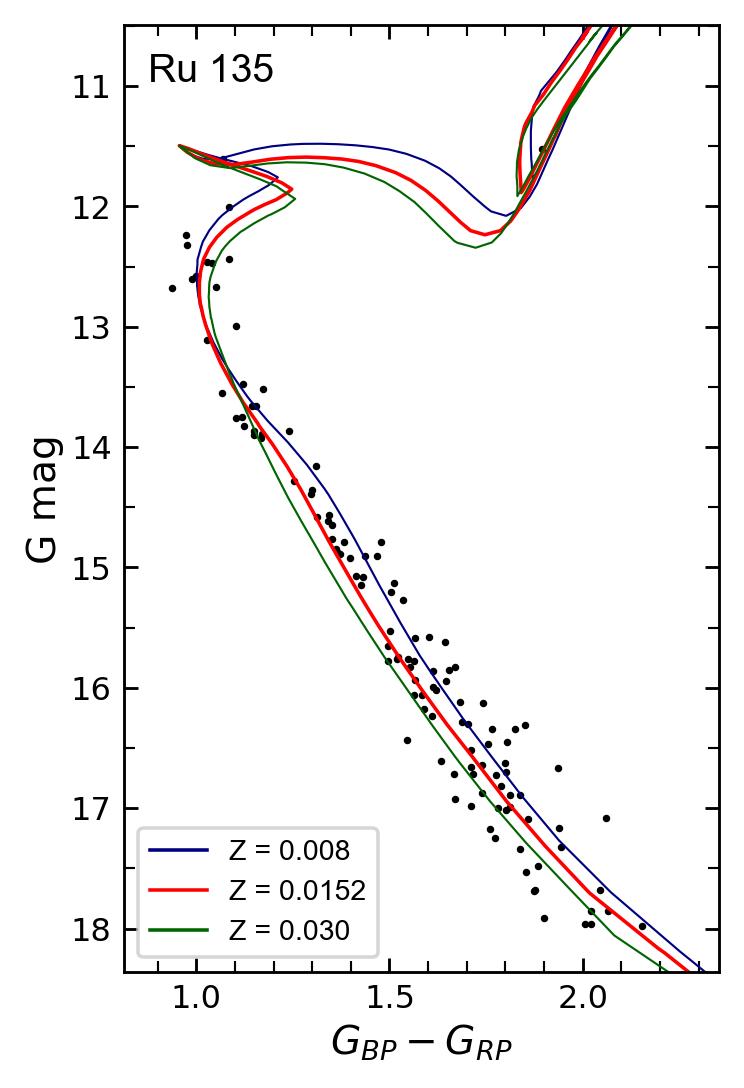
Cluster Z d(pc) Age (Myr) Phot. Isochrone Reference Be 10 1.030.03 0.750.02 0.008 11.400.12 190996 1350100 Gaia EDR3 Bressan et al.(2012) This work solar 11.87 2365 1202 Gaia DR2 Bressan et al.(2012) (1) 0.80 solar 11.97 2201 646 2MASS Marigo et al.(2008) (2) 0.52 solar 11.92 1970 1000 2MASS Girardi et al.(2002) (3) 0.75 0.006 11.20 1700 1100 UBVRI Marigo et al.(2008) (4) 0.87 0.008 11.80 2290 631 UBVRI Girardi et al.(2002) (5) 0.71 solar 11.26 1790 1000 BV Bertelli et al. (1994) (6) Be 81 1.160.03 0.850.02 0.025 12.120.10 2648119 1600100 Gaia EDR3 Bressan et al.(2012) This work solar 12.60 3313 1148 Gaia DR2 Bressan et al.(2012) (1) 1.06 solar 13.00 3401 1000 2MASS Marigo et al.(2008) (2) 0.90 solar 13.55 3601 891 2MASS Girardi et al.(2002) (3) 1.00 solar 15.60 3000 1000 BVI Bertelli et al.(1994) (7) 0.91 solar 12.40 3020 900 BVI Bressan et al. (1993) (8) Be 89 0.790.001 0.580.001 0.0152 11.930.11 2433118 3200100 Gaia DR2 Bressan et al.(2012) (1) 0.73 solar 12.50 2839 1585 2MASS Marigo et al.(2008) (2) 0.49 solar 12.99 3272 1585 2MASS Girardi et al.(2002) (3) 0.60 0.008 11.90 2400 3600 UBVRI Marigo et al.(2008) (4) 1.03 solar 13.30 3005 850 2MASS Bonatto et al.(2004) (9) 1.05 solar 14.80 2040 1122 BVI Girardi et al.(2000) (10) Ru 135 0.740.05 0.540.04 0.0152 9.760.06 89760 1000100 Gaia EDR3 Bressan et al.(2012) This work solar 10.12 1054 646 Gaia DR2 Bressan et al.(2012) (1) 0.87 solar 13.00 3497 3162 2MASS Marigo et al.(2008) (2) 1.14 solar 12.66 2172 562 2MASS Girardi et al.(2002) (3) 0.63 0.004 9.50 750 4000 UBVRI Marigo et al.(2008) (4) 1.10 solar 11.33 1850 501 2MASS Bonatto et al.(2004) (11)
References of the last column
| 1 | Cantat-Gaudin et al. (2018, 2020) | 7 | Sagar & Griffiths (1998) |
| 2 | Kharchenko et al. (2013) | 8 | Donati et al. (2014) |
| 3 | Bukowiecki et al. (2011) | 9 | Tadross (2008a) |
| 4 | Akkaya et al. (2010) | 10 | Subramaniam et al. (2010) |
| 5 | Lata et al. (2004) | 11 | Tadross (2008b) |
| 6 | Maciejewski & Niedzielski (2007) |
The stellar radial density profiles (RDPs) of four OCs are constructed from the Gaia EDR3 photometric/astrometric data for cluster members and the field within down to mag. From the RDPs, their structural parameters are derived. The fitted RDPs of four OCs to the relation of King (1966) are given in Fig. 6. For this, the three-parameter function (King, 1966),
is considered. For this equation, is the residual background density. and are the central
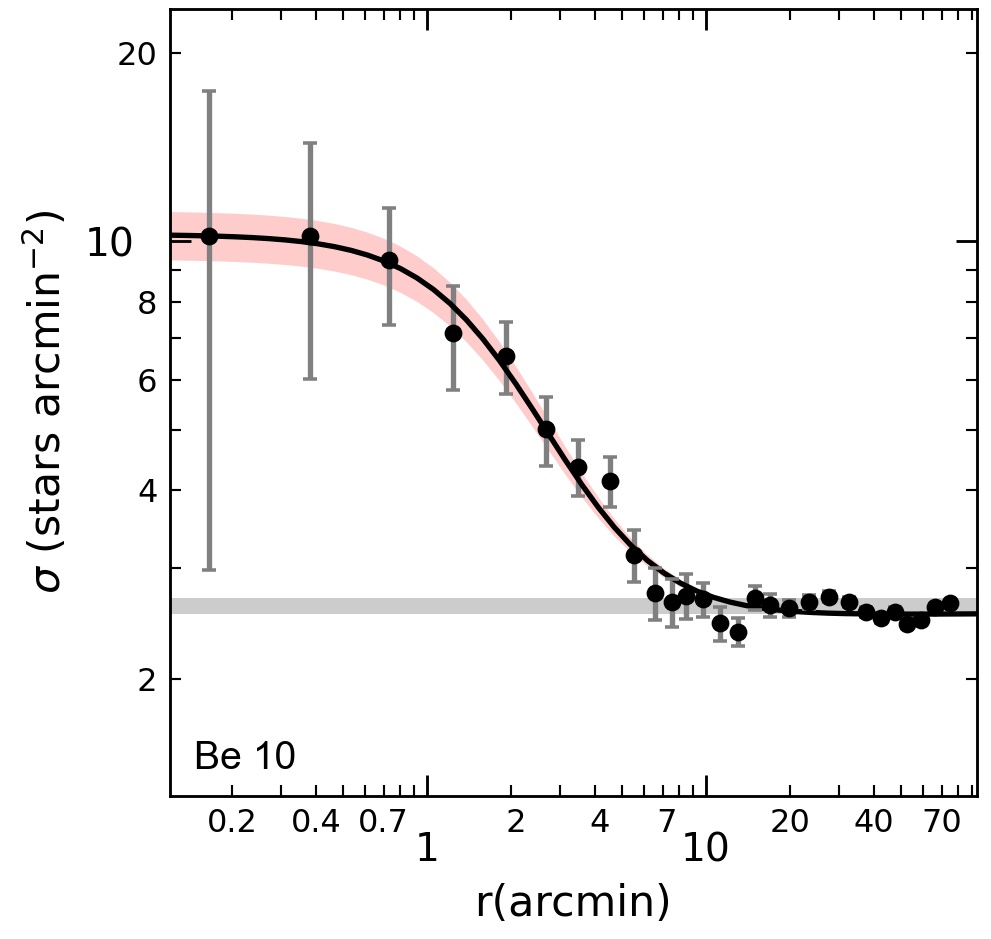
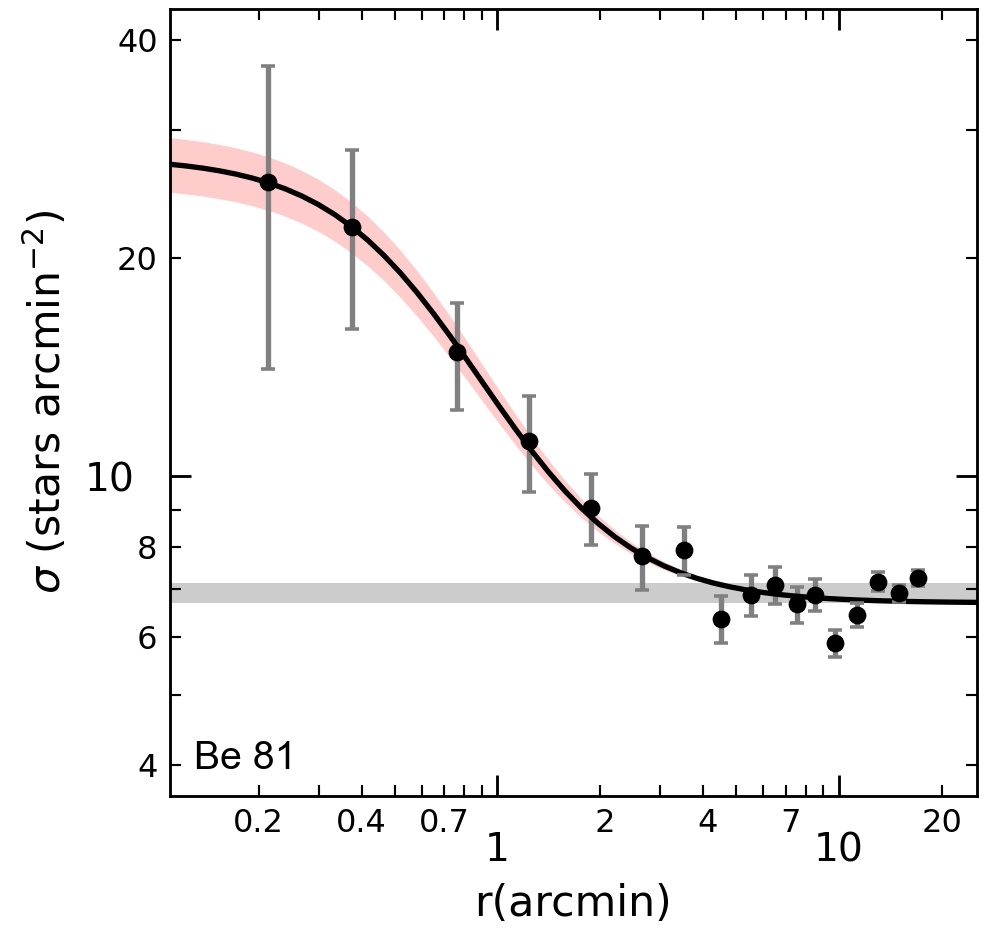
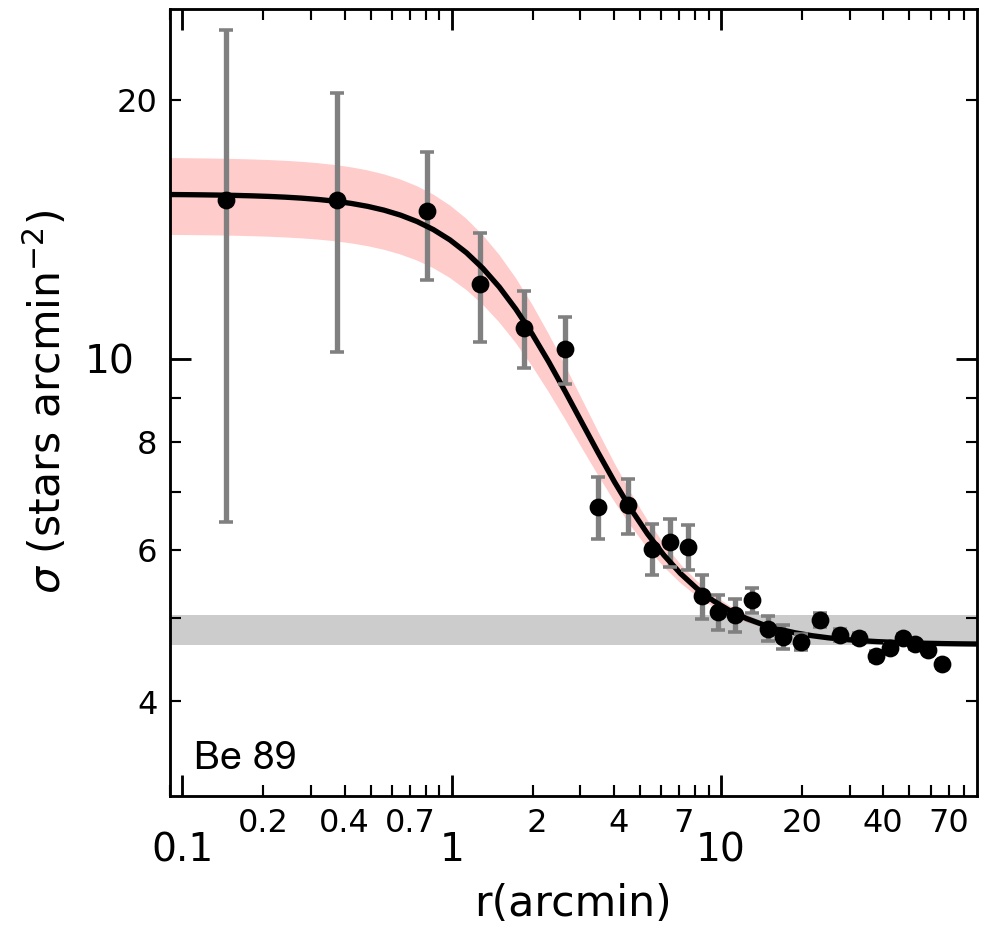
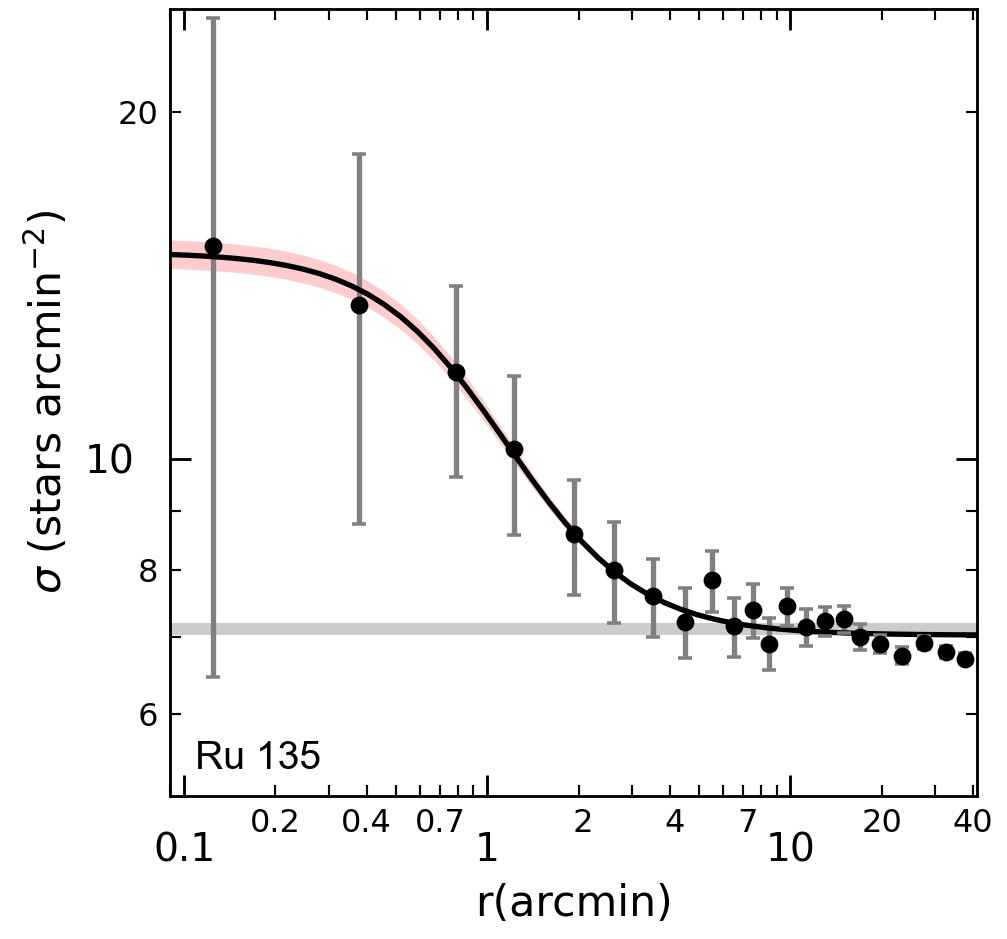
density of stars and the core radius, respectively. Thus, the , , and of four OCs have been derived by fitting King profile to the observational RDPs (Fig. 6). The meanings of solid line, horizontal bar and the shaded area are mentioned in caption of Fig. 6.
Their cluster radii by comparing the RDP level with background and by measuring the distance from the centre (Bonatto & Bica, 2007a) are determined. The is taken as an observational truncation radius, whose value depends both on the radial distribution of member stars and the field density. The large uncertainties within in the RDPs are due to their low star contents in their central parts. The density contrast parameter () to estimate the compactness of the clusters is obtained from the relation,
As emphasized by Bica & Bonatto (2005), the values of the OCs depend on the Galactic latitude than the cluster mass, accordingly, the populous and high Galactic latitude OCs have large density contrast parameters, i.e.: NGC 188 and M 67 . Different Galactic latitudes have different properties and also suffer from differences in density contrast, since low-Galactic latitude OCs tend to be projected against denser fore/backgrounds. As compared to the range , which is found from compact star clusters by Bonatto (2009), our values are lower. This indicates that our OCs with low-latitude are sparse. These structural parameters and their meanings together with the literature values are listed in rows 1-9 of Table 3.
As compared to literature values (bottom rows of Table 3), for the (pc)’s of Be 10, Be 81 and Ru 135, there is in a reasonable agreement with the ones of Bukowiecki et al. (2011) within the uncertainties. Be 89’s value is somewhat larger than Bukowiecki et al. (2011). Kharchenko et al. (2013) give a large (pc) value for Be 81 and Ru 135. For Be 10 and Be 89, their (pc) values are in good agreement with our findings within the error bars. Our values for Be 89 and Ru 135 are quite larger than the 8.23 pc value of Bukowiecki et al. (2011). Within the error limits, our values for Be 10 are in consistent with the ones of Maciejewski & Niedzielski (2007). For Be 81, Sagar & Griffiths (1998) give a slightly small (pc) value.
4 Mass and Mass Function Slope
The masses of the main sequence members of four OCs are determined from the B12-isochrones. magnitudes of main sequence members have been converted into the absolute magnitudes from their reddenings and distance moduli (Cols. 2 and 5 of Table 2). Mass function (MF) is defined as the distribution of masses of cluster stars per unit volume. The mass functions in terms of 0.05 bin sizes are shown in Fig. 7. The MF slope is fitted to a power-law given by,
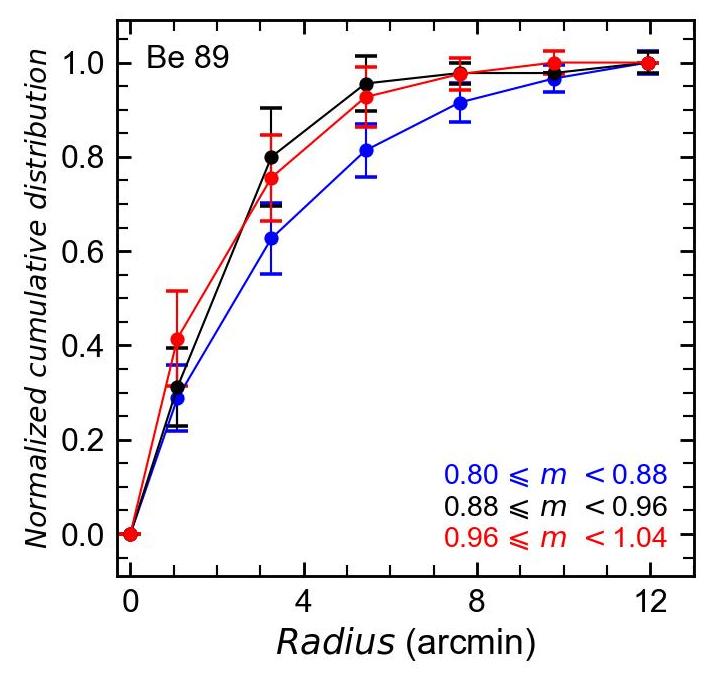
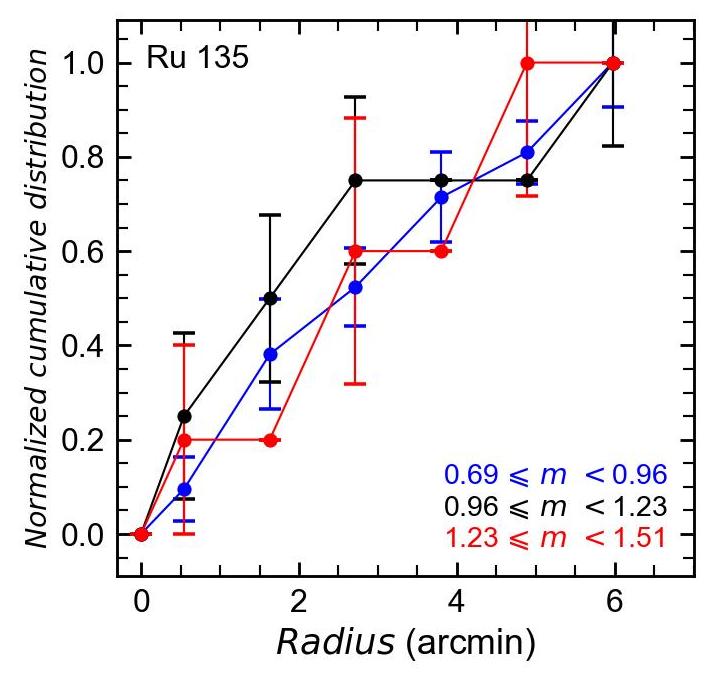
Where is the probable cluster members in a mass bin with central mass and is mass function slope. Since Gaia data ( mag) is not complete below mag (Arenou et al., 2018), stars brighter than this limit are taken, which correspond to stars more massive than 1 . The obtained MF slopes are , , and for Be 10, Be 81, Be 89, and Ru 135, respectively. The MFs of Be 10 and Be 89 are consistent with of Kroupa (2001) with the uncertainties. Total masses are obtained from the MF slopes of four OCs. The mass range, MF slope, total mass, mean mass, and member number are listed in Cols. 2-6 of Table 4. In order to see the mass-segregation effects of four OCs, the normalized cumulative radial stellar distributions of member stars for three mass ranges against cluster radius (arcmin) have been displayed in Fig. 8. For Be 10, bright stars (high mass ones) slightly outnumber low mass/fainter counterparts throughout the inner parts. Towards its outer parts, low-mass
| Cluster | Mass range | MF slope | Total mass | Mean Mass | Members | ||||
|---|---|---|---|---|---|---|---|---|---|
| N | |||||||||
| Be 10 | 0.75 1.13 | ||||||||
| Be 81 | 0.91 1.21 | ||||||||
| Be 89 | 0.80 1.04 | ||||||||
| Ru 135 | 0.69 1.51 | ||||||||
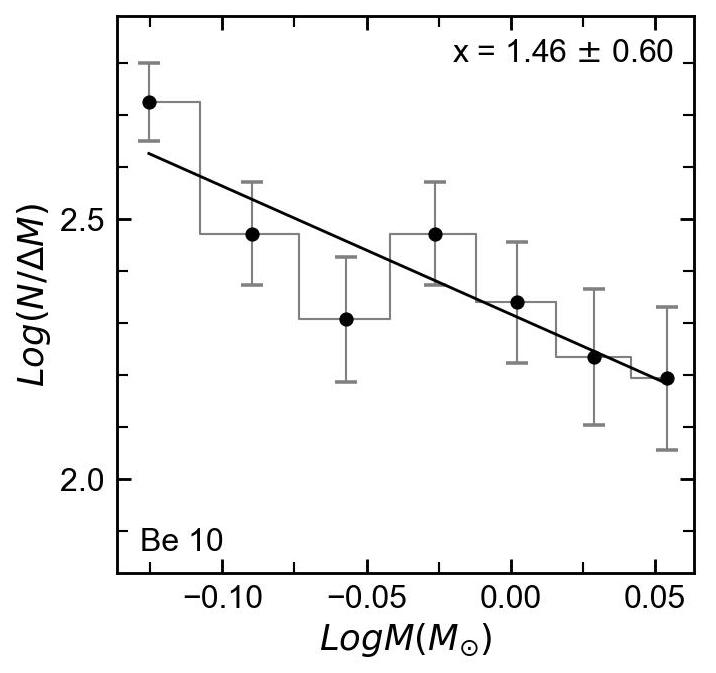
stars dominate. For Be 81 and Be 89, high mass stars outnumber low mass counterparts throughout the entire cluster radius. For Ru 135’core region, high mass stars slightly outnumber low-mass stars. For , intermediate mass stars seem to be dominant over low mass ones. Towards its skirts, high mass stars slightly outnumber the low mass ones. During the lifetime of the OCs, encounters between its member stars lead to an increased degree of energy equipartition. Thus, the high mass stars sink towards the cluster center and transfer their kinetic energy to the low-mass stars, thus leading to mass segregation.

Some factors such as age, distance and selection of bright (high mass) stars are effective in these trends. As stated by Tarricq et al. (2021), old OCs are mass segregated than young OCs. Old OCs with a significant number of stars show strong mass segregation ratio. These old OCs are on the average older than the OCs with few stars which show strongly mass segregation. Cluster stars in the outer skirts of old OCs are on average lower than for young ones. In the sense the proportion of stars in the outer parts of the OCs decreases towards old ages. Besides this, bright/high mass stars are more likely to be selected than faint stars when distinguishing cluster members. In accordance with that, especially in the core region, there is a possibility that faint stars will not be selected as cluster members, due to the high density of stars. Therefore, there may be a bias in favor of bright stars. Distance is a problem for observing faint stars, due to dense dust.
5 Time-Scale Parameters and Tidal Radius
The relaxation time, is defined as the time required for the stars in the core/halo of an open cluster to travel from one end of these regions to the other. Encounters between the cluster stars lead to an increased degree of energy equipartition. is obtained from the relation of Spitzer & Hart (1971)
| (1) |
where , , denote the cluster members (Col. 6 of Table 4), the radius containing half the cluster mass, the mean mass of the cluster members (Col. 5 of Table 4), respectively. Here is estimated from the equation of Larsen (2006),
| (2) |
where and are the core and tidal radii, respectively. is from equation (4). The dynamical evolutionary parameters of four OCs are estimated from
The ages are from Col. 7 of Table 2. The dissociation times of four OCs have been determined from the equation of Binney & Tremaine (2008), as given in the paper of Converse & Stahler (2011).
| (3) |
and are the total cluster mass and half mass radius of the clusters, respectively. Here, tidal radius is the distance from the cluster center where gravitational acceleration caused by the cluster becomes equal to the tidal acceleration due to parent Galaxy (von Hoerner, 1957). As the cluster goes near its perigalacticon, a star at a large distance from the cluster center will be detached by galactic tidal forces whereas a star at a small distance will not. In other words, the tidal radius is linked to the stripping of stars from the cluster by the Galactic tidal field. Tidal interactions are essential to interprete the initial structure and dynamical evolution of the OCs (Chumak et al., 2010).
Tidal radius is estimated from the equation of Kim et al. (2000)
| (4) |
Here, is the total mass of the clusters (Col.4 of Table 4). The Galactic mass inside a galactocentric radius (row 12 of Table 5) is obtained from the equation of Genzel & Townes (1987),
| (5) |
The tidal radius of a cluster which is located at 30 pc from the globular cluster is 1 pc (Kim et al., 2000). , , , and time scale parameters are listed in Cols. 2-7 of Table 6.
| Be 10 | Be 81 | Be 89 | Ru 135 | |
| -36.71.2 | 49.10.9 | -44.14.0 | -13.71.4 | |
| 37.90 | 56.59 | 29.66 | -6.62 | |
| -11.61 | 3.74 | -48.17 | -8.98 | |
| -6.62 | 0.23 | 0.15 | -11.76 | |
| -243.83 | -263.72 | -206.08 | -241.84 | |
| ecc | 0.07 | 0.09 | 0.16 | 0.04 |
| Rmin | 9.45 | 6.17 | 6.05 | 7.32 |
| Rmax | 10.96 | 7.33 | 8.39 | 7.91 |
| Rm | 10.31 | 6.81 | 7.36 | 7.62 |
| zmax | 0.35 | 0.13 | 0.25 | 0.30 |
| Rbirth | 10.08 | 6.55 | 6.80 | 7.66 |
| RGC | 9.69 | 6.18 | 8.27 | 7.54 |
| -2365.21 | -1628.94 | -1704.42 | -1824.18 | |
| 260 | 159 | 220 | 194 | |
| 5.2 | 10.1 | 14.6 | 5.2 |
| Cluster | ||||||||||||
|---|---|---|---|---|---|---|---|---|---|---|---|---|
| pc | pc | Myr | Myr | |||||||||
| Be 10 | ||||||||||||
| Be 81 | ||||||||||||
| Be 89 | ||||||||||||
| Ru 135 | ||||||||||||
6 Kinematics and Orbital Parameters
The Gaia radial velocities of the bright giants of Be 10 (), Be 81 (), Be 89 (), and Ru 135 () have been taken from Soubiran et al. (2018, 2019). Their weighted averages are listed in row 1 of Table 5. Their heliocentric velocities (, , ) in the right-hand system have been obtained from the Gaia EDR3 radial velocities, the median proper motion components and the distances of these bright giants by using the algorithm of Johnson & Soderblom (1987). Here the photometric distances (Col. 6 of Table 7 in it) are adopted. These space velocities have been transformed to the components , , by correcting for the Solar motion km s-1 with respect to the local standard of rest (LSR) Schönrich and Binney (2010). Here, kpc (Bland-Hawthorn et al., 2016) and = 239 km s-1 (Brunthaler et al., 2011) are adopted. The heliocentric cartesian distances (, , ) (kpc) and LRS-velocity components (, , ) have been converted to Galactic Rest of Frame (GSR) i.e., (, , ) (kpc) and (, , ) from the equations of Kepley et al. (2007). The galactocentric velocity component () (km s-1) (or azimuthal velocity) in a cylindrical frame is estimated via
Here, means prograde. From the "MWPotential2014" code in the galpy-code library 111http://github.com/jobovy/galpy written by Bovy (2015), peri- and apo-galactic distances (kpc) and the maximum height distance (zmax) (kpc) are obtained. The orbital eccentricity (ecc) is estimated via the relation
Five evolved member’s orbits have been integrated for the ages of four OCs (Col. 7 of Table 2) within the galactic potential. The galactic potential as sum of the galactic components is explained by Bovy (2015). Their orbital angular momentum components (kpc km s-1) are calculated from the equation of Kepley et al. (2007). These all parameters are given in Table 5.
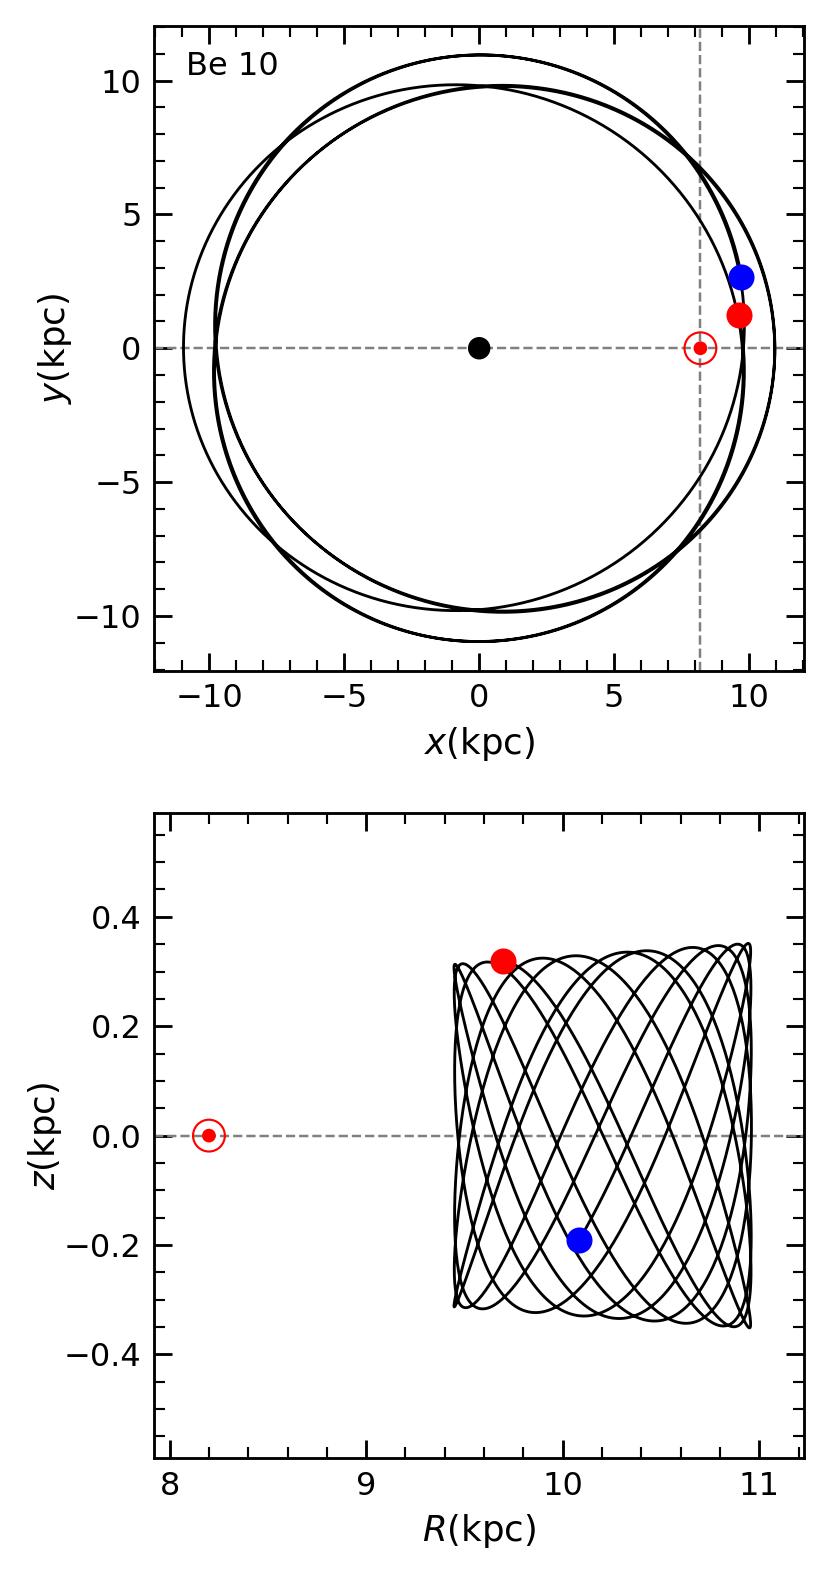
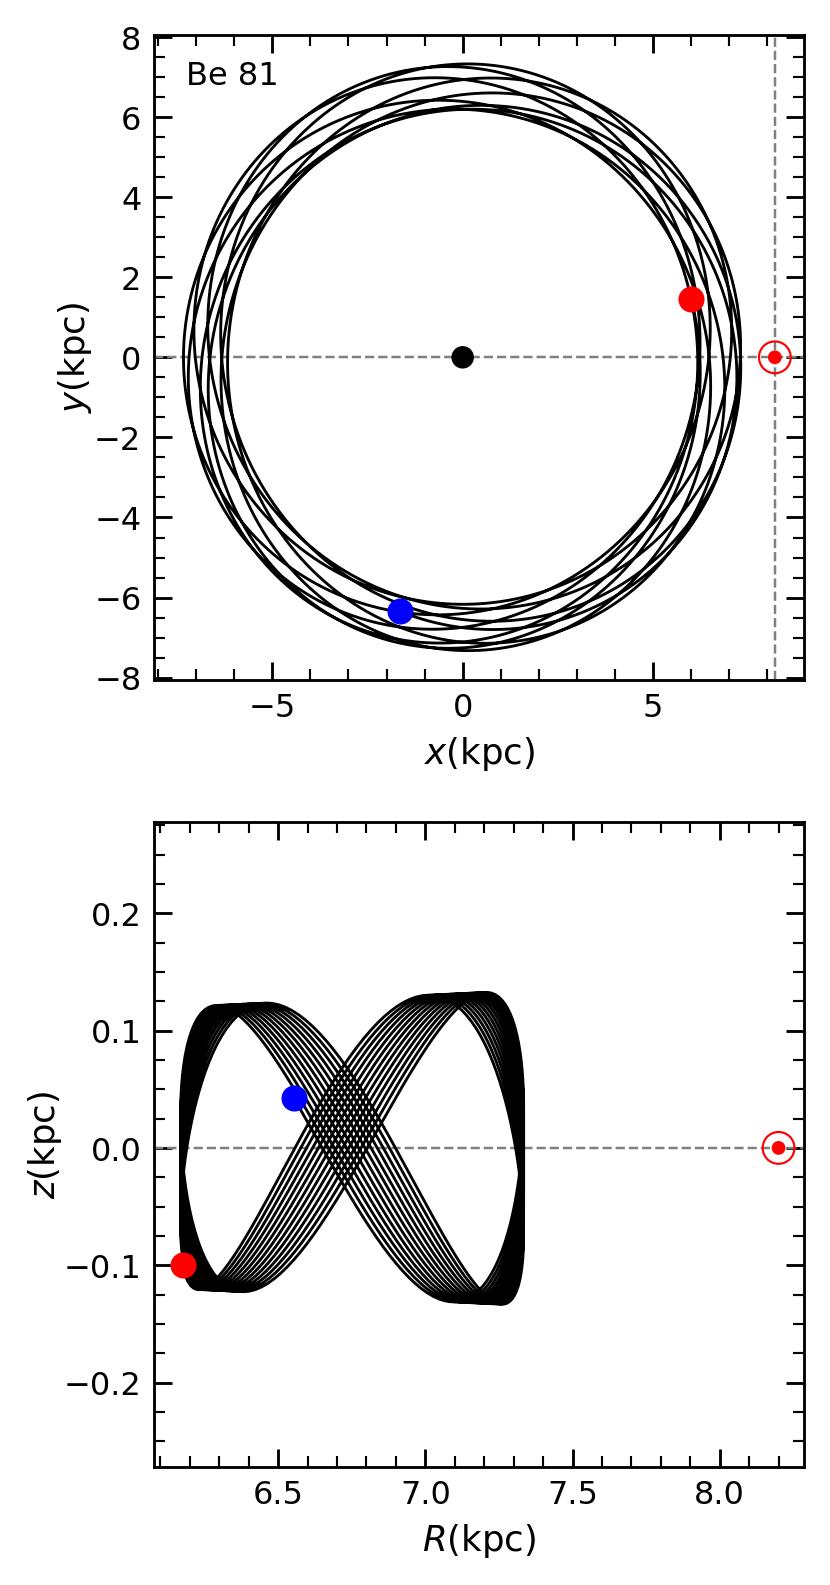
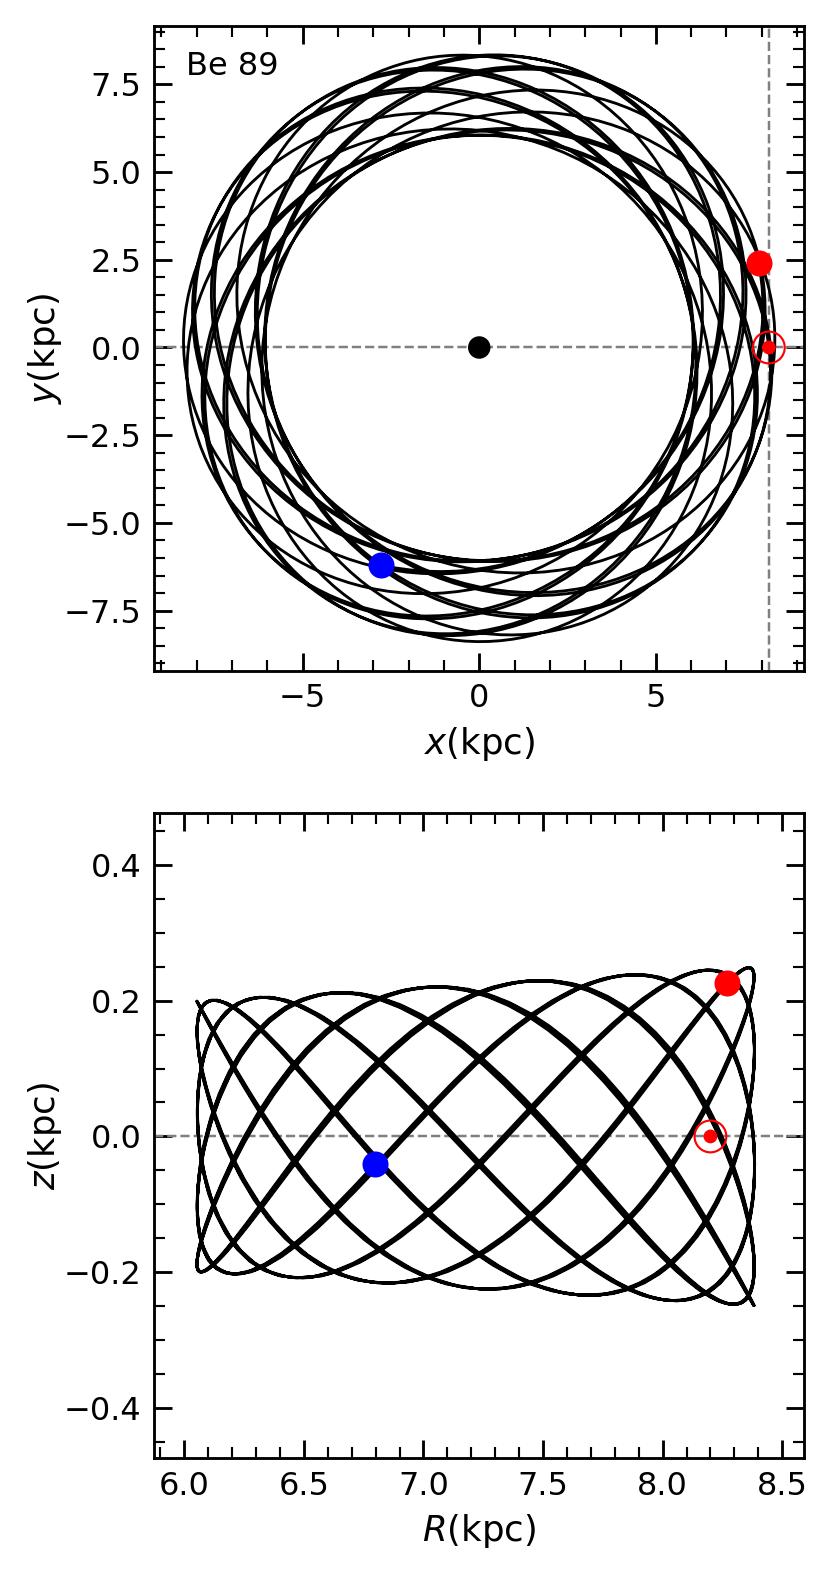
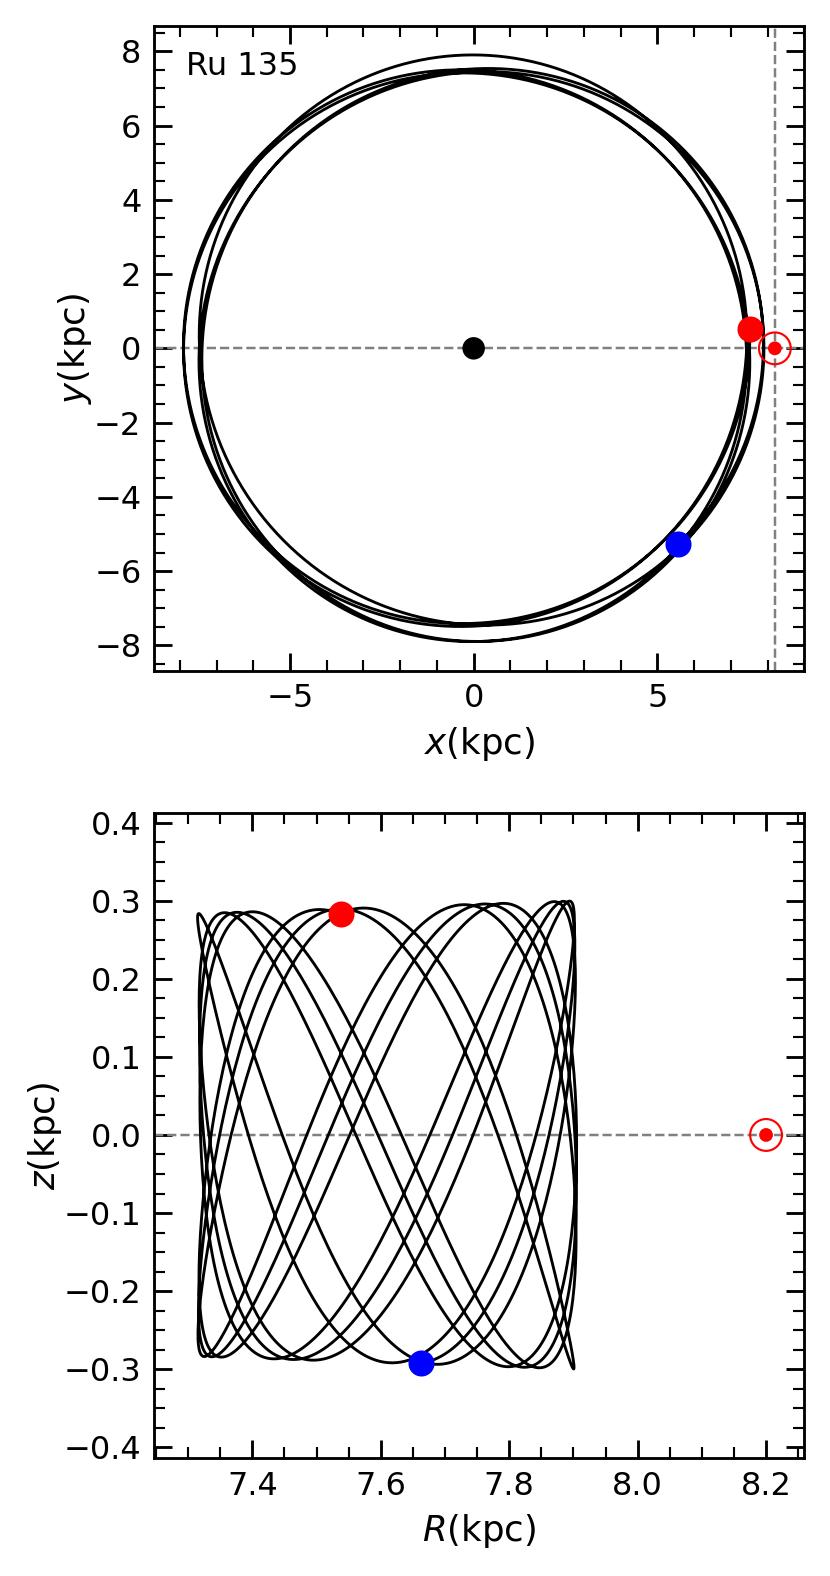
Rotational velocities km s-1, the eccentricities, 0.040.16, and orbital angular momentum values (Table 5) indicate that four OCs have Galactic thin disk properties. x-y (kpc) plane is known as projected on to the Galactic plane, whereas z-R (kpc) is the meridional plane. On x-y (kpc) plane (top panels of Fig. 9), they follow a circular path around the Galactic center with the eccentricities, 0.040.16. From Fig. 9 (top panels), four OCs are orbiting near the Galactic disk, therefore they may be affected by the tidal forces of the disk. According to their revolution periods T (Myr) around the Galactic center (row 14 of Table 5), Be 10 and Ru 135 have made nearly five revolutions around the center of the Galaxy. For Be 81 and Be 89, their tours are nearly 10 to 15 (row 15 of Table 5).
The orbits in z-R (kpc) plane (bottom panels of Fig. 9) have boxy-like type properties. Four OCs move in the meridional planes within the confined spaces. They are oscillating along z-axis. Be 10’s orbit is confined in a box of kpc, therefore it is not interacting with the inner region of the Galaxy. The confined spaces are as the following, kpc for Be 81, kpc for Be 89, kpc for Ru 135.
Their birth and present day positions in our Galaxy are shown with the filled blue and red dots , respectively (Fig. 9). These positions have been calculated by using the "MWPotential2014" in the galpy-code package. For this, time is taken as zero (birth) and cluster age (present day). Their closest approaches to the Sun are determined as = (1.91, 1.35) (Be 10), (1.85, 0.16) (Be 81), (1.09, 0.09) (Be 89), (0.90, 1.00) (Ru 135), respectively.
7 Discussion and Conclusion
7.1 Astrophysical parameters
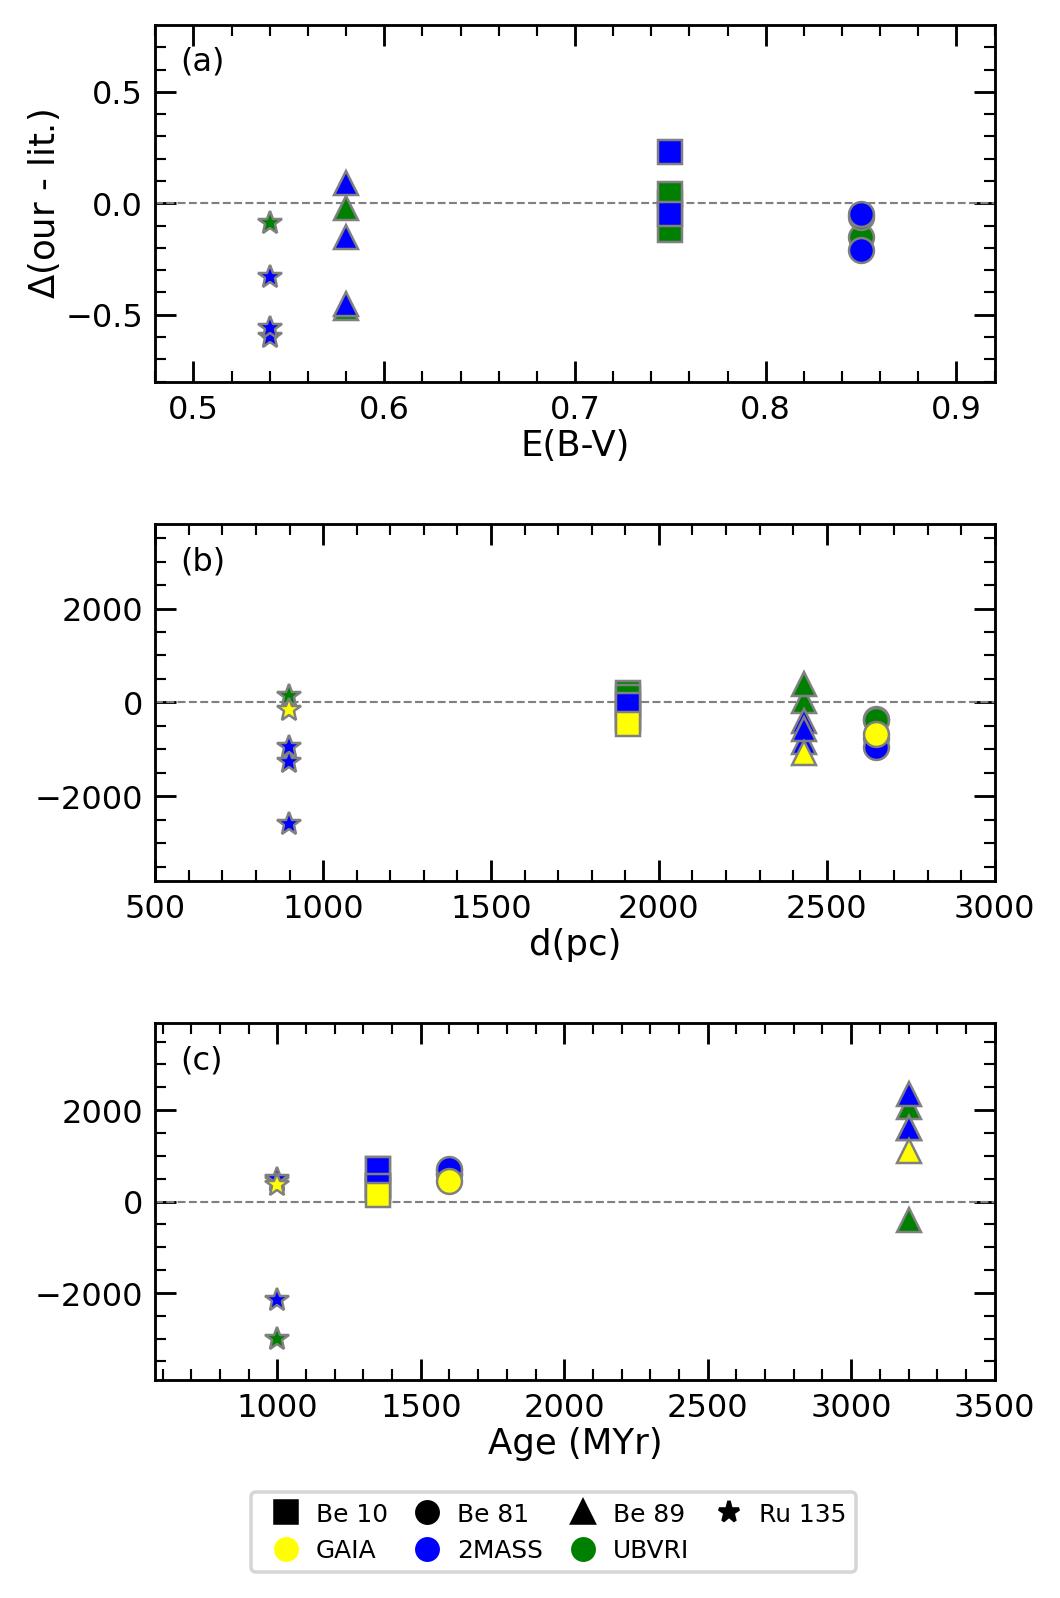
The astrophysical values (, , and (Myr)) together with the literature comparison are listed in Table 2. The comparisons are also displayed in Fig. 10. Reddening differences are larger, up to 0.450.47 (/) for Be 89 and 0.330.60 () for Ru 135, respectively. Except this, our values are in agreement with the literature within the discrepancies, 0.20 mag. The distance discrepancies to the literature are 61456 pc (Be 10), 352953 pc (Be 81), 331075 pc (Be 89), and 1472600 pc (Ru 135), respectively. Our distances are small, as compared to the ones of . There does not seem to be agreement even among the authors for / findings. Our distances for Be 89 and Ru 135 are larger but small for Be 81, as compared to the ones of the CCD-based . For Be 10, the distance of Lata et al. (2004) is larger than our value. The distances from the median parallaxes of four OCs (Table 1) are somewhat larger than the Gaia EDR3-isochrone fitting distances.
Note that the Gaia DR2 photometric distances of Cantat-Gaudin et al. (2020) are larger than our distances. The discrepancy with the literature of the distance and age values of Be 81 is due to the fact that Sagar & Griffiths (1998) and Donati et al. (2014) fit the isochrones at turn-off value, . Cantat-Gaudin et al. (2020) give a weight at turn-off point, (dashed isochrone of right panel of Fig. 4), which is slightly fainter than our .
From Table 2/Fig. 10(c), the ages of CCD-based UBVRI for four OCs are older than our ages. However, for Be 89, our age is older than the one of Subramaniam et al. (2010). The old ages of Ru 135 and Be 89 given by Akkaya Oralhan et al. (2010) are due to usage of the metal poor isochrones while fitting in their CMDs. Our ages of four OCs are older than the ones of , except for the old age value for Ru 135 of Kharchenko et al. (2013). From Fig. 10(c), the age differences (yellow symbols) between this paper and the ones of Cantat-Gaudin et al. (2020) are small at a level of 148452 Myr for Be 10, Be 81 and Be 89. For Ru 135, the discrepancy is somewhat larger, up to Myr. The potential sources of discrepancies between our findings and the literature are of the adopted isochrones and the reddening values, the ground-based astrometric data, and different procedures for the selection of member stars, respectively, as stated by Paunzen & Netopil (2006) and Moitinho (2010).
7.2 Dynamical Evolution
Four OCs are in harmony with the increasing trend between and (Fig. 11a) (Güneş et al., 2017; Camargo et al., 2009). On average, larger cluster radii have larger core radii. Note that our OCs with old ages are prone to have small core radii, as shown by Tarricq et al. (2021). Here as an approximation, a value of pc of Güneş et al. (2017) is taken into account in classifying the cluster dimensions as small and large.
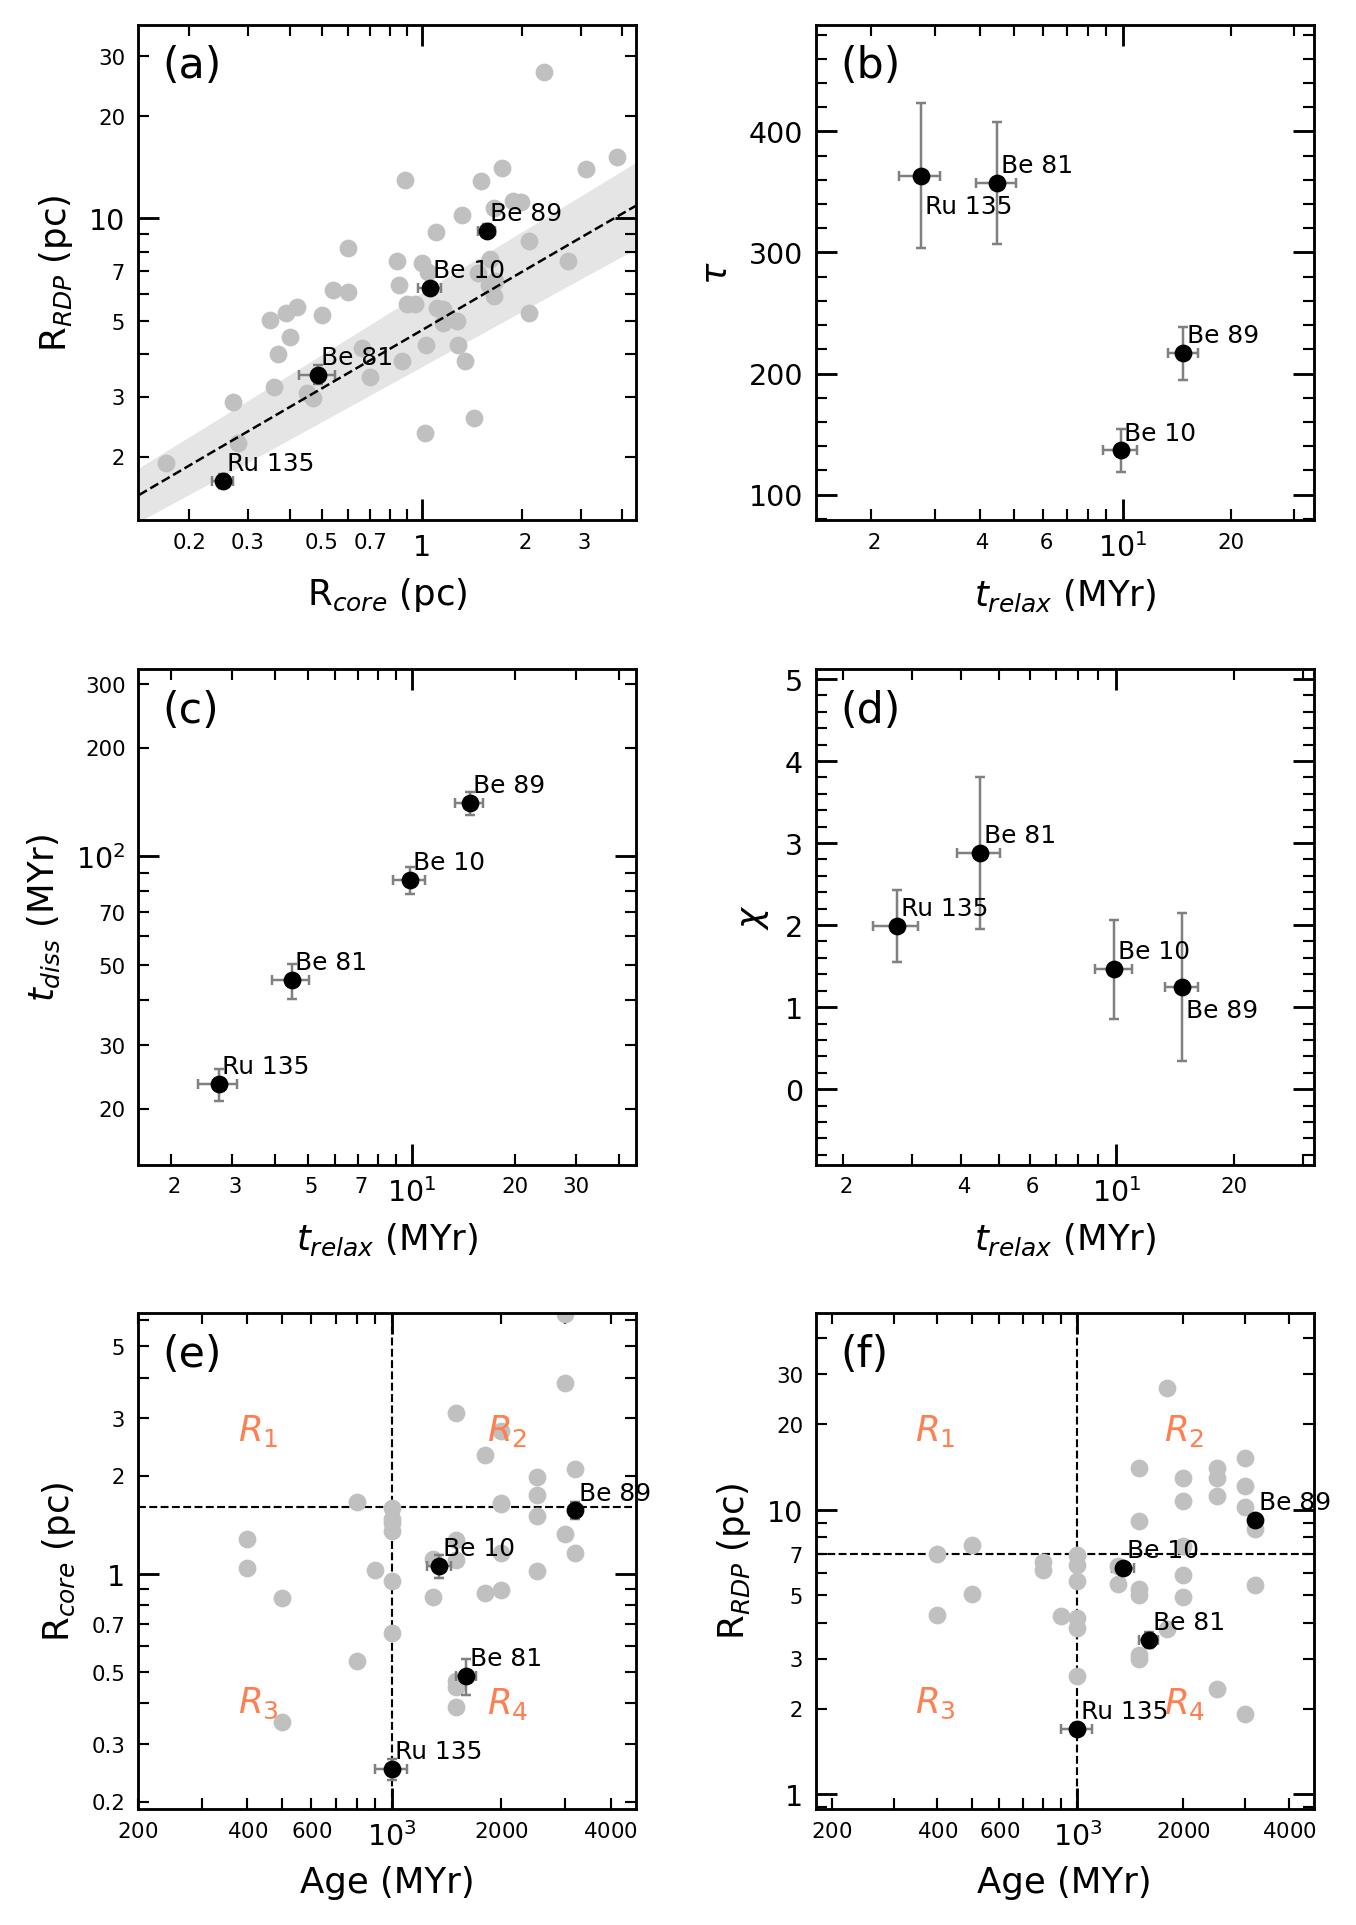
The dissociation times of four OCs are higher than their relaxation times (Fig. 11c/Col. 6 of Table 6). This necessarily mean that four OCs disintegrate very early in the initial phase of quick expansion that accompanies the death of their most massive (bright) stars, as stated by Converse & Stahler (2011). The relaxation times of four OCs are smaller than their ages (Col. 5 of Table 4 and Col. 7 of Table 2), from this respective, they are dynamically relaxed. The steep overall MF slopes of four OCs (Fig. 11d) mean that their low mass stars outnumber their massive ones (Fig. 7 and Fig. 11d). Their large and relatively small values imply an advanced mass segregation. On account of this, their low mass stars are being lost to the field.
Following the works of Camargo et al. (2009); Güneş et al. (2017); Cakmak et al. (2021), four OCs are plotted on versus Age (Myr) (panels (e-f) of Fig. 11). This relationship is related to survival and dissociation rates of clusters (Camargo et al., 2009). The meanings of the symbols are explained in caption of Fig. 11. Because Be 89 locates in region (panels ef), its core/outer parts show an expansion with time. However, Be 10 and Be 81 indicate the relatively shrinkage core/cluster radii (). Be 81 and Ru 135 locate in solar circle, and they are survived although they expose much to the external dynamical effects. Ru 135 (1.0 Gyr) with the small dimensions shrunk in size and mass with time, as it lost its star content because of the presence of massive GMCs, and tidal effects from disk and Bulge crossings as external perturbations, taking care its direction . Instead of shrinking in size and mass with time, Ru 135 may have a primordial origin which may be related to high molecular gas density in Galactic directions (Camargo et al., 2009; van den Berg et al., 1991).
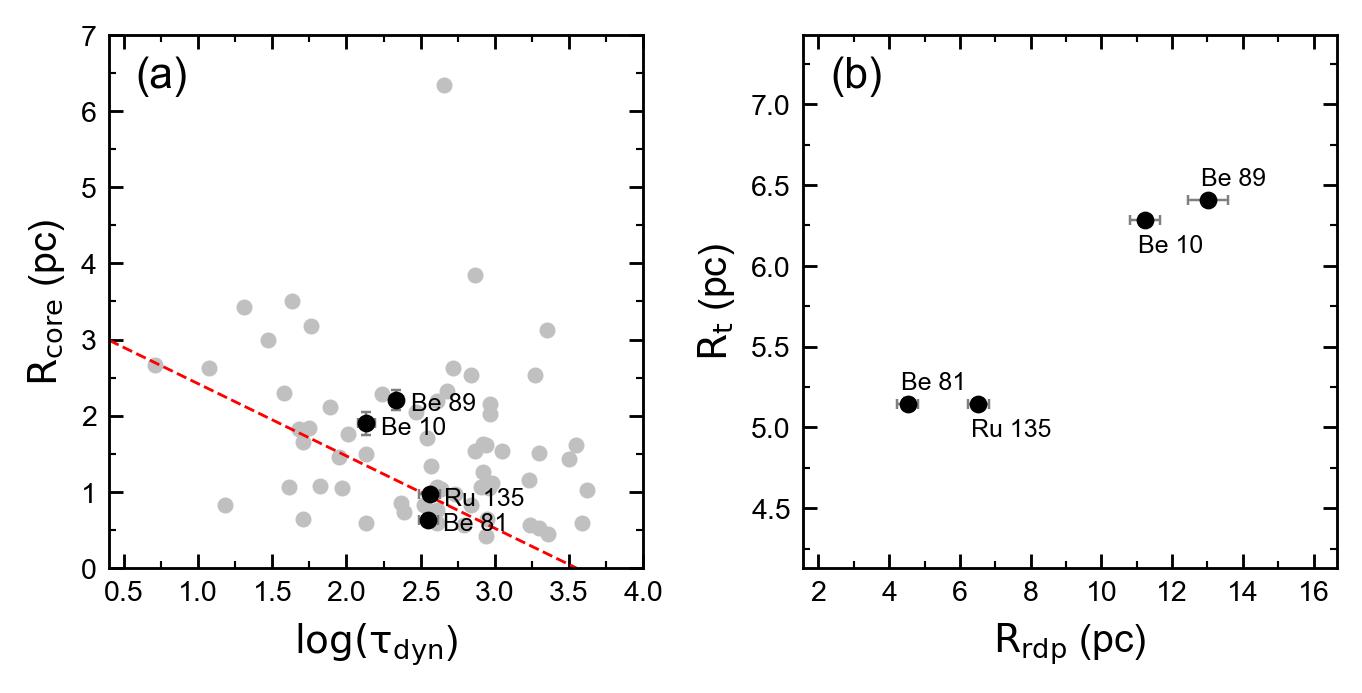
For our sample OCs, the relations, versus and versus (pc), respectively are presented in Fig. 12(a)(b). Four OCs are in concordance with the decreasing trend between and (panel a). As stated by Angelo et al. (2020, 2021), this trend points out that our OCs with old ages are dynamically evolved, and they are losing their star contents to the field, due to internal/external dynamical processes. Be 89’s tidal radius is less than its cluster radius (Fig. 12b/Tables 3 and 5). This means that its member stars lie within its tidal radius, in the sense it is gravitationally bound to the cluster. For Be 10, Be 81 and Ru 135, their tidal radii are larger than their cluster radii. Thus, the cluster members beyond their tidal radii are gravitationally unbound to the cluster. The cluster members outside their tidal radii are more influenced by external potential of the Galaxy.
The expected masses of four OCs based on its peri-galacticon distance/its tidal radius are obtained from the relation (King, 1962),
where and is the peri-galacticon distance and the Galaxy mass. , , and , respectively, are taken from Tables 45. With these values, their expected masses have been calculated as 214 (Be 10), 248 (Be 81), 716 (Be 89), and 181 (Ru 135), respectively. For instance, the expected mass 214 in Be 10 decreases to (observed stellar total mass), because mass-loss processes such as evaporation and the external dynamical effects which have been acting on Be 10 for about 1.3 Gyr.
The orbits of Be 10 (Fig. 8) indicate that it passed a part of its time at galactosentric radius, kpc, and then it was born at kpc, which would explain its solar abundance. According to the () versus R (kpc) of Lepine et al. (2011), Be 10 occupies a region of kpc (co-rotation gap at 9 kpc). In the sense its origin may be attributed to different galactic radius or different star formation region (Lepine et al., 2011).
8 Acknowledgments
We thank the anonymous referee for the comments and suggestions. We sepically thank to Charles Bonatto and Orhan Güneş for the valuable comments. This paper has made use of results from the European Space Agency (ESA) space mission Gaia, the data from which were processed by the Gaia Data Processing and Analysis Consortium (DPAC). Funding for the DPAC has been provided by national institutions, in particular the institutions participating in the Gaia Multilateral Agreement. The Gaia mission website is http: //www.cosmos.esa.int/gaia. This paper has also made use of the WEBDA database, operated at the Institute for Astronomy of the University of Vienna. This publication also makes use of SIMBAD database-VizieR (http://vizier.u-strasbg.fr/viz-bin/VizieR?-source=II/246.).
References
- Akkaya Oralhan et al. (2010) Akkaya Oralhan Í, Schuster WJ, Michel R, Chavarría-K C, Moitinho A, Vázquez R, Karataş Y. CCD UBVRI Photometry of the Galactic Open Clusters: Be 89, Ru 135 and Be 10. Revista Mexicana de Astronomía y Astrofísica (RMxAA) 2010;46:385.
- Angelo et al. (2021) Angelo MS, Corradi WJB, Santos Jr, JFC, Maia FFS, Ferreira FA. Characterizing dynamical states of Galactic open clusters with Gaia DR2. Mon Not Roy Astron Soc 2021;500:4338.
- Angelo et al. (2020) Angelo MS, Santos Jr JFC, Corradi WJB. Characterizing low-contrast Galactic open clusters with Gaia Data Release 2. Mon Not Roy Astron Soc 2020;493:3473.
- Arenou et al. (2018) Arenou F, Luri i X, Babusiaux C, et al. Gaia Data Release 2. Catalogue validation. Astron Astrophys 2018;616:A17.
- Bailer-Jones et al. (2018) Bailer-Jones CAL, Rybizki J, Fouesneau M, Mantelet G, Andrae R. Estimating Distance from Parallaxes. IV. Distances to 1.33 Billion Stars in Gaia Data Release 2. Astron J 2018;156:58.
- Bailer-Jones et al. (2021) Bailer-Jones CAL, Rybizki J, Fouesneau M, Demleitner M, Andrae R. Estimating Distances from Parallaxes. V. Geometric and Photogeometric Distances to 1.47 Billion Stars in Gaia Early Data Release 3. Astron J 2021;161:147.
- Balaguer-Nunez et al. (1998) Balaguer-Nunez L, Tian KP, Zhao JL. Determination of proper motions and membership of the open clusters NGC 1817 and NGC 1807. Astron Astrophys Suppl 1998;133:387.
- Bertelli et al. (1994) Bertelli G, Bressan A, Chiosi C, Fagotto F, Nasi E. Theoretical isochrones from models with new radiative opacities. Astron Astrophys Suppl 1994;106:275.
- Bica & Bonatto (2005) Bica E, Bonatto C. Properties of five low-contrast open clusters in the third quadrant Astron Astrophys Suppl 2005;443:465.
- Binney & Tremaine (2008) Binney J, Tremaine S. Galactic Dynamics Princeton Univ Press Princeton: NJ;2008.
- Bland-Hawthorn et al. (2016) Bland-Hawthorn J, Ortwin Gerhard O. The Galaxy in Context: Structural, Kinematic, and Integrated Properties. Annu Rev Astron Astrophys 2016;54:529.
- Bonatto et al. (2004) Bonatto C, Bica E, Girardi L. Theoretical isochrones compared to 2MASS observations: Open clusters at nearly solar metallicity. Astron Astrophys 2004;415:571.
- Bonatto & Bica (2007a) Bonatto C, Bica E. Open clusters in dense fields: the importance of field-star decontamination for NGC 5715, Lyngå 4, Lyngå 9, Trumpler 23, Trumpler 26 and Czernik 37. Mon Not Roy Astron Soc 2007;377:1301.
- Bonatto & Bica (2007b) Bonatto C, Bica E. Old open clusters in the inner Galaxy: FSR1744, FSR89 and FSR31 Astron Astrophys 2007;473:445.
- Bonatto (2009) Bonatto C, Bica E. The nature of the young and low-mass open clusters Pismis5, vdB80, NGC1931 and BDSB96. Mon Not Roy Astron Soc 2009;397:1915.
- Bonatto (2019) Bonatto C. An efficient approach to extract parameters from star cluster CMDs: fitCMD. Mon Not Roy Astron Soc 2019;483:2758.
- Bovy (2015) Bovy J. galpy: A python Library for Galactic Dynamics. Astrophys J, Suppl Ser 2015;216:29.
- Bressan et al. (1993) Bressan A, Fagotto F, Bertelli G, Chiosi C. Evolutionary Sequences of Stellar Models with New Radiative Opacities. II. Z = 0.02. Astron Astrophys 1993;100:647.
- Bressan et al. (2012) Bressan A, Marigo P, Girardi L, Salasnich B, Dal Cero C, Rubele S, Nanni A. PARSEC: stellar tracks and isochrones with the PAdova and TRieste Stellar Evolution Code. Mon Not Roy Astron Soc 2012;427:127.
- Brown et al. (2018) Brown AGA, Vallenari A, Prusti T et al., Gaia Data Release 2. Summary of the contents and survey properties. Astron Astrophys 2018;616:1G.
- Brunthaler et al. (2011) Brunthaler A, Reid MJ, Menten KM, et al. The Bar and Spiral Structure Legacy (BeSSeL) survey: Mapping the Milky Way with VLBI astrometry. Astron Nachr 2011;332:461-5.
- Bukowiecki et al. (2011) Bukowiecki L, Maciejewski G, Konorski P, Strobel A. Open Clusters in 2MASS Photometry. I. Structural and Basic Astrophysical Parameters. Acta Astronomica 2011;61:231.
- Cakmak et al. (2021) Cakmak H, Gunes O, Karatas Y, Bonatto C. Astrophysical Parameters and Dynamical Evolution of Open Clusters: NGC 2587, Col 268, Mel 72, Pismis 7. Astron Nachr 2021; DOI.
- Camargo et al. (2009) Camargo D, Bonatto C, Bica E. Astrophysical parameters of 14 open clusters projected close to the Galactic plane. å2009;508:211.
- Cantat-Gaudin et al. (2018) Cantat-Gaudin T, Jordi C, Vallenari A, et al. A Gaia DR2 view of the open cluster population in the Milky Way. Astron Astrophys 2018;618:93.
- Cantat-Gaudin et al. (2020) Cantat-Gaudin T, Anders F, Castro-Ginard A, Jordi C, et al. Painting a portrait of the Galactic disc with its stellar clusters. Astron Astrophys 2020;640:1.
- Carney & Harris (2001) Carney BW and Harris WE. 2001, Star Clusters, Saas-Fee Advanced Course 28, Springer-Verlag (New York).
- Chumak et al. (2010) Chumak YO, Platais I, McLaughlin DE, Rastorguev AS, Chumak OV. Numerical simulations of tidal tails for the open cluster NGC 188. Mon Not Roy Astron Soc 2010;402:1841.
- Converse & Stahler (2011) Converse JM, Stahler SW. Star clusters under stress: why small systems cannot dynamically relax. Mon Not Roy Astron Soc 2011;410:2787.
- Dias et al. (2014) Dias WS, Alessi BS, Moitinho A, Lepine JRD, et al. VizieR Online Data Catalog: Optically visible open clusters and Candidates 2014; (Dias+ 2002-2015).
- Dias et al. (2018) Dias WS, Monteiro H, Lepine JRD, Prates R, Gneiding CD, Sacchi M. Astrometric and photometric study of Dias 4, Dias 6, and other five open clusters using ground-based and Gaia DR2 data. Mon Not Roy Astron Soc 2018;481:3887.
- Donati et al. (2014) Donati P, Beccari G, Bragaglia A, Cignoni M, Tosi M. NGC 1817, NGC 2141 and Berkeley 81: three BOCCE clusters of intermediate age. Mon Not Roy Astron Soc 2014;437:1241.
- Friel (1995) Friel ED. The Old Open Clusters Of The Milky Way. Annu Rev Astron Astrophys 1995;33:381.
- Genzel & Townes (1987) Genzel R, Townes CH. Physical conditions, dynamics, and mass distribution in the center of the galaxy. Annu Rev Astron Astrophys 1987;25:377.
- Gieles et al. (2007) Gieles M, Athanassoula E, Portegies-Zwart S. The effect of spiral arm passages on the evolution of stellar clusters. Mon Not Roy Astron Soc 2007;376:809.
- Girardi et al. (2000) Girardi L, Bressan A, Bertelli G, Chiosi C. Evolutionary tracks and isochrones for low- and intermediate-mass stars: From 0.15 to 7 Msun, and from Z=0.0004 to 0.03. Astron Astrophys Suppl 2000;141:371. CMD36
- Girardi et al. (2002) Girardi L, Bertelli G, Bressan A, Chiosi C, Groenewegen MAT, Marigo P, Salasnich B, Weiss A. Theoretical isochrones in several photometric systems. I. Johnson-Cousins-Glass, HST/WFPC2, HST/NICMOS, Washington, and ESO Imaging Survey filter sets. Astron Astrophys 2002;391:195.
- Güneş et al. (2017) Güneş O, Karataş Y, Bonatto C. A Dynamical Evolution Study of 40 2MASS Open Clusters. Astron Nachr 2017;338:464.
- Johnson & Soderblom (1987) Johnson DRH, Soderblom DR. Calculating Galactic Space Velocities and Their Uncertainties, with an Application to the Ursa Major Group. Astron J 1987;93:864.
- Kharchenko et al. (2013) Kharchenko NV, Piskunov E A, Schilbach E, Roeser S, Scholz RD. Global survey of star clusters in the Milky Way. II. The catalogue of basic parameters. Astron Astrophys 2013;558A:53.
- Kepley et al. (2007) Kepley A, Morrison HL, Helmi A, Kinman TD, et al. Halo Star Streams in the Solar Neighborhood. Astron J 2007;134:1579.
- Kim et al. (2000) Kim SS, Figger DF, Lee HM, Morris M. N-Body Simulations of Compact Young Clusters near the Galactic Center. Astrophys J 2000;545:301.
- King (1962) King I. The structure of star clusters. I. an empirical density law. Astron J 1962;67:471.
- King (1966) King I. The structure of star clusters. III. Some simple dynamical models. Astrophys J 1966;71:64.
- Kroupa (2001) Kroupa P. On the variation of the initial mass function. Mon Not Roy Astron Soc 2001;322:231.
- Lamers & Gieles (2006) Lamers HJGLM, Gieles M. Clusters in the solar neighbourhood: how are they destroyed? Astron Astrophys 2006;455:17.
- Larsen (2006) Larsen SS. An ISHAPE Users Guide p 14;2006.
- Lata et al. (2004) Lata S, Mohan V, Pandey AK, & Sagar R. Bull. Astron. Soc. India, 2004;32:59
- Lepine et al. (2011) Lepine JRD, Cruz P, Scarano S, Barros DA, Dias WS, Pompeia L, Andrievsky SM, Garraro G, Famaey B. Overlapping abundance gradients and azimuthal gradients related to the spiral structure of the Galaxy. Mon Not Roy Astron Soc 2011;417:698.
- Lindegren et al. (2021) Lindegren L, Klioner SA, Hernandez J, et al. Gaia Early Data Release 3. The astrometric solution. Astron Astrophys 2021;649:A2.
- Maciejewski & Niedzielski (2007) Maciejewski, G. and Niedzielski, A. 2007, Astron Astrophys , 467, 1065
- Magrini et al. (2015) Magrini L, Randich S, Donati P, et al. The Gaia-ESO Survey: Insights into the inner-disc evolution from open clusters. Astron Astrophys 2015;580:85.
- Marigo et al. (2008) Marigo P, Girardi L, Bressan A, Groenewegen MAT, Silva L, Granato GL. Evolution of asymptotic giant branch stars. II. Optical to far-infrared isochrones with improved TP-AGB models. Astron Astrophys 2008;482:883.
- Marigo et al. (2017) Marigo P, Girardi L, Bressan A, et al. A New Generation of PARSEC-COLIBRI Stellar Isochrones Including the TP-AGB Phase. Astrophys J 2017;835:77.
- Mermilliod (1992) Mermilliod JC. The database for stars in open clusters. II. A progress report on the introduction of new data. Bull Inform 1992;40:115.
- Moffat & Vogt (1975) Moffat AFJ, Vogt N. Southern open star clusters VI. UBV-Hbeta photometry of 18 clusters from Centaurus to Sagittarius. Astron Astrophys Suppl 1975;20:155.
- Moitinho (2010) Moitinho A. Star Clusters: Basic Galactic Building Blocks, Proceedings IAU Symposium No266, Cambridge University Press:London;2010.
- Paunzen & Netopil (2006) Paunzen E, Netopil M. On the current status of open-cluster parameters. Mon Not Roy Astron Soc 2006;371:1641.
- Pedregosa et al. (2011) Pedregosa et al. Scikit-learn: Machine Learning in Python, JMLR 12 2011, p. 2825-2830.
- Sagar & Griffiths (1998) Sagar R, Griffiths WK. BVI CCD photometry of the distant open star clusters Berkeley 81, Berkeley 99, NGC 6603 and NGC 7044. Mon Not Roy Astron Soc 1998;299:1.
- Sariya et al. (2012) Sariya DP, Yadav RKS, Yadav Bellini A. Proper motions and membership probabilities of stars in the region of globular cluster NGC 6809. Astron Astrophys 2012;543:87.
- Schönrich and Binney (2010) Schönrich R, Binney J, Dehnen W. Local kinematics and the local standard of rest. Mon Not Roy Astron Soc 2010;403:1829.
- Spitzer & Hart (1971) Spitzer L, Hart M. Random Gravitational Encounters and the Evolution of Spherical Systems. I. Method. Astron J 1971;164:399.
- Soubiran et al. (2018) Soubiran C, et al. Open cluster kinematics with Gaia DR2. Astron Astrophys 2018;619:155.
- Soubiran et al. (2019) Soubiran C, et al. Open cluster kinematics with Gaia DR2 (Corrigendum). Astron Astrophys 2019;623:2.
- Subramaniam et al. (2010) Subramaniam A, Carraro G, Janes KA. Optical photometry and basic parameters of 10 unstudied open clusters. Mon Not Roy Astron Soc 2010;404:1385.
- Tadross (2008a) Tadross AL. A Catalogue of previously unstudied Berkeley clusters. Mon Not Roy Astron Soc 2008;389:285.
- Tadross (2008b) Tadross AL. The main parameters of 25 un-studied open star clusters. New Astronomy 2008;13:370.
- Tarricq et al. (2021) Tarricq Y, Soubiran C, Casamiquela L, Castro-Ginard A, Olivares J, Miret-Roig N, Galli PAB. Structural parameters of 389 local Open Clusters. Astron Astrophys 2021;arXiv.
- van den Berg et al. (1991) van den Berg S, Morbey C, Pazder J. Diameters of Galactic Globular Clusters. Astron J 1991;375:594.
- von Hoerner (1957) von Hoerner S. Internal structure of globular clusters. Astron J 1957;125:451.
- Wang & Chen (2019) Wang S, Chen X. The Optical to Mid-infrared Extinction Law Based on the APOGEE, Gaia DR2, Pan-STARRS1, SDSS, APASS, 2MASS, and WISE Surveys. Astron J 2019;877:116.
- Wu et al. (2002) Wu ZY, Tian KP, Balaguer-Nunez L, Jordi C, Zhao JL, Guibert J. Determination of proper motions and membership of the open star cluster NGC2548. Astron Astrophys 2002;381:464.