SeGraM: A Universal Hardware Accelerator for
Genomic Sequence-to-Graph and Sequence-to-Sequence Mapping
Abstract.
A critical step of genome sequence analysis is the mapping of sequenced DNA fragments (i.e., reads) collected from an individual to a known linear reference genome sequence (i.e., sequence-to-sequence mapping). Recent works replace the linear reference sequence with a graph-based representation of the reference genome, which captures the genetic variations and diversity across many individuals in a population. Mapping reads to the graph-based reference genome (i.e., sequence-to-graph mapping) results in notable quality improvements in genome analysis. Unfortunately, while sequence-to-sequence mapping is well studied with many available tools and accelerators, sequence-to-graph mapping is a more difficult computational problem, with a much smaller number of practical software tools currently available.
We analyze two state-of-the-art sequence-to-graph mapping tools and reveal four key issues. We find that there is a pressing need to have a specialized, high-performance, scalable, and low-cost algorithm/hardware co-design that alleviates bottlenecks in both the seeding and alignment steps of sequence-to-graph mapping. Since sequence-to-sequence mapping can be treated as a special case of sequence-to-graph mapping, we aim to design an accelerator that is efficient for both linear and graph-based read mapping.
To this end, we propose SeGraM, a universal algorithm/hardware co-designed genomic mapping accelerator that can effectively and efficiently support both sequence-to-graph mapping and sequence-to-sequence mapping, for both short and long reads. To our knowledge, SeGraM is the first algorithm/hardware co-design for accelerating sequence-to-graph mapping. SeGraM consists of two main components: (1) MinSeed, the first minimizer-based seeding accelerator, which finds the candidate locations in a given genome graph; and (2) BitAlign, the first bitvector-based sequence-to-graph alignment accelerator, which performs alignment between a given read and the subgraph identified by MinSeed. We couple SeGraM with high-bandwidth memory to exploit low latency and highly-parallel memory access, which alleviates the memory bottleneck.
We demonstrate that SeGraM provides significant improvements for multiple steps of the sequence-to-graph (i.e., S2G) and sequence-to-sequence (i.e., S2S) mapping pipelines. First, SeGraM outperforms state-of-the-art S2G mapping tools by / and / for long and short reads, respectively, while reducing power consumption by / and /. Second, BitAlign outperforms a state-of-the-art S2G alignment tool by – and three S2S alignment accelerators by –. We conclude that SeGraM is a high-performance and low-cost universal genomics mapping accelerator that efficiently supports both sequence-to-graph and sequence-to-sequence mapping pipelines.
1. Introduction
Genome sequencing, the process used to determine the DNA sequence of an organism, has led to many notable advancements in several fields, such as personalized medicine (e.g., (alkan2009personalized, ; flores2013p4, ; ginsburg2009genomic, ; chin2011cancer, ; Ashley2016, ; chan2011personalized, ; offit2011personalized, )), outbreak tracing (e.g., (wang2020initial, ; nikolayevskyy2016whole, ; qiu2015whole, ; gilchrist2015whole, ; quick2016real, ; houldcroft2017clinical, ; guo2020origin, )), evolutionary biology (e.g., (ellegren2014genome, ; Prado-Martinez2013, ; Prohaska2019, ; hudson2008sequencing, )), and forensic science (e.g., (yang2014application, ; borsting2015next, ; alvarez2017next, ; berglund2011next, )). Contemporary genome sequencing machines are unable to determine the base pairs (i.e., A, C, G, T nucleobases) of the entire DNA sequence. Instead, the machines take a DNA sequence and break it down into small fragments, called reads, whose base pairs can be reasonably accurately identified. As an example, human DNA consists of approximately 3.2 billion base pairs, while reads, depending on the sequencing technology, range in size from a few hundred (hu2021next, ; iseqwebpage, ; miniseqwebpage, ; miseqwebpage, ; nextseqwebpage, ; novaseqwebpage, ) to a few million (cali2017nanopore, ; amarasinghe2020opportunities, ; jain2018nanopore, ; hu2021next, ; minionwebpage, ; gridionwebpage, ; promethionwebpage, ; sequelwebpage, ) base pairs. Computers then reconstruct the reads back into a full DNA sequence. In order to find the locations of the reads in the correct order, read-to-reference mapping is performed. The reads are mapped to a reference genome (i.e., a complete representative DNA sequence of a particular organism) for the same species.
A single (i.e., a linear) reference genome is not representative of different sets of individuals (e.g., subgroups) in a species and using a single reference genome for an entire species may bias the mapping process (i.e., reference bias) due to the genetic diversity that exists within a population (garrison2018variation, ; martiniano2020removing, ; chen2021reference, ; jain2021variant, ; vaddadi2019read, ; ballouz2019time, ; paten2017genome, ; yang2019one, ). For example, the African genome, with all known genetic variations within the populations of African descent, contains 10% more DNA bases than the current linear human reference genome (sherman2019assembly, ). Combined with errors that can be introduced during genome sequencing (with error rates as high as 5–10% for long reads (jain2018nanopore, ; weirather2017comprehensive, ; ardui2018single, ; van2018third, ; cali2017nanopore, ; hu2021next, ; amarasinghe2020opportunities, )), reference bias can lead to significant inaccuracies during mapping. This can create many issues for a wide range of genomic studies, from identifying mutations that lead to cancer (computational2018computational, ), to tracking mutating variants of viruses such as SARS-CoV-2 (computonics2020hackathon, ), where detecting the variations that exist in the sequenced genome accurately is of critical importance for both diagnosis and treatment (ambler2019gengraph, ).
An increasingly popular technique to overcome reference bias is the use of graph-based representations of a species’ genome, known as genome graphs (pevzner2001eulerian, ; paten2017genome, ; ameur2019goodbye, ; kaye2021genome, ; rakocevic2019fast, ; eizenga2020pangenome, ). A genome graph enables a compact representation of the linear reference genome, combined with the known genetic variations in the entire population as a graph-based data structure. As we show in Figure 1, a node represents one or more base pairs, an edge enables two nodes to be connected to each other, and base pairs in connected nodes represent the sequence of base pairs in the genomic sequence. Multiple outgoing directed edges from a node captures genetic variations.
Genome graphs are growing in popularity for a number of genomic applications, such as (1) variant calling (garrison2018variation, ; rakocevic2019fast, ; olson2021precisionfda, ), which identifies the genomic differences between the sequenced genome and the reference genome; (2) genome assembly (compeau2011apply, ; pevzner2001eulerian, ; zerbino2008velvet, ; simpson2009abyss, ), which reconstructs the entire sequenced genome using the reads without utilizing a known reference genome sequence; (3) error correction (salmela2014lordec, ; rautiainen2020graphaligner, ; zhang2020comprehensive, ), which corrects the noisy regions in long reads due to sequencing errors; and (4) multiple sequence alignment (paten2011cactus, ; lee2002multiple, ; li2020design, ), which aligns three or more biological sequences of similar length. With the increasing importance and usage of genome graphs, having fast and efficient techniques and tools for mapping genomic sequences to genome graphs is now crucial.
Compared to sequence-to-sequence mapping, where an organism’s reads are mapped to the single linear reference genome, sequence-to-graph mapping captures the inherent genetic diversity within a population. This results in significantly more accurate read-to-reference mapping (garrison2018variation, ; rautiainen2020graphaligner, ; li2020design, ; yang2019one, ; kim2019graph, ). For example, sequenced reads from samples that are not represented in the samples used for constructing the reference genome may not align at all or incorrectly align when they originate from a region that differs from the reference genome. This can result in failure to detect disease-related genetic variants. However, if (1) we incorporate the known disease-related genetic variants in our read mapping process using a genome graph and (2) the sequenced sample contains one or more of these variants, we can accurately detect the variant(s).
Figure 2 shows the sequence-to-graph mapping pipeline, which follows the seed-and-extend strategy (garrison2018variation, ; rautiainen2020graphaligner, ), similar to sequence-to-sequence mapping (alser2020accelerating, ). The pipeline is preceded by two offline pre-processing steps. The first offline pre-processing step constructs the genome graph using a linear reference genome and a set of known variations . The second offline pre-processing step indexes the nodes of the graph and generates a hash-table-based index for fast lookup. When reads from a sequenced genome are received, the pipeline tries to map them to the pre-processed reference graph using three online steps. First, the seeding step is executed, where each read is fragmented into sub-strings (called seeds) and exact matching locations of these seeds (i.e., candidate mapping locations) are found within the graph nodes using the index. Second, the optional filtering, chaining, or clustering step is performed to decrease the number of required alignments in the next step. Third, the alignment step is performed between all remaining candidate mapping locations (i.e., subgraphs) within the graph and the query read to find the optimal alignment.
Prior works (turakhia2018darwin, ; cali2020genasm, ; fujiki2018genax, ; alser2021technology, ; alser2017gatekeeper, ; alser2020sneakysnake, ; kim2019airlift, ; alser2020accelerating, ; kim2018grim, ) show that read-to-reference mapping is one of the major bottlenecks of the full genome sequence analysis pipeline, and that it can benefit from algorithm/hardware co-design (alser2020accelerating, ; singh2021fpga, ) that takes advantage of specialized hardware accelerators. Given the additional complexities and overheads of processing a genome graph instead of a linear reference genome, graph-based analysis exacerbates the bottlenecks of read-to-reference mapping. Due to the nascent nature of sequence-to-graph mapping, a much smaller number of software tools (and no hardware accelerators) exist for sequence-to-graph mapping (rautiainen2020graphaligner, ; garrison2018variation, ; rakocevic2019fast, ; kim2019graph, ; rautiainen2019bit, ; ivanov2020astarix, ; jain2020complexity, ; kavya2019sequence, ; darby2020vargas, ; chang2020distance, ; ivanov2022fast, ) compared to the traditional sequence-to-sequence mapping.
In order to identify and quantify the performance bottlenecks of existing tools, we analyze GraphAligner (rautiainen2020graphaligner, ) and vg (garrison2018variation, ), two state-of-the-art software tools for sequence-to-graph mapping. Based on our analysis (Section 3), we make four key observations. (1) Among the three online steps of the read mapping pipeline (i.e., seeding, filtering, and alignment), sequence-to-graph alignment i) constitutes 50–95% of the end-to-end execution of sequence-to-graph mapping, and ii) is even more expensive than its counterpart in the traditional read mapping pipeline (turakhia2018darwin, ; fujiki2018genax, ; cali2020genasm, ) since a graph-based representation of the genome is more complex to process (both computationally and memory-wise) than the linear representation. (2) Alignment suffers from high cache miss rates, due to the high amount of internal data that is generated and reused during this step. (3) Seeding suffers from the main memory (DRAM) latency bottleneck, due to the high number of irregular memory accesses generated when querying the seeds. (4) Both state-of-the-art tools scale sublinearly as thread count increases, wasting available thread-level parallelism in hardware. These observations expose a pressing need to have a specialized, high-performance, scalable, and low-cost algorithm/hardware co-design that alleviates bottlenecks in both the seeding and alignment steps of sequence-to-graph mapping.
To this end, our goal is to design high-performance, scalable, power- and area-efficient hardware accelerators that alleviate bottlenecks in both the seeding and alignment steps of sequence-to-graph mapping, with support for both short (e.g., Illumina (illuminawebsite, ; iseqwebpage, ; miniseqwebpage, ; miseqwebpage, ; nextseqwebpage, ; novaseqwebpage, )) and long (e.g., PacBio (pacbiowebsite, ; sequelwebpage, ), ONT (ontwebsite, ; minionwebpage, ; gridionwebpage, ; promethionwebpage, )) reads. Since sequence-to-sequence (S2S) mapping can be treated as a special case of sequence-to-graph mapping (S2G), we aim to design a universal accelerator that is effective and efficient for both problems (S2G and S2S mapping).
We propose SeGraM, a universal genomic mapping accelerator that supports both sequence-to-graph mapping and sequence-to-sequence mapping, for both short and long reads. SeGraM consists of two main components: (1) MinSeed, the first minimizer-based seeding accelerator, which finds the candidate mapping locations (i.e., subgraphs) in a given genome graph; and (2) BitAlign, the first bitvector-based sequence-to-graph alignment accelerator, which performs alignment between a given read and the subgraph identified by MinSeed. MinSeed is built upon a memory-efficient minimizer-based seeding algorithm, and BitAlign is built upon our novel bitvector-based, highly-parallel sequence-to-graph alignment algorithm.
In MinSeed, the minimizer-based seeding approach decreases the memory footprint of the index and provides speedup during seed queries. MinSeed logic requires only basic operations (e.g., comparisons, simple arithmetic operations, scratchpad read-write operations) that are implemented with simple logic. Due to frequent memory accesses required for fetching the seeds, we couple MinSeed with High-Bandwidth Memory (HBM) (hbm, ) to enable low-latency and highly-parallel memory access, which alleviates the memory latency bottleneck.
In BitAlign, we design a new bitvector-based alignment approach, which is amenable to efficient hardware acceleration. BitAlign employs a systolic-array-based design to circulate the internal data (i.e., bitvectors) generated by different processing elements, which provides scalability and reduces both memory bandwidth and memory footprint. In order to handle hops (i.e., non-neighbor nodes in the graph-based reference), BitAlign provides a simple design that contains queue structures between each processing element, which store the most recently generated bitvectors.
Key Results. We compare SeGraM with seven state-of-the-art works: S2G mapping software (GraphAligner (rautiainen2020graphaligner, ) and vg (garrison2018variation, ), which are CPU-based, and HGA (feng2021hga, ), which is GPU-based), SIMD-based S2G alignment software (PaSGAL (jain2019accelerating, )), and hardware accelerators for S2S alignment (the GACT accelerator in Darwin (turakhia2018darwin, ), the SillaX accelerator in GenAx (fujiki2018genax, ), and GenASM (cali2020genasm, )). We find that: (1) SeGraM outperforms state-of-the-art S2G mapping tools by / and / for long and short reads, respectively, while reducing power consumption by / and /. (2) BitAlign outperforms the state-of-the-art S2G alignment tool by – and three S2S alignment hardware accelerators by –. (3) MinSeed can be employed for the seeding step of both S2G and S2S mapping pipelines.
This paper makes the following contributions:
-
•
We introduce SeGraM, the first universal genomic mapping accelerator for both sequence-to-graph and sequence-to-sequence mapping. SeGraM is also the first algorithm/hardware co-design for accelerating sequence-to-graph mapping. SeGraM alleviates performance bottlenecks of graph-based genome sequence analysis.
-
•
We propose MinSeed, the first algorithm/hardware co-design for minimizer-based seeding. MinSeed can be used for the seeding steps of both S2G mapping and traditional S2S mapping.
-
•
We propose BitAlign, the first algorithm/hardware co-design for sequence-to-graph alignment. BitAlign is based on a novel bitvector-based S2G alignment algorithm that we develop, and can be also used as a S2S aligner.
-
•
SeGraM provides large (–) performance and power benefits over seven state-of-the-art works for end-to-end S2G mapping, multiple steps of the S2G mapping pipeline, as well as the traditional S2S mapping pipeline.
-
•
To aid research and reproducibility, we open source our software implementations of the SeGraM algorithms and datasets (segramgithub, ).
2. Background
We present a brief background on the genome sequence analysis pipeline, and the changes required to it to support genome graphs.
2.1. Genome Sequence Analysis
Read Mapping. Most types of genome sequence analysis start with finding the original locations of the sequenced reads on the reference genome of the organism, via a computational process called read mapping (li2018minimap2, ; li2013aligning, ; alkan2009personalized, ; Xin2013, ; xin2015shifted, ; langmead2012fast, ; li2009soap2, ; alser2020sneakysnake, ; alser2020accelerating, ; alser2021technology, ). To complete this task accurately in the shortest amount of time, many existing read mappers adopt a seed-and-extend approach that consists of four stages (See Figure 2): indexing, seeding, optional filtering/chaining/clustering, and alignment. Indexing pre-processes the reference genome and generates an index of the reference to be later used in the next steps of read mapping. Seeding finds the set of k-length substrings (i.e., k-mers) to represent each read and finds the exact matching locations of these k-mers in the reference genome (i.e., seeds). These seeds from the reference genome represent the candidate mapping locations of the query read in the reference genome. Many read mappers include an optional filtering/chaining/clustering step to eliminate candidate mapping regions around the seed locations from the previous step that are dissimilar to the query read to decrease the number of alignment operations. Finally, to find the read’s optimal mapping location while taking sequencing errors and the differences caused by variations and mutations into account, alignment performs approximate string matching (i.e., ASM) between the read and the reference regions around the non-filtered candidate mapping locations from the previous step. As part of the alignment step, traceback is also performed to find the optimal alignment between the read and the reference region, which is the alignment with the highest likelihood of being correct (based on a scoring function (gotoh1982improved, ; miller1988sequence, ; waterman1984efficient, )) or with lowest edit distance (i.e., total number of edits: substitutions, insertions, deletions) (levenshtein1966binary, ).
Approximate String Matching (ASM) finds the similarities and differences (i.e., substitutions, insertions, deletions) between two strings (navarro2001guided, ; waterman1976some, ; myers1999fast, ; ukkonen1985algorithms, ). Traditional ASM methods use dynamic programming (DP) based algorithms, such as Levenshtein distance (levenshtein1966binary, ), Smith-Waterman (smith1981identification, ), and Needleman-Wunsch (needleman1970general, ). Since DP-based algorithms have quadratic time and space complexity (i.e., O(m × n) between two sequences with lengths m and n), there is a dire need for lower complexity algorithms or algorithm/hardware co-designed ASM accelerators. One lower-complexity approach to ASM is bitvector-based algorithms, such as Bitap (wu1992fast, ; baeza1992new, ; cali2020genasm, ) and the Myers’ algorithm (myers1999fast, ).
2.2. Graph-Based Genome Sequence Analysis
Genome Graphs. Genetic variations between two individuals are observed by comparing the differences between their two genomes. These differences, such as single-nucleotide polymorphisms (i.e., SNPs) (syvanen2001accessing, ; cargill1999characterization, ), insertions and deletions (i.e., indels), and structural variations (i.e., SVs) (feuk2006structural, ; sudmant2015integrated, ; alkan2011genome, ; ho2020structural, ), lead to genetic diversity between populations and within communities (10002015global, ). However, the presence of these genomic variations creates limitations when mapping the sequenced reads to a reference genome (paten2017genome, ; degner2009effect, ; brandt2015mapping, ; gunther2019presence, ), since the reference genome is commonly represented as a single linear DNA sequence, which does not reflect all the genetic variations that exist in a population (schneider2017evaluation, ). Using a single reference genome introduces reference bias, by only emphasizing the genetic variations that are present in the single reference genome (computational2018computational, ; paten2017genome, ; vernikos2015ten, ; sherman2020pan, ; liu2020one, ; golicz2020pangenomics, ) and ignoring other variations that are not represented in the single linear reference sequence. These factors lead to low read mapping accuracy around the genomic regions that have SNPs, indels and SVs, and eventually cause, for example, false detection of SVs (rakocevic2019fast, ).
Genome graphs are better suited for expressing the the genomic regions that have SNPs, indels and SVs than a linear reference sequence (garrison2018variation, ) since genome graphs combine the linear reference genome with the known genetic variations in the entire population as a graph-based data structure. Therefore, there is a growing trend towards using genome graphs (pevzner2001eulerian, ; nurk2022complete, ; rautiainen2020graphaligner, ; garrison2018variation, ; rakocevic2019fast, ; kim2019graph, ; dilthey2015improved, ; olson2021precisionfda, ; zhang2020comprehensive, ; li2020design, ) to more accurately express the genetic diversity in a population. With increasing importance and usage of genome graphs, having accurate and efficient tools for mapping genomic sequences to these graphs has become crucial.
Sequence-to-Graph Mapping. Similar to traditional sequence-to-sequence mapping (Section 2.1), sequence-to-graph mapping also follows the seed-and-extend strategy. Sequence-to-graph mapping pipeline has two pre-processing and three main steps (see Figure 2). The first pre-processing step constructs the genome graph using a linear reference genome and the associated variations for that genome. The second pre-processing step indexes the nodes of the graph . The resulting index is used in the first main step of the pipeline, seeding , which aims to find seed matches between the query read and a region of the graph. After optionally filtering these seed matches with a filtering (xin2015shifted, ; alser2017gatekeeper, ; kim2018grim, ), chaining (li2016minimap, ; li2018minimap2, ; li2020design, ; kalikar2022accelerating, ), or clustering (garrison2018variation, ; rautiainen2020graphaligner, ) step , alignment is performed between all of the non-filtered seed locations within the graph and the query read. Even though sequence-to-sequence mapping is a well-studied problem, given the additional complexities and overheads of processing a genome graph instead of a linear reference genome (see Section 3), sequence-to-graph mapping is a more difficult computational problem with a smaller number of practical software tools currently available.
Sequence-to-Graph Alignment. The goal of aligning a sequence to a graph is to find the path on the graph with the highest likelihood of being correct (jain2019accelerating, ). Similar to traditional sequence-to-sequence (S2S) alignment, sequence-to-graph (S2G) alignment also employs DP-based algorithms with quadratic time complexity (navarro2001guided, ; jain2020complexity, ; kavya2019sequence, ; gao2021abpoa, ; jain2019accelerating, ). A DP-based algorithm operates on a table, where each column of the table corresponds to a reference character, and each row of the table corresponds to a query read character. Each cell of the table can be interpreted as the cost of a partial alignment between the subsequences of the reference and of the query read that have been traversed so far. In S2S alignment, a new cell in the table is determined with simple rules from 3 of its neighbor cells. For example, as we show in Figure 3a, when computing the blue-shaded cell, we need information only from the three light blue-shaded cells. In contrast to S2S alignment, S2G alignment must incorporate non-neighboring characters as well whenever there is an edge (i.e., hop) from the non-neighboring character to the current character. For example, as we show in Figure 3b, when computing the green-shaded cell, we need information from all of the light green-shaded cells.
Even though there are many efforts for optimizing or accelerating the DP-based algorithms for S2S alignment (turakhia2018darwin, ; fujiki2018genax, ; fujiki2020seedex, ; haghi2021fpga, ; fei2018fpgasw, ; banerjee2018asap, ), obtaining efficient solutions for S2G alignment demands attention with the growing usage of genome graphs for genome sequence analysis.
3. Motivation and Goal
3.1. Software Tool Analysis
In order to understand the performance bottlenecks of the state-of-the-art sequence-to-graph mapping tools, we rigorously analyze two such tools, GraphAligner (rautiainen2020graphaligner, ) and vg (garrison2018variation, ), running on an Intel® Xeon® E5-2630 v4 CPU (intel_cpu, ) with 20 physical cores/40 logical cores with hyper-threading (magro2002hyper, ; koufaty2003hyperthreading, ; tullsen1995simultaneous, ; tullsen1996exploiting, ), operating at 2.20GHz, with 128GB DDR4 memory. Based on our bottleneck analysis with Intel VTune (intelvtune, ) and Linux Perf Tools (perftool, ), we make four key observations.
Observation 1: Alignment Step is the Bottleneck. Among the three main steps of the sequence-to-graph mapping pipeline (Figure 2), the alignment step constitutes 50–95% of the end-to-end execution time (measured across three short and four long read datasets; see Section 10). As shown in prior works (turakhia2018darwin, ; fujiki2018genax, ; cali2020genasm, ; fujiki2020seedex, ; alser2020accelerating, ), sequence-to-sequence alignment is one of the major bottlenecks of the genome sequence analysis pipeline, and needs to be accelerated using specialized hardware. Since a graph-based representation of the genome is more complex than the linear representation, sequence-to-graph alignment places greater pressure on this bottleneck.
Observation 2: Alignment Suffers from High Cache Miss Rates. GraphAligner has a cache miss rate111We use the cache-misses metric from Linux Perf Tools (perftool, ). of 41%, meaning that GraphAligner requires improvements to the on-chip caches (e.g., lower access latency) in order to improve its performance. We find that the main reason of this high cache miss rate is the high amount of intermediate data that is generated and reused as part of the alignment step (for the dynamic programming table). vg tackles this issue by dividing the read into overlapping chunks, which reduces the size of the dynamic programming table, thus the size of the intermediate data.
Observation 3: Seeding Suffers from the DRAM Latency Bottleneck. Our profiling of the seeding step of the pipeline finds that seeding requires a significant number of random main memory accesses while querying the index for the seed locations and suffers from the DRAM latency bottleneck.
Observation 4: Baseline Tools Scale Sublinearly. When we perform a scalability analysis by running GraphAligner and vg with 5, 10, 20, and 40 threads, we observe that both tools scale sublinearly (i.e., their parallel efficiency does not exceed 0.4). When we focus on the change in the cache miss rate with the number of threads (t=10, 20, 40), we observe that (1) from t=10 to t=20 to t=40, the cache miss rate increases from 25% to 29% to 41%, and (2) 76% of cache misses are associated with the alignment step of sequence-to-graph mapping when t=40. These results suggest that when the number of threads reaches the number of logical cores in a CPU system, due to the large amount of intermediate data required to be accessed in the caches during the alignment step, two threads sharing the same physical core experience significant cache and main memory interference with each other and cannot fully take advantage of the full thread-level parallelism available in hardware.
When we take all four observations into account, we find that we need to have a specialized, balanced, and scalable design for compute units, on-chip memory, and main memory accesses for both the seeding and alignment steps of sequence-to-graph mapping. Unfortunately, these bottlenecks cannot be solved easily by software-only or hardware-only solutions. Thus, there is a pressing need to co-design new algorithms with new hardware to enable high-performance, efficient, scalable, and low-cost sequence-to-graph mapping.
3.2. Accelerating Sequence-to-Graph Mapping
Sequence-to-Sequence Accelerators. Even though there are several hardware accelerators designed to alleviate bottlenecks in several steps of traditional sequence-to-sequence (S2S) mapping (e.g., pre-alignment filtering (kim2018grim, ; xin2015shifted, ; alser2017gatekeeper, ; alser2017magnet, ; alser2019shouji, ; alser2020sneakysnake, ; singh2021fpga, ; mansouri2022genstore, ; nag2019gencache, ; subramaniyan2020accelerating, ; huangfu2020nest, ; huangfu2019medal, ; laguna2020seed, ; cong2018smem++, ), sequence-to-sequence alignment (turakhia2018darwin, ; fujiki2018genax, ; cali2020genasm, ; fujiki2020seedex, ; banerjee2018asap, ; kim2020geniehd, ; haghi2021fpga, ; khatamifard2021genvom, ; fei2018fpgasw, ; rucci2018swifold, )), none of these designs can be directly employed for the sequence-to-graph (S2G) mapping problem. This is because S2S mapping is a special case of S2G mapping, where all nodes have only one edge (Figure 3a). Existing accelerators are limited to only this special case, and are unsuitable for the more general S2G mapping problem, where we also need to consider multiple edges (i.e., hops) that a node can have (Figure 3b).
S2G mapping is a more complex problem than S2S mapping since the graph structure is more complex than a linear sequence. This additional complexity results in four issues. First, even though solutions for both problems follow the seed-and-extend approach, the already-expensive alignment step of S2S mapping is even more expensive in S2G mapping due to the hops in the graph that must be handled. Second, these hops add irregularity to the execution flow of alignment since they can originate from any vertex in the graph, leading to more data dependencies and irregular memory accesses. Third, the heuristics used in S2S alignment are often not directly applicable to the S2G problem, as they assume a single linear reference sequence. For example, chaining, which is used to combine different seed hits in long read mapping (assuming they are part of a linear sequence), cannot be used directly for a genome graph because there can be multiple paths connecting two seeds together in the graph. Fourth, since the genome graph contains both the linear reference sequence and the genetic variations, the search space for the query reads is much larger in S2G mapping than in S2S mapping.
Existing S2S mapping accelerators can mimic the behavior of S2G mapping by taking all paths that exist in the genome graph into account and aligning the same read to each of these paths one at a time. However, this would be prohibitively inefficient in terms of both computation and memory requirements (e.g., it would require an exorbitant memory footprint to store all possible graph paths as separate linear sequence strings). Thus, with the growing importance and usage of genome graphs, it is crucial to have efficient designs optimized for sequence-to-graph mapping, which can effectively work with both short and long reads.
Graph Processing Accelerators. Unlike typical graph traversal workloads (page1999pagerank, ; moore1959shortest, ; dijkstra1959note, ; su2009survey, ), sequence-to-graph mapping involves high amounts of both random memory accesses (due to the seeding step) and expensive computations (due to the alignment step). Seeding enables the mapping algorithm to detect and focus on only certain candidate subgraphs, eliminating the need for a full graph traversal. Alignment is not a graph traversal workload, and instead is an expensive bitvector-based or DP-based computational problem. While existing graph accelerators (zhong2013medusa, ; graphp, ; ahn2015pim, ; ahn2015scalable, ; graphpim, ; song2018graphr, ; sengupta2015graphreduce, ; nurvitadhi2014graphgen, ; gui2019survey, ; khoram2018accelerating, ; dai2018graphh, ; zhang2017boosting, ; zhang2015efficient, ; zhou2017tunao, ; ozdal2016energy, ; ham2016graphicionado, ; dai2017foregraph, ; zhou2016high, ; dai2016fpgp, ; attia2014cygraph, ; delorimier2006graphstep, ; wang2016gunrock, ; khorasani2014cusha, ; wang2019processor, ; besta2021sisa, ) could potentially be customized to help the seeding step of the sequence-to-graph mapping pipeline, they are unable to handle the major bottleneck of sequence-to-graph mapping, which is alignment.
3.3. Our Goal
Our goal is to design a high-performance, memory-efficient, and scalable hardware acceleration framework for sequence-to-graph mapping that can also effectively perform sequence-to-sequence mapping. To this end, we propose SeGraM, the first universal genomic mapping accelerator that can support both sequence-to-graph mapping and sequence-to-sequence mapping, for both short and long reads. To our knowledge, SeGraM is the first algorithm/hardware co-design for accelerating sequence-to-graph mapping.
4. SeGraM: High-Level Overview
SeGraM provides efficient and general-purpose acceleration for both the seeding and alignment steps of the sequence-to-graph mapping pipeline. We base SeGraM upon a minimizer-based seeding algorithm and we propose a novel bitvector-based algorithm to perform approximate string matching between a read and a graph-based reference genome. We co-design both algorithms with high-performance, scalable, and efficient hardware accelerators. As we show in Figure 4, a SeGraM accelerator consists of two main components: (1) MinSeed (MS), which finds the minimizers for a given query read, fetches the candidate seed locations for the selected minimizers, and for each candidate seed, fetches the subgraph surrounding the seed; and (2) BitAlign (BA), which, aligns the query read to the subgraphs identified by MinSeed, and finds the optimal alignment. To our knowledge, MinSeed is the first hardware accelerator for minimizer-based seeding and BitAlign is the first hardware accelerator for sequence-to-graph alignment.
Before SeGraM execution starts, pre-processing steps (1) generate each chromosome’s graph structure, (2) index each graph’s nodes, and (3) pre-load both the resulting graph and hash table index into the main memory. Both the graph and its index are static data structures that can be generated only once and reused for multiple mapping executions (Section 5).
SeGraM execution starts when the query read is streamed from the host and MinSeed writes it to the read scratchpad ( ). Using all of the k-length subsequences (i.e., k-mers) of the query read, MinSeed finds the minimum representative set of these k-mers (i.e., minimizers) according to a scoring mechanism and writes them to the minimizer scratchpad ( ). For each minimizer, MinSeed fetches its occurrence frequency from the hash table in main memory ( ) and filters out each minimizer whose occurrence frequency is above a user-defined threshold ( ). We aim to select the least frequent minimizers and filter out the most frequent minimizers such that we minimize the number of seed locations to be considered for the expensive alignment step. Next, MinSeed fetches the seed locations of the remaining minimizers from main memory, and writes them to the seed scratchpad ( ). Finally, MinSeed calculates the candidate reference region (i.e., subgraph surrounding the seed) for each seed ( ), fetches the graph nodes from memory for each candidate region in the reference and writes the nodes to the input scratchpad of BitAlign. ( ). BitAlign starts by reading the subgraph and the query read from the input scratchpad, and generates the bitvectors ( ) required for performing approximate string matching and edit distance calculation. While generating these bitvectors, BitAlign writes them to the hop queues ( ) in order to handle the hops required for graph-based alignment, and also, to the bitvector scratchpad ( ) to be later used as part of the traceback operation. Once BitAlign finishes generating and writing all the bitvectors, it starts reading them back from the bitvector scratchpad, performs the traceback operation ( ), finds the optimal alignment between the subgraph and the query read, and streams the optimal alignment information back to the host ( ).
5. Pre-Processing for SeGraM
SeGraM requires two pre-processing steps before it can start execution: (1) generating the graph-based reference, and (2) generating the hash-table-based index for the reference graph. After generating both data structures, we pre-load both the resulting graph and its index into main memory. Both the graph and its index are static data structures that can be generated only once and reused for multiple mapping executions. As such, pre-processing overheads are expected to be amortized across many mapping executions.
Graph-Based Reference Generation. As the first pre-processing step, we generate the graph-based reference using a linear reference genome (i.e., as a FASTA file (fasta, )) and its associated variations (i.e., as one or more VCF files (vcf, )). We use the vg toolkit’s (garrison2018variation, ) vg construct command, and generate one graph for each chromosome. For the alignment step of sequence-to-graph mapping, we need to make sure the nodes of each graph are topologically sorted. Thus, we sort each graph using the vg ids -s command. Then, we convert our VG-formatted graphs to GFA-formatted (gfa, ) graphs using the vg view command since GFA is easier to work with for the later steps of the pre-processing.
As shown in Figure 5, we generate three table structures to store the graph-based reference: (1) the node table, (2) the character table, and (3) the edge table. The node table stores one entry for each node of the graph, using the node ID as the entry index, with the entry containing four fields: (i) the length of the node sequence in characters, (ii) the starting index corresponding to the node sequence in the character table, (iii) the outgoing edge count for the node, and (iv) the starting index corresponding to the node’s list of outgoing edges in the edge table. The character table stores the associated sequence of each node, with each entry consisting of one character in the sequence (i.e., A, C, G, T). The edge table stores the associated outgoing nodes of each node (indexed by node ID), with each entry consisting of an outgoing node ID.
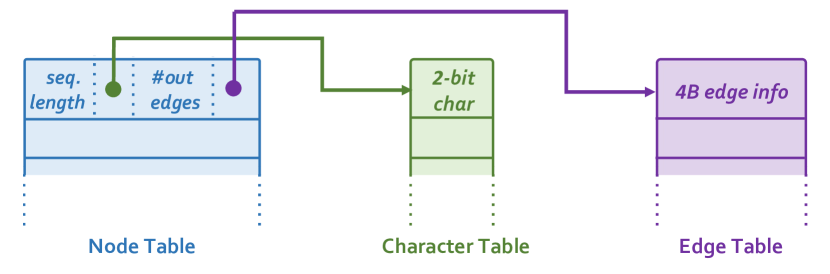
We use statistics about each chromosome’s associated graph (i.e., number of nodes, number of edges, and total sequence length) to determine the size of each table and of each table entry. Based on our analysis, we find that each entry in the node table requires , with a total table size of #nodes . Since we can store characters in the character table using a 2-bit representation (A:00, C:01, G:10, T:11), the total size of the table is total sequence length . We find that each entry in the edge table requires 4B, thus the total size of the edge table is #edges . Across all 24 chromosomes (1–22, X, and Y) of the human genome, the storage required for the graph-based reference is . We store the graph-based reference in main memory.
Hash-Table-Based Index Generation. As the second pre-processing step, we generate the hash-table-based index for each of the generated graphs (i.e., one index for each chromosome). The nodes of the graph structure are indexed and stored in the hash-table-based index. As we explain in Section 6, since SeGraM performs minimizer-based seeding, we use minimizers (roberts2004reducing, ; li2016minimap, ; li2018minimap2, ) as the hash table key, and the minimizers’ exact matching locations in the graphs’ nodes as the hash table value.
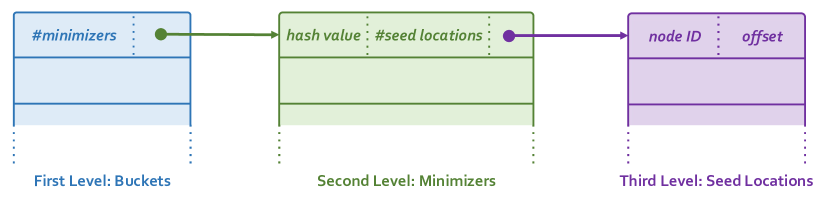
As shown in Figure 6, we use a three-level structure to store the hash-table-based index. In the first level of the hash-table-based index, similar to Minimap2 (li2018minimap2, ), we use buckets to decrease the memory footprint of the index. Each entry in this first level corresponds to a single bucket, and contains the starting address of the bucket’s minimizers in the second-level table, along with the number of minimizers in the second-level table that belong to the bucket. In the second level, we store one entry for each minimizer. Each second-level entry stores the hash value of the corresponding minimizer, the starting address of the minimizer’s seed locations in the third-level table, and number of locations that belong to the minimizer. The minimizers are sorted based on their hash values. In the third level, each entry corresponds to one seed location. An entry contains the node ID of the corresponding seed location, and the relative offset of the corresponding seed location within the node. Locations are grouped based on their corresponding minimizers, and sorted within each group based on their values.

We use statistics about each graph (i.e., number of distinct minimizers, total number of locations, maximum number of minimizers per bucket, and maximum number of locations per minimizer) to determine the size of the hash-table-based index. We empirically choose the first-level bucket count. Figure 7 shows the impact that the number of buckets has on both the total memory footprint of the hash-table-based index (left axis, blue squares) and the maximum number of minimizers in each bucket (right axis, red dots). We observe from the figure that while a lower bucket count decreases the memory footprint of the index, it increases the number of minimizers assigned to each bucket (i.e., the number of hash collisions increases), increasing the number of memory lookups required. We empirically find that a bucket count of strikes a reasonable balance. Each bucket entry requires of data, resulting in a size of for the first level. Each minimizer requires of data, resulting in a size of #distinct minimizers for the second level. Each location requires of data, resulting in a size of #total number of locations for the third level. Across all 24 chromosomes (1–22, X, and Y) of the human genome, the total storage required for the hash-table-based index is . We store the hash-table-based index in main memory.
6. MinSeed Algorithm
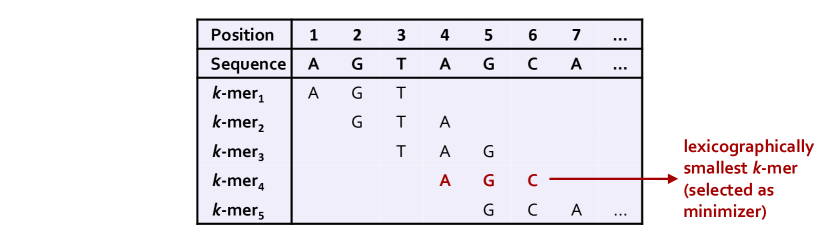
We base MinSeed upon Minimap2’s minimizer-based seeding algorithm (i.e., mm_sketch (li2016minimap, ; li2018minimap2, ; minimap2github, )). A ¡w,k¿-minimizer (roberts2004reducing, ; li2016minimap, ; li2018minimap2, ; schleimer2003winnowing, ; jain2020weighted, ; jain2022long, ) is the smallest k-mer in a window of w consecutive k-mers (according to a scoring mechanism), for subsequences of length k. Minimizers ensure that two different sequences are represented with the same seed if they share an exact match of at least bases long. Compared to using the full set of k-mers, using only the ¡w,k¿-minimizers decreases the storage requirements of the index (by a factor of ) and speeds up index queries. In Figure 8, we show an example of how the ¡5,3¿-minimizer of a sequence is selected from the full set of k-mers from the sequence’s first window. After finding the 5 adjacent 3-mers, we sort them and select the smallest based on a pre-defined ordering/sorting mechanism. In this example, sorting is done based on lexicographical order and the lexicographically smallest k-mer is selected as the minimizer of the first window of the given sequence.
The MinSeed algorithm starts by computing the minimizers of a given query read. While a naive way to compute the minimizers is to use a nested loop (where the outer loop iterates over the query read to define each window and the inner loop finds the minimum k-mer (i.e., minimizer) within each window), we can eliminate the inner loop by caching the previous minimum k-mers within the current window. The single-loop algorithm has a complexity of , where is the length of the query read.
After finding the minimizers of each read, MinSeed queries the hash-table-based index (Section 5) stored in memory to fetch the occurrence frequency (i.e., #locations) of each minimizer. A minimizer is discarded if its occurrence frequency in the reference genome is above a user-defined threshold (pre-computed for each chromosome in order to discard the top 0.02% most frequent minimizers), in order to reduce the number of seed locations that are sent to the alignment step of the mapping pipeline (li2016minimap, ; li2018minimap2, ; Xin2013, )). If the minimizer is not discarded, then all of the seed locations for that minimizer are fetched from the index.
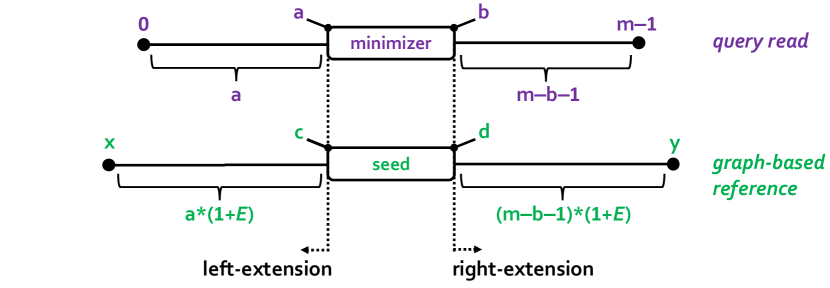
After fetching all seed locations corresponding to all non-discarded minimizers of a query read, MinSeed calculates the leftmost and rightmost positions of each seed, using the node ID and relative offset of the seed location along with the relative offset of the corresponding minimizer within the query read. As we show in Figure 9, to find the leftmost position of the seed region (), we need the start position of the minimizer within the query read (), the start position of the seed within the (graph-based) reference (), and the error rate (). Similarly, to find the rightmost position of the seed region (), we need the end position of the minimizer within the query read (), the end position of the seed within the (graph-based) reference (), the query read length (), and the error rate (). Finally, for all seeds of the query read, the subgraphs, which are found by using the calculated leftmost and rightmost positions of the seed regions, are fetched from main memory. These subgraphs serve as the output of the MinSeed algorithm.
7. BitAlign Algorithm
After MinSeed determines the subgraphs to perform alignment for each query read, for each pair, BitAlign calculates the edit distance and the corresponding alignment between the two. In order to provide an efficient, hardware-friendly, and low-cost solution, we modify the sequence alignment algorithm of GenASM (cali2020genasm, ; genasmgithub, ), which is bitvector-based, to support sequence-to-graph alignment, and we exploit the bit-parallelism that the GenASM algorithm provides.
GenASM. GenASM (cali2020genasm, ) makes the bitvector-based Bitap algorithm (wu1992fast, ; baeza1992new, ) suitable for efficient hardware implementation. GenASM shares a common characteristic with the well-known DP-based algorithms (levenshtein1966binary, ; smith1981identification, ; needleman1970general, ): both algorithms operate on tables (see Section 2.2 and Figure 3a). The key difference between GenASM-based alignment and DP-based alignment is that cell values are bitvectors in GenASM, whereas cell values are numerical values in DP-based algorithms. In GenASM, the rules for computing new cell values can be formulated as simple bitwise operations, which are particularly easy and cheap to implement in hardware. Unfortunately, GenASM is limited to sequence-to-sequence alignment. We build on GenASM’s bitvector-based algorithm to develop our new sequence-to-graph alignment algorithm, BitAlign.
BitAlign. There is a major difference between sequence-to-sequence alignment and sequence-to-graph alignment: for the current character, sequence-to-sequence alignment needs to know about only the neighboring (i.e., previous/adjacent) text character, whereas sequence-to-graph alignment must incorporate non-neighboring characters as well whenever there is an edge (i.e., hop) from the current character to the non-neighboring character (see Section 2.2 and Figure 3b). To ensure that each of these data dependencies can be resolved as quickly as possible, we topologically sort the input graph during pre-processing, as described in Section 5.
Algorithm 1 shows our new BitAlign algorithm. BitAlign starts with a linearized and topologically sorted input subgraph. This ensures that (1) we can iterate over each node of the input graph sequentially, and (2) all of the required bitvectors for the current iteration have already been generated in previous iterations. Besides the subgraph, BitAlign also takes the query read and the edit distance threshold (i.e., maximum number of edits to tolerate when performing approximate string matching (levenshtein1966binary, )) as inputs.
Inputs: linearized and topologically sorted subgraph (reference),
query-read (pattern), k (edit distance threshold)
Outputs: editDist (minimum edit distance), CIGARstr (traceback output)
Similar to GenASM, as a pre-processing step, we generate four pattern bitmasks for the query read (one for each character in the alphabet: A, C, G, T; Line 3). Unlike in GenASM, which stores only the most recent status bitvectors (i.e., R[d] bitvectors, where ) that hold the partial match information, BitAlign needs to store all of the status bitvectors for all of the text iterations (i.e., allR[n][d], where is the length of the linearized reference subgraph; Line 5). These allR[n][d] bitvectors will be later used by the traceback step of BitAlign (Line 25).
Next, BitAlign iterates over each node of the linearized graph (Line 7) and retrieves the pattern bitmask for each node, based on the character stored in the current node (Lines 8–9). Unlike in GenASM, when computing three of the intermediate bitvectors (i.e., match, substitution, and deletion; Lines 11–14, 19–22), BitAlign incorporates the hops as well by examining all successor nodes that the current node has (Lines 12 and 19). When calculating the deletion (), substitution (), and match () bitvectors, we take the hops into consideration, whereas when calculating the insertion () bitvector (Lines 17–18), we do not need to, since an insertion does not consume a character from the reference subgraph, but does so from the query read only. After computing all of these intermediate bitvectors, we store only the R[d] bitvector (i.e., ANDed version of the intermediate bitvectors) in memory (Lines 23–24). After completing all iterations, we perform traceback (Line 25) by traversing the stored bitvectors in the opposite direction to find the optimal alignment (based on the user-supplied alignment scoring function).
To perform GenASM-like traceback, BitAlign stores bitvectors per graph edge (similar to how GenASM stores three out of the four intermediate vectors), where is the edit distance threshold. Since the number of edges in the graph can only be bounded very loosely, the potential memory footprint increases significantly, which is expensive to implement in hardware. We solve this problem by storing only bitvectors per node (i.e., R[d] bitvectors), from which the bitvectors per edge can be regenerated on-demand during traceback. While this modification incurs small additional computational overhead, it decreases the memory footprint of the algorithm by at least . Since the main area and power cost of the alignment hardware comes from memory, we find this trade-off favorable.
Similar to GenASM, BitAlign also follows the divide-and-conquer approach, where we divide the linearized subgraph and the query read into overlapping windows and execute BitAlign for each window. After all windows’ traceback outputs are found, we merge them to find the final traceback output. This approach helps us to decrease the memory footprint and lower the complexity of the algorithm.
8. SeGraM Hardware Design
In SeGraM, we co-design our new MinSeed and BitAlign algorithms with specialized custom accelerators that can support both sequence-to-graph and sequence-to-sequence alignment.
8.1. MinSeed Accelerator
As shown earlier in Figure 4, the MinSeed accelerator consists of: (1) three computation blocks responsible for finding the minimizers from a query read ( from Figure 4), filtering minimizers based on their frequencies ( ), and finding the candidate reference regions (i.e., subgraphs surrounding the candidate seeds) ( ) by calculating each seed’s leftmost and rightmost positions (Section 6); (2) three scratchpad (on-chip SRAM memory) blocks; and (3) the memory interface, which handles the lookups of minimizer frequency, seed location, and subgraph from the attached main memory stack ( , , and from Figure 4).
As Figure 10 shows, the MinSeed accelerator receives the query read as its input, and finds the candidate subgraphs (from the reference) as its output. The computation modules (purple-shaded blocks) are implemented with simple logic, since we require only basic operations (e.g., comparisons, simple arithmetic operations, scratchpad R/W operations).
MinSeed accelerator consists of three scratchpads (gray-shaded blocks): (1) read scratchpad, which stores the query read; (2) minimizer scratchpad, which stores the minimizers fetched from the query read; and (3) seed scratchpad, which stores the seeds fetched from the memory for the minimizers. For all three scratchpads, we employ a double buffering technique to hide the latency of the MinSeed accelerator (See Section 8.3). Based on our empirical analysis, we find that (1) the read scratchpad requires of storage such that it can store 2 query reads of length, where each character of the query reads is represented using 2 bits (A:00, C:01, G:10, T:11); (2) the minimizer scratchpad requires of storage such that it can store the minimizers of 2 different query reads, where the maximum number of minimizers that a query read in our datasets (Section 10) can have is 2050 and each minimizer is represented with 10B of data; and (3) the seed scratchpad requires of storage such that it can store the seed locations of 2 different minimizers, where the maximum number of seed locations that a minimizer of a query read in our datasets can have is 242 and each seed location is represented with 8B of data.
8.2. BitAlign Accelerator
As shown earlier in Figure 4, the BitAlign accelerator consists of: (1) two computation blocks responsible for generating bitvectors to perform approximate string matching and edit distance calculation ( from Figure 4) and traversing bitvectors to perform traceback ( ); (2) two scratchpad blocks for storing the input data and intermediate bitvectors, and (3) hop queue registers for handling the hops.
We implement the bitvector generation hardware of BitAlign as a linear cyclic systolic array based (kung1978systolic, ; kung1982systolic, ) accelerator. While this design is based on the GenASM-DC hardware (cali2020genasm, ), our new design incorporates hop queue registers in order to feed the bitvectors of non-neighboring characters/nodes. As we show in Figure 11, the bitvector generated by each processing element (PE) (i.e., hop bitvector) is fed to the tail of the hop queue register of the current PE. Each hop queue register then provides its stored bitvectors as the bitvectors to the same PE (required for the match bitvector calculation), and as the bitvectors to the next PE (required for deletion and substitution bitvector calculation) in the next cycle. The bitvector (required for insertion bitvector calculation) is directly provided by the previous PE (i.e., not through the hop queue registers).
We implement the hop information between nodes of the graph as an adjacency matrix called HopBits (Figure 12). Based on the HopBits entry of the current text character, either the actual hop bitvector (if the HopBits entry is 1), or a bitvector containing all ones such that it will not have any effect on the bitwise operations (if the HopBits entry is 0), is used when calculating the match, deletion, and substitution bitvectors of the current PE.
In order to decrease the size of each hop queue register and the HopBits matrix, we perform an empirical analysis in Figure 13, where we measure the fraction of total number of hops in the graph-based reference genome that we can cover (Y-axis) when we limit the distance between the farthest node to take into account and the current node (i.e., hop limit; X-axis). As Figure 13 shows, when we select 12 as the hop limit, we cover more than 99% of all hops in the graph-based reference. This is a reasonable limit because a significant percentage of genetic variations in a human genome are either single nucleotide substitutions (i.e., single nucleotide polymorphisms, SNPs) or small indels (insertions/deletions) (10002015global, ), which would result in short hops that connect near-vicinity vertices in the graph. On the other hand, even though large structural variations (SVs) would result in long hops connecting farther vertices in the graph, such SVs occur at a very low frequency.222Hop limit introduces a tradeoff between power/area overhead and accuracy. We leave overcoming this tradeoff and improving accuracy of our design as future work. As a result, in a topologically-sorted graph-based reference, the majority of vertices are expected to have all of their neighbors within close proximity.
BitAlign uses two types of SRAM buffers: (1) input scratchpad, which stores the linearized reference graph, associated HopBits for each node, and the pattern bitmasks for the query read; and (2) bitvector scratchpad, which stores the intermediate bitvectors generated during the edit distance calculation step of BitAlign and used during the traceback step of BitAlign. For a 64-PE configuration with 128 bits of processing per PE (i.e., the width of bitvectors), BitAlign requires a total of in input scratchpad storage. Each PE also requires a total of bitvector scratchpad storage (, in total) and hop queue register storage (, in total). In each cycle, 128 bits of data () is written to each bitvector scratchpad and to each hop queue register by each PE.
As we explain in Section 7, in order to decrease the memory footprint of the stored bitvectors required for traceback execution, we store only the ANDed version of the intermediate bitvectors () and re-generate the intermediate bitvectors (i.e., match, substitution, deletion, and insertion) during traceback. Thus, each element of the hop queue register has a length equal to the window size (), instead of . Similarly, with this design choice, the size of each bitvector scratchpad of each PE decreases by .
8.3. Overall System Design
Figure 14 shows the overall design of SeGraM. SeGraM is connected to a host system that is responsible for the pre-processing steps (Section 5) and for transferring the query read to the accelerator. For fair comparison, we exclude the time spent for generating and loading these structures to main memory for both our SeGraM design and for the baseline tools, as this is a one-time cost. Since pre-processing is performed only once for each reference input, it is not the bottleneck of the end-to-end execution.333The reference input changes very infrequently and is reused for all query reads over likely millions of mapping invocations of SeGraM, allowing for the pre-processing latency to be amortized.
When the host transfers a single query read to SeGraM, the read is buffered before being processed. We employ a double buffering technique to hide the transfer latency of the query reads. Thus, this transfer is not on the critical path of SeGraM’s execution, since the next query read to be processed has already been transferred and stored in the read scratchpad of the MinSeed accelerator when the current query read is being processed. This ensures that the host-to-SeGraM connection is not a bottleneck and not on the critical path of the full SeGraM execution.
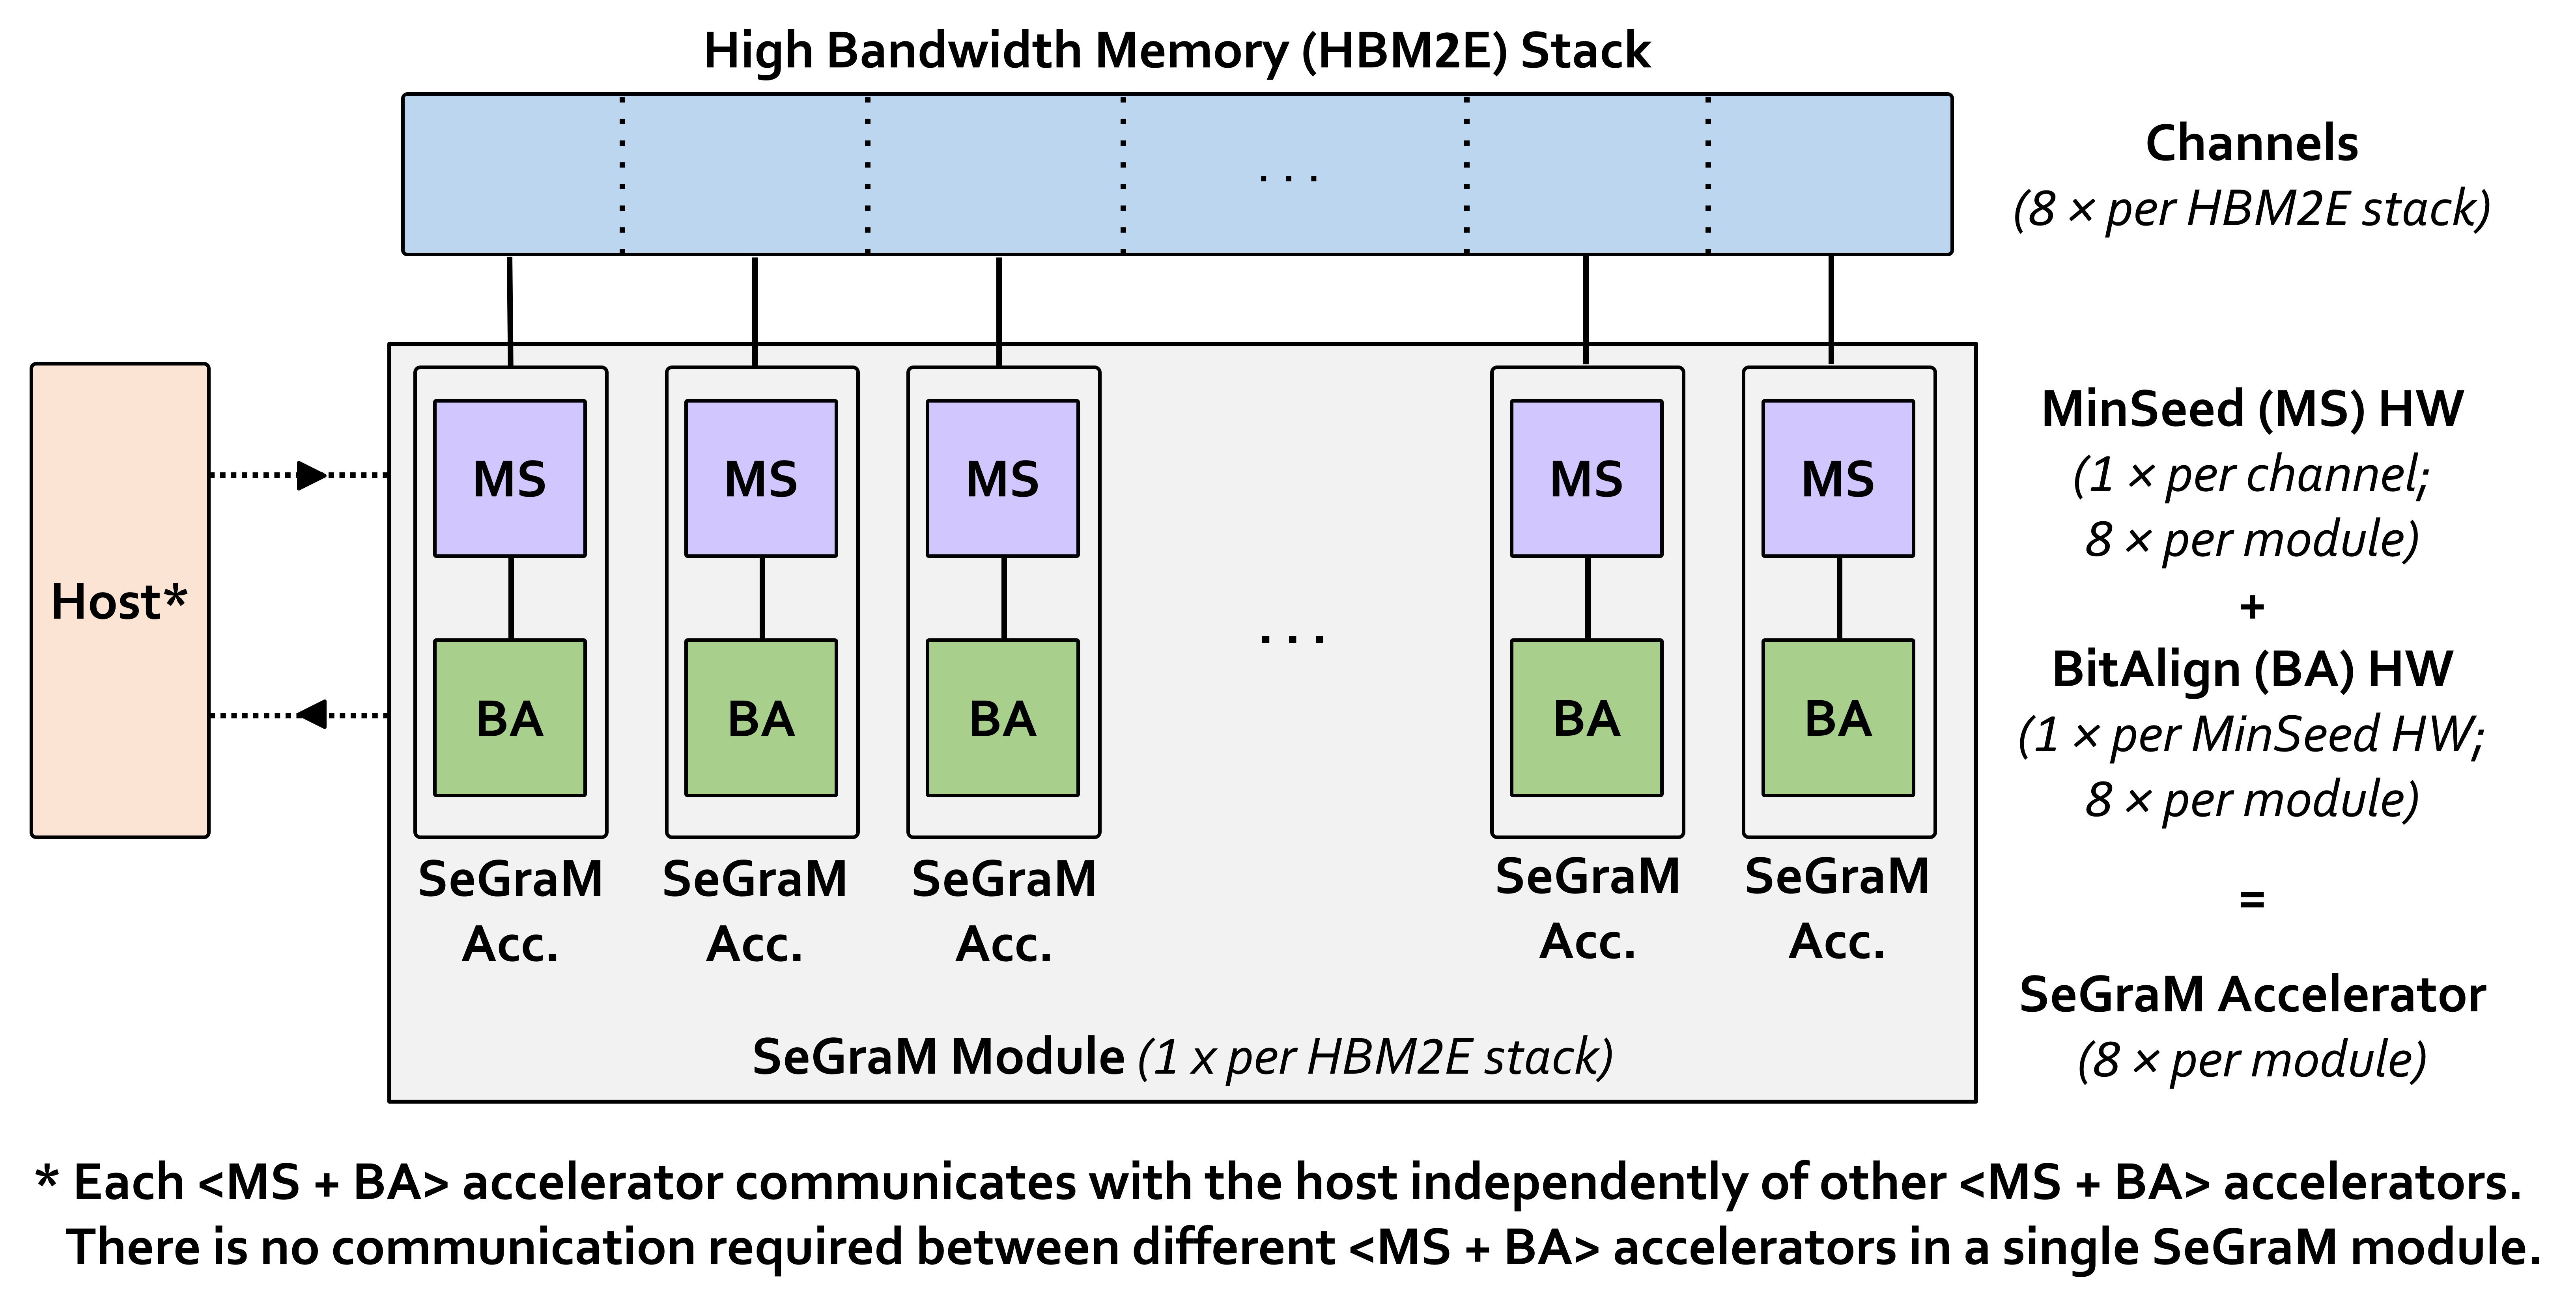
Our hardware platform includes four off-chip HBM2E stacks (hbm, ), each with eight memory channels. Next to each HBM2E stack, we place one SeGraM module. A single SeGraM module consists of 8 SeGraM accelerators, where each accelerator is a combination of one MinSeed accelerator and one BitAlign accelerator. Each SeGraM accelerator has exclusive access to one HBM2E channel to ensure low-latency and high-bandwidth memory access (ghose2019demystifying, ), without any interference from other SeGraM accelerators in each module.444There is no communication required between different SeGraM accelerators in a single SeGraM module, and each SeGraM accelerator communicates with the host independently of other SeGraM accelerators. By placing SeGraM in the same package as the four HBM2E stacks, we mimic the configuration of current commercial devices such as GPUs (v100, ; a100, ) and FPGA boards (vu37p, ; ad9h7, ; singh2020nero, ; singh2021fpga, ).
We replicate the graph-based reference and hash-table-based index across all 4 independent HBM2E stacks, which enables us to have 32 independent SeGraM accelerators running in parallel. Within each stack, to balance the memory footprint across all channels, we distribute the graph and index structures of all chromosomes (1–22, X, Y) based on their sizes across the eight independent channels. For the datasets we use, the graph and index structures require a total memory of per stack, which is well within the capacity of a single HBM2E stack (i.e., in current technology) (hbm, ) that we include in our design.
We design each SeGraM accelerator (MinSeed + BitAlign) to operate in a pipelined fashion, such that we can hide the latency of the MinSeed accelerator. While BitAlign is running, MinSeed finds the next set of minimizers, fetches the frequencies and seeds from the main memory, and writes them to their associated scratchpads. In order to enable pipelined execution of MinSeed and BitAlign, we employ the double buffering technique for the minimizer scratchpad and seed scratchpad (as we do for the read scratchpad).
If the minimizers do not fit in the minimizer scratchpad, we can perform a batching approach, where not all of the minimizers will be found and stored together. Instead, a batch (i.e., a subset) of minimizers is found, stored, and used, and then the next batch will be generated out of the read. A similar optimization can be applied to the seed scratchpad if capacity issues arise.
9. Use Cases of SeGraM
As a result of the flexibility and modularity of the SeGraM framework, we can run each accelerator (i.e., MinSeed and BitAlign) together for end-to-end mapping execution, or separately. Thus, we describe three use cases of SeGraM: (1) end-to-end mapping, (2) alignment, and (3) seeding.
End-to-End Mapping. For sequence-to-graph mapping, the whole SeGraM design (MinSeed + BitAlign) should be employed, since both seeding and alignment steps are required (see Section 2.2). With the help of the divide-and-conquer approach inherited from the GenASM (cali2020genasm, ) algorithm, we can use SeGraM to perform sequence-to-graph mapping for both short reads and long reads. Because traditional sequence-to-sequence mapping is a special and simpler variant of sequence-to-graph mapping (i.e., a graph where each node has an outgoing edge to exactly one other node), SeGraM can be used for sequence-to-sequence mapping as well.
Alignment. Since BitAlign takes in a graph-based reference and a query read as its inputs, it can be used as a standalone sequence-to-graph aligner, without MinSeed. Similar to SeGraM, BitAlign can also be used for sequence-to-sequence alignment, as sequence-to-sequence alignment is a special and simpler variant of sequence-to-graph alignment. BitAlign is orthogonal to and can be coupled with any seeding (or filtering) tool/accelerator.
Seeding. Similarly, MinSeed can be used without BitAlign as a standalone seeding accelerator for both graph-based mapping and traditional linear mapping. MinSeed is orthogonal to and can be coupled with any alignment tool or accelerator.
10. Evaluation Methodology
Performance, Area and Power Analysis. We synthesize and place & route the MinSeed and BitAlign accelerator datapaths using the Synopsys Design Compiler (synopsysdc, ) with a typical low-power process (28nm, ). Our synthesis targets post-routing timing closure at clock frequency. Our power analysis for CPU software baselines includes the power consumption of the CPU socket and the dynamic DRAM power. In our power analysis for SeGraM, we include the dynamic HBM power (o2017fine, ; kim2021signal, ) and the power consumption of all logic and scratchpad/SRAM units. We then use an in-house cycle-accurate simulator and a spreadsheet-based analytical model parameterized with the synthesis and memory estimates to drive the performance analysis.
Baseline Comparison Points. First, we compare SeGraM with two state-of-the-art CPU-based sequence-to-graph mappers: GraphAligner (rautiainen2020graphaligner, ) and vg (garrison2018variation, ), running on an Intel® Xeon® E5-2630 v4 CPU (intel_cpu, ) with 20 physical cores/40 logical cores with hyper-threading (magro2002hyper, ; koufaty2003hyperthreading, ; tullsen1995simultaneous, ; tullsen1996exploiting, ), operating at , with DDR4 memory. We run both GraphAligner and vg with 40 threads. We measure the execution time and power consumption (using Intel’s PCM power utility (intelpcm, )) of each CPU software baseline. Second, we compare SeGraM with a state-of-the-art GPU-based sequence-to-graph-mapper, HGA (feng2021hga, ),555It is important to note that (1) HGA does not support traceback and reports only the alignment score; and (2) even though HGA is presented as a sequence-to-graph alignment tool by its authors, we use it as a sequence-to-graph mapping tool since HGA takes all of the nodes of a given graph into consideration instead of a small region of the graph. Thus, we compare HGA with SeGraM, which takes the complete graph as its input, instead of BitAlign, which takes a small region of the graph (i.e., subgraph) as its input. running on an NVIDIA® GeForce® RTX 2080 Ti (nvidia-rtx28080ti, ). We measure the execution time of the GPU kernel only, ignoring any CPU overheads. We measure the power consumed by the entire GPU using the NVIDIA-smi tool (nvidia-smi, ) and subtract the static power to find the dynamic power. Third, we compare BitAlign with a state-of-the-art software-based sequence-to-graph aligner, PaSGAL (jain2019accelerating, ), and also with three state-of-the-art hardware-based sequence-to-sequence aligners: Darwin (turakhia2018darwin, ), GenAx (fujiki2018genax, ), and GenASM (cali2020genasm, ). For these four baselines, we use the numbers reported by the papers.
Datasets. We evaluate SeGraM using the latest major release of the human genome assembly, GRCh38 (ncbi38genome, ), as the starting reference genome. To incorporate known genetic variations and thus form a genome graph, we use 7 VCF files for HG001-007 from the GIAB project (v3.3.2) (giabvcf, ). Across the 24 graphs generated (one for each chromosome; 1–22, X, Y), in total, we have nodes, edges, sequence characters, and variations.
For the read datasets, we generate four sets of long reads (i.e., PacBio and ONT datasets) using PBSIM2 (ono2021pbsim2, ) and three sets of short reads (i.e., Illumina datasets) using Mason (holtgrewe2010mason, ). For the PacBio and ONT datasets, we have reads of length , each simulated with 5% and 10% error rates. The Illumina datasets have reads of length , , and , each simulated with a 1% error rate. Each dataset has 10,000 reads.
For our comparison with HGA (feng2021hga, ), we follow the methodology presented in (feng2021hga, ), where we use the Breast Cancer Gene1 (BRCA1) graph (brca1_hgadataset, ) and three different read datasets simulated from the BRCA1 graph (using the simulate command from vg): R1 ( 278,528 reads), R2 ( 34,816 reads), and R3 ( 4,352 reads).
11. Results
11.1. Area and Power Analysis
Table 1 shows the area and power breakdown of the compute (i.e., logic) units, the scratchpads, and HBM stacks in SeGraM, and the total area overhead and power consumption of (1) a single SeGraM accelerator (attached to a single channel), and (2) 32 SeGraM accelerators (with each accelerator attached to its own channel, across four HBM stacks that each have eight channels). The SeGraM accelerators operate at .
For a single SeGraM accelerator, the area overhead is , and the power consumption is . We find that the main contributors for the area overhead and power consumption are (1) the hop queue registers, which constitute more than 60% of the area and power of BitAlign’s edit distance calculation logic; and (2) the bitvector scratchpads. For 32 SeGraM accelerators, the total area overhead is , with a power consumption of . When we add the HBM power to the power consumption of 32 SeGraM accelerators, the total power consumption becomes .
We conclude that SeGraM is very efficient in terms of both power consumption and area: a single SeGraM accelerator requires 0.02% of area and 0.5% of power consumption of an entire high-end Intel processor (intel_cascadelake, ).
![[Uncaptioned image]](/html/2205.05883/assets/figures/segram-area-power-cameraready.png)
11.2. Analysis of End-to-End SeGraM Execution
Comparison With CPU Software. We compare end-to-end execution of SeGraM with two state-of-the-art sequence-to-graph mapping tools, GraphAligner (rautiainen2020graphaligner, ) and vg (garrison2018variation, ). We evaluate 40-thread instances of GraphAligner and vg on the CPU. We evaluate both tools and SeGraM for both long reads and short reads.
Figure 15 shows the read mapping throughput (reads/sec) of GraphAligner, vg, and SeGraM when aligning long noisy PacBio and ONT reads against the graph-based representation of the human reference genome. We make two observations. First, on average, SeGraM provides a throughput improvement of and over GraphAligner and vg, respectively. We perform a power analysis (not shown), and find that GraphAligner and vg consume and , respectively; SeGraM reduces the power consumption for our long read datasets by and , respectively. Second, the throughput improvements do not change greatly with the query read error rate. When we examine a single SeGraM execution, it takes at a 5% error rate, whereas it takes at a 10% error rate. However, we also find that the total number of seeds that need to be aligned can vary based on the dataset: for the datasets we use in our analysis, MinSeed generates fewer seeds to align for the 10%-error-rate datasets compared to the 5%-error-rate datasets, thus, effectively canceling out the impact of increased execution time from 5%-error-rate datasets to 10%-error-rate datasets. As a result, we do not observe a large difference in overall throughput between the two datasets.
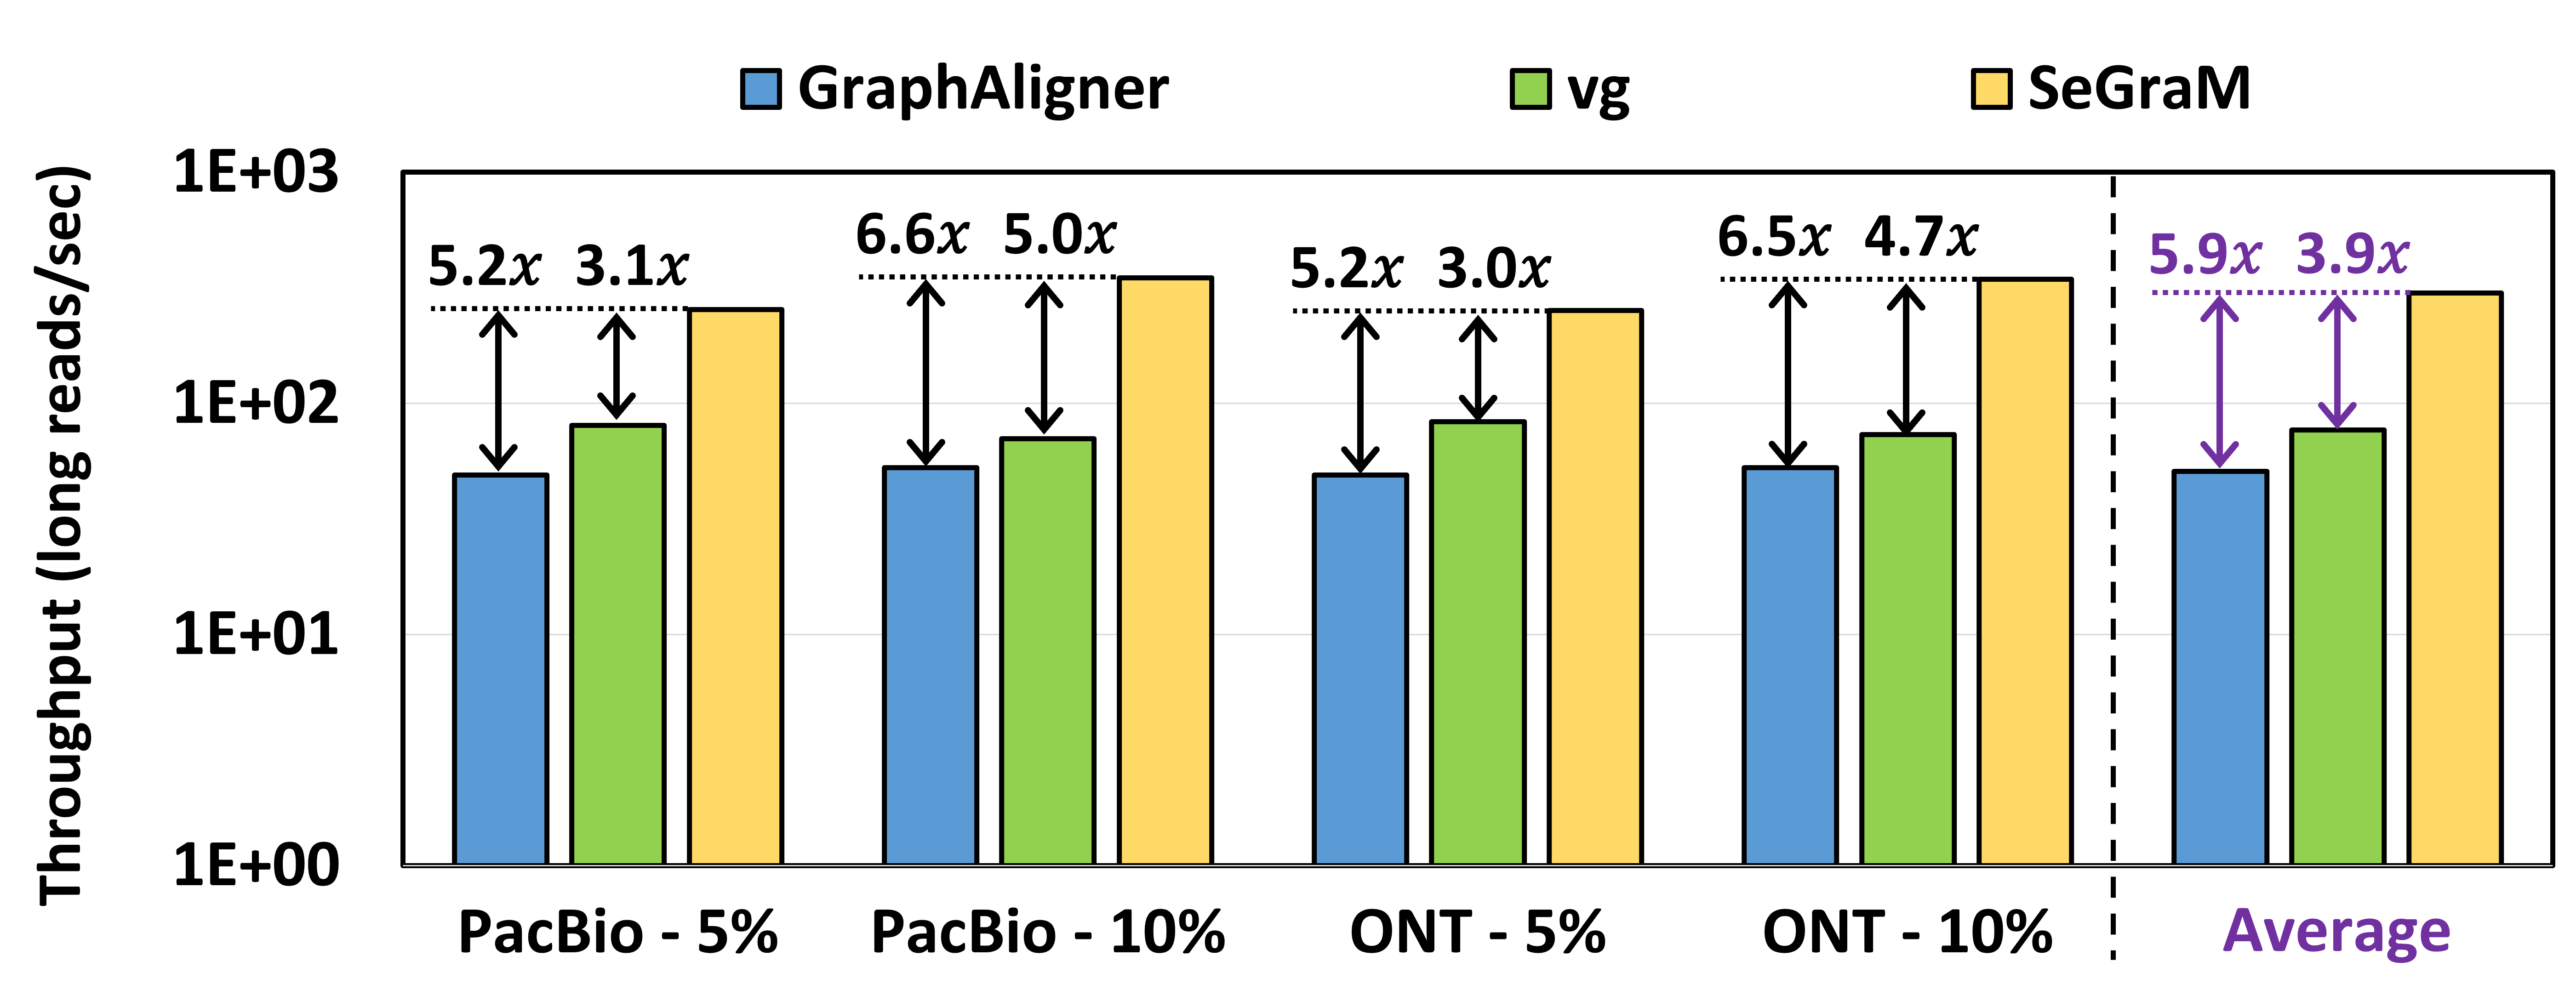
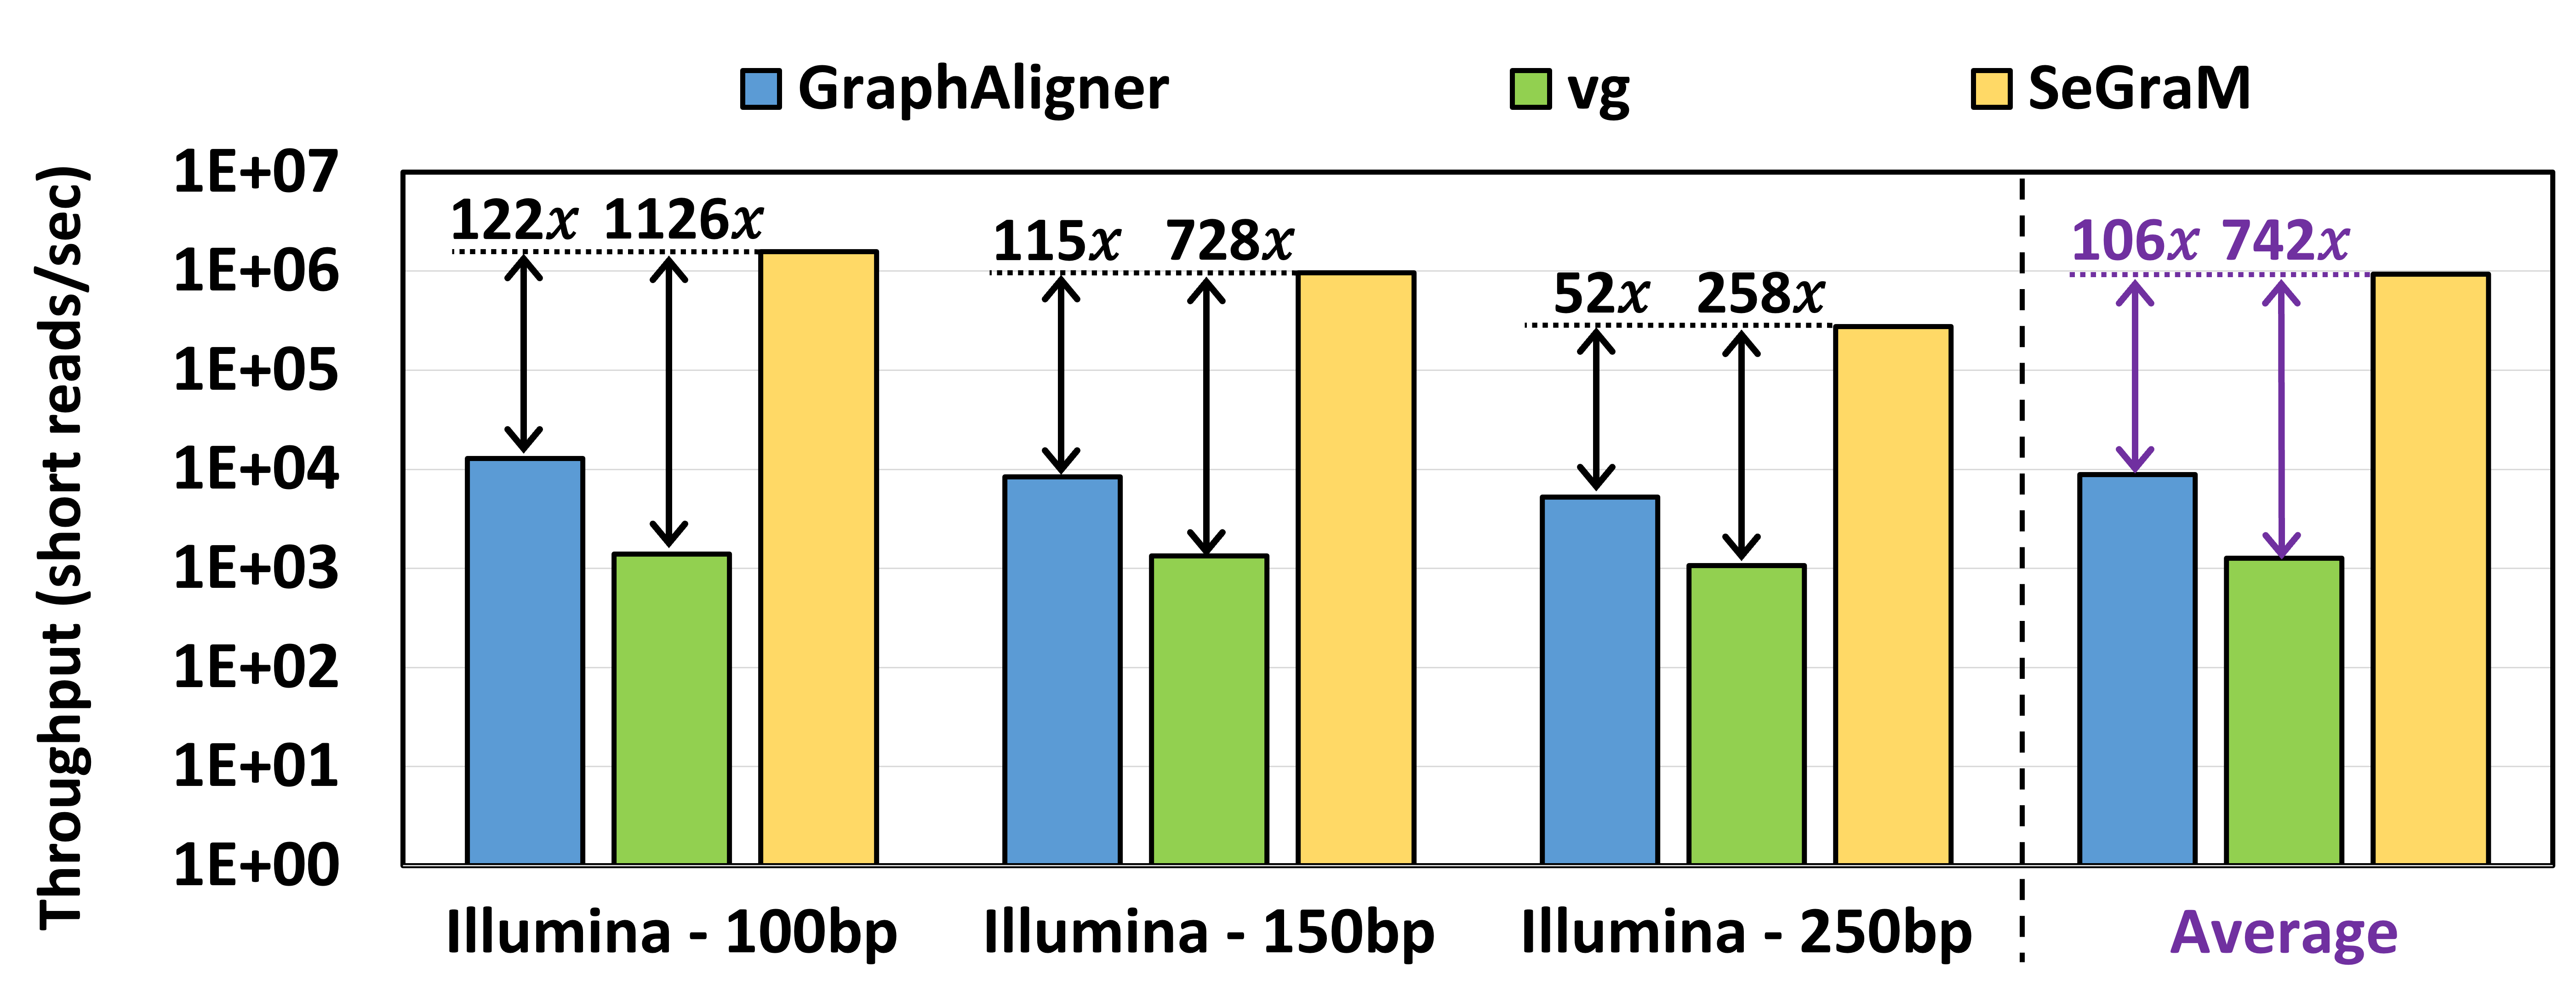
Figure 16 shows the read mapping throughput of GraphAligner, vg, and SeGraM when aligning short accurate Illumina reads against the graph-based representation of the human reference genome. We make two observations. First, on average, SeGraM provides a throughput improvement of and over GraphAligner and vg, respectively. We perform a power analysis (not shown), and find that GraphAligner and vg consume and , respectively; SeGraM reduces the power consumption for our short read datasets by and , respectively. Second, the throughput improvement of all three read mappers decreases as the read length increases. This is because as the read length increases, the number of seeds to align increases as well, resulting in an increase in execution time. However, SeGraM is affected by the increase in the number of seeds to align more than the baseline tools. Thus, SeGraM’s throughput improvement over the baseline tools decreases when the read length increases (but still stays above ).
Comparison With GPU Software. We also compare end-to-end execution of SeGraM with the state-of-the-art GPU-based sequence-to-graph mapping tool, HGA (feng2021hga, ). We find that SeGraM provides 523, 85, and 17 higher throughput for the BRCA1-R1, BRCA1-R2, and BRCA1-R3 datasets (Section 10) over HGA, while reducing power consumption by , , and 1.9, respectively.
Sources of Improvement. We identify four key reasons why SeGraM achieves such large performance improvements over GraphAligner, vg, and HGA.
First, we address the high cache miss rate bottleneck by carefully designing and sizing the on-chip scratchpads (using empirical data) and the hop queue registers (which allow us to fetch all bitvectors for a hop within a single cycle). As a result, SeGraM matches the rate of computation for the logic units with memory bandwidth and memory capacity. Doing so overcomes the high cache miss rates experienced by GraphAligner, and leads to a large reduction in the memory bandwidth that SeGraM needs to consume.
Second, we address the DRAM latency bottleneck by taking advantage of the natural channel subdivision exposed by HBM. As mentioned in Section 11.1, we dedicate one SeGraM accelerator per HBM channel. While SeGraM does not need to be implemented alongside an HBM-based memory subsystem, the multiple independent channels available in a single HBM stack allow us to increase accelerator-level parallelism without introducing memory interference among the accelerators. Unlike with CPU/GPU threads, which share all of the memory channels, our channel-based isolation eliminates any inter-accelerator interference-related latency in the memory system (muralidhara2011reducing, ).
Third, our co-design approach for both seeding and alignment yields multiple benefits: (1) We make use of efficient and hardware-friendly algorithms for seeding and for alignment. (2) We eliminate the data transfer bottleneck between the seeding and alignment steps of the genome sequence analysis pipeline, by placing their individual accelerators (MinSeed and BitAlign) adjacent to each other. (3) Our pipelining of the two accelerators within a SeGraM accelerator allows us to completely hide the latency of MinSeed.
Fourth, while the performance of the software tools scales sublinearly with the thread count, SeGraM scales linearly across three dimensions: (1) Within a single BitAlign accelerator, by incorporating processing elements (PEs), we parallelize multiple BitAlign iterations. This scales linearly up to the number of bits processed (128 in our case), as we can partition the iterations of the inner loop of the BitAlign algorithm (Lines 16–24 in Algorithm 1) across all of the PEs (i.e., we can incorporate as many as 64 PEs and still attain linear performance improvements). (2) Since a single read is composed of multiple seeds/minimizers, we use pipelined execution (with the help of our double buffering approach) to execute multiple seeds in parallel. (3) With the help of multiple HBM stacks that each contain the same content, we process multiple reads concurrently without introducing inter-accelerator memory interference. Seed-level parallelism and read-level parallelism can scale near-linearly as long as the memory bandwidth remains unsaturated, since (1) different seeds in a single read are independent of each other, (2) different reads are independent of each other, and (3) the memory bandwidth requirement of each read is low ().
Overall, we conclude that SeGraM provides substantial throughput improvements and power savings over state-of-the-art software tools, for both long and short reads.
11.3. Analysis of BitAlign
Sequence-to-Graph Alignment. As we explain in Section 9, BitAlign can be used as a standalone accelerator for sequence-to-graph alignment. We compare BitAlign with the state-of-the-art AVX-512 (intelavx512, ) based sequence-to-graph alignment tool, PaSGAL (jain2019accelerating, ). PaSGAL is composed of three main steps: (1) DP-fwd, where the input graph and query read are aligned using the DP-based graph alignment approach to compute the ending position of the alignment; (2) DP-rev, where the graph and query read are aligned in the reverse direction to compute the starting position of the alignment; and (3) Traceback, where, using the starting and ending positions of the alignment, the corresponding section of the score matrix is re-calculated and traceback is performed to find the optimal alignment.
Since the input of BitAlign is the subgraph and the query read, not the complete input graph, we compare BitAlign only with the third step of PaSGAL for a fair comparison. Figure 17 shows the execution time of PaSGAL (using numbers reported in the PaSGAL paper (jain2019accelerating, )) and SeGraM for both short read (LRC-L1, MHC1-M1) and long read (LRC-L2, MHC1-M2) datasets. We observe from the figure that SeGraM provides – speedup over the 48-thread AVX-512 supported execution of PaSGAL.
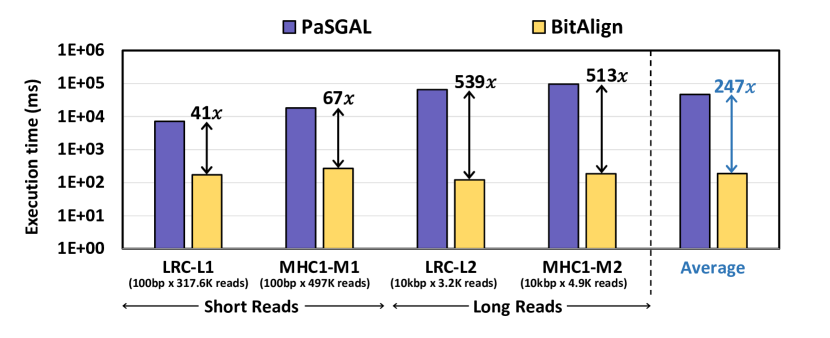
We observe from the figure that BitAlign’s speedup over PaSGAL is notably higher for long reads (i.e., the reads in the LRC-L2 and MHC1-M2 datasets). This is due to the divide-and-conquer approach that BitAlign follows. Instead of aligning the full subgraph and the query read, with the help of the windowing approach (Section 7), BitAlign decreases the complexity of sequence-to-graph alignment, which allows BitAlign to efficiently align both short and long reads.
Sequence-to-Sequence Alignment. As we discuss in Section 9, BitAlign can be used for sequence-to-sequence alignment, by treating a linear sequence as a special case of a graph. To show the benefits of BitAlign for this special use case, we compare BitAlign with the state-of-the-art hardware accelerators for sequence-to-sequence alignment: the GACT accelerator from Darwin (turakhia2018darwin, ), the SillaX accelerator from GenAx (fujiki2018genax, ), and GenASM (cali2020genasm, ). GACT is optimized for long reads, SillaX is optimized for short reads, and GenASM is optimized for both short and long reads. We use the optimized configuration of each accelerator, as reported in the corresponding papers.
Based on our analysis, we find that, on average, BitAlign provides (1) a throughput improvement of over GACT for long reads, while consuming more power and more area; (2) a throughput improvement of over SillaX for short reads; and (3) a throughput improvement of and over GenASM for long reads and short reads, respectively, while consuming more power and more area. Since both BitAlign and GenASM have fixed power consumption and area overhead independent of the dataset, their power and area comparisons are the same for any input dataset.
BitAlign vs. GenASM. As we explain in Section 7, BitAlign is a modified version of GenASM. Specifically, we decrease the memory footprint of GenASM by , which helps us to increase the number of bits processed by each PE from 64 (in GenASM) to 128 (in BitAlign) and better utilize the bitvector scratchpad capacity. With more bits per PE, the number of windows executed (Section 7) decreases, which enables BitAlign to have speedup compared to GenASM. For example, for a read of length, each window execution of GenASM takes 169 cycles, whereas it takes 272 cycles for BitAlign. However, the number of windows required to consume (the length of one read) is 250 for GenASM (as the window length is the same as the number of bits per PE, or 64), whereas this number is 125 for BitAlign, whose window length is equal to 128. Multiplying the number of windows by the cycle time per window, we find that BitAlign () performs better than GenASM () by 24% ().
11.4. Analysis of MinSeed
As we explain in Section 8.3, with the help of our pipelined design, MinSeed is not on the critical path of the overall SeGraM execution. However, since MinSeed finds subgraphs using candidate seed locations and sends them to BitAlign for the final alignment, it plays a critical role for the overall sensitivity (i.e., the metric that measures the accuracy of a seeding or filtering mechanism in keeping (not filtering out) the seeds that would lead to the optimal alignment) of our approach. MinSeed does not decrease the sensitivity of the overall sequence-to-graph mapping compared to the baseline software tools since both MinSeed and the baseline software tools implement the same optimization of discarding the seeds that have higher frequency than the threshold.
MinSeed vs. Filtering Approaches. MinSeed does not implement a filtering mechanism.666MinSeed is orthogonal to any filtering tool or accelerator (Xin2013, ; xin2015shifted, ; alser2017gatekeeper, ; alser2017magnet, ; alser2019shouji, ; alser2020sneakysnake, ; singh2021fpga, ; kim2018grim, ; mansouri2022genstore, ; nag2019gencache, ; subramaniyan2020accelerating, ; huangfu2020nest, ; huangfu2019medal, ; laguna2020seed, ; cong2018smem++, ). Employing a filtering approach as part of our design would increase SeGraM’s performance and efficiency, a study we leave to future work.. Even though this leads to a higher number of subgraphs that must be processed by the (expensive) alignment step compared to approaches that perform filtering, BitAlign’s high efficiency greatly alleviates the alignment bottleneck that exists in the software tools, as we show in Section 11.2. For example, for a long read dataset, while GraphAligner decreases the number of seeds extended from to with its filtering/chaining approaches, MinSeed only decreases the number of seeds to , yet SeGraM (MinSeed and BitAlign together) still outperforms GraphAligner. Similarly, for a short read dataset, even though GraphAligner decreases the number of seeds extended from to , SeGraM significantly outperforms GraphAligner even though MinSeed only decreases the number of seeds to .
12. Related Work
To our knowledge, this is the first work to propose (1) a hardware acceleration framework for sequence-to-graph mapping (SeGraM), (2) a hardware accelerator for minimizer-based seeding (MinSeed), and (3) a hardware accelerator for sequence-to-graph alignment (BitAlign). No prior work studies hardware design for graph-based genome sequence analysis.
Software Tools for Sequence-to-Graph Mapping. There are several tools available that specialize for sequence-to-graph mapping or alignment. Examples of sequence-to-graph mapping tools include GraphAligner (rautiainen2020graphaligner, ), vg (garrison2018variation, ), HGA (feng2021hga, ), HISAT2 (kim2019graph, ), and minigraph (li2020design, ). Other tools, such as PaSGAL (jain2019accelerating, ), abPOA (gao2021abpoa, ), AStarix (ivanov2020astarix, ; ivanov2022fast, ), and Vargas (darby2020vargas, ) perform sequence-to-graph alignment only, without an indexing or a seeding step. All of these approaches are software-only, and we show quantitatively in Section 11 that our algorithm/hardware co-design greatly outperforms four state-of-the-art tools: GraphAligner, vg, HGA, and PaSGAL.
Hardware Accelerators for Genome Sequence Analysis. Existing hardware accelerators for genome sequence analysis focus on accelerating only the traditional sequence-to-sequence mapping pipeline, and cannot support genome graphs as their inputs. For example, GenStore (mansouri2022genstore, ), ERT (subramaniyan2020accelerating, ), GenCache (nag2019gencache, ), NEST (huangfu2020nest, ), MEDAL (huangfu2019medal, ), SaVI (laguna2020seed, ), SMEM++ (cong2018smem++, ), Shifted Hamming Distance (xin2015shifted, ), GateKeeper (alser2017gatekeeper, ), MAGNET (alser2017magnet, ), Shouji (alser2019shouji, ), and SneakySnake (alser2020sneakysnake, ; singh2021fpga, ) accelerate the seeding and/or filtering steps of sequence-to-sequence mapping.
Darwin (turakhia2018darwin, ), GenAx (fujiki2018genax, ), GenASM (cali2020genasm, ), SeedEx (fujiki2020seedex, ), WFA-FPGA (haghi2021fpga, ), GenieHD (kim2020geniehd, ), GeNVoM (khatamifard2021genvom, ), FPGASW (fei2018fpgasw, ), SWIFOLD (rucci2018swifold, ), and ASAP (banerjee2018asap, ) accelerate read alignment for only a linear reference genome (sequence-to-sequence alignment). These accelerators have no way to track the hops that exist in a graph-based reference, and cannot be easily modified to support hops. SeGraM builds upon the hardware components of GenASM, with enhancements (i.e., BitAlign) and new components (i.e., MinSeed) that efficiently support both (1) sequence-to-graph mapping/alignment and (2) sequence-to-sequence mapping/alignment (by treating the linear reference genome as a genome graph where each node has only one outgoing edge).
A number of works propose processing-in-memory (PIM) (mutlu2020modern, ; mutlu2019processing, ; ghose2019processing, ) based accelerators for genome sequence analysis, such as GRIM-Filter (kim2018grim, ), RAPID (gupta2019rapid, ), PIM-Aligner (angizi2020pimaligner, ), RADAR (huangfu2018radar, ), BWA-CRAM (chowdhury2020dna, ), FindeR (zokaee2019finder, ), AligneR (zokaee2018aligner, ), and FiltPIM (khalifa2020filtpim, ). Similar to non-PIM sequence-to-sequence alignment accelerators, these PIM accelerators are designed for a linear reference genome only, and cannot support genome graphs.
Aside from the aforementioned read mapping and read alignment accelerators, there are other genomics accelerators that target different genomics problems, such as nanopore basecalling (dunn2021squigglefilter, ; lou2020helix, ), genome assembly (angizi2020pim, ), exact pattern matching (jiang2021exma, ; wu2021sieve, ), and the GATK-based variant calling pipeline (ham2020genesis, ; lo2020algorithm, ; wu2019fpga, ). Our work is orthogonal to these accelerators.
13. Conclusion
We introduce SeGraM, the first universal genomic mapping acceleration framework that can support both sequence-to-graph and sequence-to-sequence mapping, for both short and long reads. SeGraM consists of co-designed algorithms and accelerators for memory-efficient minimizer-based seeding (MinSeed) and highly-parallel bitvector-based sequence-to-graph alignment (BitAlign), with inherent and efficient processing support for genome graphs. We show that (1) SeGraM provides greatly higher throughput and lower power consumption on both short and long reads compared to state-of-the-art software tools for sequence-to-graph mapping, and (2) BitAlign significantly outperforms a state-of-the-art sequence-to-graph alignment tool and three state-of-the-art hardware solutions that are specifically designed for sequence-to-sequence alignment. We conclude that SeGraM is a promising framework for accelerating both graph-based and traditional linear-sequence-based genome sequence analysis. We hope that our work inspires future research and design efforts at accelerating graph-based genome analysis via efficient algorithm/hardware co-design.
Acknowledgements.
We thank the anonymous reviewers of HPCA 2022 and ISCA 2022 for their feedback. We thank the SAFARI Research Group members for valuable feedback and the stimulating intellectual environment they provide. We acknowledge the generous gifts of our industrial partners, especially Google, Huawei, Intel, Microsoft, VMware, Xilinx. This research was partially supported by the Semiconductor Research Corporation.References
- (1) C. Alkan, J. M. Kidd, T. Marques-Bonet, G. Aksay, F. Antonacci, F. Hormozdiari, J. O. Kitzman, C. Baker, M. Malig, O. Mutlu et al., “Personalized Copy Number and Segmental Duplication Maps Using Next-Generation Sequencing,” Nature Genetics, 2009.
- (2) M. Flores, G. Glusman, K. Brogaard, N. D. Price, and L. Hood, “P4 Medicine: How Systems Medicine Will Transform the Healthcare Sector and Society,” Personalized Medicine, 2013.
- (3) G. S. Ginsburg and H. F. Willard, “Genomic and Personalized Medicine: Foundations and Applications,” Translational Research, 2009.
- (4) L. Chin, J. N. Andersen, and P. A. Futreal, “Cancer Genomics: From Discovery Science to Personalized Medicine,” Nature Medicine, 2011.
- (5) E. A. Ashley, “Towards Precision Medicine,” Nature Reviews. Genetics, 2016.
- (6) I. S. Chan and G. S. Ginsburg, “Personalized Medicine: Progress and Promise,” Annual Review of Genomics and Human Genetics, 2011.
- (7) K. Offit, “Personalized Medicine: New Genomics, Old Lessons,” Human Genetics, 2011.
- (8) F. Wang, S. Huang, R. Gao, Y. Zhou, C. Lai, Z. Li, W. Xian, X. Qian, Z. Li, Y. Huang et al., “Initial Whole-Genome Sequencing and Analysis of the Host Genetic Contribution to COVID-19 Severity and Susceptibility,” Cell Discovery, 2020.
- (9) V. Nikolayevskyy, K. Kranzer, S. Niemann, and F. Drobniewski, “Whole Genome Sequencing of Mycobacterium Tuberculosis for Detection of Recent Transmission and Tracing Outbreaks: A Systematic Review,” Tuberculosis, 2016.
- (10) S. Qiu, P. Li, H. Liu, Y. Wang, N. Liu, C. Li, S. Li, M. Li, Z. Jiang, H. Sun et al., “Whole-Genome Sequencing for Tracing the Transmission Link Between Two ARD Outbreaks Caused by a Novel HAdV Serotype 7 Variant, China,” Scientific Reports, 2015.
- (11) C. A. Gilchrist, S. D. Turner, M. F. Riley, W. A. Petri, and E. L. Hewlett, “Whole-Genome Sequencing in Outbreak Analysis,” Clinical Microbiology Reviews, 2015.
- (12) J. Quick, N. J. Loman, S. Duraffour, J. T. Simpson, E. Severi, L. Cowley, J. A. Bore, R. Koundouno, G. Dudas, A. Mikhail et al., “Real-Time, Portable Genome Sequencing for Ebola Surveillance,” Nature, 2016.
- (13) C. J. Houldcroft, M. A. Beale, and J. Breuer, “Clinical and Biological Insights from Viral Genome Sequencing,” Nature Reviews Microbiology, 2017.
- (14) Y.-R. Guo, Q.-D. Cao, Z.-S. Hong, Y.-Y. Tan, S.-D. Chen, H.-J. Jin, K.-S. Tan, D.-Y. Wang, and Y. Yan, “The Origin, Transmission and Clinical Therapies on Coronavirus Disease 2019 (COVID-19) Outbreak – An Update on the Status,” Military Medical Research, 2020.
- (15) H. Ellegren, “Genome Sequencing and Population Genomics in Non-Model Organisms,” Trends in Ecology & Evolution, 2014.
- (16) J. Prado-Martinez, P. H. Sudmant, J. M. Kidd, H. Li, J. L. Kelley, B. Lorente-Galdos, K. R. Veeramah, A. E. Woerner, T. D. O’Connor, G. Santpere et al., “Great Ape Genetic Diversity and Population History,” Nature, 2013.
- (17) A. Prohaska, F. Racimo, A. J. Schork, M. Sikora, A. J. Stern, M. Ilardo, M. E. Allentoft, L. Folkersen, A. Buil, J. V. Moreno-Mayar et al., “Human Disease Variation in the Light of Population Genomics,” Cell, 2019.
- (18) M. E. Hudson, “Sequencing Breakthroughs for Genomic Ecology and Evolutionary Biology,” Molecular Ecology Resources, 2008.
- (19) Y. Yang, B. Xie, and J. Yan, “Application of Next-Generation Sequencing Technology in Forensic Science,” Genomics, Proteomics & Bioinformatics, 2014.
- (20) C. Børsting and N. Morling, “Next Generation Sequencing and Its Applications in Forensic Genetics,” Forensic Science International: Genetics, 2015.
- (21) M. J. Alvarez-Cubero, M. Saiz, B. Martínez-García, S. M. Sayalero, C. Entrala, J. A. Lorente, and L. J. Martinez-Gonzalez, “Next Generation Sequencing: An Application in Forensic Sciences?” Annals of Human Biology, 2017.
- (22) E. C. Berglund, A. Kiialainen, and A.-C. Syvänen, “Next-Generation Sequencing Technologies and Applications for Human Genetic History and Forensics,” Investigative Genetics, 2011.
- (23) T. Hu, N. Chitnis, D. Monos, and A. Dinh, “Next-Generation Sequencing Technologies: An Overview,” Human Immunology, 2021.
- (24) Illumina, Inc., “iSeq 100 System.” Available: https://www.illumina.com/systems/sequencing-platforms/iseq.html
- (25) Illumina, Inc., “MiniSeq System.” Available: https://www.illumina.com/systems/sequencing-platforms/miniseq.html
- (26) Illumina, Inc., “MiSeq System.” Available: https://www.illumina.com/systems/sequencing-platforms/miseq.html
- (27) Illumina, Inc., “NextSeq 1000 & NextSeq 2000 Systems.” Available: https://www.illumina.com/systems/sequencing-platforms/nextseq-1000-2000.html
- (28) Illumina, Inc., “NovaSeq 6000 System.” Available: https://www.illumina.com/systems/sequencing-platforms/novaseq.html
- (29) D. Senol Cali, J. S. Kim, S. Ghose, C. Alkan, and O. Mutlu, “Nanopore Sequencing Technology and Tools for Genome Assembly: Computational Analysis of the Current State, Bottlenecks and Future Directions,” Briefings in Bioinformatics, 2018.
- (30) S. L. Amarasinghe, S. Su, X. Dong, L. Zappia, M. E. Ritchie, and Q. Gouil, “Opportunities and Challenges in Long-Read Sequencing Data Analysis,” Genome Biology, 2020.
- (31) M. Jain, S. Koren, K. H. Miga, J. Quick, A. C. Rand, T. A. Sasani, J. R. Tyson, A. D. Beggs, A. T. Dilthey, I. T. Fiddes et al., “Nanopore Sequencing and Assembly of a Human Genome with Ultra-Long Reads,” Nature Biotechnology, 2018.
- (32) Oxford Nanopore Technologies, “MinION.” Available: https://nanoporetech.com/products/minion
- (33) Oxford Nanopore Technologies, “GridION.” Available: https://nanoporetech.com/products/gridion
- (34) Oxford Nanopore Technologies, “PromethION.” Available: https://nanoporetech.com/products/promethion
- (35) Pacific Biosciences of California, Inc., “Sequel Systems.” Available: https://www.pacb.com/technology/hifi-sequencing/sequel-system/
- (36) E. Garrison, J. Sirén, A. M. Novak, G. Hickey, J. M. Eizenga, E. T. Dawson, W. Jones, S. Garg, C. Markello, M. F. Lin et al., “Variation Graph Toolkit Improves Read Mapping by Representing Genetic Variation in the Reference,” Nature Biotechnology, 2018.
- (37) R. Martiniano, E. Garrison, E. R. Jones, A. Manica, and R. Durbin, “Removing Reference Bias and Improving Indel Calling in Ancient DNA Data Analysis by Mapping to a Sequence Variation Graph,” Genome Biology, 2020.
- (38) N.-C. Chen, B. Solomon, T. Mun, S. Iyer, and B. Langmead, “Reference Flow: Reducing Reference Bias Using Multiple Population Genomes,” Genome Biology, 2021.
- (39) C. Jain, N. Tavakoli, and S. Aluru, “A Variant Selection Framework for Genome Graphs,” Bioinformatics, 2021.
- (40) K. Vaddadi, R. Srinivasan, and N. Sivadasan, “Read Mapping on Genome Variation Graphs,” in WABI, 2019.
- (41) S. Ballouz, A. Dobin, and J. A. Gillis, “Is It Time to Change the Reference Genome?” Genome Biology, 2019.
- (42) B. Paten, A. M. Novak, J. M. Eizenga, and E. Garrison, “Genome Graphs and the Evolution of Genome Inference,” Genome Research, 2017.
- (43) X. Yang, W.-P. Lee, K. Ye, and C. Lee, “One Reference Genome is not Enough,” Genome Biology, 2019.
- (44) R. M. Sherman, J. Forman, V. Antonescu, D. Puiu, M. Daya, N. Rafaels, M. P. Boorgula, S. Chavan, C. Vergara, V. E. Ortega et al., “Assembly of a Pan-Genome from Deep Sequencing of 910 Humans of African Descent,” Nature Genetics, 2019.
- (45) J. L. Weirather, M. de Cesare, Y. Wang, P. Piazza, V. Sebastiano, X.-J. Wang, D. Buck, and K. F. Au, “Comprehensive Comparison of Pacific Biosciences and Oxford Nanopore Technologies and Their Applications to Transcriptome Analysis,” F1000Research, 2017.
- (46) S. Ardui, A. Ameur, J. R. Vermeesch, and M. S. Hestand, “Single Molecule Real-time (SMRT) Sequencing Comes of Age: Applications and Utilities for Medical Diagnostics,” Nucleic Acids Research, 2018.
- (47) E. L. van Dijk, Y. Jaszczyszyn, D. Naquin, and C. Thermes, “The Third Revolution in Sequencing Technology,” Trends in Genetics, 2018.
- (48) Computational Pan-Genomics Consortium, “Computational Pan-Genomics: Status, Promises and Challenges,” Briefings in Bioinformatics, 2018.
- (49) Computomics GmbH, “Computomics is Co-Organizing the Pangenome Browser Group at COVID-19 Biohackathon: Towards Browsing the Global Genetic Variation of SARS-CoV-2,” 2020. Available: https://computomics.com/news-reader/covid19hackathon.html
- (50) J. Ambler, S. Mulaudzi, and N. Mulder, “GenGraph: A Python Module for the Simple Generation and Manipulation of Genome Graphs,” BMC Bioinformatics, 2019.
- (51) P. A. Pevzner, H. Tang, and M. S. Waterman, “An Eulerian Path Approach to DNA Fragment Assembly,” PNAS, 2001.
- (52) A. Ameur, “Goodbye Reference, Hello Genome Graphs,” Nature Biotechnology, 2019.
- (53) A. M. Kaye and W. W. Wasserman, “The Genome Atlas: Navigating a New Era of Reference Genomes,” Trends in Genetics, 2021.
- (54) G. Rakocevic, V. Semenyuk, W.-P. Lee, J. Spencer, J. Browning, I. J. Johnson, V. Arsenijevic, J. Nadj, K. Ghose, M. C. Suciu et al., “Fast and Accurate Genomic Analyses Using Genome Graphs,” Nature Genetics, 2019.
- (55) J. M. Eizenga, A. M. Novak, J. A. Sibbesen, S. Heumos, A. Ghaffaari, G. Hickey, X. Chang, J. D. Seaman, R. Rounthwaite, J. Ebler et al., “Pangenome Graphs,” Annual Review of Genomics and Human Genetics, 2020.
- (56) N. D. Olson, J. Wagner, J. McDaniel, S. H. Stephens, S. T. Westreich, A. G. Prasanna, E. Johanson, E. Boja, E. J. Maier, O. Serang et al., “precisionFDA Truth Challenge V2: Calling Variants from Short- and Long-Reads in Difficult-to-Map Regions,” bioRxiv 2020.11.13.380741, 2021.
- (57) P. E. Compeau, P. A. Pevzner, and G. Tesler, “How to Apply de Bruijn Graphs to Genome Assembly,” Nature Biotechnology, 2011.
- (58) D. R. Zerbino and E. Birney, “Velvet: Algorithms for De Novo Short Read Assembly Using de Bruijn Graphs,” Genome Research, 2008.
- (59) J. T. Simpson, K. Wong, S. D. Jackman, J. E. Schein, S. J. Jones, and I. Birol, “ABySS: a Parallel Assembler for Short Read Sequence Data,” Genome Research, 2009.
- (60) L. Salmela and E. Rivals, “LoRDEC: Accurate and Efficient Long Read Error Correction,” Bioinformatics, 2014.
- (61) M. Rautiainen and T. Marschall, “GraphAligner: Rapid and Versatile Sequence-to-Graph Alignment,” Genome Biology, 2020.
- (62) H. Zhang, C. Jain, and S. Aluru, “A Comprehensive Evaluation of Long Read Error Correction Methods,” BMC Genomics, 2020.
- (63) B. Paten, D. Earl, N. Nguyen, M. Diekhans, D. Zerbino, and D. Haussler, “Cactus: Algorithms for Genome Multiple Sequence Alignment,” Genome Research, 2011.
- (64) C. Lee, C. Grasso, and M. F. Sharlow, “Multiple Sequence Alignment Using Partial Order Graphs,” Bioinformatics, 2002.
- (65) H. Li, X. Feng, and C. Chu, “The Design and Construction of Reference Pangenome Graphs with minigraph,” Genome Biology, 2020.
- (66) D. Kim, J. M. Paggi, C. Park, C. Bennett, and S. L. Salzberg, “Graph-Based Genome Alignment and Genotyping with HISAT2 and HISAT-genotype,” Nature Biotechnology, 2019.
- (67) M. Alser, Z. Bingöl, D. Senol Cali, J. Kim, S. Ghose, C. Alkan, and O. Mutlu, “Accelerating Genome Analysis: A Primer on an Ongoing Journey,” IEEE Micro, 2020.
- (68) Y. Turakhia, G. Bejerano, and W. J. Dally, “Darwin: A Genomics Co-Processor Provides up to 15,000x Acceleration on Long Read Assembly,” in ASPLOS, 2018.
- (69) D. Senol Cali, G. S. Kalsi, Z. Bingöl, C. Firtina, L. Subramanian, J. S. Kim, R. Ausavarungnirun, M. Alser, J. Gomez-Luna, A. Boroumand et al., “GenASM: A High-Performance, Low-Power Approximate String Matching Acceleration Framework for Genome Sequence Analysis,” in MICRO, 2020.
- (70) D. Fujiki, A. Subramaniyan, T. Zhang, Y. Zeng, R. Das, D. Blaauw, and S. Narayanasamy, “GenAx: A Genome Sequencing Accelerator,” in ISCA, 2018.
- (71) M. Alser, J. Rotman, K. Taraszka, H. Shi, P. I. Baykal, H. T. Yang, V. Xue, S. Knyazev, B. D. Singer, B. Balliu et al., “Technology Dictates Algorithms: Recent Developments in Read Alignment,” Genome Biology, 2021.
- (72) M. Alser, H. Hassan, H. Xin, O. Ergin, O. Mutlu, and C. Alkan, “GateKeeper: A New Hardware Architecture for Accelerating Pre-Alignment in DNA Short Read Mapping,” Bioinformatics, 2017.
- (73) M. Alser, T. Shahroodi, J. Gomez-Luna, C. Alkan, and O. Mutlu, “SneakySnake: A Fast and Accurate Universal Genome Pre-Alignment Filter for CPUs, GPUs, and FPGAs,” Bioinformatics, 2020.
- (74) J. S. Kim, C. Firtina, D. Senol Cali, M. Alser, N. Hajinazar, C. Alkan, and O. Mutlu, “AirLift: A Fast and Comprehensive Technique for Translating Alignments between Reference Genomes,” arXiv preprint arXiv:1912.08735, 2019.
- (75) J. S. Kim, D. Senol Cali, H. Xin, D. Lee, S. Ghose, M. Alser, H. Hassan, O. Ergin, C. Alkan, and O. Mutlu, “GRIM-Filter: Fast Seed Location Filtering in DNA Read Mapping Using Processing-in-Memory Technologies,” BMC Genomics, 2018.
- (76) G. Singh, M. Alser, D. Senol Cali, D. Diamantopoulos, J. Gómez-Luna, H. Corporaal, and O. Mutlu, “FPGA-Based Near-Memory Acceleration of Modern Data-Intensive Applications,” IEEE Micro, 2021.
- (77) M. Rautiainen, V. Mäkinen, and T. Marschall, “Bit-Parallel Sequence-to-Graph Alignment,” Bioinformatics, 2019.
- (78) P. Ivanov, B. Bichsel, H. Mustafa, A. Kahles, G. Rätsch, and M. Vechev, “AStarix: Fast and Optimal Sequence-to-Graph Alignment,” in RECOMB, 2020.
- (79) C. Jain, H. Zhang, Y. Gao, and S. Aluru, “On the Complexity of Sequence-to-Graph Alignment,” Journal of Computational Biology, 2020.
- (80) V. N. S. Kavya, K. Tayal, R. Srinivasan, and N. Sivadasan, “Sequence Alignment on Directed Graphs,” Journal of Computational Biology, 2019.
- (81) C. A. Darby, R. Gaddipati, M. C. Schatz, and B. Langmead, “Vargas: Heuristic-Free Alignment for Assessing Linear and Graph Read Aligners,” Bioinformatics, 2020.
- (82) X. Chang, J. Eizenga, A. M. Novak, J. Sirén, and B. Paten, “Distance Indexing and Seed Clustering in Sequence Graphs,” Bioinformatics, 2020.
- (83) P. Ivanov, B. Bichsel, and M. Vechev, “Fast and Optimal Sequence-to-Graph Alignment Guided by Seeds,” in RECOMB, 2022.
- (84) Illumina, Inc. Available: https://www.illumina.com
- (85) Pacific Biosciences of California, Inc. Available: https://www.pacb.com
- (86) Oxford Nanopore Technologies. Available: https://nanoporetech.com
- (87) JEDEC Solid State Technology Association, “JESD235C: High Bandwidth Memory (HBM) DRAM,” January 2020.
- (88) Z. Feng and Q. Luo, “Accelerating Sequence-to-Graph Alignment on Heterogeneous Processors,” in ICPP, 2021.
- (89) C. Jain, S. Misra, H. Zhang, A. Dilthey, and S. Aluru, “Accelerating Sequence Alignment to Graphs,” in IPDPS, 2019.
- (90) SAFARI Research Group, “SeGraM – GitHub Repository.” Available: https://github.com/CMU-SAFARI/SeGraM
- (91) H. Li, “Minimap2: Pairwise Alignment for Nucleotide Sequences,” Bioinformatics, 2018.
- (92) H. Li, “Aligning Sequence Reads, Clone Sequences and Assembly Contigs with BWA-MEM,” arXiv preprint arXiv:1303.3997, 2013.
- (93) H. Xin, D. Lee, F. Hormozdiari, S. Yedkar, O. Mutlu, and C. Alkan, “Accelerating Read Mapping with FastHASH,” BMC Genomics, 2013.
- (94) H. Xin, J. Greth, J. Emmons, G. Pekhimenko, C. Kingsford, C. Alkan, and O. Mutlu, “Shifted Hamming Distance: A Fast and Accurate SIMD-Friendly Filter to Accelerate Alignment Verification in Read Mapping,” Bioinformatics, 2015.
- (95) B. Langmead and S. L. Salzberg, “Fast Gapped-Read Alignment with Bowtie 2,” Nature Methods, 2012.
- (96) R. Li, C. Yu, Y. Li, T.-W. Lam, S.-M. Yiu, K. Kristiansen, and J. Wang, “SOAP2: An Improved Ultrafast Tool for Short Read Alignment,” Bioinformatics, 2009.
- (97) O. Gotoh, “An Improved Algorithm for Matching Biological Sequences,” Journal of Molecular Biology, 1982.
- (98) W. Miller and E. W. Myers, “Sequence Comparison with Concave Weighting Functions,” Bulletin of Mathematical Biology, 1988.
- (99) M. S. Waterman, “Efficient Sequence Alignment Algorithms,” Journal of Theoretical Biology, 1984.
- (100) V. I. Levenshtein, “Binary Codes Capable of Correcting Deletions, Insertions, and Reversals,” in Soviet Physics Doklady, 1966.
- (101) G. Navarro, “A Guided Tour to Approximate String Matching,” ACM Computing Surveys (CSUR), 2001.
- (102) M. S. Waterman, T. F. Smith, and W. A. Beyer, “Some Biological Sequence Metrics,” Advances in Mathematics, 1976.
- (103) G. Myers, “A Fast Bit-Vector Algorithm for Approximate String Matching Based on Dynamic Programming,” Journal of the ACM, 1999.
- (104) E. Ukkonen, “Algorithms for Approximate String Matching,” Information and Control, 1985.
- (105) T. F. Smith and M. S. Waterman, “Identification of Common Molecular Subsequences,” Journal of Molecular Biology, 1981.
- (106) S. B. Needleman and C. D. Wunsch, “A General Method Applicable to the Search for Similarities in the Amino Acid Sequence of Two Proteins,” Journal of Molecular Biology, 1970.
- (107) S. Wu and U. Manber, “Fast Text Searching Allowing Errors,” CACM, 1992.
- (108) R. Baeza-Yates and G. H. Gonnet, “A New Approach to Text Searching,” CACM, 1992.
- (109) A.-C. Syvänen, “Accessing Genetic Variation: Genotyping Single Nucleotide Polymorphisms,” Nature Reviews Genetics, 2001.
- (110) M. Cargill, D. Altshuler, J. Ireland, P. Sklar, K. Ardlie, N. Patil, C. R. Lane, E. P. Lim, N. Kalyanaraman, J. Nemesh et al., “Characterization of Single-Nucleotide Polymorphisms in Coding Regions of Human Genes,” Nature Genetics, 1999.
- (111) L. Feuk, A. R. Carson, and S. W. Scherer, “Structural Variation in the Human Genome,” Nature Reviews Genetics, 2006.
- (112) P. H. Sudmant, T. Rausch, E. J. Gardner, R. E. Handsaker, A. Abyzov, J. Huddleston, Y. Zhang, K. Ye, G. Jun, M. Hsi-Yang Fritz et al., “An Integrated Map of Structural Variation in 2,504 Human Genomes,” Nature, 2015.
- (113) C. Alkan, B. P. Coe, and E. E. Eichler, “Genome Structural Variation Discovery and Genotyping,” Nature Reviews Genetics, 2011.
- (114) S. S. Ho, A. E. Urban, and R. E. Mills, “Structural Variation in the Sequencing Era,” Nature Reviews Genetics, 2020.
- (115) 1000 Genomes Project Consortium, “A Global Reference for Human Genetic Variation,” Nature, 2015.
- (116) J. F. Degner, J. C. Marioni, A. A. Pai, J. K. Pickrell, E. Nkadori, Y. Gilad, and J. K. Pritchard, “Effect of Read-Mapping Biases on Detecting Allele-Specific Expression from RNA-Sequencing Data,” Bioinformatics, 2009.
- (117) D. Y. Brandt, V. R. Aguiar, B. D. Bitarello, K. Nunes, J. Goudet, and D. Meyer, “Mapping Bias Overestimates Reference Allele Frequencies at the HLA Genes in the 1000 Genomes Project Phase I Data,” G3: Genes, Genomes, Genetics, 2015.
- (118) T. Günther and C. Nettelblad, “The Presence and Impact of Reference Bias on Population Genomic Studies of Prehistoric Human Populations,” PLoS Genetics, 2019.
- (119) V. A. Schneider, T. Graves-Lindsay, K. Howe, N. Bouk, H.-C. Chen, P. A. Kitts, T. D. Murphy, K. D. Pruitt, F. Thibaud-Nissen, D. Albracht et al., “Evaluation of GRCh38 and De Novo Haploid Genome Assemblies Demonstrates the Enduring Quality of the Reference Assembly,” Genome Research, 2017.
- (120) G. Vernikos, D. Medini, D. R. Riley, and H. Tettelin, “Ten Years of Pan-Genome Analyses,” Current Opinion in Microbiology, 2015.
- (121) R. M. Sherman and S. L. Salzberg, “Pan-Genomics in the Human Genome Era,” Nature Reviews Genetics, 2020.
- (122) Y. Liu and Z. Tian, “From One Linear Genome to a Graph-Based Pan-Genome: A New Era for Genomics,” Science China Life Sciences, 2020.
- (123) A. A. Golicz, P. E. Bayer, P. L. Bhalla, J. Batley, and D. Edwards, “Pangenomics Comes of Age: From Bacteria to Plant and Animal Applications,” Trends in Genetics, 2020.
- (124) S. Nurk, S. Koren, A. Rhie, M. Rautiainen, A. V. Bzikadze, A. Mikheenko, M. R. Vollger, N. Altemose, L. Uralsky, A. Gershman et al., “The Complete Sequence of a Human Genome,” Science, 2022.
- (125) A. Dilthey, C. Cox, Z. Iqbal, M. R. Nelson, and G. McVean, “Improved Genome Inference in the MHC Using a Population Reference Graph,” Nature Genetics, 2015.
- (126) H. Li, “Minimap and Miniasm: Fast Mapping and De Novo Assembly for Noisy Long Sequences,” Bioinformatics, 2016.
- (127) S. Kalikar, C. Jain, M. Vasimuddin, and S. Misra, “Accelerating minimap2 for Long-Read Sequencing Applications on Modern CPUs,” Nature Computational Science, 2022.
- (128) Y. Gao, Y. Liu, Y. Ma, B. Liu, Y. Wang, and Y. Xing, “abPOA: An SIMD-Based C Library for Fast Partial Order Alignment Using Adaptive Band,” Bioinformatics, 2021.
- (129) D. Fujiki, S. Wu, N. Ozog, K. Goliya, D. Blaauw, S. Narayanasamy, and R. Das, “SeedEx: A Genome Sequencing Accelerator for Optimal Alignments in Subminimal Space,” in MICRO, 2020.
- (130) A. Haghi, S. Marco-Sola, L. Alvarez, D. Diamantopoulos, C. Hagleitner, and M. Moreto, “An FPGA Accelerator of the Wavefront Algorithm for Genomics Pairwise Alignment,” in FPL, 2021.
- (131) X. Fei, Z. Dan, L. Lina, M. Xin, and Z. Chunlei, “FPGASW: Accelerating Large-Scale Smith–Waterman Sequence Alignment Application with Backtracking on FPGA Linear Systolic Array,” Interdisciplinary Sciences: Computational Life Sciences, 2018.
- (132) S. S. Banerjee, M. El-Hadedy, J. B. Lim, Z. T. Kalbarczyk, D. Chen, S. S. Lumetta, and R. K. Iyer, “ASAP: Accelerated Short-Read Alignment on Programmable Hardware,” IEEE TC, 2019.
- (133) Intel Corp., “Intel® Xeon® Processor E5-2630 v4 Product Specifications.” Available: https://ark.intel.com/content/www/us/en/ark/products/92981/intel-xeon-processor-e52630-v4-25m-cache-2-20-ghz.html
- (134) W. Magro, P. Petersen, and S. Shah, “Hyper-Threading Technology: Impact on Compute-Intensive Workloads,” Intel Technology Journal, 2002.
- (135) D. Koufaty and D. T. Marr, “Hyperthreading Technology in the Netburst Microarchitecture,” IEEE Micro, 2003.
- (136) D. M. Tullsen, S. J. Eggers, and H. M. Levy, “Simultaneous Multithreading: Maximizing On-Chip Parallelism,” in ISCA, 1995.
- (137) D. M. Tullsen, S. J. Eggers, J. S. Emer, H. M. Levy, J. L. Lo, and R. L. Stamm, “Exploiting Choice: Instruction Fetch and Issue on an Implementable Simultaneous Multithreading Processor,” in ISCA, 1996.
- (138) Intel Corp., “Intel® VTune™ Profiler.” Available: https://www.intel.com/content/www/us/en/developer/tools/oneapi/vtune-profiler.html
- (139) WikiChip, “Perf: Linux Profiling with Performance Counters.” Available: https://perf.wiki.kernel.org
- (140) M. Alser, O. Mutlu, and C. Alkan, “MAGNET: Understanding and Improving the Accuracy of Genome Pre-Alignment Filtering,” IPSI Transactions on Internet Research, 2017.
- (141) M. Alser, H. Hassan, A. Kumar, O. Mutlu, and C. Alkan, “Shouji: A Fast and Efficient Pre-Alignment Filter for Sequence Alignment,” Bioinformatics, 2019.
- (142) N. Mansouri Ghiasi, J. Park, H. Mustafa, J. Kim, A. Olgun, A. Gollwitzer, D. Senol Cali, C. Firtina, H. Mao, N. Almadhoun Alserr et al., “GenStore: A High-Performance In-Storage Processing System for Genome Sequence Analysis,” in ASPLOS, 2022.
- (143) A. Nag, C. Ramachandra, R. Balasubramonian, R. Stutsman, E. Giacomin, H. Kambalasubramanyam, and P.-E. Gaillardon, “GenCache: Leveraging In-Cache Operators for Efficient Sequence Alignment,” in MICRO, 2019.
- (144) A. Subramaniyan, J. Wadden, K. Goliya, N. Ozog, X. Wu, S. Narayanasamy, D. Blaauw, and R. Das, “Accelerating Maximal-Exact-Match Seeding with Enumerated Radix Trees,” BioRxiv, 2020.
- (145) W. Huangfu, K. T. Malladi, S. Li, P. Gu, and Y. Xie, “NEST: DIMM Based Near-Data-Processing Accelerator for K-mer Counting,” in ICCAD, 2020.
- (146) W. Huangfu, X. Li, S. Li, X. Hu, P. Gu, and Y. Xie, “MEDAL: Scalable DIMM Based Near Data Processing Accelerator for DNA Seeding Algorithm,” in MICRO, 2019.
- (147) A. F. Laguna, H. Gamaarachchi, X. Yin, M. Niemier, S. Parameswaran, and X. S. Hu, “Seed-and-Vote Based In-Memory Accelerator for DNA Read Mapping,” in ICCAD, 2020.
- (148) J. Cong, L. Guo, P.-T. Huang, P. Wei, and T. Yu, “SMEM++: A Pipelined and Time-Multiplexed SMEM Seeding Accelerator for Genome Sequencing,” in FPL, 2018.
- (149) Y. Kim, M. Imani, N. Moshiri, and T. Rosing, “GenieHD: Efficient DNA Pattern Matching Accelerator Using Hyperdimensional Computing,” in DATE, 2020.
- (150) S. K. Khatamifard, Z. Chowdhury, N. Pande, M. Razaviyayn, C. H. Kim, and U. R. Karpuzcu, “GeNVoM: Read Mapping Near Non-Volatile Memory,” IEEE/ACM TCCB, 2021.
- (151) E. Rucci, C. Garcia, G. Botella, A. De Giusti, M. Naiouf, and M. Prieto-Matias, “SWIFOLD: Smith–Waterman Implementation on FPGA with OpenCL for Long DNA Sequences,” BMC Systems Biology, 2018.
- (152) L. Page, S. Brin, R. Motwani, and T. Winograd, “The PageRank Citation Ranking: Bringing Order to the Web,” Stanford InfoLab, Tech. Rep., 1999.
- (153) E. F. Moore, “The Shortest Path Through a Maze,” in Proceedings of an International Symposium on the Theory of Switching, 1959.
- (154) E. W. Dijkstra et al., “A Note on Two Problems in Connexion with Graphs,” Numerische Mathematik, 1959.
- (155) X. Su and T. M. Khoshgoftaar, “A Survey of Collaborative Filtering Techniques,” Advances in Artificial Intelligence, 2009.
- (156) J. Zhong and B. He, “Medusa: Simplified Graph Processing on GPUs,” IEEE TPDS, 2013.
- (157) M. Zhang, Y. Zhuo, C. Wang, M. Gao, Y. Wu, K. Chen, C. Kozyrakis, and X. Qian, “GraphP: Reducing Communication for PIM-Based Graph Processing with Efficient Data Partition,” in HPCA, 2018.
- (158) J. Ahn, S. Yoo, O. Mutlu, and K. Choi, “PIM-Enabled Instructions: A Low-Overhead, Locality-Aware Processing-in-Memory Architecture,” in ISCA, 2015.
- (159) J. Ahn, S. Hong, S. Yoo, O. Mutlu, and K. Choi, “A Scalable Processing-in-Memory Accelerator for Parallel Graph Processing,” in ISCA, 2015.
- (160) L. Nai, R. Hadidi, J. Sim, H. Kim, P. Kumar, and H. Kim, “GraphPIM: Enabling Instruction-Level PIM Offloading in Graph Computing Frameworks,” in HPCA, 2017.
- (161) L. Song, Y. Zhuo, X. Qian, H. Li, and Y. Chen, “GraphR: Accelerating Graph Processing Using ReRAM,” in HPCA, 2018.
- (162) D. Sengupta, S. L. Song, K. Agarwal, and K. Schwan, “GraphReduce: Processing Large-Scale Graphs on Accelerator-Based Systems,” in SC, 2015.
- (163) E. Nurvitadhi, G. Weisz, Y. Wang, S. Hurkat, M. Nguyen, J. C. Hoe, J. F. Martínez, and C. Guestrin, “GraphGen: An FPGA Framework for Vertex-Centric Graph Computation,” in FCCM, 2014.
- (164) C.-Y. Gui, L. Zheng, B. He, C. Liu, X.-Y. Chen, X.-F. Liao, and H. Jin, “A Survey on Graph Processing Accelerators: Challenges and Opportunities,” JCST, 2019.
- (165) S. Khoram, J. Zhang, M. Strange, and J. Li, “Accelerating Graph Analytics by Co-Optimizing Storage and Access on an FPGA-HMC Platform,” in FPGA, 2018.
- (166) G. Dai, T. Huang, Y. Chi, J. Zhao, G. Sun, Y. Liu, Y. Wang, Y. Xie, and H. Yang, “GraphH: A Processing-in-Memory Architecture for Large-Scale Graph Processing,” IEEE TCAD, 2018.
- (167) J. Zhang, S. Khoram, and J. Li, “Boosting the Performance of FPGA-Based Graph Processor Using Hybrid Memory Cube: A Case for Breadth First Search,” in FPGA, 2017.
- (168) T. Zhang, J. Zhang, W. Shu, M.-Y. Wu, and X. Liang, “Efficient Graph Computation on Hybrid CPU and GPU Systems,” The Journal of Supercomputing, 2015.
- (169) J. Zhou, S. Liu, Q. Guo, X. Zhou, T. Zhi, D. Liu, C. Wang, X. Zhou, Y. Chen, and T. Chen, “Tunao: A High-Performance and Energy-Efficient Reconfigurable Accelerator for Graph Processing,” in CCGRID, 2017.
- (170) M. M. Ozdal, S. Yesil, T. Kim, A. Ayupov, J. Greth, S. Burns, and O. Ozturk, “Energy Efficient Architecture for Graph Analytics Accelerators,” in ISCA, 2016.
- (171) T. J. Ham, L. Wu, N. Sundaram, N. Satish, and M. Martonosi, “Graphicionado: A High-Performance and Energy-Efficient Accelerator for Graph Analytics,” in MICRO, 2016.
- (172) G. Dai, T. Huang, Y. Chi, N. Xu, Y. Wang, and H. Yang, “ForeGraph: Exploring Large-Scale Graph Processing on Multi-FPGA Architecture,” in FPGA, 2017.
- (173) S. Zhou, C. Chelmis, and V. K. Prasanna, “High-Throughput and Energy-Efficient Graph Processing on FPGA,” in FCCM, 2016.
- (174) G. Dai, Y. Chi, Y. Wang, and H. Yang, “FPGP: Graph Processing Framework on FPGA a Case Study of Breadth-First Search,” in FPGA, 2016.
- (175) O. G. Attia, T. Johnson, K. Townsend, P. Jones, and J. Zambreno, “CyGraph: A Reconfigurable Architecture for Parallel Breadth-First Search,” in IPDPSW, 2014.
- (176) M. Delorimier, N. Kapre, N. Mehta, D. Rizzo, I. Eslick, R. Rubin, T. E. Uribe, F. Thomas Jr, and A. DeHon, “GraphStep: A System Architecture for Sparse-Graph Algorithms,” in FCCM, 2006.
- (177) Y. Wang, A. Davidson, Y. Pan, Y. Wu, A. Riffel, and J. D. Owens, “Gunrock: A High-Performance Graph Processing Library on the GPU,” in ACM SIGPLAN Notices, 2016.
- (178) F. Khorasani, K. Vora, R. Gupta, and L. N. Bhuyan, “CuSha: Vertex-Centric Graph Processing on GPUs,” in HPDC, 2014.
- (179) Y. Wang, J. C. Hoe, and E. Nurvitadhi, “Processor Assisted Worklist Scheduling for FPGA Accelerated Graph Processing on a Shared-Memory Platform,” in FCCM, 2019.
- (180) M. Besta, R. Kanakagiri, G. Kwasniewski, R. Ausavarungnirun, J. Beránek, K. Kanellopoulos, K. Janda, Z. Vonarburg-Shmaria, L. Gianinazzi, I. Stefan et al., “SISA: Set-Centric Instruction Set Architecture for Graph Mining on Processing-in-Memory Systems,” in MICRO, 2021.
- (181) Eli and Edythe L. Broad Institute of MIT and Harvard, “FASTA File Format.” Available: https://software.broadinstitute.org/software/igv/FASTA
- (182) Samtools Organisation, “The Variant Call Format (VCF).” Available: https://samtools.github.io/hts-specs/VCFv4.2.pdf
- (183) “GFA: Graphical Fragment Assembly (GFA) Format Specification.” Available: https://github.com/GFA-spec/GFA-spec
- (184) M. Roberts, W. Hayes, B. R. Hunt, S. M. Mount, and J. A. Yorke, “Reducing Storage Requirements for Biological Sequence Comparison,” Bioinformatics, 2004.
- (185) Heng Li, “Minimap2 — GitHub Repository.” Available: https://github.com/lh3/minimap2
- (186) S. Schleimer, D. S. Wilkerson, and A. Aiken, “Winnowing: Local Algorithms for Document Fingerprinting,” in ACM SIGMOD International Conference on Management of Data, 2003.
- (187) C. Jain, A. Rhie, H. Zhang, C. Chu, B. P. Walenz, S. Koren, and A. M. Phillippy, “Weighted Minimizer Sampling Improves Long Read Mapping,” Bioinformatics, 2020.
- (188) C. Jain, A. Rhie, N. F. Hansen, S. Koren, and A. M. Phillippy, “Long-Read Mapping to Repetitive Reference Sequences Using Winnowmap2,” Nature Methods, 2022.
- (189) SAFARI Research Group, “GenASM — GitHub Repository.” Available: https://github.com/CMU-SAFARI/GenASM
- (190) H. T. Kung and C. E. Leiserson, “Systolic Arrays (for VLSI),” in Sparse Matrix Proceedings, 1978.
- (191) H. T. Kung, “Why Systolic Architectures?” IEEE Computer, 1982.
- (192) S. Ghose, T. Li, N. Hajinazar, D. Senol Cali, and O. Mutlu, “Demystifying Complex Workload-DRAM Interactions: An Experimental Study,” in SIGMETRICS, 2019.
- (193) NVIDIA, “V100 Tensor Core GPU Architecture.” Available: https://www.nvidia.com/en-us/data-center/v100/
- (194) NVIDIA, “A100 Tensor Core GPU Architecture.” Available: https://www.nvidia.com/en-us/data-center/a100/
- (195) Xilinx, Inc., “Virtex UltraScale+.” Available: https://www.xilinx.com/products/silicon-devices/fpga/virtex-ultrascale-plus.html
- (196) “ADM-PCIE-9H7-High-Speed Communications Hub.” Available: https://www.alpha-data.com/dcp/products.php?product=adm-pcie-9h7
- (197) G. Singh, D. Diamantopoulos, C. Hagleitner, J. Gómez-Luna, S. Stuijk, O. Mutlu, and H. Corporaal, “NERO: A Near High-Bandwidth Memory Stencil Accelerator for Weather Prediction Modeling,” in FPL, 2020.
- (198) Synopsys, Inc., “Design Compiler.” Available: https://www.synopsys.com/implementation-and-signoff/rtl-synthesis-test/design-compiler-graphical.html
- (199) WikiChip, “28 nm Lithography Process.” Available: https://en.wikichip.org/wiki/28_nm_lithography_process
- (200) M. O’Connor, N. Chatterjee, D. Lee, J. Wilson, A. Agrawal, S. W. Keckler, and W. J. Dally, “Fine-Grained DRAM: Energy-Efficient DRAM for Extreme Bandwidth Systems,” in MICRO, 2017.
- (201) S. Kim, S. Kim, K. Cho, T. Shin, H. Park, D. Lho, S. Park, K. Son, G. Park, S. Jeong et al., “Signal Integrity and Computing Performance Analysis of a Processing-In-Memory of High Bandwidth Memory (PIM-HBM) Scheme,” IEEE Transactions on Components, Packaging and Manufacturing Technology, 2021.
- (202) Intel Corp., “Intel® Performance Counter Monitor,” 2017. Available: https://www.intel.com/software/pcm
- (203) NVIDIA, “GeForce RTX 2080 Ti.” Available: https://www.nvidia.com/en-us/geforce/graphics-cards/rtx-2080-ti/
- (204) NVIDIA, “NVIDIA System Management Interface.” Available: https://developer.nvidia.com/nvidia-system-management-interface
- (205) National Center for Biotechnology Information, “GRCh38.p13,” 2019. Available: https://www.ncbi.nlm.nih.gov/assembly/GCA_000001405.28
- (206) Genome in a Bottle Consortium, “Genome in a Bottle Release.” Available: https://ftp-trace.ncbi.nlm.nih.gov/giab/ftp/release/
- (207) Y. Ono, K. Asai, and M. Hamada, “PBSIM2: A Simulator for Long-Read Sequencers with a Novel Generative Model of Quality Scores,” Bioinformatics, 2021.
- (208) M. Holtgrewe, “Mason–A Read Simulator for Second Generation Sequencing Data,” Technical Report FU Berlin, 2010.
- (209) “BRCA1 – vg graph.” Available: https://github.com/ParBLiSS/PaSGAL/tree/master/data
- (210) WikiChip, “Cascade Lake SP - Cores - Intel.” Available: https://en.wikichip.org/wiki/intel/cores/cascade_lake_sp
- (211) S. P. Muralidhara, L. Subramanian, O. Mutlu, M. Kandemir, and T. Moscibroda, “Reducing Memory Interference in Multicore Systems via Application-Aware Memory Channel Partitioning,” in MICRO, 2011.
- (212) Intel Corp., “Intel® Advanced Vector Extensions 512,” 2022. Available: https://www.intel.com/content/www/us/en/architecture-and-technology/avx-512-overview.html
- (213) O. Mutlu, S. Ghose, J. Gómez-Luna, and R. Ausavarungnirun, “A Modern Primer on Processing in Memory,” arXiv preprint arXiv:2012.03112, 2020.
- (214) O. Mutlu, S. Ghose, J. Gómez-Luna, and R. Ausavarungnirun, “Processing Data Where It Makes Sense: Enabling In-Memory Computation,” MICPRO, 2019.
- (215) S. Ghose, A. Boroumand, J. S. Kim, J. Gómez-Luna, and O. Mutlu, “Processing-in-Memory: A Workload-Driven Perspective,” IBM JRD, 2019.
- (216) S. Gupta, M. Imani, B. Khaleghi, V. Kumar, and T. Rosing, “RAPID: A ReRAM Processing in-Memory Architecture for DNA Sequence Alignment,” in ISLPED, 2019.
- (217) S. Angizi, J. Sun, W. Zhang, and D. Fan, “PIM-Aligner: A Processing-in-MRAM Platform for Biological Sequence Alignment,” in DATE, 2020.
- (218) W. Huangfu, S. Li, X. Hu, and Y. Xie, “RADAR: A 3D-ReRAM Based DNA Alignment Accelerator Architecture,” in DAC, 2018.
- (219) Z. I. Chowdhury, M. Zabihi, S. K. Khatamifard, Z. Zhao, S. Resch, M. Razaviyayn, J.-P. Wang, S. S. Sapatnekar, and U. R. Karpuzcu, “A DNA Read Alignment Accelerator Based on Computational RAM,” IEEE Journal on Exploratory Solid-State Computational Devices and Circuits, 2020.
- (220) F. Zokaee, M. Zhang, and L. Jiang, “FindeR: Accelerating FM-Index-Based Exact Pattern Matching in Genomic Sequences Through ReRAM Technology,” in PACT, 2019.
- (221) F. Zokaee, H. R. Zarandi, and L. Jiang, “AligneR: A Process-in-Memory Architecture for Short Read Alignment in ReRAMs,” IEEE CAL, 2018.
- (222) M. Khalifa, R. Ben-Hur, R. Ronen, O. Leitersdorf, L. Yavits, and S. Kvatinsky, “FiltPIM: In-Memory Filter for DNA Sequencing,” in IEEE ICECS, 2020.
- (223) T. Dunn, H. Sadasivan, J. Wadden, K. Goliya, K.-Y. Chen, D. Blaauw, R. Das, and S. Narayanasamy, “SquiggleFilter: An Accelerator for Portable Virus Detection,” in MICRO, 2021.
- (224) Q. Lou, S. Janga, and L. Jiang, “Helix: Algorithm/Architecture Co-Design for Accelerating Nanopore Genome Base-Calling,” in PACT, 2020.
- (225) S. Angizi, N. A. Fahmi, W. Zhang, and D. Fan, “PIM-Assembler: A Processing-in-Memory Platform for Genome Assembly,” in DAC, 2020.
- (226) L. Jiang and F. Zokaee, “EXMA: A Genomics Accelerator for Exact-Matching,” in HPCA, 2021.
- (227) L. Wu, R. Sharifi, M. Lenjani, K. Skadron, and A. Venkat, “Sieve: Scalable In-situ DRAM-Based Accelerator Designs for Massively Parallel k-mer Matching,” in ISCA, 2021.
- (228) T. J. Ham, D. Bruns-Smith, B. Sweeney, Y. Lee, S. H. Seo, U. G. Song, Y. H. Oh, K. Asanovic, J. W. Lee, and L. W. Wills, “Genesis: A Hardware Acceleration Framework for Genomic Data Analysis,” in ISCA, 2020.
- (229) M. Lo, Z. Fang, J. Wang, P. Zhou, M.-C. F. Chang, and J. Cong, “Algorithm-Hardware Co-design for BQSR Acceleration in Genome Analysis ToolKit,” in FCCM, 2020.
- (230) L. Wu, D. Bruns-Smith, F. A. Nothaft, Q. Huang, S. Karandikar, J. Le, A. Lin, H. Mao, B. Sweeney, K. Asanović et al., “FPGA Accelerated Indel Realignment in the Cloud,” in HPCA, 2019.