Band Structure Driven Thermoelectric Response of Topological Semiconductor \ceZrTe5
Abstract
We report a transport, thermodynamic, and spectroscopic study of the recently identified topological semiconductor ZrTe5 with a focus on elucidating the connections between its band structure and unusual thermoelectric properties. Using time and angle resolved photoemission spectroscopy (tr-ARPES) we observe a small electronic band gap and temperature dependent Fermi level which traverses from a single valence to conduction band with lowering temperature, consistent with previous reports. This low temperature Fermi surface closely matches that derived from quantum oscillations, suggesting it is reflective of the bulk electronic structure. The Seebeck and low field Nernst response is characterized by an unusually large and non-monotonic temperature evolution. We find this can be quantitatively explained using a semiclassical model based on the observed band character and a linear temperature shifting of the Fermi level. Additionally, we observe a large, non-saturating enhancement of both thermoelectric coefficients in magnetic field. We show this can be captured by the Zeeman energy associated with a large effective -factor of 25.8 consistent with that derived from Lifshitz-Kosevich analysis of the quantum oscillations. Together these observations provide a comprehensive picture of ZrTe5 as a model high mobility semiconductor and potential platform for significant magnetic field driven thermoelectricity.
pacs:
I Introduction
The layered material ZrTe5 has seen a renewed interest in recent years following the prediction that it could harbor topologically non-trivial ground states Weng et al. (2014). Originally investigated as a potential charge density wave host Okada et al. (1980, 1982), the system shows a large, sign-changing Seebeck response long interpreted as evidence for a change of dominant carrier type Jones et al. (1982). The nature of this crossover has become of heightened interest, as different theoretical models Weng et al. (2014); Fan et al. (2017) and experiments including Angle-Resolved Photoemission Spectroscopy (ARPES)Manzoni et al. (2015); Moreschini et al. (2016); Wu et al. (2016); Manzoni et al. (2016, 2017); Zhang et al. (2017a); Xiong et al. (2017), Scanning Tunneling Spectroscopy (STS)Wu et al. (2016); Manzoni et al. (2016); Li et al. (2016a), infrared spectroscopyChen et al. (2015a, b); Jiang et al. (2017); Chen et al. (2017) and quantum oscillations Zheng et al. (2016); Liu et al. (2016); Zheng et al. (2017); Zhang et al. (2017b) suggest the system could be a strong topological insulator (TI), weak TI, or Dirac semimetal. At the same time, transport studies have reported a remarkable set of exotic but seemingly disparate phenomena including a chiral magnetic effectLi et al. (2016b), anomalous Hall effectLiang et al. (2018), discrete scale invarianceWang et al. (2018) three-dimensional quantum Hall effectTang et al. (2019), and quantized thermoelectric responseZhang et al. (2020). The understanding of the underlying electronic structure that drive these observations is of significant interest.
It has been pointed out that the electronic structure including the ground state topology are highly sensitive to the lattice constant of \ceZrTe5 Weng et al. (2014); Fan et al. (2017) which in turn can be affected by the growth method Lv et al. (2017); Wang et al. (2018), consistent with experimental results showing the high sensitivity of the system to strain Mutch et al. (2019). This calls for comprehensive studies of ZrTe5 single crystals to connect observations of transport exotica with the electronic band structure. Here, we report an investigation of single crystals grown by chemical vapor transport (CVT) which are characterized by anomalously large and non-monotonic Seebeck and Nernst effects. We have further performed measurements of electronic transport, magnetic torque, and time and angle resolved photoemission spectroscopy (tr-ARPES) as well as electronic structure calculations. We show that we can quantitatively describe the thermoelectric, quantum oscillation, and spectroscopic results with a model of a small gap ( meV) weak TI with a temperature dependent Fermi level (shifting with rate meV/K). This establishes a concrete description of ZrTe5 grown in this manner that will further enable band engineering for topology and high thermoelectric performance.
II results and discussion
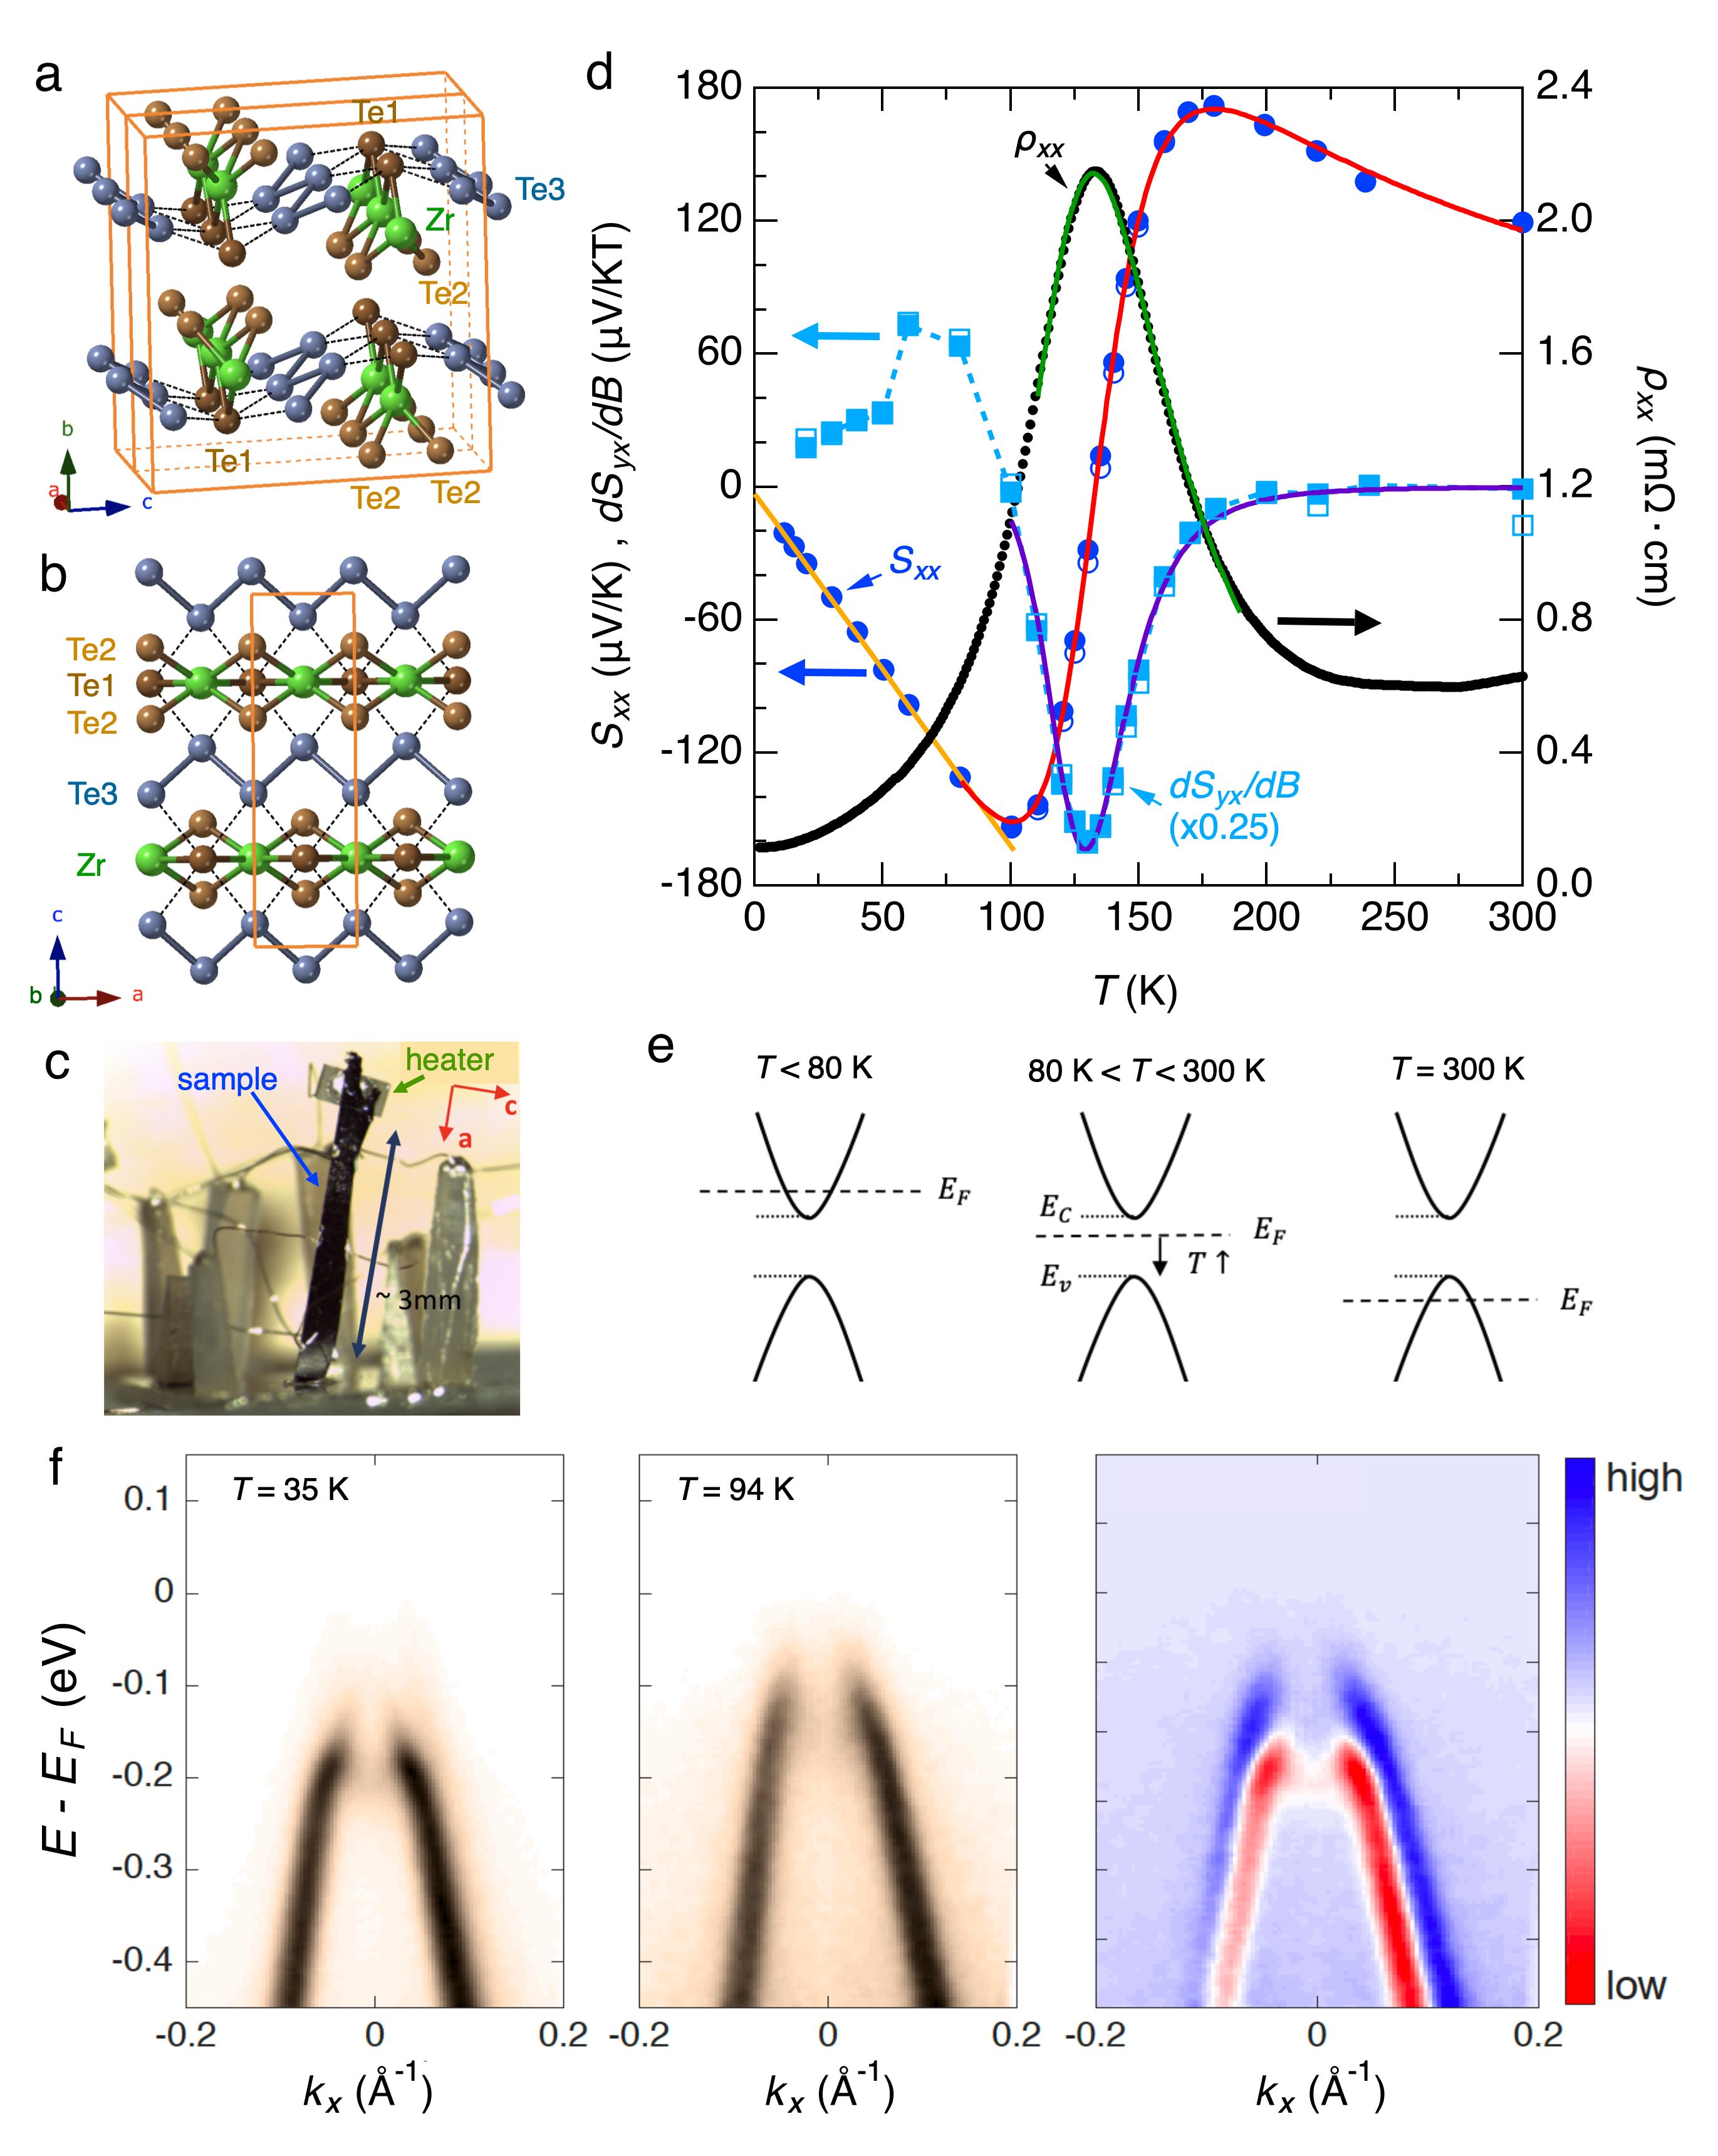
ZrTe5 crystallizes in the orthorhombic structure of space group (D, No.63), shown in Fig. 1(a,b). The structure is composed of \ceZrTe3 prismatic chains oriented along the -axis with additional Te atoms forming zig-zag between them. A weak inter-chain coupling exists such that two-dimensional layers are formed in the plane (denoted by black dashed lines). The coupling between the layers is van der Waals in nature and is much weaker than the inter-chain coupling; the crystal structure is highly anisotropic in all three directions. The crystals presented here were grown by chemical vapor transportLv et al. (2017) (CVT) and have a morphology characterized by a long ribbon-like shape with a typical dimension of 3 mm 0.05 mm 0.5 mm along the , , and -axes.
II.1 Temperature dependence of Fermi level
We measured the electric and thermoelectric transport response in isothermal and open circuit conditions, respectively. A photo of the thermoelectric measurement setup is shown in Fig. 1(c). As shown in Fig. 1(d), the zero field longitudinal resistivity exhibits a hump structure upon cooling peaking near K, as is often reported in CVT grown single crystalsMcIlroy et al. (2004); Lv et al. (2017); Zhou et al. (2016); Zheng et al. (2016); Liu et al. (2016); Zhang et al. (2017b). Concomitant with this feature, the Seebeck coefficient passes through zero. The sign change of , as well as the low field Hall coefficient SI suggest that transport is dominated by hole type carriers for temperature and electron type below. For temperatures near the zero field limit of slope of the Nernst effect shows a sign reversal. For K, the system appears to cross over from semiconducting to Fermi liquid behavior suggestive of an electron-like metal. More quantitatively, a linear behavior typical for a normal metal is observed, following the Mott formula , where is the Fermi level with respect to the band bottom and is electron conductivity. A linear fit yields V/K2. In addition, the electrical response is well described by parabolic lawSI , where . Qualitatively, this can be explained by a simple semiconducting band structure and -dependent Fermi level as sketched Fig. 1(e).
We have performed angle-resolved photoemission spectroscopy (ARPES) on crystals from this same batch. Shown in Fig. 1(f) are energy-momentum cuts across the point taken at 35 K and 94 K, as well as their difference. While the band shape remains largely unchanged, a clear downwards energy shifting at lower is observed. Such a shift has been observed in a number of recent reports on CVT grown crystalsZhang et al. (2017a); Xiong et al. (2017). This is qualitatively consistent with the rigid band shift depicted in Fig. 1(e).
Significant attention has been aimed at understanding the nature of the band gap in \ceZrTe5 including if it is gapped or gapless Zhang et al. (2017a); Xiong et al. (2017). We show here that the experimental observations above can be quantitatively captured by a gapped scenario depicted in Fig. 1(e). Starting with the assumption of a symmetric semiconducting band structure with a gap and Fermi level at , from the Drude model the low field Seebeck and Nernst coefficients are
| (1) |
where is Boltzmann constant, is free electron charge, is the cyclotron frequency, is the momentum relaxation time, and corresponds to the single carrier type Seebeck coefficient. Given the semiconducting structure, the electron (hole) density () are proportional to , with the energy difference between band top (bottom) and the Fermi level.
Previous ARPES observations suggest that the Fermi level shifting is approximately linear in energy in the intermediate range of the resistivity anomaly Zhang et al. (2017a). We approximate , where denotes the mid point of band gap, denotes the temperature when Fermi level is degenerate with the midpoint, and is defined as a dimensionless shifting rate. Applying this to the model above, we arrive at expressions for the low field thermoelectric coefficients
| (2) | |||||
| (3) |
Whereas a single-band semiconductor with a static Fermi level the thermoelectric coefficients will be monotonic and retain the same sign at different , the shifting of allows for a dynamic response. The corresponding electrical response SI is
| (4) |
| (5) |
Similar to the case of the thermoelectric response, the additional degree of freedom associated with shifting makes an important modification to the electrical transport response as a function of .
We compare the expectations for Eq. (2)-(5) to the experimental results in Fig. 1(d). We directly fit and and for the Nernst and Hall response we fit the low field slope and . The fit captures the intermediate and high response with fit parameters and error bars listed in Table 1. The obtained meV/K is consistent with recent ARPES reportsZhang et al. (2017a), where the band shifting rate is approximately meV/K . The obtained meV is also consistent with our time-resolved ARPES, which we discuss below. The error bar above is defined as the standard deviation among the results in Table 1.
| sample | s0 | s1 | s1 | s2 | s2 |
|---|---|---|---|---|---|
| Fitting | |||||
| Fit regime | 110-190 K | 100-300 K | 80-300 K | 110-190 K | 100-180 K |
| - | - | ||||
| - |
For K, this semiconducting model fails to capture the transport response, as would be expected upon entering the metallic regime. Moreover, as noted above and are captured by that expected from a simple metal, suggesting a drop in the magnitude of . We hypothesize that this may be due to the increase in the density of states in the conduction band at the point, or that the shifting itself is driven by lattice contraction which would be expected to saturate at low when the thermal expansion coefficient vanishes Kittel et al. (1996).
II.2 Fermiology of conduction band
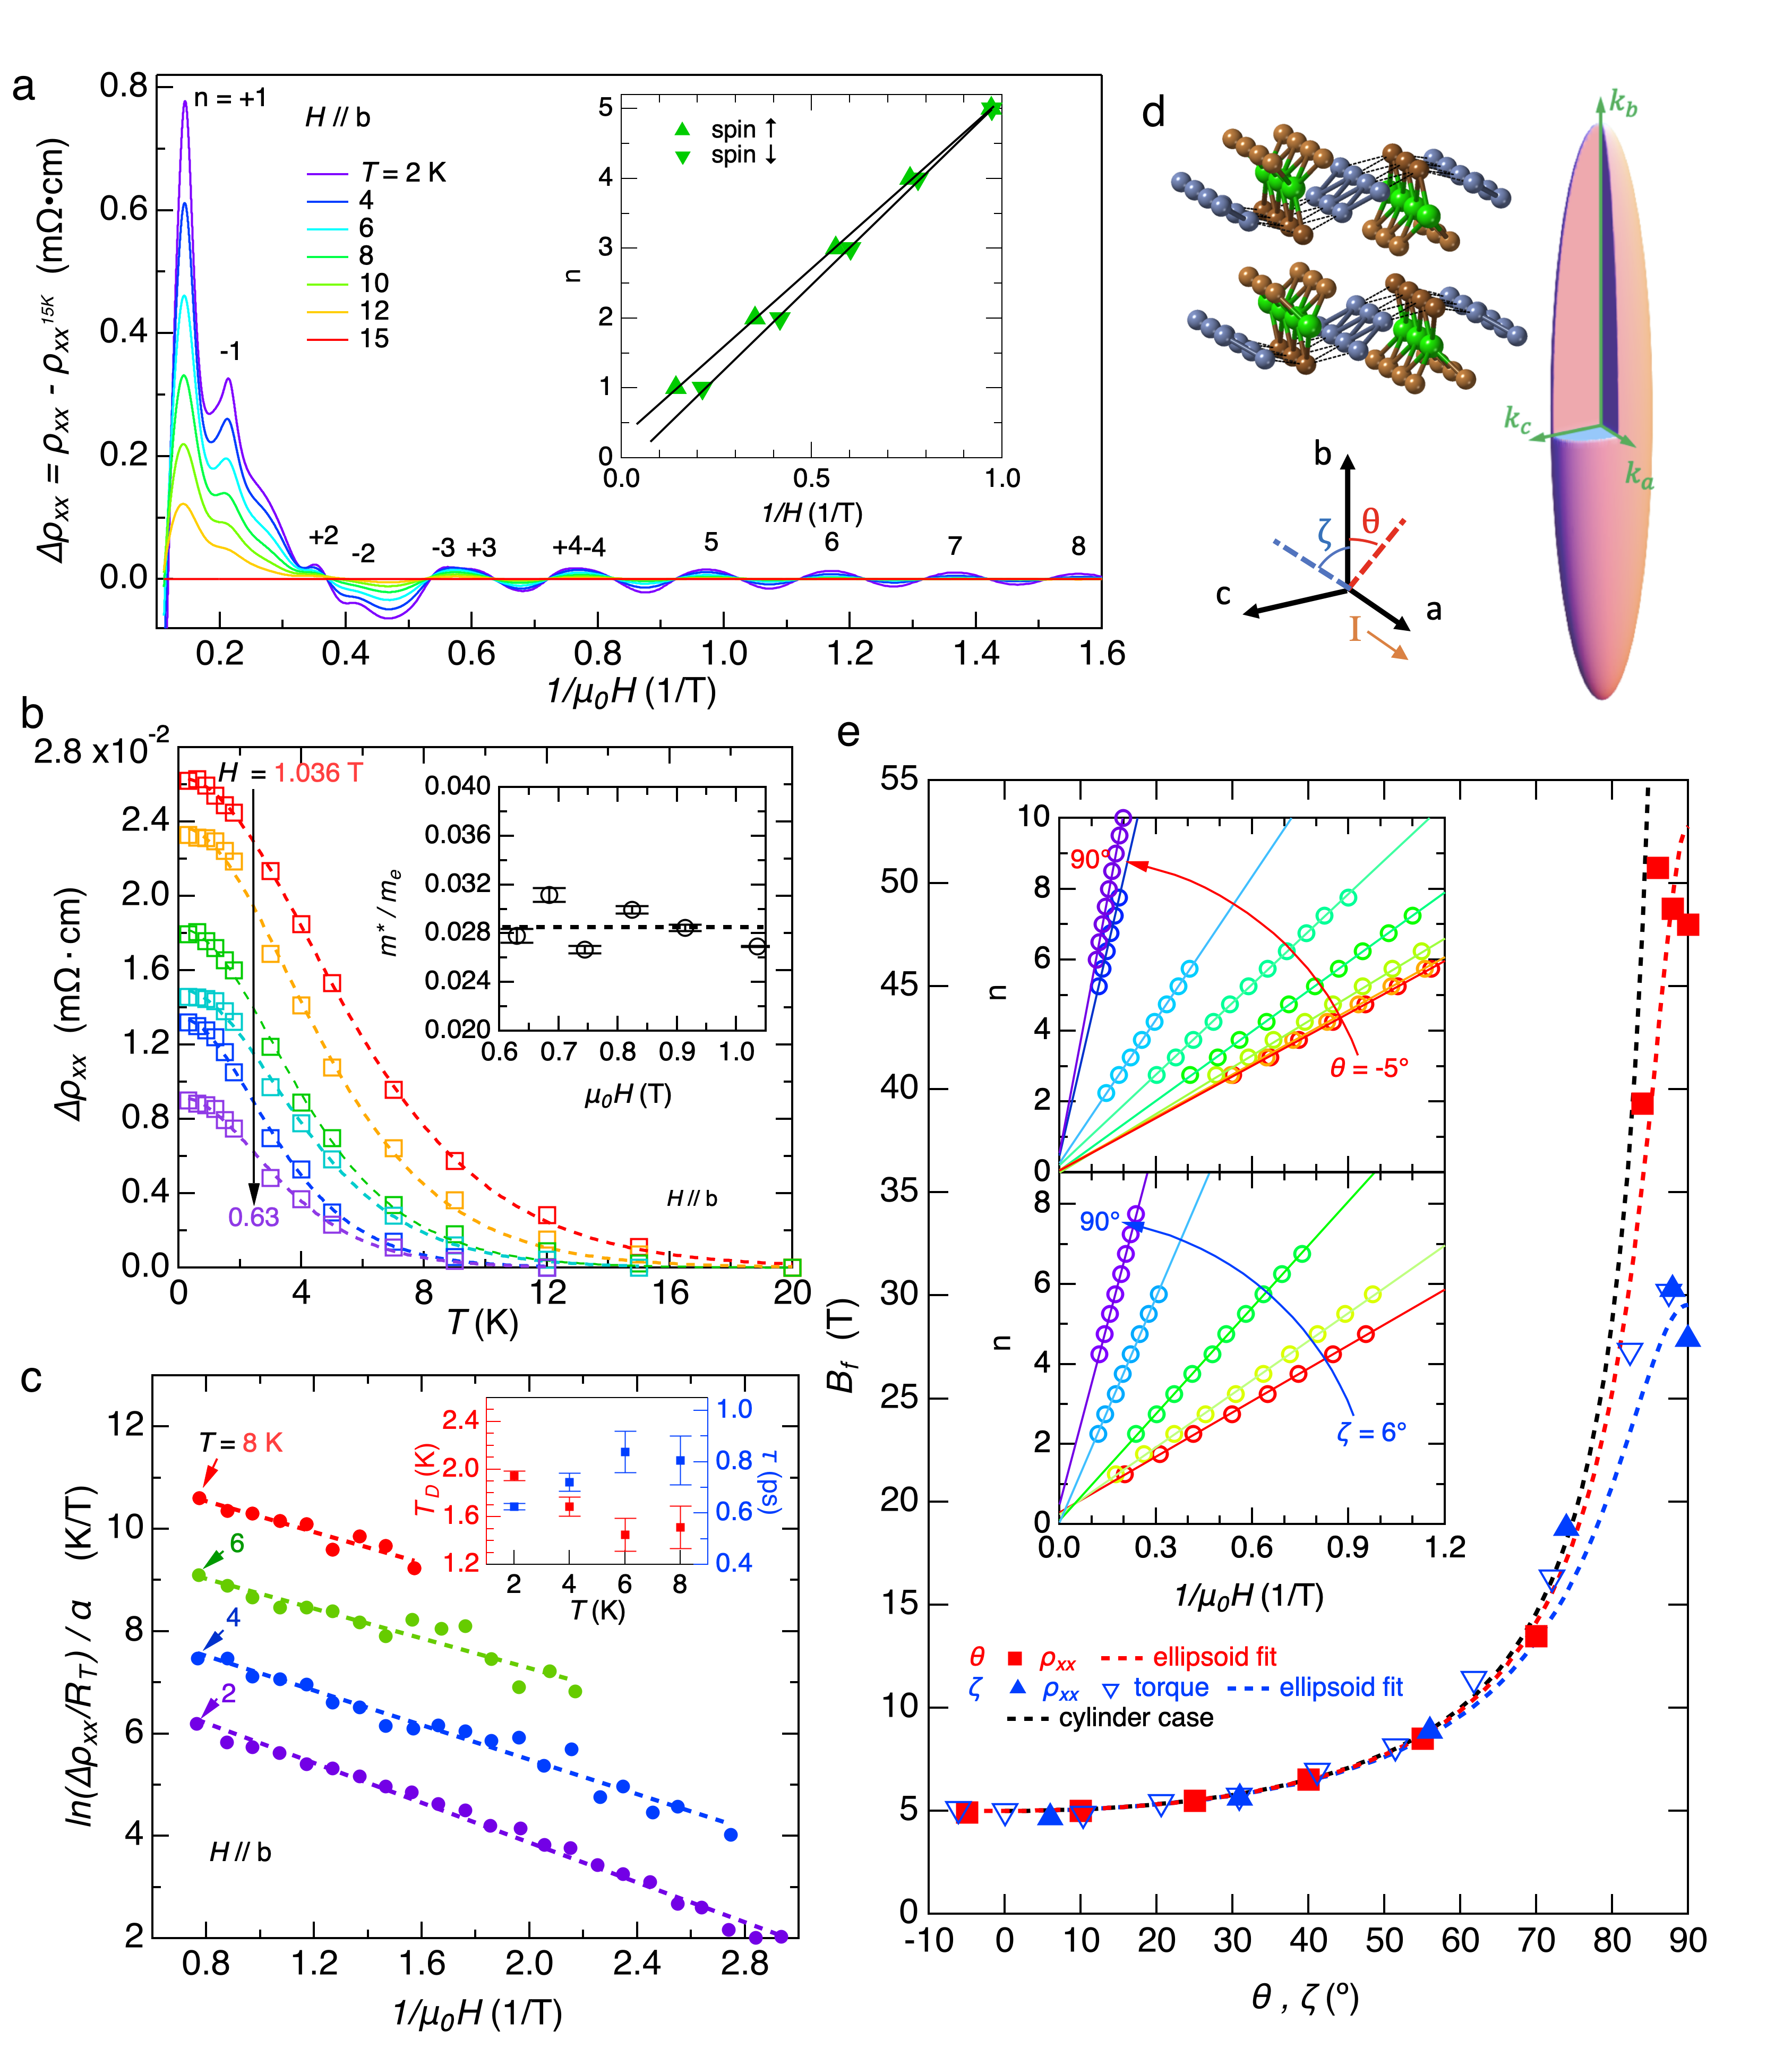
We further verify the above description of CVT grown \ceZrTe5 by studying the Fermiology of the low temperaure band structure with quantum oscillations and tr-ARPES. For the former we examine the low temperature magnetoresistance K, i.e. using the K trace as a background. This is shown plotted against in Fig. 2(a) for field applied along the axis. Clear Shubnikov-de Haas (SdH) oscillations are observed, onsetting near T, indicating a quantum mobility exceeding cm2/Vs. The oscillation frequency is T which corresponds to a Fermi surface cross section Å-2.
We have measured the detailed angular dependence of the SdH effect as well as de Haas-van Alphen oscillations in magnetic torque SI ; the variation of oscillation frequency as the field rotates away from axis are plotted in Fig. 2(e), where red squares (blue triangles) denotes rotating in ( plane) and () denotes the angle between axis and field direction. The angular variation is consistent with an ellipsoidal (3D) rather than cylindrical (quasi-2D) Fermi surface (dashed lines). This is also emphasized by the corresponding Landau fan diagrams (Fig. 2(e) inset) in which a saturating slope for is observed. Assuming an ellipsoid Fermi surface, the corresponding Fermi wave vectors are Å-1, Å-1 and Å-1 (depicted in Fig. 2(d)). This ellipsoid Fermi pocket corresponds to a carrier density of cm-3, in good agreement wiht that obtained from the Hall coefficient cm-3 SI . Together, these provide a consistent picture of the low Fermi surface being composed of a single electron pocket.
We can provide a further quantitative comparison with analysis of cyclotron effective mass , carrier lifetime , and effective factor from the Lifshitz-Kosevich formulaShoenberg (1984):
| (6) |
The oscillation amplitude is modulated by three factors: the thermal factor due to thermal broadening, the Dingle factor due to scattering, and the spin factor due to Zeeman splitting, where . The oscillation amplitude at fixed field () is plotted in Fig. 2(b), with a fit to yielding an average -plane (the result of each field is shown inset) and Fermi velocity m/s. As shown in Fig. 2(c), an average Dingle temperature K is found from a linear fit to . From this corresponds to a lifetime ps, comparable to ps calculated from the Hall mobility and .
We note that the analysis of above is restricted to T, as in larger field a pronounced Zeeman splitting becomes evident, as shown in Fig. 2(a) and its inset. The modulation effect due can be rewritten as
| (7) |
where the summation is over two spins (+(-) for spin up (down )). Therefore, the spin split Landau level indeces correspond to the lines with , as shown in the inset of Fig. 2(a) for . Linear fitting gives T (intercept=) and T (intercept=), corresponding to .
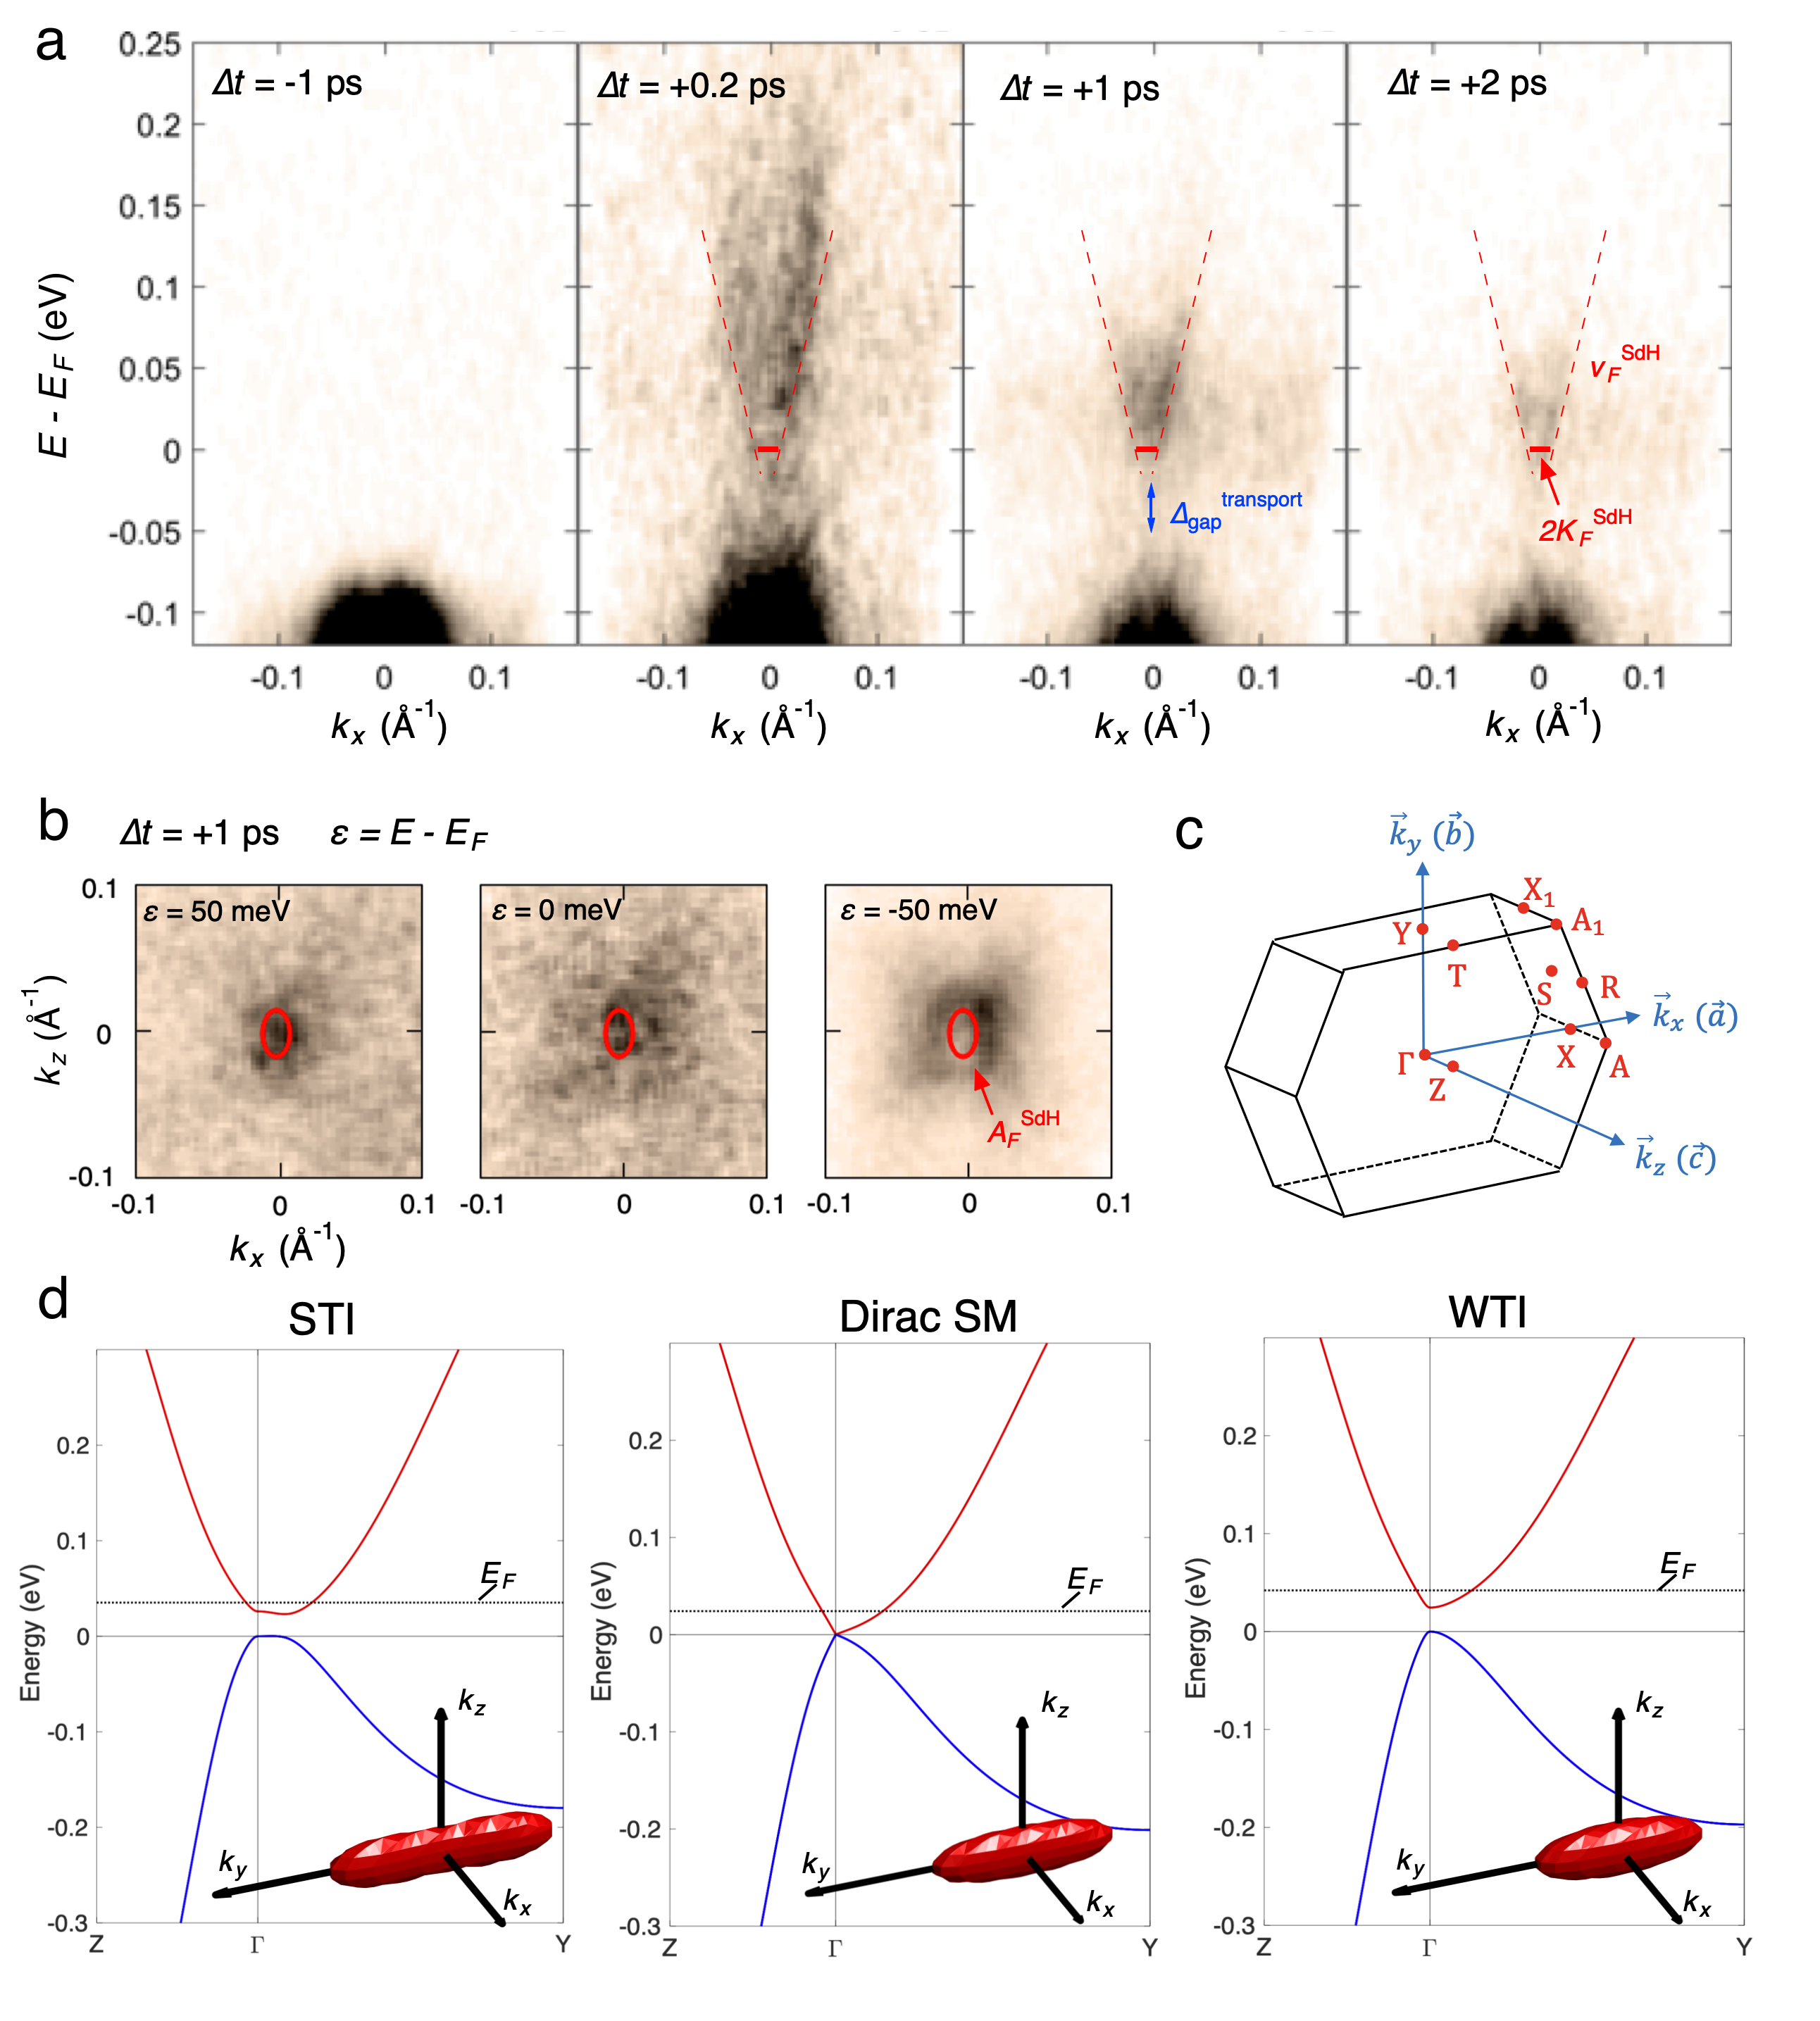
Turning to spectroscopy of the conduction band, results of tr-ARPES performed at K are shown in Fig. 3(a,b). Here, the conduction band at and the band gap are clearly resolved. The horizontal red bar and dashed red lines in Fig. 3(a) indicate the magnitude of Fermi wave vector and Fermi velocity obtained from quantum oscillations, which are in approximate agreement. derived from the transport data in Fig. 1(d) is also drawn in Fig. 3(a). In Fig. 3(b) the Fermi surface cross section is again compared with an in-plane spectrum, showing good agreement at .
Using the Brillion zone defined in Fig. 3(c), in Fig. 3(d) we show the band structure at point of the three possible phases for \ceZrTe5, namely strong TI (left panel), Dirac semimetal (middle), and weak TI (right), calculated by density functional theory (DFT). The electronic topology of \ceZrTe5 is known to be extremely sensitive to the values of its lattice constantsFan et al. (2017); here, the three panels in Fig. 3(d) are obtained in series thru expanding unit cell volume by , from left to right (the direct gap for the strong TI and weak TI phase nominally agree with experimental observations). In each, the Fermi level is shown for which the Fermi surface volume matches that of the quantum oscillation analysis (dashed line). The corresponding Fermi pockets are plotted in the insets. The band inversion of the strong TI leads to a weaker dispersion; comparing the flatness of these ellipsoids, the strong TI case is closer to that from quantum oscillation results depicted in Fig.2(d). However, surface states were not seen in the tr-ARPES measurements (nor e.g. previous static ARPES reports with high energy resolutionZhang et al. (2017a); Xiong et al. (2017)). One possible scenario for this within a strong TI system is leakage of surface state into the bulk due to small band gap. The expected inelastic mean free path of excited electrons here is 2-7 nm compared to the penetration depth of surface states estimated to be 45 nm from . Additional experiments to probe the potential surface states are of significant interest.
II.3 Field Enhancement of and
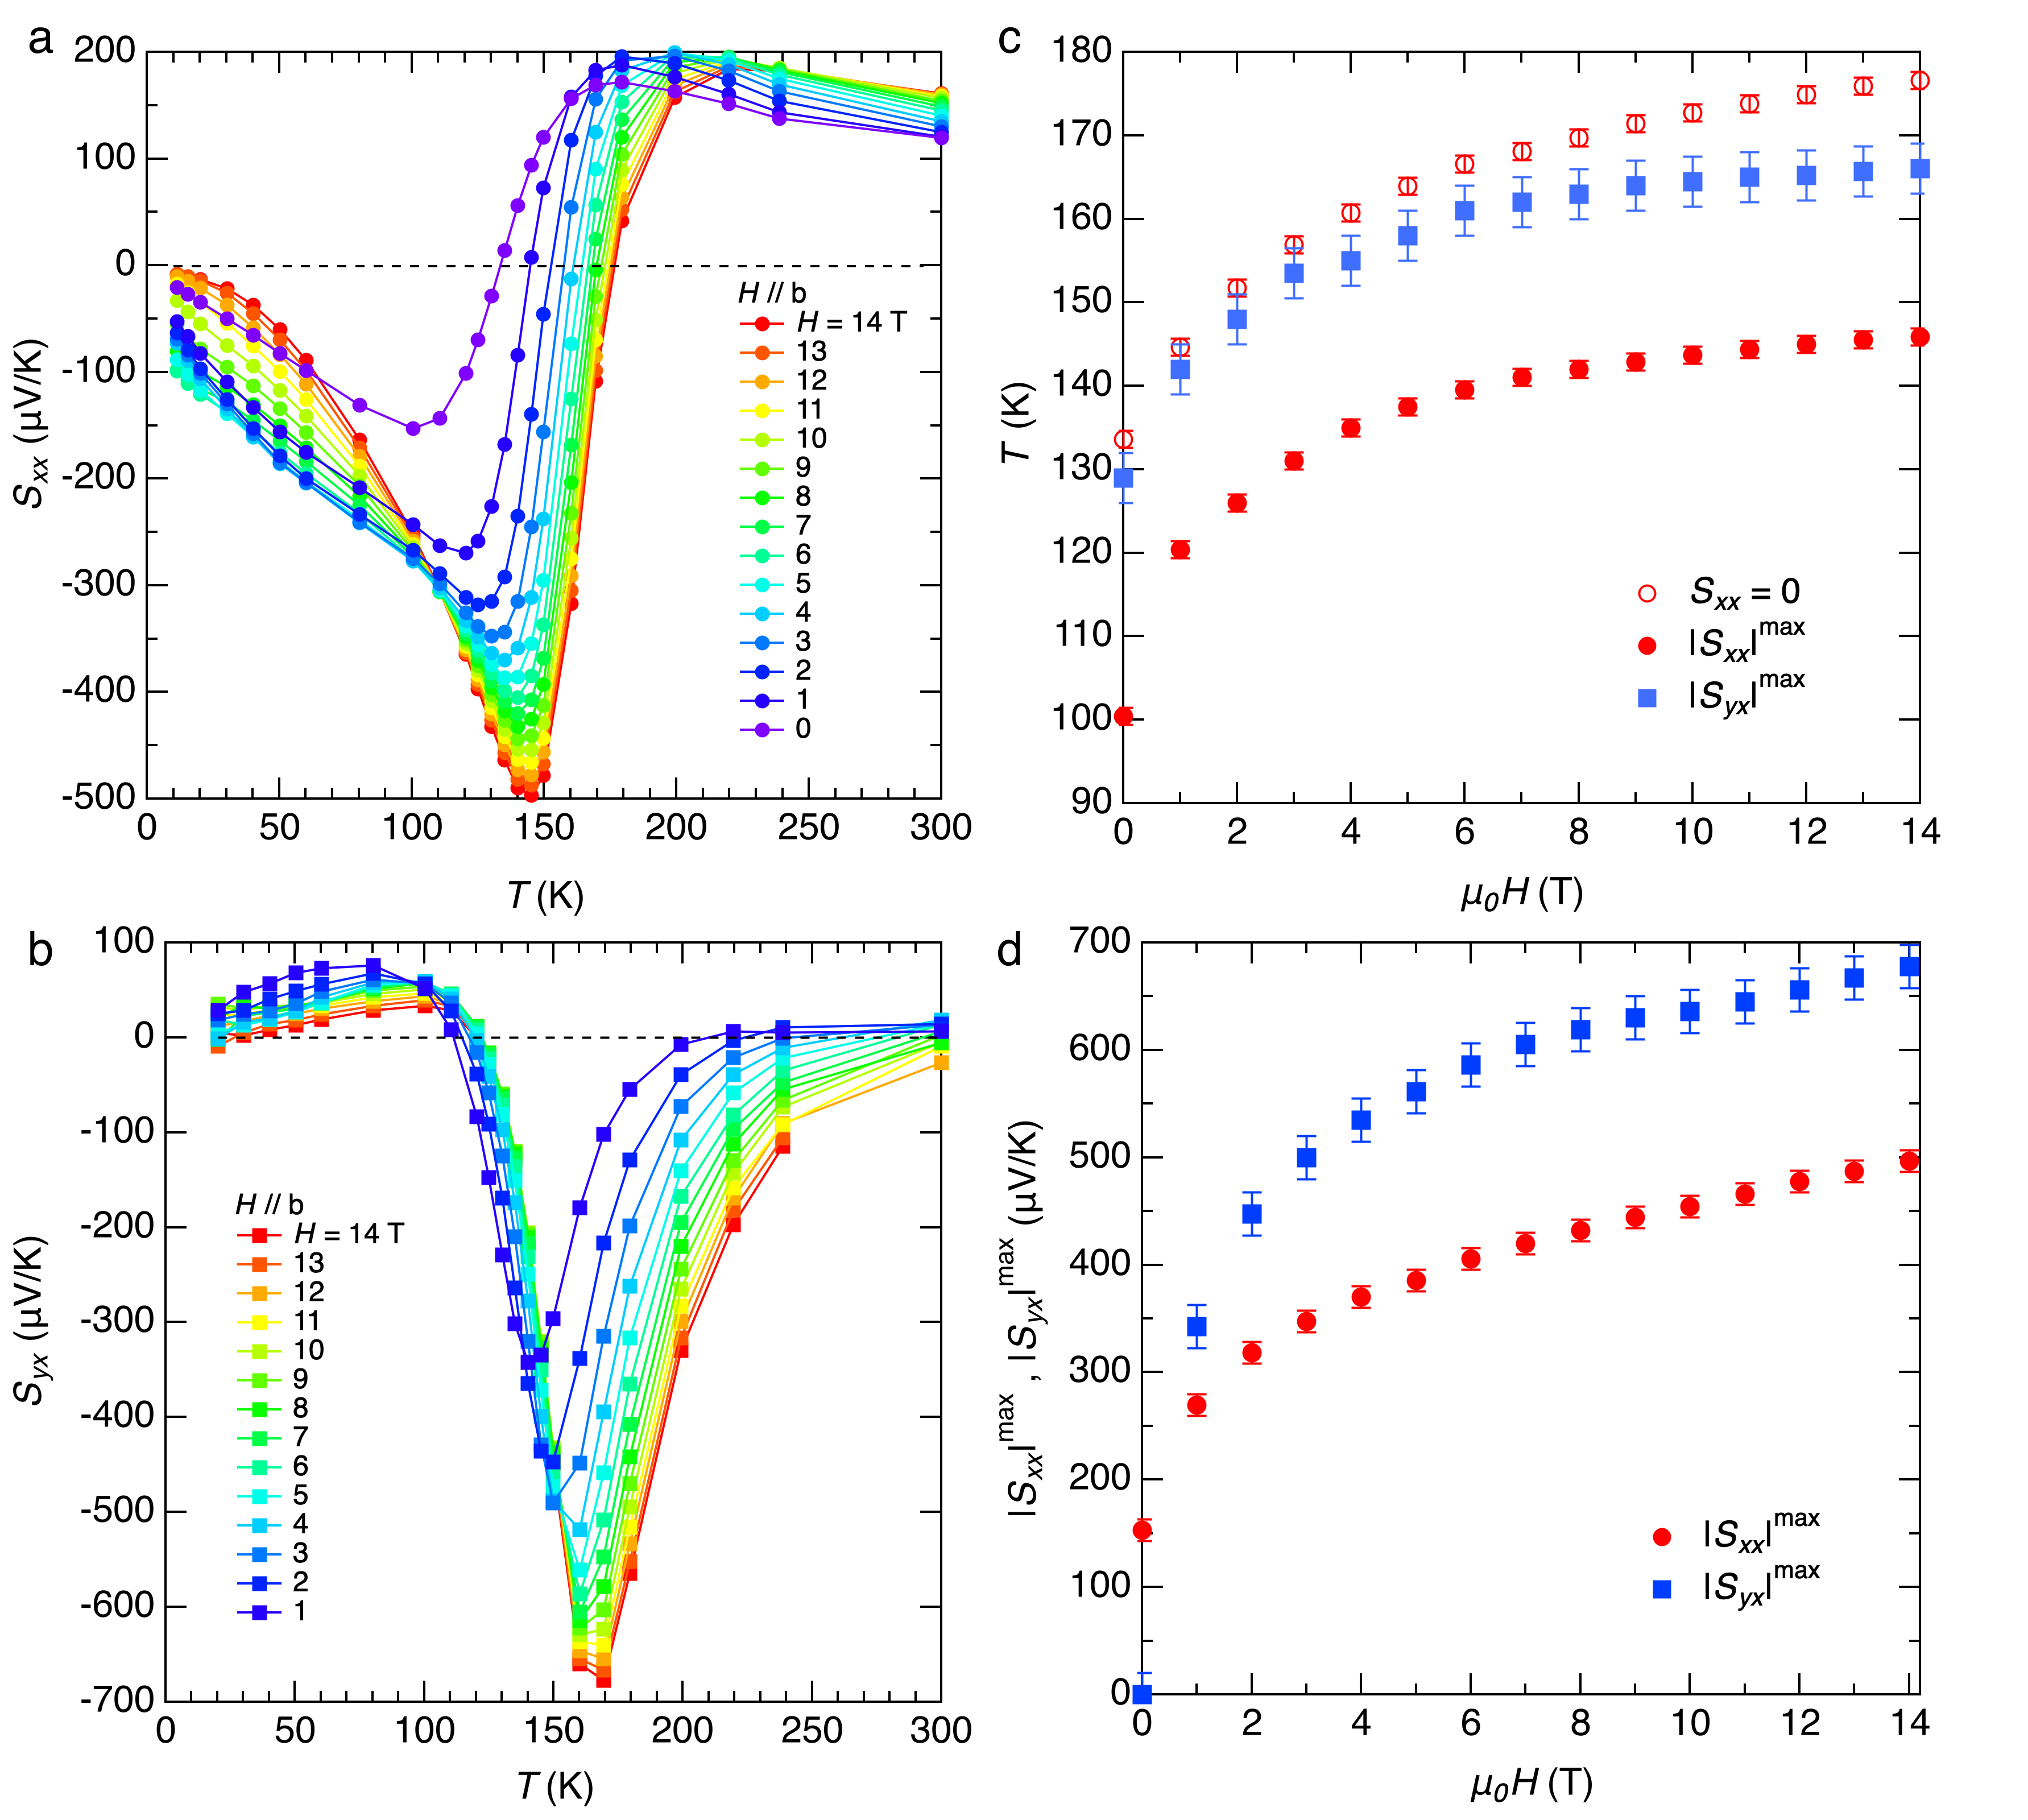
At 100 K 150 K where the thermoelectric response changes most rapidly, we observe a strong enhancement of both and with increasing . As shown in Fig. 4(a,b), peak magnitude of is enhanced more than 3 fold at 14 T, reaching 500 V/K, while that of approaches 700 V/K. The maximum values at fixed for both quantities appear to be monotonically increasing with without saturation at our largest applied fields (see Fig. 4(d)). The Seebeck coefficient of a simple metal is not typically strongly enhanced in field; this suggests a significant modification to the electronic band structure. Given the acute sensitivity of to , one natural origin for this response would be a magnetic field dependence to . To connect these, we plot the dependence of the at which the thermoelectric coefficients peaked and the zero crossing for occur. They show similar behavior with features shifting towards higher temperature for stronger magnetic fields, consistent with a spin down valence band being raised by the Zeeman energy at high temperature. Upon cooling, this would lead to the Fermi level traversing the gap at higher , which can be tracked by a vanishing and maximal . From zero field to T, the observed shift is approximately 40 K, which corresponds to a Fermi level shift of meV given the fitted shift rate from Table 1. This is comparable to the size of the Zeeman splitting meV given the large factor. We note also this is approaching the size of the zero-field energy gap, suggesting a potentially complex evolution at high field. Thus despite their unusually large magnitude, these effects are consistent with the band structure described above. It is of significant interest to pursue these and related materials to higher magnetic fields to test recent predictions for extremely large field-induced figure of merit in systems with highly dispersive bandsSkinner and Fu (2018).
III Conclusion
We have synthesized single crystals of ZrTe5 by chemical vapor transport and probed the band properties via electric and thermoelectric transport, magnetic torque, and tr-ARPES. Both transport and photoemission results indicate a temperature dependent Fermi level shifting across a small semiconducting gap. A semiclassical calculation of the transport coefficients based on such a model describes the observations, yielding mev/K and meV. For below this range, the system behaves as a simple metal. Quantum oscillations and ARPES reveal a consistent picture of an a light-mass (0.028), small ellipsoidal electron pocket with large m/s. The lack of surface states in ARPES is consistent with weak TI regime, supported by our first principles calculations. Finally, a significant enhancement of both the Seebeck and Nernst effect with magnetic field indicates that the band structure is strongly affected in , consistent with the relatively large . Together this study demonstrates that comprehensive experiments and analysis of single crystals of \ceZrTe5 grown in the same manner can produce a clear picture of the underlying physical mechanisms for unusual transport effects. Extending these studies to the recent exotica reported Li et al. (2016b); Liang et al. (2018); Wang et al. (2018); Tang et al. (2019); Zhang et al. (2020) in \ceZrTe5 grown by other methods may elucidate the origin of the rich electronic physics in this system.
IV Methods
IV.1 Crystal Growth
Polycrystalline \ceZrTe5 was obtained by sintering high purity zirconium (99.9999%) and tellurium (99.9999%) at 500 °C . Single crystals were grown by a CVT method with the prepared polycrystalline powder and \ceI2 as the transport agent. The temperature of source zone and growth zone are 520 °C and 475 °C, respectively. The obtained crystal were confirmed as structurally single phase by powder X-ray diffraction.
IV.2 Measurement
Electrical and thermoelectric transport measurements were performed in commercial cryostats equipped with superconducting magnets. Electrical transport is measured with a standard Hall bar configuration of six gold wire contacts. Thermoelectric transport is measured with a static temperature gradient along the axis driven a heater directly attached to one end of the crystal. Temperature gradient is detected by a pair of thermocouple and electrical voltage drops are detected by two pairs of electrical contacts along and axis which gives Seebeck and Nernst signal respectively. Torque measurements are done with a home-made cantilever magnetometer.
Photoemission measurement was done at 6 eV photon energy. The sample was cleaved in situ under a pressure of torr and a temperature of 35 K. In time-resolved measurements the system was optically pumped with 1.6 eV laser pulses before subsequent probe pulses.
IV.3 Density Functional Theory Calculations
We performed the density functional theory (DFT) calculations implemented in Vienna Ab initio Simulation Package (VASP) code Kresse and Furthmüller (1996a, b), with the Projector augmented wave method (PAW) Blöchl (1994) for the pseudo potential formalism. The ground state for the ZrTe5 primitive unit cell is converged with exchange-correlation energies parametrized by Perdew, Burke and Ernzerhof (PBE) Perdew et al. (1996), a 300 eV cutoff energy for the plane-wave-basis set, and a Monkhorst-Pack grid sampling Monkhorst and Pack (1976) in the reciprocal space. The topological invariants are computed using the Fu-Kane parity formula with inversion symmetry Fu and Kane (2007).
V Data Availability
The data that support the findings of this study are available from the corresponding author on reasonable request.
References
- Weng et al. (2014) H. Weng, X. Dai, and Z. Fang, Phys. Rev. X 4, 011002 (2014).
- Okada et al. (1980) S. Okada, T. Sambongi, and M. Ido, Journal of the Physical Society of Japan 49, 839 (1980).
- Okada et al. (1982) S. Okada, T. Sambongi, M. Ido, Y. Tazuke, R. Aoki, and O. Fujita, Journal of the Physical Society of Japan 51, 460 (1982), https://doi.org/10.1143/JPSJ.51.460 .
- Jones et al. (1982) T. Jones, W. Fuller, T. Wieting, and F. Levy, Solid State Communications 42, 793 (1982).
- Fan et al. (2017) Z. Fan, Q.-F. Liang, Y. Chen, S.-H. Yao, and J. Zhou, Scientific reports 7, 45667 (2017).
- Manzoni et al. (2015) G. Manzoni, A. Sterzi, A. Crepaldi, M. Diego, F. Cilento, M. Zacchigna, P. Bugnon, H. Berger, A. Magrez, M. Grioni, and F. Parmigiani, Phys. Rev. Lett. 115, 207402 (2015).
- Moreschini et al. (2016) L. Moreschini, J. C. Johannsen, H. Berger, J. Denlinger, C. Jozwiak, E. Rotenberg, K. S. Kim, A. Bostwick, and M. Grioni, Phys. Rev. B 94, 081101 (2016).
- Wu et al. (2016) R. Wu, J.-Z. Ma, S.-M. Nie, L.-X. Zhao, X. Huang, J.-X. Yin, B.-B. Fu, P. Richard, G.-F. Chen, Z. Fang, X. Dai, H.-M. Weng, T. Qian, H. Ding, and S. H. Pan, Phys. Rev. X 6, 021017 (2016).
- Manzoni et al. (2016) G. Manzoni, L. Gragnaniello, G. Autès, T. Kuhn, A. Sterzi, F. Cilento, M. Zacchigna, V. Enenkel, I. Vobornik, L. Barba, F. Bisti, P. Bugnon, A. Magrez, V. N. Strocov, H. Berger, O. V. Yazyev, M. Fonin, F. Parmigiani, and A. Crepaldi, Phys. Rev. Lett. 117, 237601 (2016).
- Manzoni et al. (2017) G. Manzoni, A. Crepaldi, G. Autès, A. Sterzi, F. Cilento, A. Akrap, I. Vobornik, L. Gragnaniello, P. Bugnon, M. Fonin, et al., Journal of Electron Spectroscopy and Related Phenomena 219, 9 (2017).
- Zhang et al. (2017a) Y. Zhang, C. Wang, L. Yu, G. Liu, A. Liang, J. Huang, S. Nie, X. Sun, Y. Zhang, B. Shen, et al., Nature communications 8, 15512 (2017a).
- Xiong et al. (2017) H. Xiong, J. A. Sobota, S.-L. Yang, H. Soifer, A. Gauthier, M.-H. Lu, Y.-Y. Lv, S.-H. Yao, D. Lu, M. Hashimoto, P. S. Kirchmann, Y.-F. Chen, and Z.-X. Shen, Phys. Rev. B 95, 195119 (2017).
- Li et al. (2016a) X.-B. Li, W.-K. Huang, Y.-Y. Lv, K.-W. Zhang, C.-L. Yang, B.-B. Zhang, Y. B. Chen, S.-H. Yao, J. Zhou, M.-H. Lu, L. Sheng, S.-C. Li, J.-F. Jia, Q.-K. Xue, Y.-F. Chen, and D.-Y. Xing, Phys. Rev. Lett. 116, 176803 (2016a).
- Chen et al. (2015a) R. Y. Chen, S. J. Zhang, J. A. Schneeloch, C. Zhang, Q. Li, G. D. Gu, and N. L. Wang, Phys. Rev. B 92, 075107 (2015a).
- Chen et al. (2015b) R. Y. Chen, Z. G. Chen, X.-Y. Song, J. A. Schneeloch, G. D. Gu, F. Wang, and N. L. Wang, Phys. Rev. Lett. 115, 176404 (2015b).
- Jiang et al. (2017) Y. Jiang, Z. L. Dun, H. D. Zhou, Z. Lu, K.-W. Chen, S. Moon, T. Besara, T. M. Siegrist, R. E. Baumbach, D. Smirnov, and Z. Jiang, Phys. Rev. B 96, 041101 (2017).
- Chen et al. (2017) Z.-G. Chen, R. Y. Chen, R. D. Zhong, J. Schneeloch, C. Zhang, Y. Huang, F. Qu, R. Yu, Q. Li, G. D. Gu, and N. L. Wang, Proceedings of the National Academy of Sciences 114, 816 (2017), https://www.pnas.org/content/114/5/816.full.pdf .
- Zheng et al. (2016) G. Zheng, J. Lu, X. Zhu, W. Ning, Y. Han, H. Zhang, J. Zhang, C. Xi, J. Yang, H. Du, K. Yang, Y. Zhang, and M. Tian, Phys. Rev. B 93, 115414 (2016).
- Liu et al. (2016) Y. Liu, X. Yuan, C. Zhang, Z. Jin, A. Narayan, C. Luo, Z. Chen, L. Yang, J. Zou, X. Wu, et al., Nature communications 7, 12516 (2016).
- Zheng et al. (2017) G. Zheng, X. Zhu, Y. Liu, J. Lu, W. Ning, H. Zhang, W. Gao, Y. Han, J. Yang, H. Du, K. Yang, Y. Zhang, and M. Tian, Phys. Rev. B 96, 121401 (2017).
- Zhang et al. (2017b) J. L. Zhang, C. Y. Guo, X. D. Zhu, L. Ma, G. L. Zheng, Y. Q. Wang, L. Pi, Y. Chen, H. Q. Yuan, and M. L. Tian, Phys. Rev. Lett. 118, 206601 (2017b).
- Li et al. (2016b) Q. Li, D. E. Kharzeev, C. Zhang, Y. Huang, I. Pletikosić, A. Fedorov, R. Zhong, J. Schneeloch, G. Gu, and T. Valla, Nature Physics 12, 550 (2016b).
- Liang et al. (2018) T. Liang, J. Lin, Q. Gibson, S. Kushwaha, M. Liu, W. Wang, H. Xiong, J. A. Sobota, M. Hashimoto, P. S. Kirchmann, et al., Nature Physics 14, 451 (2018).
- Wang et al. (2018) H. Wang, H. Liu, Y. Li, Y. Liu, J. Wang, J. Liu, J.-Y. Dai, Y. Wang, L. Li, J. Yan, et al., Science advances 4, eaau5096 (2018).
- Tang et al. (2019) F. Tang, Y. Ren, P. Wang, R. Zhong, J. Schneeloch, S. A. Yang, K. Yang, P. A. Lee, G. Gu, Z. Qiao, et al., Nature 569, 537 (2019).
- Zhang et al. (2020) W. Zhang, P. Wang, B. Skinner, R. Bi, V. Kozii, C.-W. Cho, R. Zhong, J. Schneeloch, D. Yu, G. Gu, et al., Nature communications 11, 1 (2020).
- Lv et al. (2017) Y.-Y. Lv, F. Zhang, B.-B. Zhang, B. Pang, S.-H. Yao, Y. Chen, L. Ye, J. Zhou, S.-T. Zhang, and Y.-F. Chen, Journal of Crystal Growth 457, 250 (2017).
- Mutch et al. (2019) J. Mutch, W.-C. Chen, P. Went, T. Qian, I. Z. Wilson, A. Andreev, C.-C. Chen, and J.-H. Chu, Science advances 5, eaav9771 (2019).
- McIlroy et al. (2004) D. McIlroy, S. Moore, D. Zhang, J. Wharton, B. Kempton, R. Littleton, M. Wilson, T. Tritt, and C. Olson, Journal of Physics: Condensed Matter 16, L359 (2004).
- Zhou et al. (2016) Y. Zhou, J. Wu, W. Ning, N. Li, Y. Du, X. Chen, R. Zhang, Z. Chi, X. Wang, X. Zhu, P. Lu, C. Ji, X. Wan, Z. Yang, J. Sun, W. Yang, M. Tian, Y. Zhang, and H.-k. Mao, Proceedings of the National Academy of Sciences 113, 2904 (2016), https://www.pnas.org/content/113/11/2904.full.pdf .
- (31) See Supplementary Materials .
- Kittel et al. (1996) C. Kittel, P. McEuen, and P. McEuen, Introduction to solid state physics, Vol. 8 (Wiley New York, 1996).
- Shoenberg (1984) D. Shoenberg, Magnetic Oscillations in Metals, Arnold and Caroline Rose Monograph Series of the American So (Cambridge University Press, 1984).
- Skinner and Fu (2018) B. Skinner and L. Fu, Science advances 4, eaat2621 (2018).
- Kresse and Furthmüller (1996a) G. Kresse and J. Furthmüller, Phys. Rev. B 54, 11169 (1996a).
- Kresse and Furthmüller (1996b) G. Kresse and J. Furthmüller, Comput. Mater. Sci. 6, 15 (1996b).
- Blöchl (1994) P. E. Blöchl, Phys. Rev. B 50, 17953 (1994).
- Perdew et al. (1996) J. P. Perdew, K. Burke, and M. Ernzerhof, Phys. Rev. Lett. 77, 3865 (1996).
- Monkhorst and Pack (1976) H. J. Monkhorst and J. D. Pack, Phys. Rev. B 13, 5188 (1976).
- Fu and Kane (2007) L. Fu and C. L. Kane, Phys. Rev. B 76, 045302 (2007).
VI Acknowledgements
This work was supported primarily by the U.S. Department of Energy, Office of Science, Basic Energy Sciences, under Award Number DE-SC0020149 (electrical measurements, tr-ARPES, and analysis) and also by the Gordon and Betty Moore Foundation?s EPiQS Initiative, Grant GBMF9070 to J.G.C. (materials synthesis and DFT calculations).
VII Author Contributions
J. Z. and T. S. synthesized the single crystals. J. Z. performed the transport and torque measurements and analyzed the subsequent data. C. L. and F. M. performed the tr-ARPES measurements and analyzed the subsequent data. S. F. performed the density functional theory calculations. J. Z. wrote the manuscript with input from all authors. N. G. and J. G. C. coordinated the project.