Exploring Apache Incubator Project Trajectories with APEX
Abstract.
Open Source Software (OSS) is a major component of our digital infrastructure, yet more than 80% of such projects fail. Seeking less uncertainty, many OSS projects join established software communities, e.g., the Apache Software Foundation (ASF), with established rules and community support to guide projects toward sustainability. In their nascent stage, ASF projects are incubated in the ASF incubator (ASFI), which provides systematic mentorship toward long-term sustainability. Projects in ASFI eventually conclude their incubation by either graduating, if successful, or retiring, if not.
Time-stamped traces of developer activities are publicly available from ASF, and can be used for monitoring project trajectories toward sustainability. Here we present a web app dashboard tool, APEX, that allows internal and external stakeholders to monitor and explore ASFI project sustainability trajectories, including social and technical networks.
1. Introduction
In spite of the large amounts of resource put in them, many OSS projects end up on trajectories that are ultimately not sustainable. In recent work we showed that OSS project sustainability can be effectively predicted early on in project development from longitudinal project and process metrics supplemented by socio-technical network metrics (developer communications and code contributions), specific to the Apache Software Foundation (ASF) (yin2021forecasting, ). ASF, as one of the most popular OSS communities, provides specific guidelines and establishes regulations to help OSS projects eventually become self-sustainable. Nascent projects with ASF aspirations are housed in the Apache Software Foundation Incubator (ASFI) for a period of time, after which they are graduated into ASF if they are found to be sustainable, otherwise they get retired.
Promisingly, our work (yin2021forecasting, ) implied that monitoring and reflecting on their sustainability forecast can enable projects to act proactively, and potentially correct downturns in the forecasts. To enable such monitoring in practice, here we present a dashboard tool, APEX, intended for nascent projects in the Apache Software Foundation Incubator to monitor their sustainability trajectories over time, thus allowing for timely course corrections and for potentially improving the likelihood of project graduation into ASF. Our motivation goes beyond ASFI as many nascent OSS projects fall outside the ASF domain, and its well developed community support structure. Self-monitoring and self-correction may be even more pertinent to those. While intended for ASF projects specifically, APEX is designed in a generic way and thus can easily accommodate data from repositories other than ASF.
Related Work ASF provides a monitoring tool, Clutch111Clutch Analysis: http://incubator.apache.org/clutch/, to help OSS developers self-reflect and take actions when their projects are experiencing issues. The Clutch tool uses colors to signal the status of project metrics, e.g., missing documentation, lack of new committers, etc. Although it works well for its intended use, Clutch’s analysis is of limited use as a real-time monitoring tool since (1) it is not project-specific, i.e., all projects follow the same standards for all features regardless of their project size or context; (2) it does not consider historical records; and (3) it does not make actionable suggestions. Our APEX tool complements the existing Clutch tool by providing additional analytics power for understanding the longitudinal socio-technical aspects of projects. It also can yield potential actionable insights.
There are other projects that focus on analytics for OSS sustainability outside of ASF domain. E.g., the Augur and GrimoireLab within the CHAOSS (Community Health Analytics Open Source Software) project222CHAOSS community https://chaoss.community/, provide a toolbox for project sustainability self-monitoring. However, unlike APEX, they don’t provide a synthesis of metrics into a longitudinal sustainability forecasts, or allow deep dives into email and commits.
Next, we first introduce APEX, and then describe use cases that demonstrate its utility in a) monitoring for ASF project downturn events, b) identifying longer term engagements between developers, and c) within-ASF project comparisons. The APEX app is available at https://ossustain.github.io/APEX/. Code and data are available at https://github.com/ossustain/APEX/.
2. Data and Implementation
Data Source The APEX pipeline depends on four types of data: basic project information, periodic project reports, email communications, and code commits. We use our previously published dataset from ASFI (yin2021apache, ) to obtain the emails and commits. The dataset comprised 211 graduated and 62 retired incubator projects (in total of 273), with 1,201,746 emails, and 3,654,196 commits, with each project spending on average 22.32 months in incubation.
We scraped project information (name, mentors, dates, status) from the project’s ASF Incubator homepage333ASF incubator: http://incubator.apache.org/projects/, using Python’s BeautifulSoup Package. The Apache mailing list archive,contains full historical information for all projects including project participants, mentors who assisted with the projects, project reports, all emails, and all commits. To obtain developer emails we frequently had to backfill partial email addresses by writing scripts to search for the partial email throughout the email text. We used the same approach to identify unique committers that may have used aliases.
Social and Technical Networks From the ASF incubator data we derive two kinds of longitudinal networks for each project, for each month: a social and a technical. The social networks have directed edges between developer, derived from the email archives, using the method by Bird et al. (bird2006mining, ). We present the social networks in a bipartite graph layout, using Sankey diagram (riehmann2005interactive, ). There are two sets of nodes: on the left are all senders of messages in a given month. On the right are those who either received a direct message, or, in the case of a broadcast message, those who have responded to that message. The edges are directed from the sender to the receiver node, except for the broadcast messages where the edges are directed from a node that has sent an email to a node that has replied to that email (bird2006mining, ).
The technical network is also a bipartite graph with two sets of nodes: on the left are the developers that have made commits in a given month and on the right are all the file types committed to in that month (e.g., .java, .html, etc., based on their file extensions). The edges connect the developers to the file types they committed to in that month. We aggregate the network edges in a monthly manner, i.e., the longitudinal networks of each project consist of monthly network snapshots.
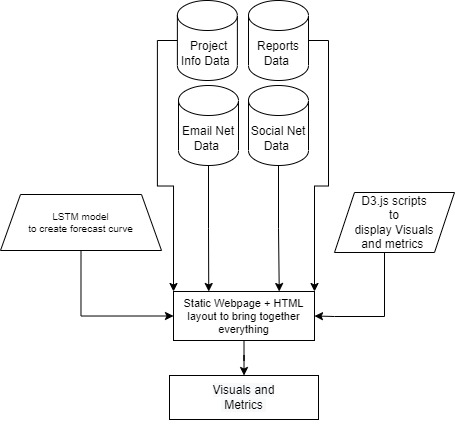
Implementation Technology The APEX tool design and pipeline is illustrated in Figure 1. To implement the front-end of APEX we use the D3 JavaScript library (https://d3js.org/). D3 uses visual layouts and an associated tool-set to improve front-end efficiency. D3 also provides developers with design flexibility through standardized data manipulation operations. Additionally, one of D3’s foci is transitions and animation. This allows our dashboard to quickly adapt to changing inputs, e.g., a change of the current month. To provide interactivity of our tool, we use the SVG rendering technology, which is based on Document Object Model (DOM) operations and supports precise user interaction. We also make use of jQuery extensively. jQuery is a JavaScript library that helps simplify and standardize interactions between JavaScript code and HTML elements. We use jQuery to design event listeners: processes in JavaScript that wait for an event to occur. This has allowed us to create a seamless dynamic experience throughout the dashboard, where a change in one section adjusts all related sections and visuals accordingly. We have also made use of a lightweight range slider with multi-touch support called noUIslider, and it has an in-built event listener function allowing integration with the rest of the elements in the dashboard. Frequent DOM operations are costly, negatively impacting the user experience by screen flashing and stuttering during the interactions. We relax this cost by keeping each project and month stored in separate json files.
Sustainability Forecasting APEX features the AI based sustainability forecasting model by Yin et al. (yin2021forecasting, ). They implemented a 3-layer LSTM model: a neurons LSTM layer with a rate drop-out layer, and then followed by a dense layer with the softmax function to yield the predicted likelihood of project graduation. In the experimental setup, the graduated projects are encoded as 1; retired projects as 0. During training, the monthly socio-technical networks variables (e.g., number of nodes/edges, clustering coefficient, and mean degree in the networks) of each project were fed into the model. This LSTM neural network based model gives a sustainability forecast in each month of the project development. More experimental details can be found in the paper (yin2021forecasting, ).
3. Dashboard Elements
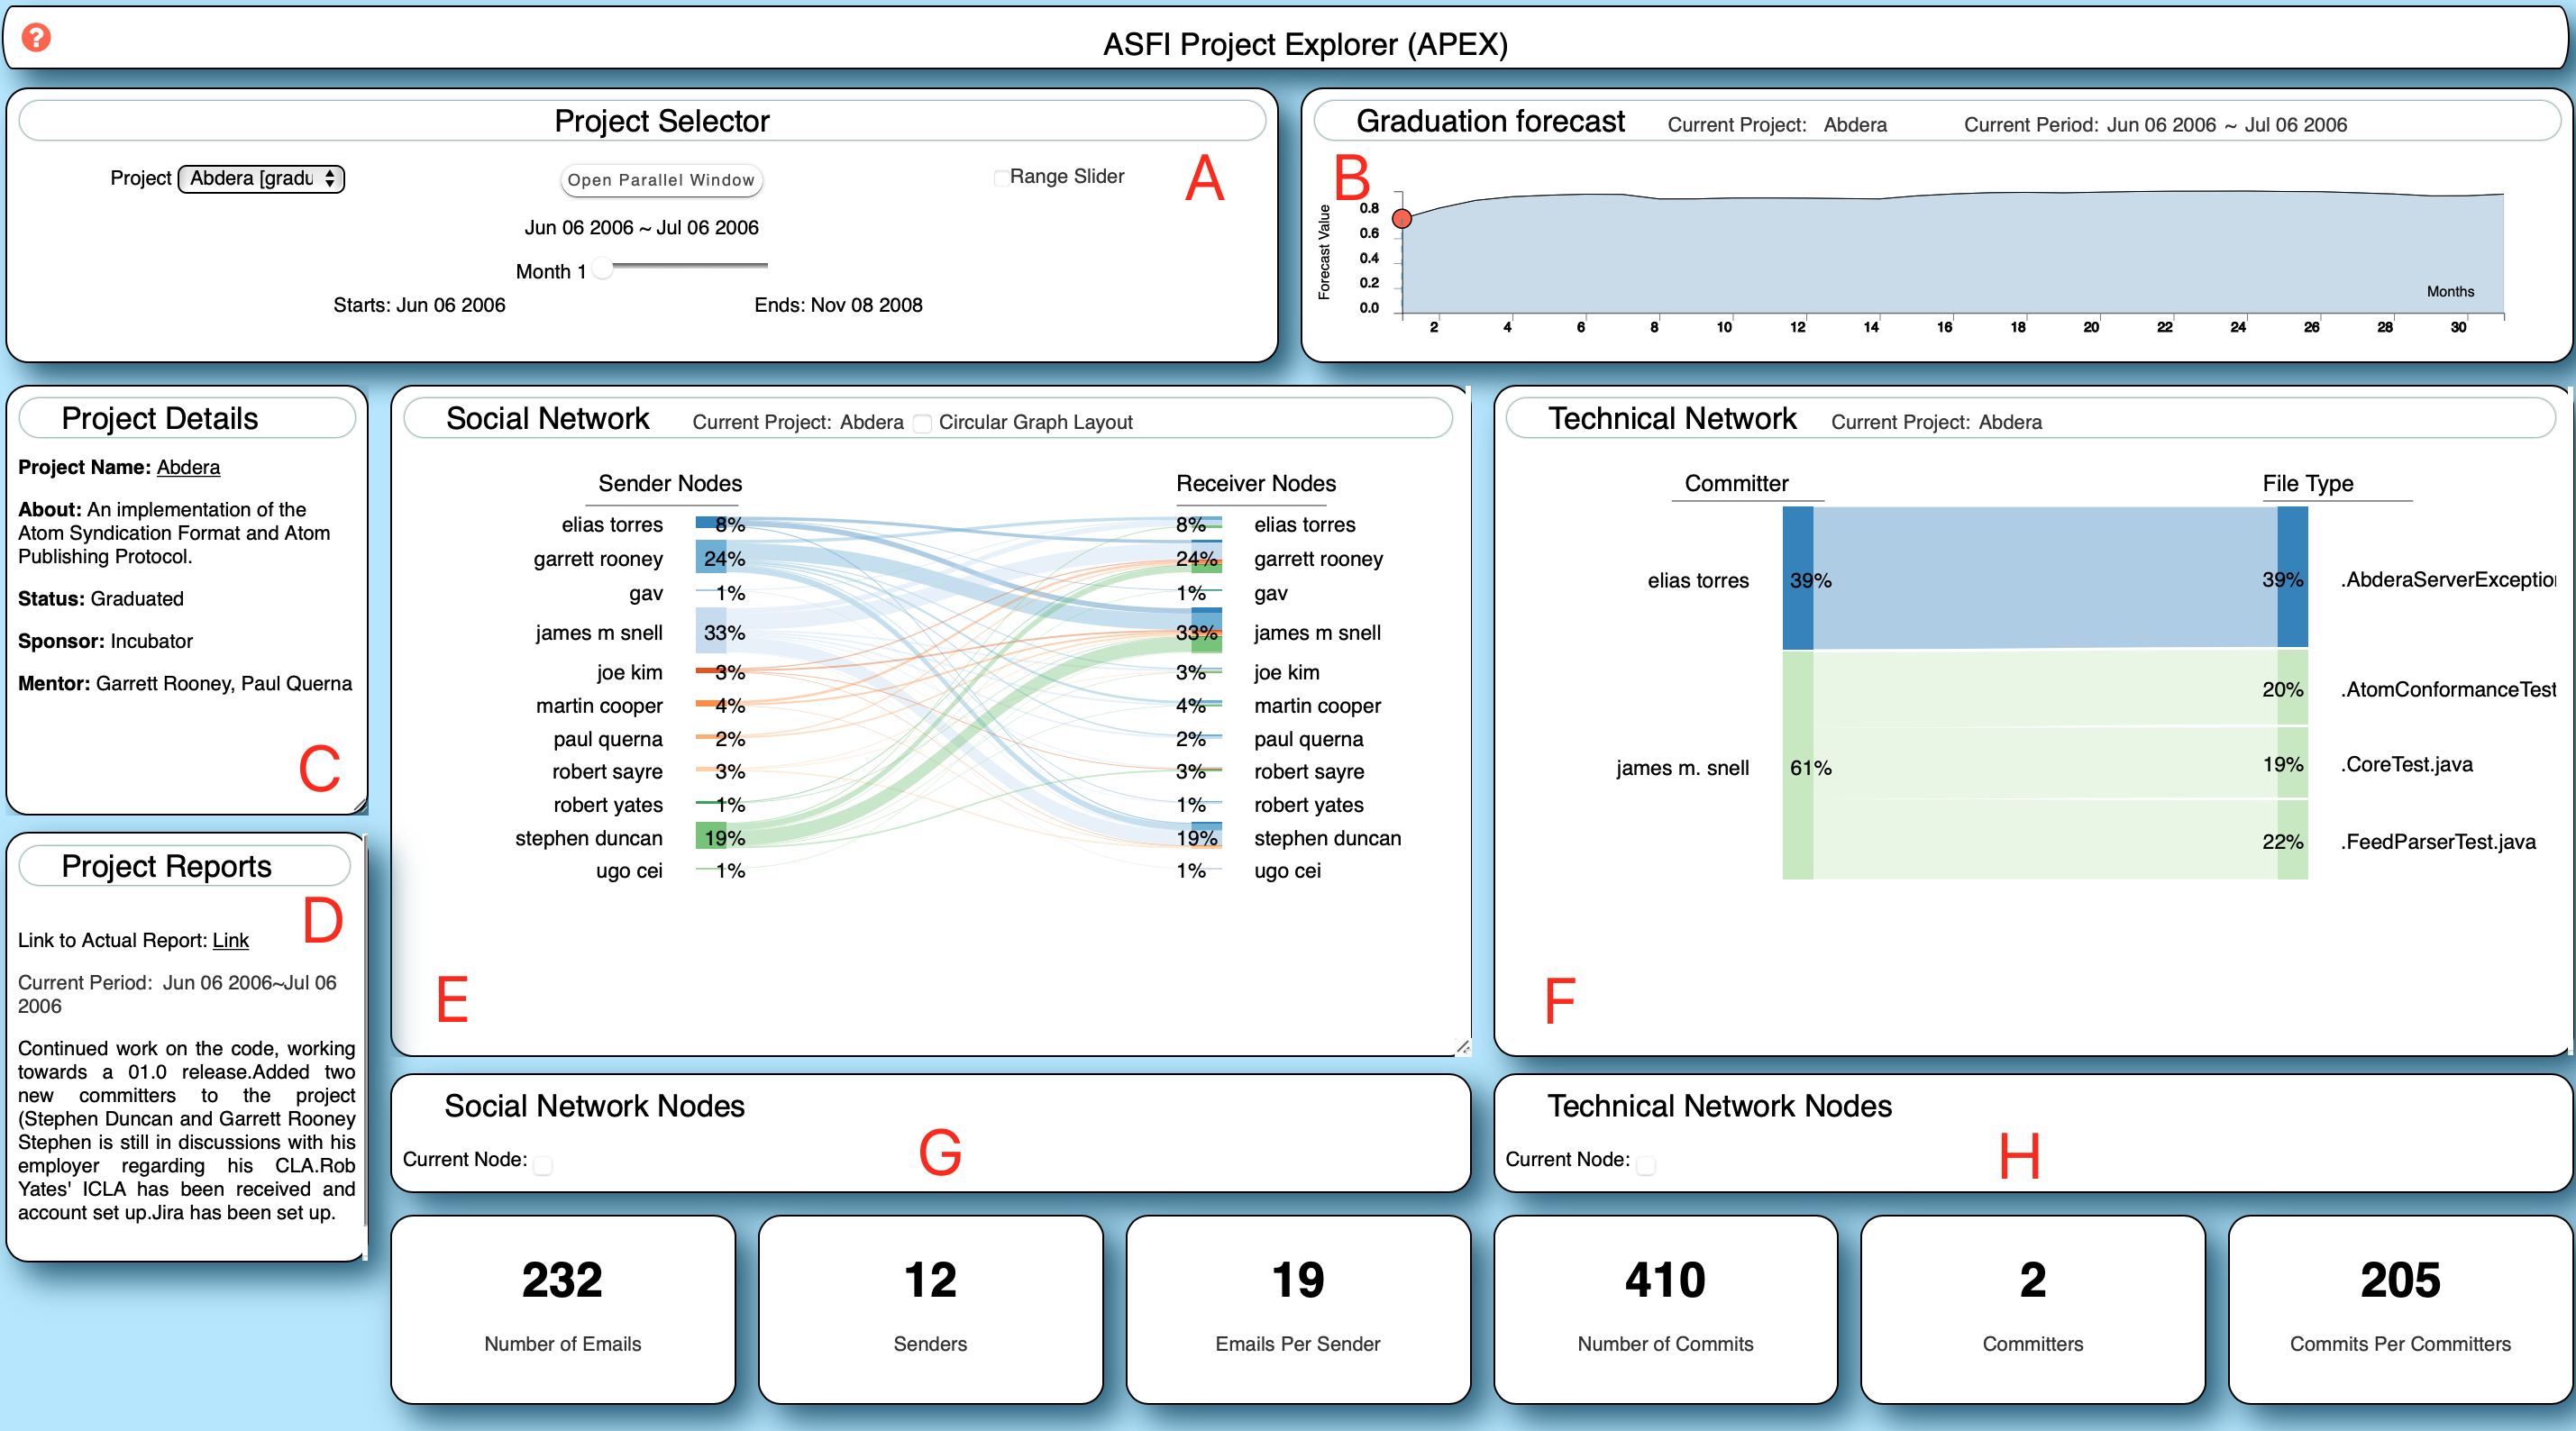
Dashboard Panes. There are four main sections to the dashboard, see Figure 2: (1) top pane (panes A,B), (2) left pane (panes C,D), (3) middle pane (panes E and G) (4) right pane (panes F and H).
The top pane has two parts to it. The left side (A) allows the user to select a project of interest in the drop-down menu and a specific month through the month slider. Based on these inputs, the other panes change dynamically to display the respective information for the selected project and month. In addition, this section also allows the user to toggle a checkbox to switch to a range slider to display a range of months, e.g., 1-5 months, instead of a single month. To the right (B) is the sustainability forecast visual, which depicts the sustainability forecast for the project, ranging from 0 (not sustainable) to 1 (sustainable), for any given month.
Below those, the left pane consists of two distinct sub-sections: the project info pane (C) and the project report pane (D). The former shows the project name, a link to the official website, and the project’s status (i.e., graduated or retired). The ASF sponsor’s name (if anyone in particular, otherwise ‘incubator’) is displayed below that. At the bottom is a short introduction to the selected project. Below that, in the project’s report pane (D), we present the report submitted by the project to the ASFI, for the given month.
The middle pane consists of the social network visual on top (E) and its related metrics below it (G). The social bipartite graph is presented as a Sankey diagram (riehmann2005interactive, ), the height of a node illustrating the % (relative to the total) of emails sent (left) or received/replied-to (right) by that developer in a given month. The sizes of the flows sre proportional to the number of emails exchanged between the developers. Hovering over a developer’s name emphasizes all developers that have received a directed email, or responded to a broadcast, from that developer.
In the right pane, on top is the technical network of developers who have committed to files (F), and their metrics are below (H). For the visual, we also use a bipartite Sankey diagram. On the left is a list of developers, while the file type (i.e., extension) of the files committed to is on the right. The percentage of one’s efforts relative to others’ is shown on the left, with the sizes of the flows proportional to that. Hovering over a developer’s name, or, respectively, a file type, emphasizes additional information: all file types a developer has touched, or all developers that have touched that file type along with their % contribution, respectively.
Additionally, by hovering over and clicking on a developer’s name in the social, respectively the technical networks, we get a button with their name under the network, which when clicked opens a window with a list of all their emails, respectively commits, in that month. They appear in a pop-up window next to the dashboard.
4. Use Case Examples
APEX conveniently shows in one place the project info, monthly aggregated code commits, email communications, and two unique features of ASF, the periodic report info and the graduation status. Such rich and fine-grained information can enable researchers and practitioners to study the trajectory of a given project by showing changes over time, including identifiable patterns and up/down trends, in the socio-technical networks and the sustainabiity forecasts.
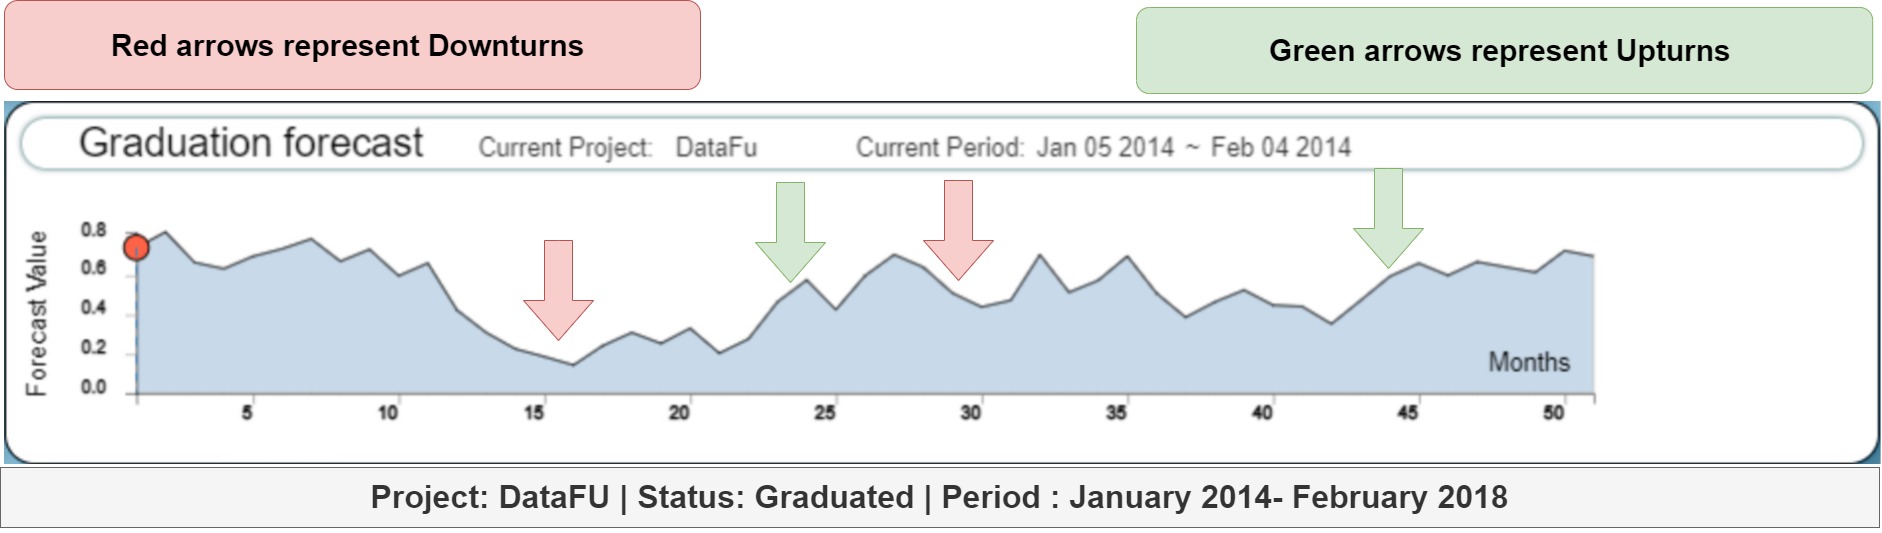
Use Case I: Studying Sustainability Turning Points Patterns and trends in the longitudinal socio-technical networks can be studied to identify causes for downturns in the sustainability forecast, allowing APEX users to be proactive with changing project trajectories. For example, as shown in Figure 3, for the selected project DataFu, by simply eyeballing we can identify that there is a big downturn around month 12. Some possible reasons for this could be that (1) The project just launched a big release; or (2) Some core developers left the projects. Going through the email discussions in months adjacent to the downturns may offer reasons for the changes, which in this case is likely the latter.
Thus, the monthly social-technical networks combined with the real-time sustainability forecast can allow practitioners and researchers to monitor for downturn events and react proactively.
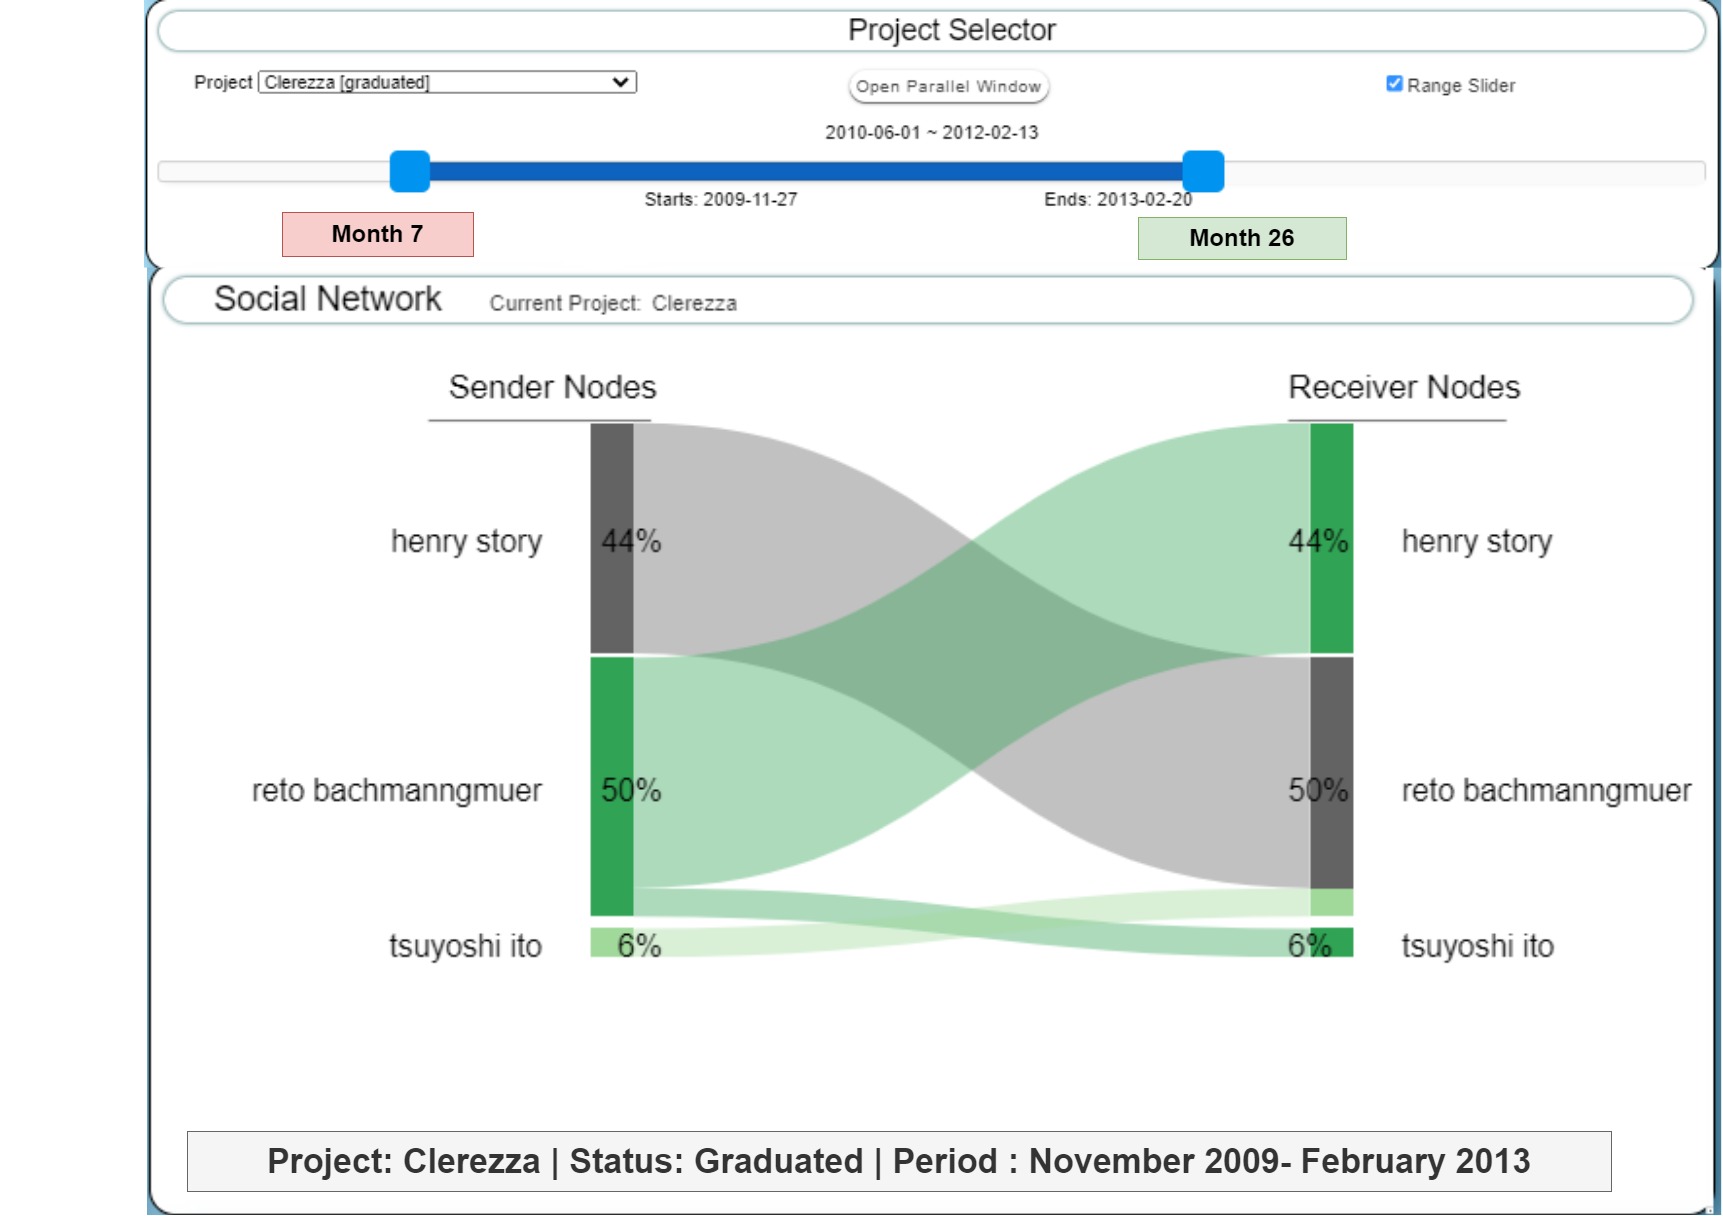
Use Case II: Studying Different Length Engagements APEX allows aggregating the networks over a range of months. This allows the study and comparison of different length engagements, both social and technical in nature. This can be done by enabling the range slider, which allows multiple months to be selected at once, yielding a time range for the nodes and edges in the networks. Once the range is specified, the metrics and the visuals are adjusted to display multiple consecutive months of interactions.
An example of a social network over a longer range is shown in Figure 4. There we see thicker and thinner edges; the former indicate communications that recur over multiple months, attesting to a longer term engagement between those developers, i.e., recurring communication. By comparing the short-term and long-term social-technical networks, we can identify recurring patterns over longer periods of time during the project incubation.
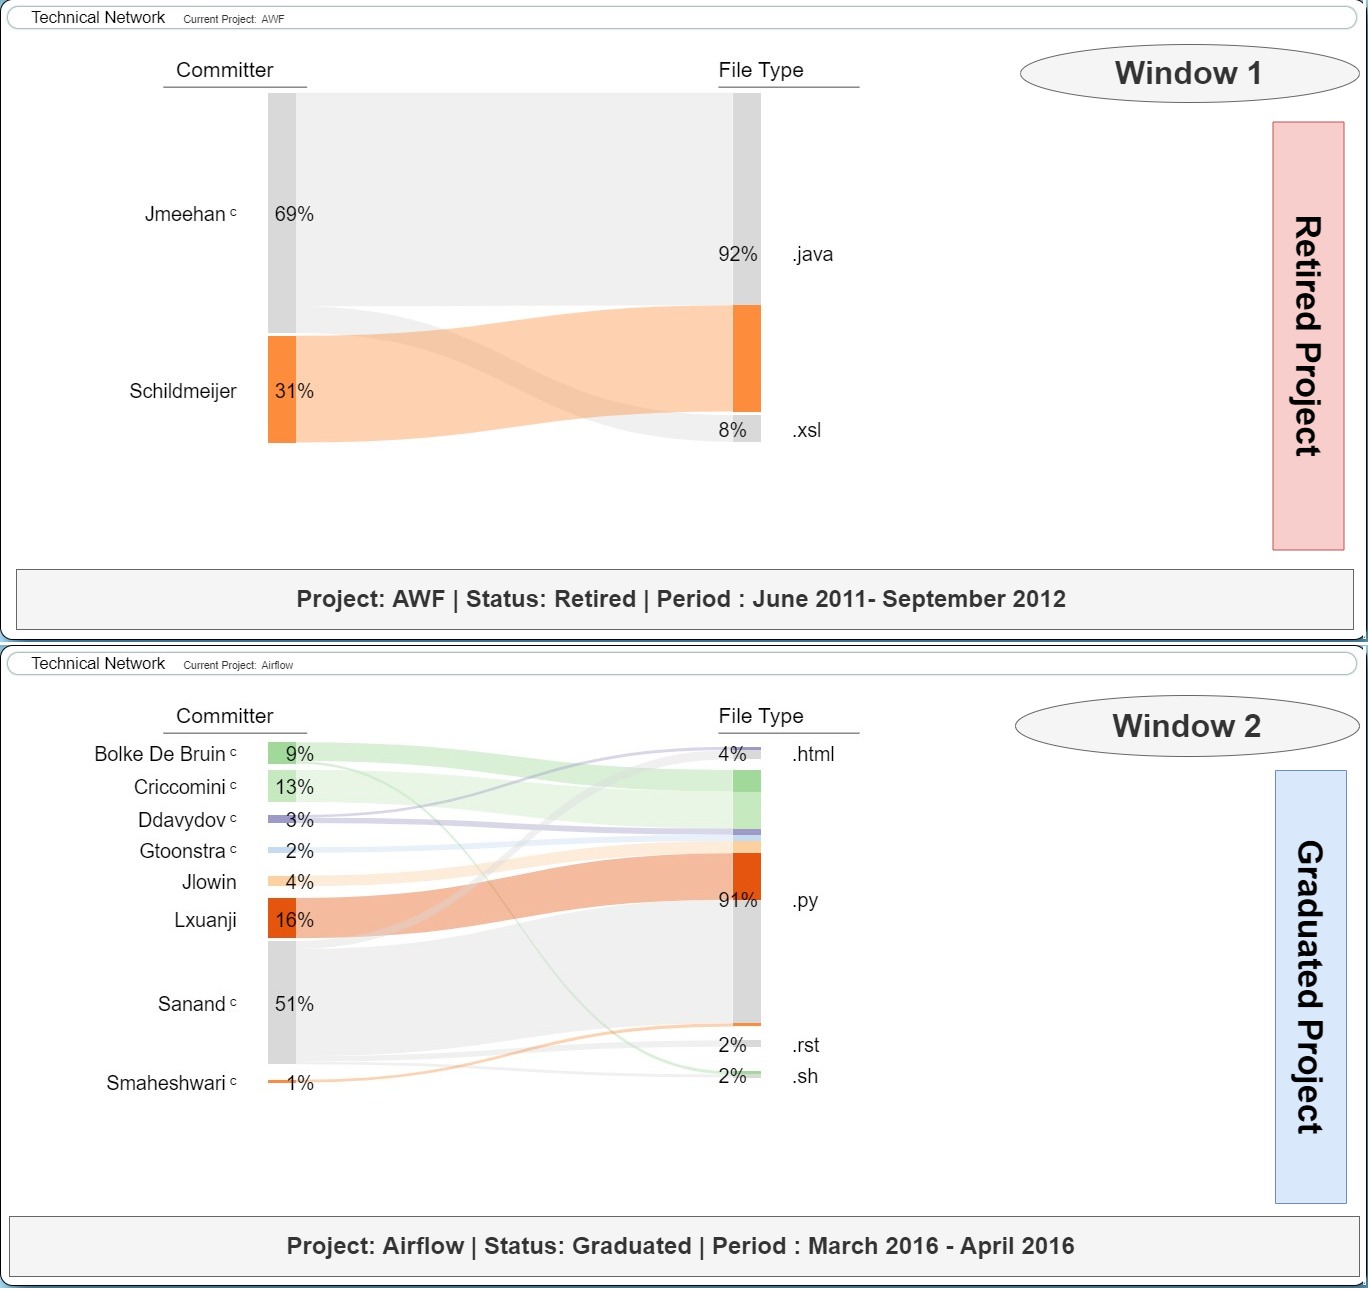
Use Case III: Cross-Project Comparison APEX also allows users to compare and contrast two projects by opening up parallel windows of our dashboard. Thereby, researchers can explore multiple projects simultaneously to generate hypotheses about relationships between their socio-technical structure and graduation status. E.g., Figure 5 shows the technical networks of two projects, one graduated and the other retired. An immediate pattern that emerges is that more developers are committing code changes in the graduated project than in the retired one. Researchers can followup on this hypothesis by looking into the driving factors behind it, using, e.g., productivity studies, or topics of discussions.
5. Using APEX Beyond ASF
We have designed APEX to serve ASFI projects that are early in their incubation to monitor and reflect on their progress in a more agile way than previously possible. But APEX is in principle not limited to ASFI data. It takes as input JSON files and visualizes them in different ways. To aid projects outside of ASF that want to benefit from it, we have made our full code and data publicly available. We provide a README file, https://github.com/anirudhsuresh/APEX/blob/main/README.md, that details the JSON formats of the required input data. The README file links to scripts with which comma separated values (CSV) files, common outcome of repository mining, can be converted to the required JSON format for all the required APEX components: email networks, email metrics, technical networks, commit metrics, project info, project reports, and sustainability forecasts. The last one will have to be calculated from the others, using the code provided in our previous study (yin2021forecasting, ).
6. Limitations and Conclusion
Limitations Our dataset is large and diverse (within ASF) but limited to ASFI projects, so generalizing beyond ASF is risky. However, we provide a README file with instructions to aid non-ASF projects in using APEX. Selecting a range of months can result in very dense networks that are hard to read or interpret. This function is most useful when limited to a few consecutive months.
Conclusion Research into OSS project sustainability can present actionable insights for project maintenance. In this work, we presented a dashboard tool for exploring a longitudinal data-set of technical contributions and developer communication in ASF incubator projects, with extrinsic, graduation success labels and forecasts. The tool can be used for real-time monitoring and study of ASFI projects. It can also help generate hypothesis about OSS project sustainability. Future work will be aimed at adding additional data sets. We have engaged the CHAOSS project and are devising ways to standardize APEX and integrate it into CHAOSS.
Acknowledgement
This material is based upon work supported by the National Science Foundation under Grant No. 2020751.
References
- (1) Bird, C., Gourley, A., Devanbu, P., Gertz, M., and Swaminathan, A. Mining email social networks. In Proceedings of the 2006 international workshop on Mining software repositories (2006), pp. 137–143.
- (2) Riehmann, P., Hanfler, M., and Froehlich, B. Interactive sankey diagrams. In IEEE Symposium on Information Visualization, 2005. INFOVIS 2005. (2005), IEEE, pp. 233–240.
- (3) Yin, L., Chen, Z., Xuan, Q., and Filkov, V. Sustainability forecasting for apache incubator projects. In Proceedings of the 29th ACM Joint Meeting on European Software Engineering Conference and Symposium on the Foundations of Software Engineering (2021), ESEC/FSE 2021, ACM, p. 1056–1067.
- (4) Yin, L., Zhang, Z., Xuan, Q., and Filkov, V. Apache software foundation incubator project sustainability dataset. In 2021 IEEE/ACM 18th International Conference on Mining Software Repositories (MSR) (2021), IEEE, pp. 595–599.