Multivariate Information Theory Uncovers Synergistic Subsystems of the Human Cerebral Cortex
Abstract
One of the most well-established tools for modeling the brain as a complex system is the functional connectivity network, which examines the correlations between pairs of interacting brain regions. While powerful, the network model is limited by the restriction that only pairwise dependencies are visible and potentially higher-order structures are missed. In this work, we explore how multivariate information theory can reveal higher-order, synergistic dependencies in the human brain. Using the O-information, a measure of whether the structure of a system is redundancy- or synergy-dominated, we show that synergistic subsystems are widespread in the human brain. We provide a mathematical analysis of the O-information to locate it within a larger taxonomy of multivariate complexity measures. We also show the O-information is related to a previously established measure, the Tononi-Sporns-Edelman complexity, and can be understood as an expected difference in integration between system scales. Highly synergistic subsystems typically sit between canonical functional networks, and may serve to integrate those networks. We then use simulated annealing to find maximally synergistic subsystems, finding that such systems typically comprise 10 brain regions, also recruited from multiple canonical brain systems. Though ubiquitous, highly synergistic subsystems are invisible when considering pairwise functional connectivity, suggesting that higher-order dependencies form a kind of “shadow structure” that has been unrecognized by established network-based analyses. We assert that higher-order interactions in the brain represent a vast and under-explored space that, made accessible with tools of multivariate information theory, may offer novel scientific insights.
Keywords: Functional connectivity, higher-order interaction, information theory, synergy, redundancy, mutual information, brain, fMRI, network science.
Significance Statement
Network models of the brain have emerged as among the most powerful tools for understanding its structure and function. Recently, neuroscientists and complexity scientists have begun studying higher-order interactions between multiple brain regions that cannot be easily modeled as a network. In this paper, we use multivariate information theory to show that the brain has a large number of higher-order, synergisitic subsystems that are invisible when considering a pairwise graph structure. We analytically relate these synergies to mathematical notions of complexity and show how the brain can be understood as a complex system combining elements of integration, segregation, synergy, and redundancy. The space of higher-order dependencies represents a large, unexplored territory for neuroscience research.
Introduction
Perhaps the most ubiquitous model used in complex systems is the network, comprising pairwise interactions between different elements of the system as directed or undirected graphs Barabási and Pósfai (2016); Menczer et al. (2020). While network models can be extremely powerful, they are also fundamentally limited by the constructional rule that every interaction between elements is strictly bivariate. Hence, interactions between three or more nodes must be indirectly inferred, using methods such as motifs Sporns and Kötter (2004), transitivity or clustering coefficients Watts and Strogatz (1998), and mapping cores or mesoscale communities Fortunato (2010); Betzel (2020). Increasingly, statistical interactions involving more than two elements (termed “higher-order” interactions) are recognized to be a key feature of complex systems Battiston et al. (2020, 2021), making the task of recognizing and modeling higher-order structures an important, developing field. However, a lack of well-developed, formal tools, as well as the inherent computational and combinatorial difficulties associated with higher-order interactions have limited their application. In neuroscience, higher-order interactions have been theoretically implicated as building blocks of complexity Tononi et al. (1994, 1998) and functional integration Tononi and Edelman (2000). Empirically, they have been found at multiple scales, including in neuronal networks Timme et al. (2016a); Faber et al. (2018); Sherrill et al. (2021, 2020); Varley et al. (2021a); Scagliarini et al. (2021), electrophysiological signals Rosas et al. (2020); Varley et al. (2020), and fMRI BOLD data Luppi et al. (2020, 2022); Gatica et al. (2021), where higher-order interactions have been proposed to relate to emergent mental phenomena and consciousness Luppi et al. (2021a).
Recently, Rosas and Mediano Rosas et al. (2019) proposed that information theory could be used to identify higher-order interactions in multivariate systems, and furthermore, that it is possible to disentangle qualitatively different kinds of interactions, characterized by pairwise redundant and synergistic modes of information sharing. Intuitively, redundant information corresponds to information that is “copied” over many different elements such that the observation of a single element resolves the corresponding uncertainty in all of the other elements. In contrast, synergistic information sharing occurs when uncertainty can only be resolved by considering the joint state of two or more variables. This space of redundant and synergistic interactions in the brain remains largely unexplored, as it comprises interactions that are typically inaccessible to a bivariate, functional connectivity network analysis. Synergy is of potential interest because it tracks the ability of the brain to generate novel information through the interactions of multiple brain regions (sometimes called information “modification”) Lizier et al. (2013). In studies of cortical neural networks, synergy has been associated with neural “computation” (the genesis of new information through a non-trivial interaction of multiple inputs) Timme et al. (2016a); Faber et al. (2018); Sherrill et al. (2020, 2021); Varley et al. (2021a). The pure synergy itself is hard to calculate, however (requiring super-exponential computing time for even modestly sized systems), prompting a search for scalable heuristic measures of redundancy/synergy bias. Rosas et al. introduced the O-information Rosas et al. (2019) as such a measure, which gives an overall estimate of the extent to which a system is redundancy dominated or synergy dominated, with negative O-information indicating the presence of predominantly synergistic interactions. Despite strong appeal as a quantitative metric related to computation the origins and neural manifestations of O-information have remained elusive, if not “enigmatic” James et al. (2011).
In this work, we apply a range of information-theoretic measures to resting state fMRI data acquired from human cerebral cortex with the aim to identify ensembles of regions (subsystems) that express specific modes of higher-order statistical dependencies. First, we introduce the mathematical machinery required to derive the O-information, and its interpretation in the context of multivariate information sharing processes. We disclose an analytic relationship of O-information to other, more well-known multivariate metrics such as the Tononi-Sporns-Edelman complexity Tononi et al. (1998). Next, we apply multivariate information metrics to brain data and uncover the presence of abundant and widely distributed subsystems expressing synergy (negative O-information) across the entire cerebral cortex. Finally, we discuss what our insights reveal about the structure and functional roles of higher-order relations in brain activity.
I Theory
I.1 Integration, Segregation, Redundancy, Synergy
A fundamental idea in modern theoretical neuroscience states that the nervous system maintains a balance between “integration” and “segregation” Tononi et al. (1994). The integration-segregation balance principle is based on the insight that the nervous system combines regional elements of functional specialization, with system-wide functional integration. Considerable empirical work has gone into the neural integration-segregation hypothesis, and the on-going balance of integrated and segregated dynamics has been found to be regulated by distinct neuromodulatory systems Deco et al. (2015); Shine (2019), and correlates with conscious awareness Luppi et al. (2019, 2021b).
The segregation-integration spectrum is typically visualized as a one-dimensional space: on one extreme the system is totally dis-integrated and every element is behaving entirely independently of all the others. On the other extreme is the case of total integration: every element synchronizes with every other element so that the whole system is densely connected. In the middle there is a “complex” regime where the system combines elements of independence and integration. As it was originally formulated, integration and segregation were discussed in the contexts of networks, and higher-order interactions were inferred via partitioning the system into subsets of varying numbers of nodes Tononi et al. (1994). These arguments pre-dated the rigorous, mathematical distinction between redundancy and synergy, introduced in the work of Williams and Beer almost two decades later Williams and Beer (2010). Building on these foundations, as well as the definition of O-information from Rosas et al., Rosas et al. (2019), we argue that the notion of integration can be expanded to include redundant integration and synergistic integration, resulting in a more complex space described by distinct dimensions of integration, segregation, redundancy, and synergy (although these do not form an orthogonal basis). This high-dimensional, qualitative configuration space may be viewed as an informational “morphospace” McGhee (1991); Avena-Koenigsberger et al. (2015); Varley et al. (2021b) and provides a framework for the detailed comparison of different systems.
I.2 Information Theory and Higher-Order Information-Sharing
In this section, we introduce the basics of information theory necessary to understand its application to higher-order relationships. For a more thorough introduction, readers may be interested in Cover & Thomas Cover and Thomas (2012). The basic object of study in information theory is the entropy Shannon (1948), which quantifies the uncertainty that we, as observers, have about the state of a variable . If the states of are drawn according to the probability distribution with Support Set , then the entropy of is:
| (1) |
Now consider two variables and : how does knowing the state of reduce our uncertainty (the entropy) about the state of ? The answer is given by the mutual information Shannon (1948), which can be written in two mathematically equivalent forms:
| (2) | |||||
| (3) |
The bivariate mutual information is often applied in the study of complex systems for the inference of functional connectivity networks (e.g. Friston (1994); van Diessen et al. (2015); Ursino et al. (2020); Barnett et al. (2020)), which can reveal the structure of dyadic interactions between different elements Sporns (2010). While functional connectivity networks are extremely powerful, they are fundamentally limited by their pairwise structure and are insensitive to “higher-order” interactions between two or more variables.
The natural place to begin an analysis of higher-order structures in neural data, then, is by attempting to generalize the mutual information to account for more than two variables. Unfortunately, there is no single unique generalization, and at least three are known to exist: the total correlation, the dual total correlation, and the interaction/co-information (which we will not address here) Cover and Thomas (2012). The total correlation, (also referred to as the “integration” in Tononi et al. (1994)) is formally a straightforward generalization of Eq. 2:
| (4) | ||||
| (5) |
Where X is a “macro-variable” comprised of an ensemble of multiple random variables: and is the Kullback-Leibler divergence. The total correlation is low when every variable is independent, and high when every variable is individually highly entropic but the joint-state of the whole has low entropy. This occurs when the whole system is dominated by redundant interactions: the state of a single variable discloses a large amount of information about the state of every other variable.
The second generalization of mutual information is the dual total correlation, formally a generalization of Eq. 3:
| (6) |
where refers to the residual entropy Abdallah and Plumbley (2012): the uncertainty intrinsic to the the element of X that is not resolved by any other variable, or collection of variables in X. The difference between the joint entropy and the sum of the residual entropies is all the entropy that is “shared” between at least two elements of X (i.e. is redundantly common to two or more elements). Curiously, while total correlation monotonically increases as X transitions from randomness to synchrony, the dual total correlation is low both for totally random, and totally synchronized systems, peaking when X is dominated by “shared” information.
Rosas et al. Rosas et al. (2019), propose that the difference between and (first explored by James and Crutchfield as the enigmatic information James et al. (2011)) could provide a measure of the overall balance between redundancy and synergy in multivariate systems: if , then the global constraints on the system dominate and force a redundant dynamic, while if the system is dominated by information that is both shared, but not redundant. Rosas et al., rechristen this measure the organizational information:
| (7) |
While O-information has been applied in a variety of contexts (such as to questions about the aging brain Gatica et al. (2021), information flow in neuronal circuits Stramaglia et al. (2021), and even music composition Scagliarini et al. (2021)), there remains considerable uncertainty around how “synergy” should be intuitively understood. To help elucidate the answer, we relate O-information to the original measure of integration/segregation balance proposed by Tononi, Sporns, and Edelman: the TSE complexity Tononi et al. (1994) and show that a geometric interpretation of the O-information exists that brings with it a novel perspective on redundancy and synergy.
The TSE-complexity admits two formulations:
| (8) | |||||
| (9) |
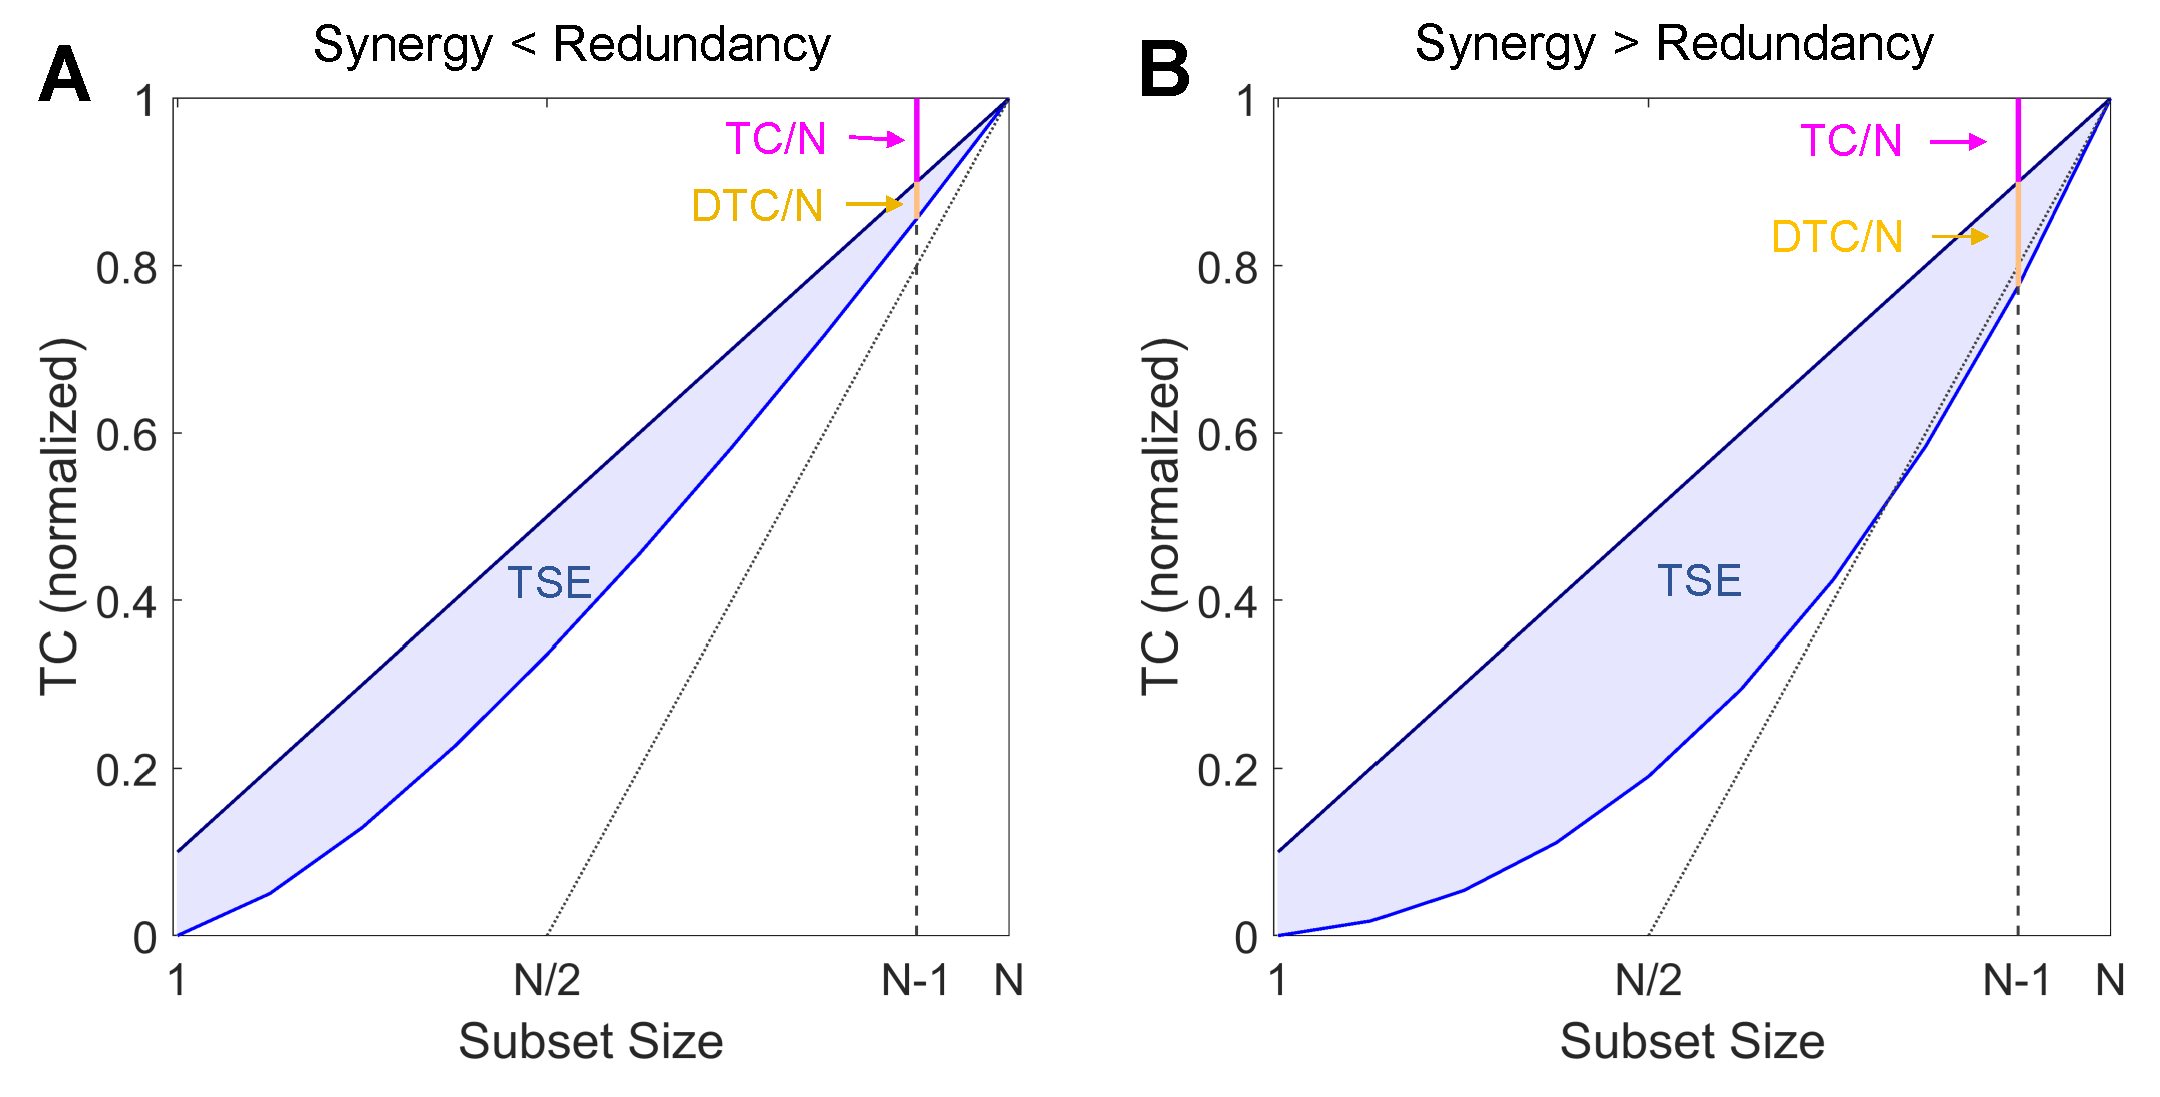
The first (Eq. 8) defines the TSE complexity as the average mutual information between the pairs of every possible bipartition of the system X. For every integer i between 1 and , we compute all possible subsets of X with elements (notated by ) and compute the mutual information between that set and it’s complement (). The second equation (Eq. 9) provides an alternative interpretation: the TSE complexity quantities the difference, at every scale, between the “expected” integration of the scale if the system were fully integrated, and the actual integration of that scale (calculated as the average total correlation of every subset of size ). In this interpretation, the TSE complexity is highest when the smallest scales are relatively dis-integrated, but the macro-scales are relatively more integrated. This balance of integration and segregation is emblematic of TSE “complexity.” For a visualization of the TSE complexity calculation as the difference between the expected and empirical values, see Figure 1.
Computing the full TSE complexity itself requires analyzing every possible subsystem (or bipartition) of X: an insurmountable task for all but the smallest networks, as the combinatorics grow super-exponentially. A useful approximation is to look only at the second-to-top “layer” of the full TSE complexity summation, which only requires finding the average total correlation for the sets (where is every excluding . We refer to this measure as the description complexity of X Tononi et al. (1998); Sporns et al. (2002). Formally:
| (10) |
The definition of as successive pruning of information. is the total integration of X. is expected decrease in integration associated with a single element (on average), and is the actual decrease in integrated associated with removing every element on its own. , then, computes the difference between the expected decrease in integration associated with removing a single node and the actual decrease. has several obvious conceptual parallels with the and there is indeed an analytic relationship between and (for proof, see SI):
| (11) |
This result was independently derived in Ay et al. (2006). The relationship between and allows us to rewrite the O-information purely in terms of total correlations:
| (12) | |||||
| (13) |
This allows us to re-conceptualize redundancy- and synergy-dominance in terms of just redundancy: synergistic information is information that is redundantly present in large ensembles of elements considered jointly but not in any subset of those ensembles. This is conceptually very similar to the definition of synergy provided by the partial information decomposition Williams and Beer (2010), which defines synergy in terms of redundant information shared by higher-order collections of elements. We can also propose a geometric interpretation of the sign of the O-information: based on Eqs. 7 and 12, we can see that and . This means that a system X is synergy-dominated if the removal of a single element (on average) decreases the integration of the remaining elements more than would be expected in the null case of a totally integrated system. The two possible cases (redundancy-dominated, with and synergy-dominated, with ) are visualized and discussed in the context of the TSE complexity in Figure 1.
Another heuristic approximation of the TSE complexity is the sum of the total correlation and dual total correlation. Following the notation from Rosas et al.:
| (14) |
James et al. previously termed this measure the exogenous information and described it as a “very mutual information”: quantifying all of the shared dependencies between each single variable and every other subset of the system:
| (15) |
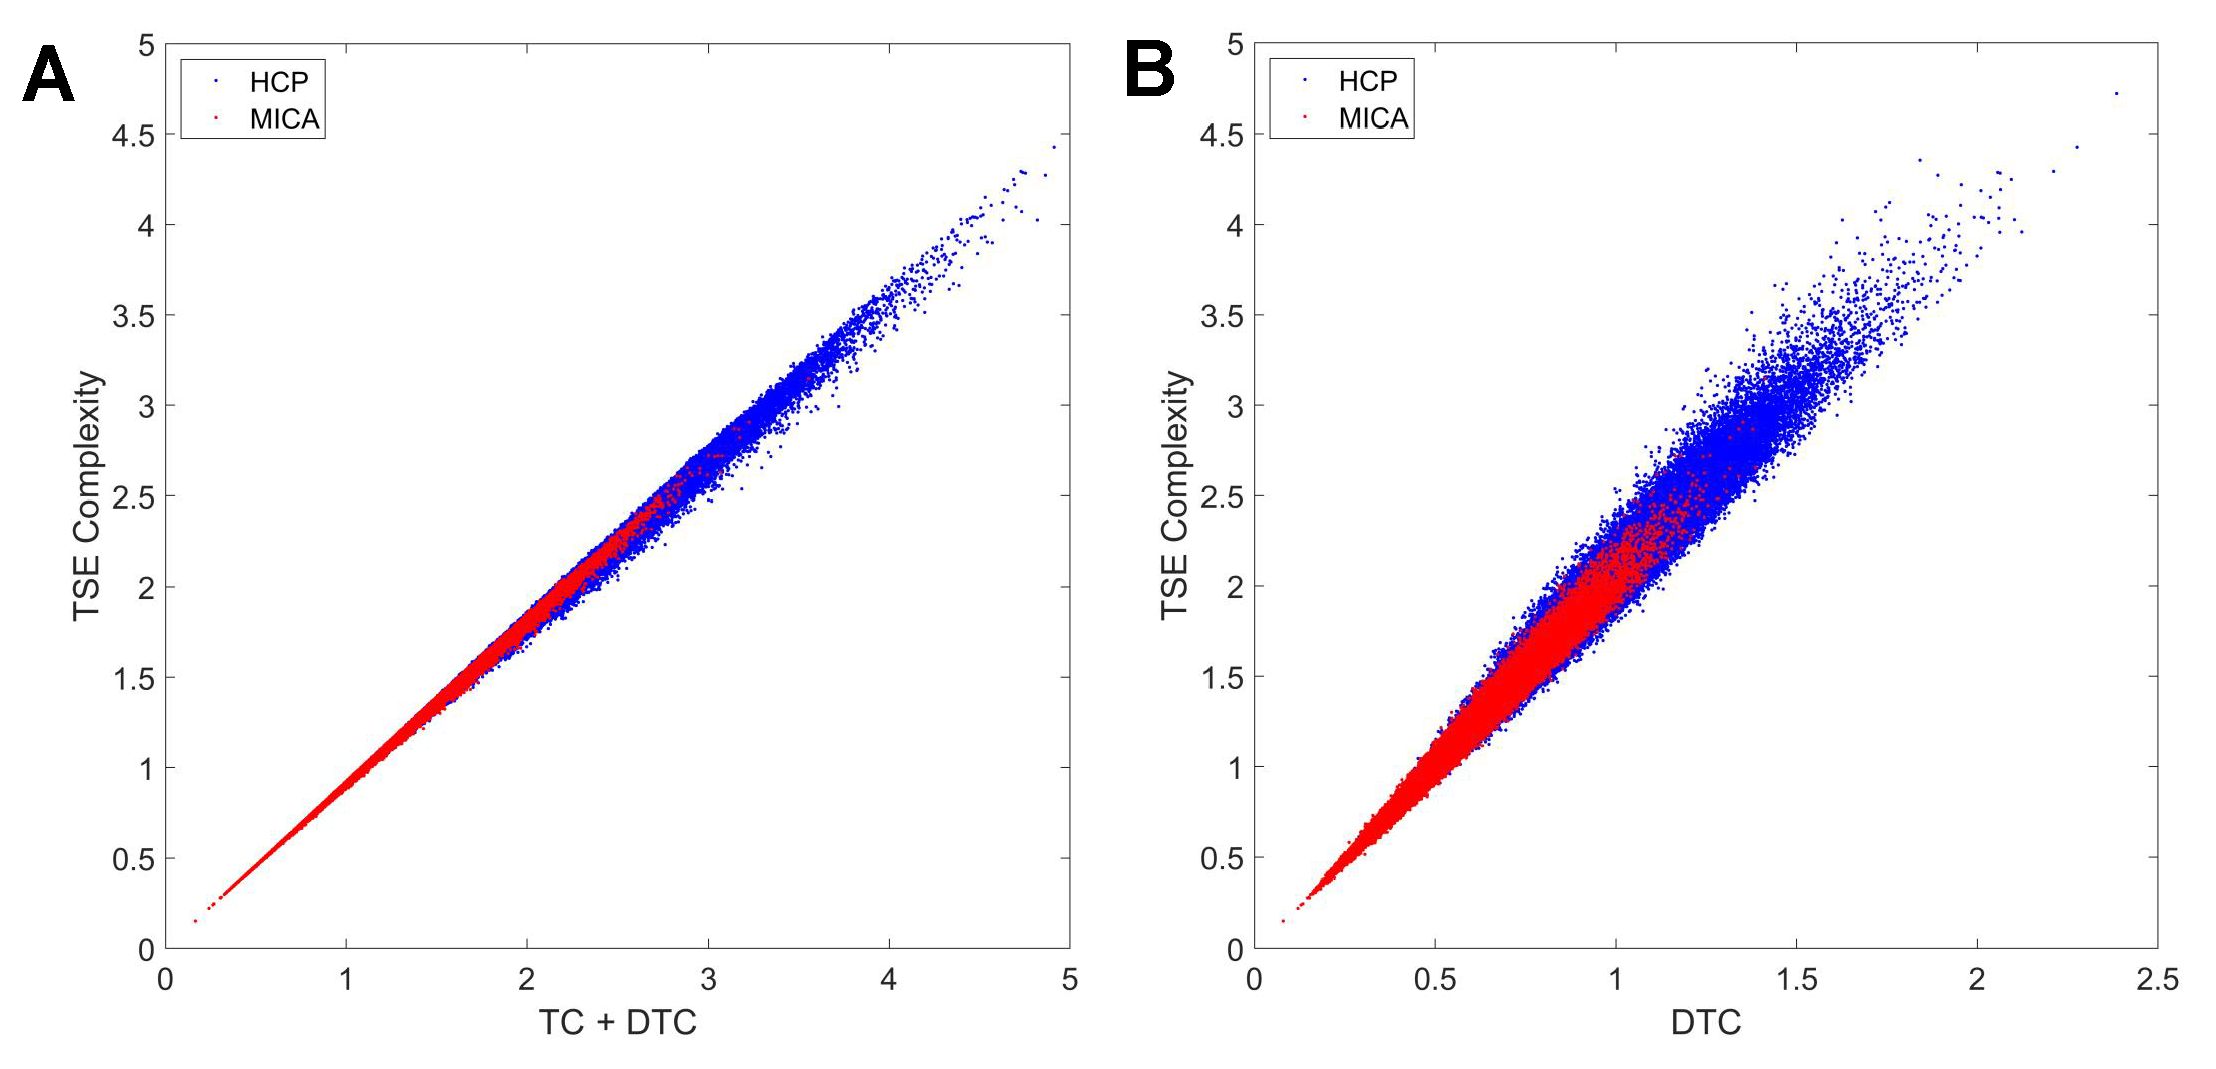
Given the obvious similarity to Eq. 8, Rosas et al., hypothesized that , which was verified to hold in simple simulations with small Rosas et al. (2019). By leveraging the Gaussian assumptions here, we can empirically estimate the correlation between TSE and exogenous information and assess how well the relationship holds as gets large. Figure 2 confirms the strong correlations between TSE complexity with both TC+DTC and DTC alone. These correlations hold over a range of subset sizes, from three to fifteen elements.
II Results
We set out to identify subsystems (subsets of dynamically interacting elements) that express negative O-information (synergy) in the human brain. Leveraging Gaussian assumptions Cover and Thomas (2012) (see Methods), multivariate information theoretic measures can be estimated from covariance (correlation) matrices expressing empirically recorded functional connectivity (FC). We computed long-time averages of FC derived from two normative samples of human resting-state fMRI, the Human Connectome Project (main data set; Van Essen et al. (2013)) and an open-source multimodal MRI dataset for Microstructure-Informed Connectomics (MICA-MICs; replication data set; Royer et al. (2021)). For both data sets we computed a single FC matrix (HCP: 95 participants, 4 runs each; MICA-MICs: 50 participants, 1 run each). Both FC covered the entire cerebral cortex parcellated into a common set of 200 nodes Schaefer et al. (2018) and node time series were derived from BOLD signals after performing global signal regression, which removes signal components that are common to all nodes in the system, i.e. globally redundant (Fig. SI1).
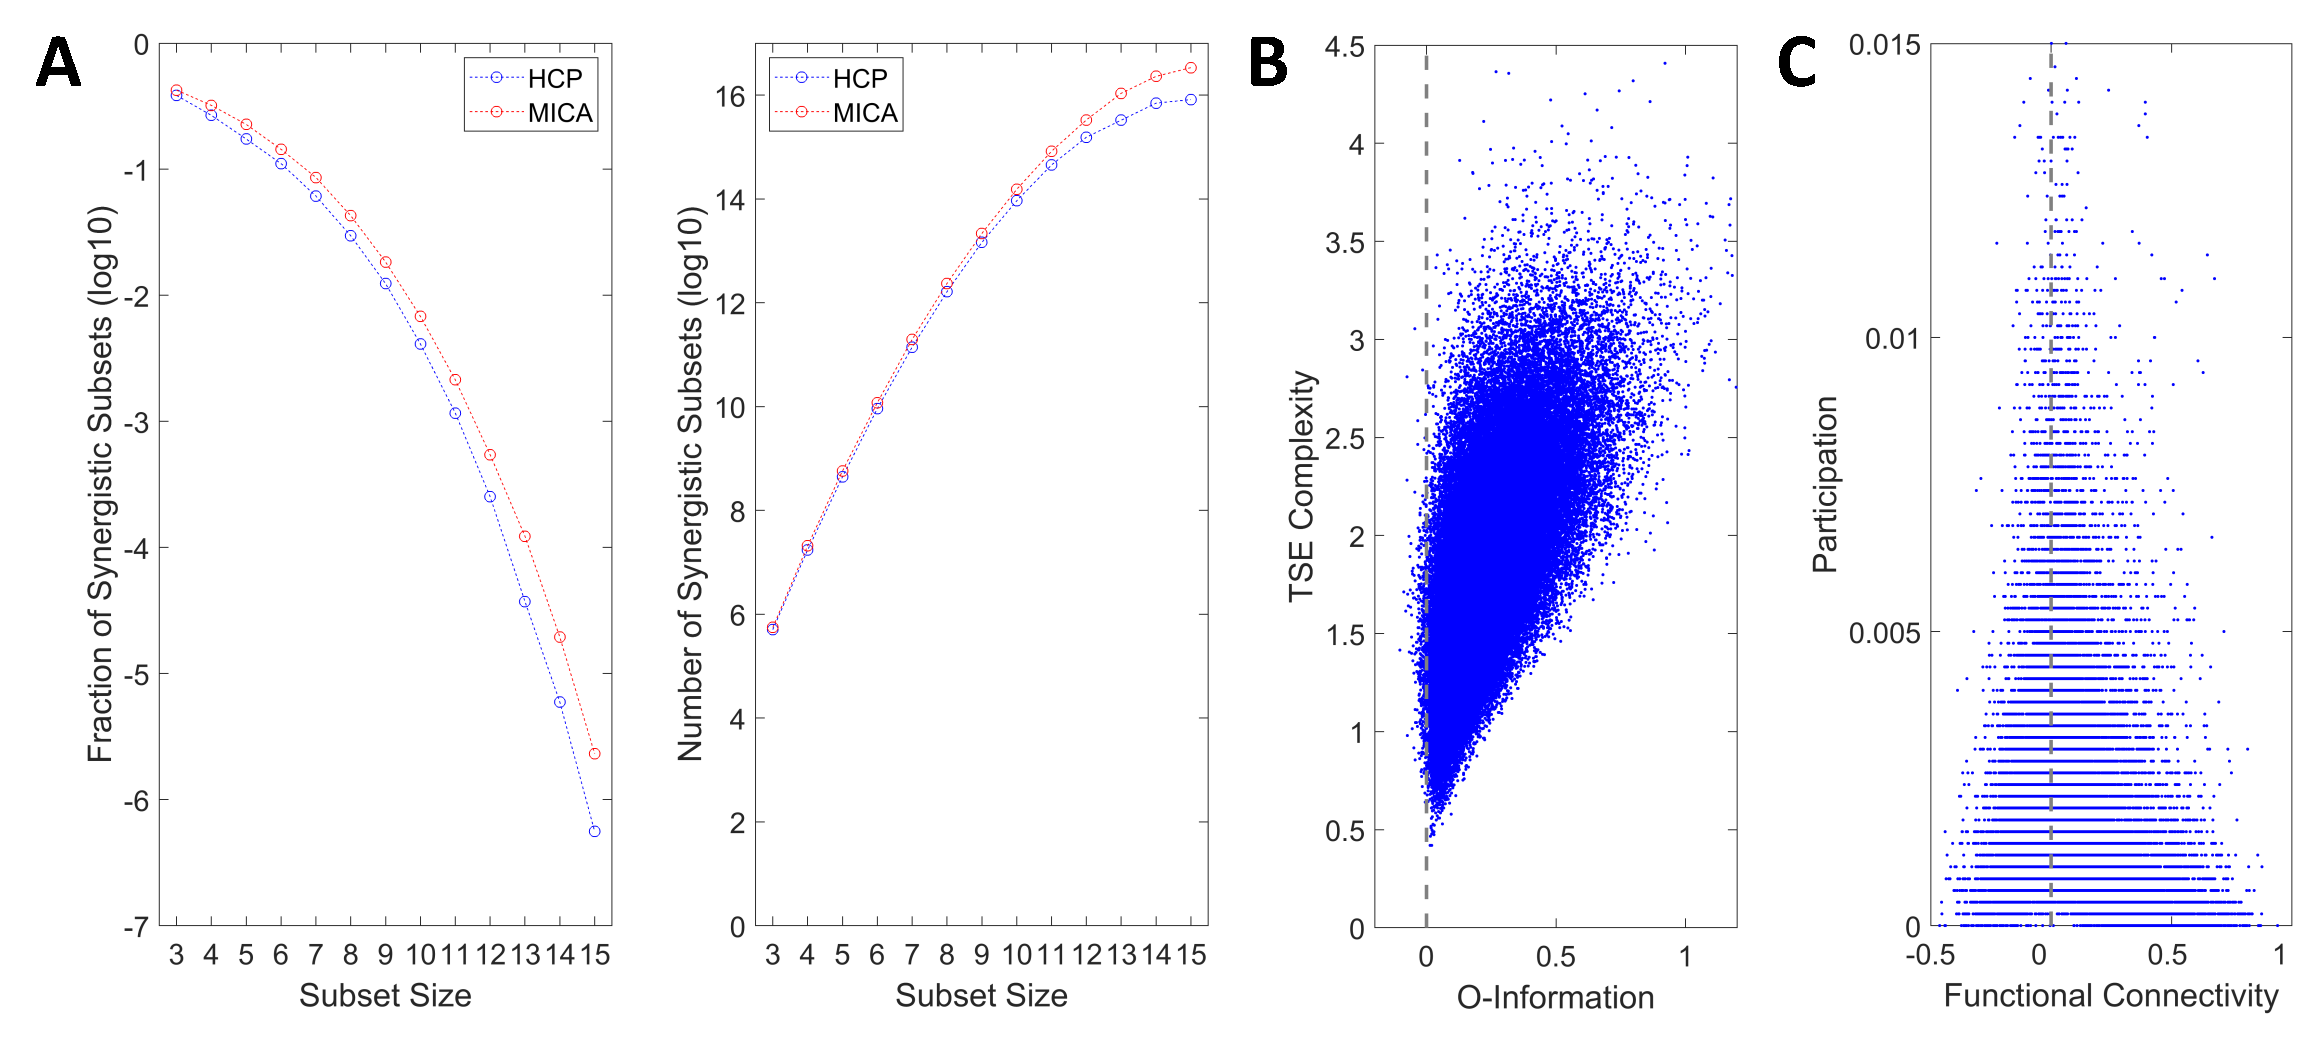
Computing O-Information on the full-size 200-node FC matrix results in positive quantities for both data sets (HCP: = 79.16 nats; MICA: = 46.69 nats), indicating that the full structure is redundancy-dominated, which might potentially obscure the presence of higher-order, synergistic correlations. We asked if smaller subsets of nodes were present within the full-size FC that generated synergy, or negative O-information. Random sampling of small subsets (between 3 and 16 nodes) indeed yields abundant subsets that express negative O-information (Fig 3A). Their relative abundance declines rapidly with growing subset size, reflecting the increasing dominance of redundant information and exhaustive capture of unique information. While synergistic subsets account for rapidly diminishing fractions of all subsets, their total number can be non-negligible (10-node subsets: 0.41 percent and , respectively). In a large random sample of 10-node subsets, the O-information is positively correlated with TSE complexity (Fig 3B; , ; HCP data). Focusing on a separate random sample of 5000 10-node subsets with negative O-information, we asked if the frequency with which pairs of nodes participate in such subsets is related to their pairwise FC. Indeed, the absolute pairwise FC is strongly negatively correlated with the frequency of participation in synergistic subsets (, , HCP; , , MICA, HCP; Fig 3C). This indicates that strongly positive or negative FC between two nodes makes their joint inclusion in a synergistic subset unlikely, while node pairs with low FC magnitude could either be truly disintegrated, or participating in a highly synergistic subsystem.
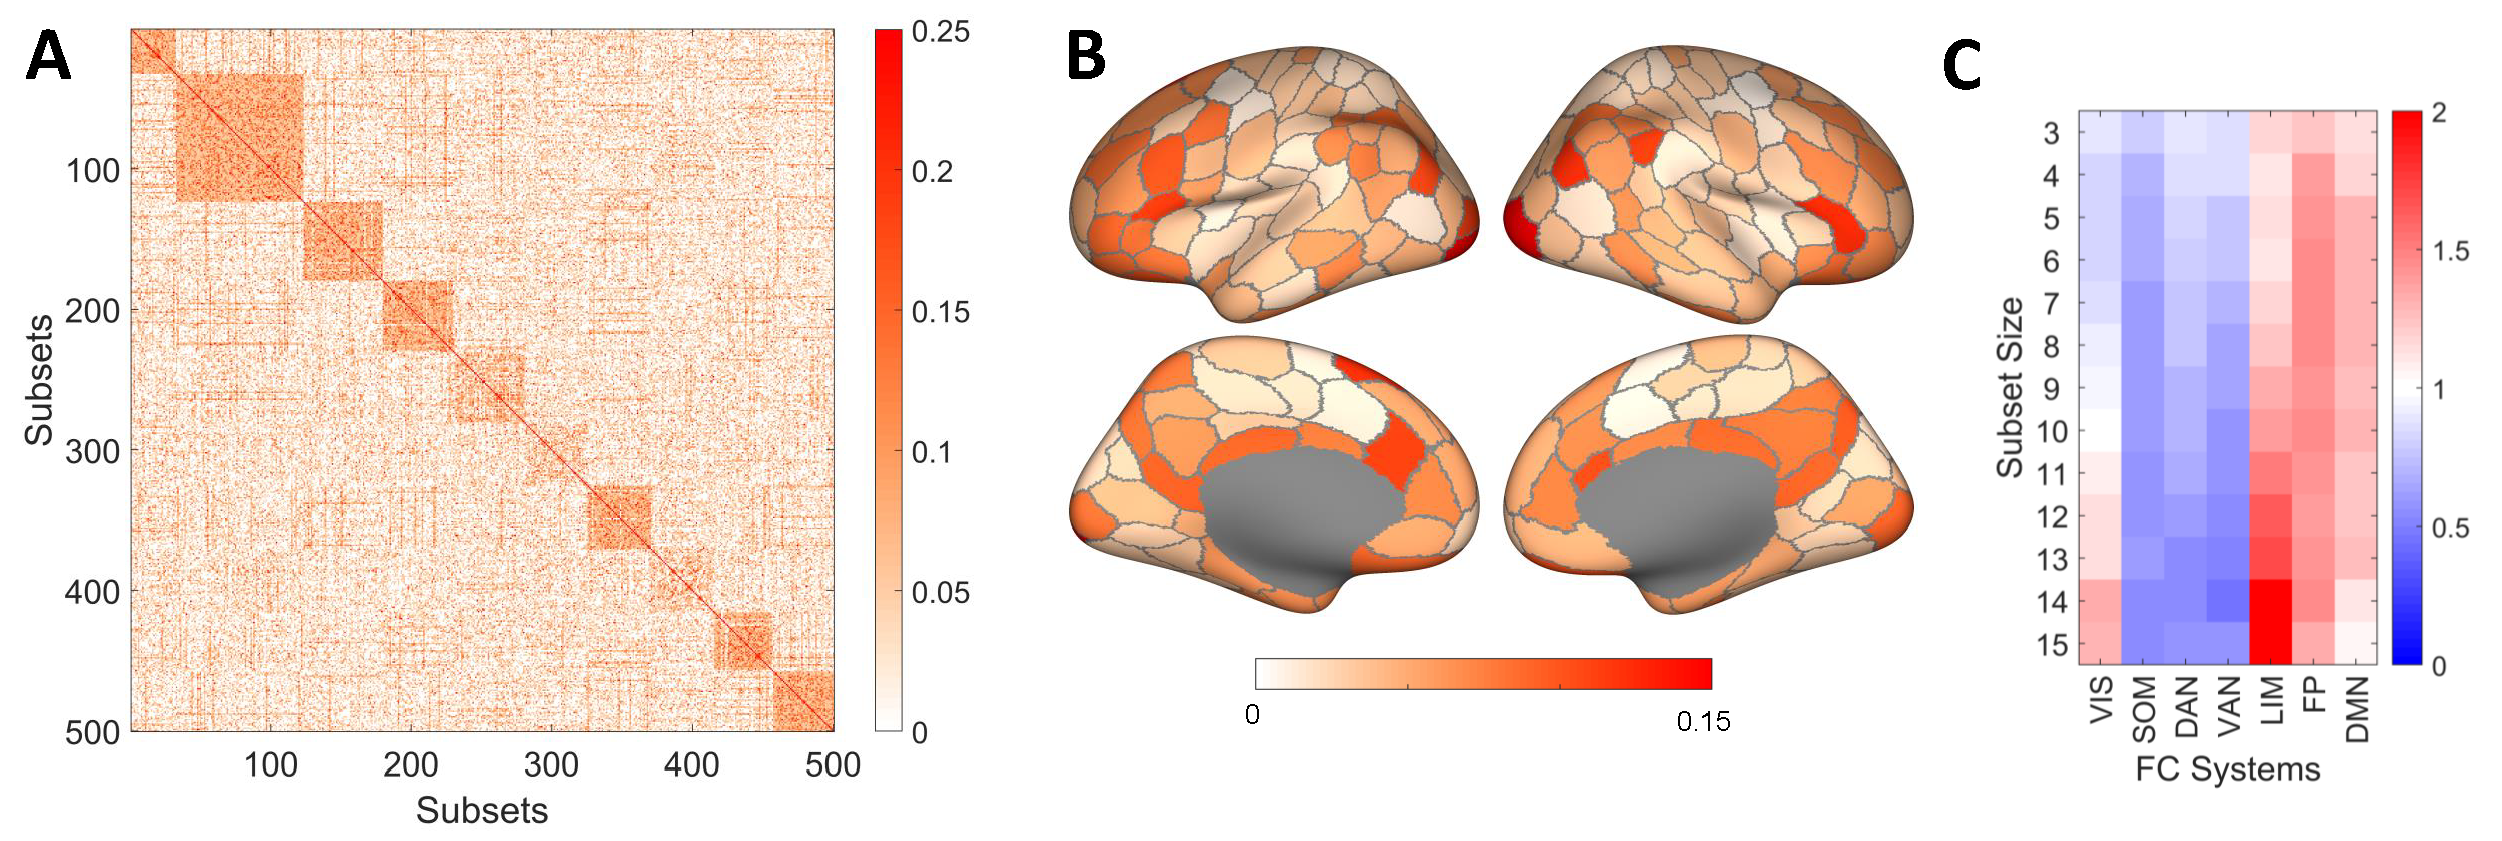
Participation of nodes in randomly sampled synergistic subsets varies systematically across the cortex. Over a large random sample of 100,000 10-node subsets, all nodes participate at least once, with several nodes participating in more than 10,000 distinct synergistic subsets. Hence, the complete repertoire of co-expressed synergistic subsets covers the entire cortex, with some overlap between subsets, centered on high-participation nodes that form “focal points” or clusters (Fig 4A). Projecting the participation of individual nodes (brain regions) onto the cortical surface shows significant consistency between HCP (Fig 4B) and MICA data (Fig SI4) (the two maps are correlated with , , between the two data sets). Functional systems Yeo et al. (2011) distribute unevenly as well, with highest frequencies of participation found in the frontoparietal (FP) system, for synergistic subsets of 10 nodes (HCP: Fig 4C; MICA: Fig SI2C). For larger subset sizes, participation of limbic (LIM) regions dominates over FP regions.
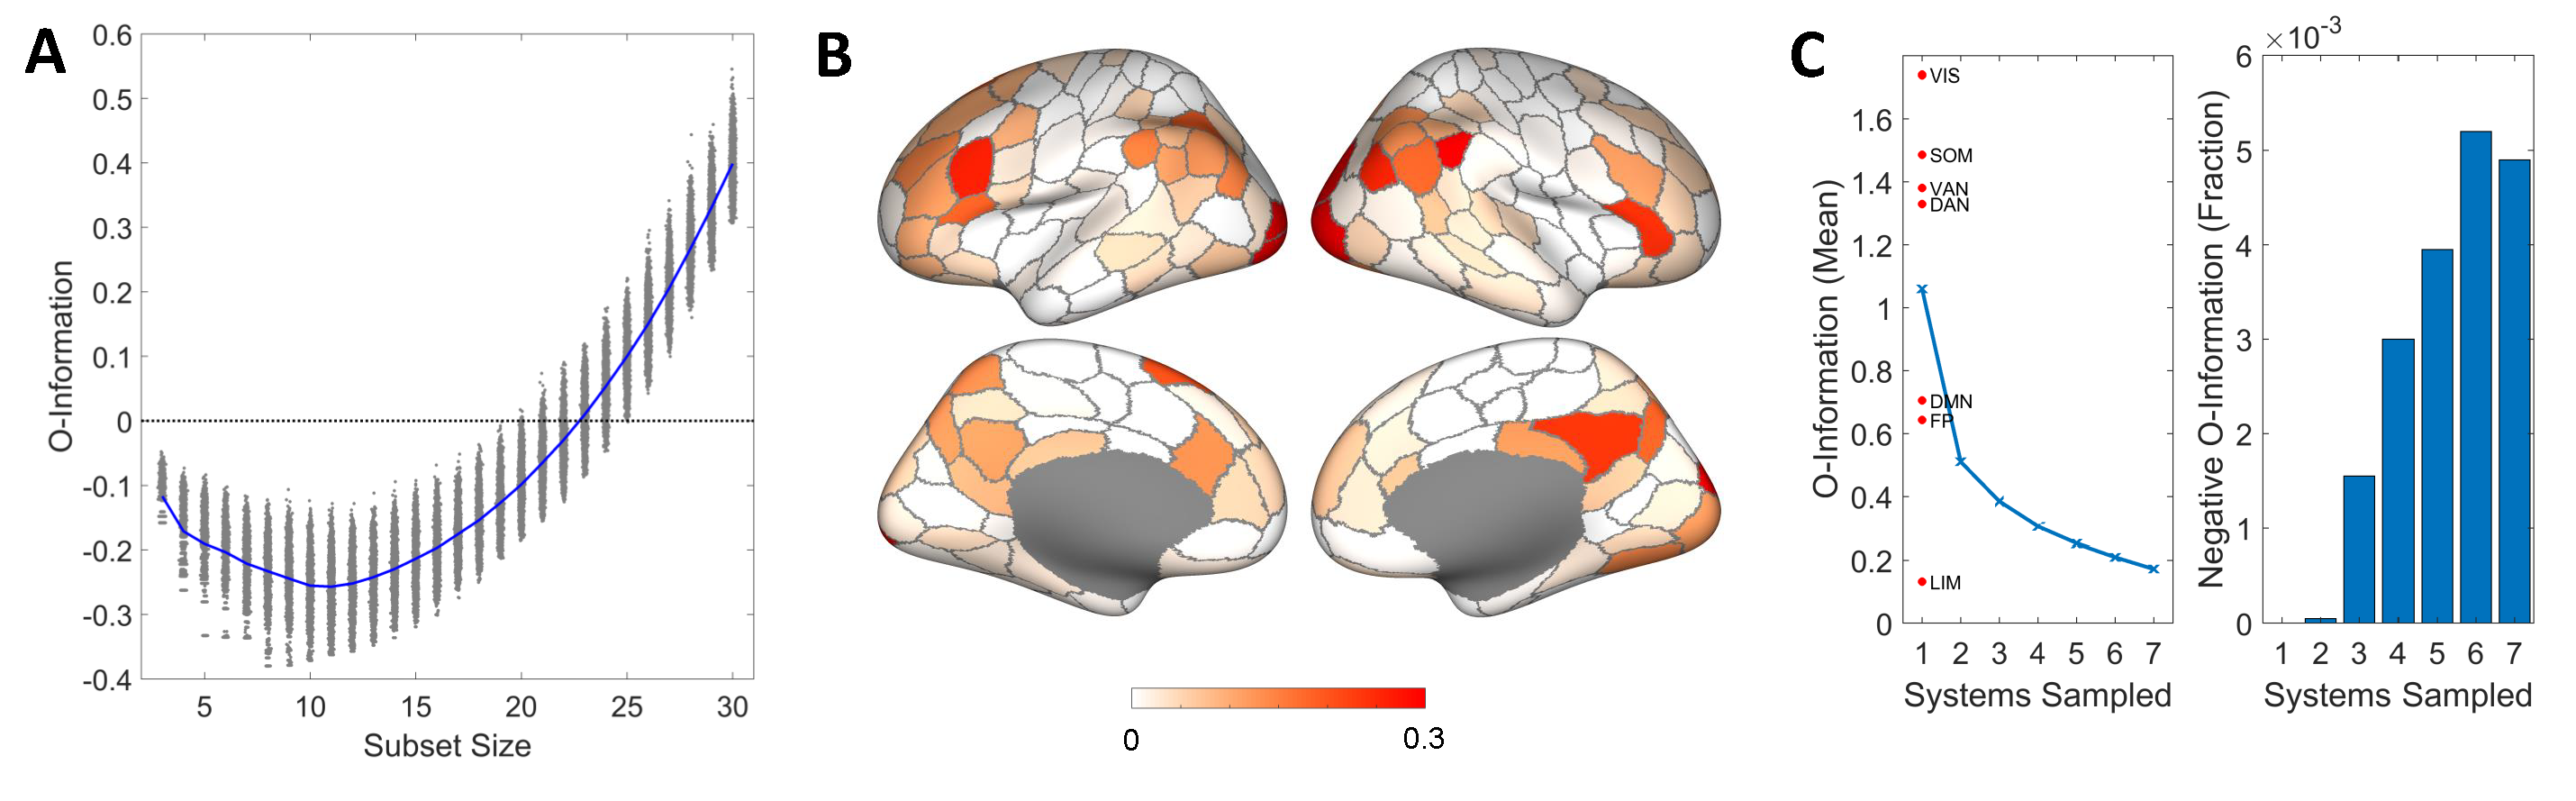
Combinatorics prevent exhaustive exploration of subsets of even modest sizes, and the random sampling strategy employed so far is likely to miss subsets that express maximal synergy. To identify subsets with maximally negative O-information (maximal synergy), we used an optimization algorithm based on simulated annealing (references and details are contained in the Methods section). Multiple runs of the algorithm yielded consistent and highly similar outcomes (Fig SI3), indicating convergence of the optimization while again highlighting the existence of a large reservoir of non-identical (degenerate) subsets, all expressing highly negative O-information. Deploying this algorithm while varying subset sizes between 3 and 30 nodes, we identified large numbers of subsets that express highly negative O-information, for subset sizes 3-24 nodes (HCP; Fig. 5A) and 3-27 nodes (MICA; Fig. SI4). No synergistic subsets are found for subset sizes greater than 27 nodes, as redundancy starts to overwhelm the unique informational contributions of individual nodes at larger subset sizes.
Minimal O-information was achieved for subsets comprising approximately 10 nodes for both data sets. Mapping subsets of nodes expressing near minimal O-information onto a surface plot of the cerebral cortex reveals consistent topography. Fig. 5B shows the frequency with which individual cortical parcels (nodes) were identified across 5000 runs of the optimization algorithm, yielding 4021 unique solutions (HCP Fig. 5B; 4166 unique solutions for MICA data, Fig SI4B). Brain-wide nodal frequencies are significantly correlated across HCP and MICA data sets (Spearman’s , ). When mapping these nodal frequencies to seven canonical resting-state functional systems Yeo et al. (2011), we find that each of these seven systems contributes, but to different extent. In HCP data, for optimally synergistic 10-node subsets, the visual, frontoparietal and default mode networks are over-represented, while only the FP system appears over-represented in the MICA data; Fig SI5).
The nature of negative O-information (synergy) requires that individual nodes make largely unique (non-redundant) contributions to the multivariate information metric. This suggests that nodes derived from different, informationally distinct (intrinsically redundant, but extrinsically non-redundant) functional communities or systems might be favored as constituents of synergistic subsets. To test this hypothesis, we created sets of 20,000 randomly sampled subsets that were comprised of nodes derived from between 1 and all 7 canonical functional systems (HCP, Fig. 5C; MICA, Fig. SI4C). The mean O-information, across all randomly chosen subsets, was found to be positive regardless of how many FC systems were included in the subsets. For samples derived from just 1 FC system, the O-information was most positive (i.e. subsets were most redundancy-dominated) for visual, somatomotor and attention systems, and they were least redundancy-dominated for default, frontoparietal and limbic systems. Importantly, the mean O-information decreased, and the fraction of synergstic subsets increased, as subsets were sampled from larger numbers of canonical systems. No subset derived from a single functional system was capable of expressing synergy. Subsets spanning 6 or 7 canonical systems were most likely to express synergy, as indexed by the fraction of negative O-information encountered in the sample. The finding supports the notion that dividing the brain into canonical functional systems prioritizes grouping nodes by redundant over synergistic information, hence missing a potentially important substrate for neural computation.
III Discussion
In this paper, we have shown how the O-information Rosas et al. (2019), a measure of higher-order interactions in multivariate data, can reveal synergistic ensembles of brain regions that are invisible to bivariate functional connectivity analyses. Our primary theoretical result is to provide a geometric interpretation of the O-information that unifies multiple disparate measures of multivariate information sharing into a single framework, built around the Tononi-Sporns-Edelman complexity Tononi et al. (1994). By re-writing in terms of the total correlation between multiple subsets of X, we find that “synergy” occurs when removing any single element causes the system to become less integrated (more so than would be expected if structure was uniformly distributed over X). In this sense, synergy captures how the “whole” can be greater than the sum of it’s parts Griffith and Harel (2013). Applied to two separate fMRI brain data sets we find that synergistic subsets of brain regions are ubiquitous and abundant, comprising between 3 and 25 regions and extending over the entire cerebral cortex. While redundant interactions dominate functional connectivity at larger subset sizes, the application of multivariate information measures demonstrates a previously hidden repertoire of synergistic ensembles, each integrating diverse and distinct sources of information.
The theoretical results, including the geometric interpretation of the O-information presents a new, intuitive approach to understanding the often un-intuitive notion of synergy. By re-writing in terms of only sums and differences of total correlations, we can see that synergy can be approximately understood as that “integration” that is present in the whole but not smaller subsets (in this case, the subsets created by removing each ). This intuition is conceptually similar to the formal definition of synergy from the partial information decomposition framework Williams and Beer (2010), which computes synergy as the information “left over” when everything accessible in simpler combinations of sources has been accounted for. The exclusive use of total correlations also allows us to consider the O-information purely in terms of Kullback-Leibler divergences from independent to joint probability distributions (Eq. 5. This shows us that all of these measures can be understood in the context of “inferences” about structure (relative to a disintegrated prior). In the context of synergy, the “extra” information in the joint state is information about something: specifically about the relative likelihood of a configuration with respect to the maximum entropy case.
When randomly sampling subsystems in two datasets (HCP and MICA), we found a large number of synergy-dominated ensembles distributed throughout the brain. Recent work by Luppi et al., Luppi et al. (2022) proposed a “synergistic core” to the human brain where complex processing occurs. While we found that there is significant over-representation of specific regions (including portions reported by Luppi et al., such as prefrontal cortex, occipital pole, the precuneus, and cingulate regions), synergy-dominated subsystems could include any region of cortex: regions contributing to synergistic subsets are very widely distributed. Almost every region contributed to at least some synergistic ensembles, although some regions contribute more reliably than others. This suggests that synergy is a widespread property of multivariate information emerging from resting-state brain activity.
Interestingly, the randomly sampled ensembles that were most likely to be synergy dominated where those that involved nodes that spanned multiple canonical subsystems, while sets of regions all within one system were strongly dominated by redundancy (Fig. 5C). This would be consistent with the hypothesis that functional connectivity, when viewed entirely as bivariate interaction, is largely sensitive to redundant, but insensitive to synergistic, dependencies between brain regions. Consequently, the functional connectivity matrix is not a “complete” map of the statistical structure in a dataset, but only of dependencies characterized by redundancy. This is consistent with findings from Ince Ince (2017) and Finn and Lizier Finn and Lizier (2020) who argued that bivariate correlations are intrinsically redundancy-dominated. Higher-order synergies represent, in a sense, a kind of “shadow structure” and consequently missed by network-focused approaches that omit higher-order interactions. This hypothesis finds some support in Luppi et al. (2022), who found that the distribution of synergies was anticorrelated with the functional connectivity network structure, while the distribution of redundancies was positively correlated.
Given the novelty of tools like the O-information, the significance of these synergistic dependencies remains almost entirely unknown, although the small number of studies to date suggest intriguing patterns. One study found alterations to the redundancy/synergy bias across the human lifespan Gatica et al. (2021), while other studies have suggested that loss of consciousness induced by propofol is associated with decreased synergistic dynamics Luppi et al. (2020). Future avenues of work include deeper analyses of how higher-order dynamics change between rest and task conditions, in cases of psychopathology or brain injury and non-human animals. We should note that, in the context of the O-information, synergy is not necessarily a “causal” measure: in related contexts, synergy has been discussed as a measure of “computation” in neural circuits Faber et al. (2018); Sherrill et al. (2020, 2021); Varley (2022), although it remains unexplored how exactly these two approaches relate to each-other. The O-information measures instantaneous, higher-order correlation structures, while the work by Sherill et al., is done in the context of information dynamics Lizier et al. (2013). Future research may explore how a synergistic correlation structure might facilitate computations within the system over time.
In addition to the insights into synergy specifically, the results presented here also have implications for researchers interested in multivariate information theoretic analyses. For example, the TSE complexity has long been an object of theoretical interest Ay et al. (2006), but the intractable combinatorics have limited its applicability in empirical data (although its use is not unheard of Timme et al. (2016b)). The finding that the exogenous information for reasonably large (first reported in Rosas et al. (2019)), even more so than the original heuristic , opens the door to applications application in experimental neuroscience.
In a broader scientific context, our work contributes to the increasing interest in higher-order interactions, beyond the standard, pairwise network model Battiston et al. (2021); Rosas et al. (2022). The information-theoretic approach (such as the work reported here, as well as in Luppi et al. (2020); Varley and Kaminski (2021); Varley (2022); Scagliarini et al. (2021); Stramaglia et al. (2021); Luppi et al. (2022)) is based largely on a statistical inference, while alternative frameworks based on simplicial complexes, algebraic topology, and hypergraphs has been developed largely in parallel Sizemore et al. (2019); Saggar et al. (2018); Billings et al. (2021); Varley et al. (2021b); Stolz et al. (2021); Battiston et al. (2020). How these different mathematical frameworks relate to each other remains an open question, and the potential for a more unified approach to understanding higher-order interactions both in terms of topology and statistical inferences is an alluring promise.
The optimization of maximally synergistic subsets via simulated annealing can be thought of as an attempt to find a maximally efficient, dimensionally-reduced representation of a potentially large data set: when modeling a system, it is generally desirable to capture as many statistical dependencies as possible with the fewest required degrees of freedom. By finding a representation that incorporates synergies while simultaneously pruning redundant information that would be “double counted”, we can attempt to build the most computationally efficient model of a system under study Varley and Hoel (2022); Wollstadt et al. (2021). While dimensionality reduction and feature selection algorithms are widespread in many computational sciences, a rigorous treatment of the ways that synergistic and redundant information can inform the analysis of brain dynamics and functional networks remains a space of active development (for an example, see Novelli et al. (2019); Wollstadt et al. (2021)).
The O-information scales far more gracefully than related measures of synergistic information (such as the partial information decomposition, which is practically impossible to apply to systems larger than 5 elements Gutknecht et al. (2021)). However the combinatorics associated with assessing every possible subsystem becomes intractable as the system size grows, an issue first noted for the TSE complexity. In standard functional and effective network research, it is common to compute all pairwise interactions (which only grows with ), and then filter out spurious edges as needed Novelli et al. (2019). While this may be possible for very small subsystems, it is intractable for larger ones. If one can pre-select a set of elements, then the computation of O-information is trivial up to hundreds of items. However, the requirement to select subsets of interest can itself be computationally intensive and time-consuming. Consequently heuristic measures such as optimization, random sampling, or pre-filtering subsystems to exclude collections of elements will be required.
In this article, we demonstrate how an information-theoretic measure of multivariate interactions (the O-information or synergy) can be used to uncover higher-order interactions in the human brain dynamics. We analytically show that the O-information can be related to an older measure of systemic complexity, the TSE complexity, and from this derive a novel geometric interpretation of redundancy- and synergy-dominated systems. With a combination of random sampling and optimization, we show that a large number of subsystems displaying synergistic dynamics exist in the human brain and that these systems form a highly distributed “shadow structure” that is entirely overlooked in standard, bivariate functional connectivity models. We conclude that the space of higher-order interactions in the human brain represents a large, and under-explored area of study with a rich potential for new discoveries and experimental work.
IV Methods
IV.1 Gaussian Information Theory
In this paper, we focus on higher-order information sharing in fMRI BOLD signals. Prior work has established that BOLD data is well-modeled by multivariate Gaussian distributions Hlinkaa et al. (2011); Liégeois et al. (2021) and that more complex and highly-parameterized models provide little additional benefit Schulz et al. (2020). While information theory was originally formalized in the context of discrete random variables, in the specific case of Gaussian random variables, closed-form estimators exist for almost all the standard information measures (for an accessible review, see Lizier (2014) supplementary material). For a univariate, Gaussian random variable , the entropy (given in nats) is defined as:
| (16) |
For a multivariate Gaussian random variable , the joint entropy is given by:
| (17) |
where refers to the determinant of the covariance matrix of X. The bivariate mutual information (nats) between and is:
| (18) |
where is the Pearson correlation coefficient between and . Note that, since the mutual information is a function of for Gaussian variables, this special case of mutual information is not generally sensitive to non-linear relationships in the data in the way that non-parametric estimators are. Finally, the Gaussian estimator for total correlation is:
| (19) |
From these, it is possible to calculate all of the measures described above (dual total correlation, description complexity, O-information, and TSE complexity) for multivariate Gaussian variables. While the assumption of linearity that comes with a parametric Gaussian model can be limiting, the standard technique for assessing functional connectivity (the Pearson correlation coefficient) makes identical assumptions, so our work is consistent with assumptions made when applying standard approaches to FC analysis.
IV.2 Datasets
Two independent fMRI resting state data sets were employed in the empirical analyses, one derived from the Human Connectome Project (HCP data; Van Essen et al. (2013)) and the other from a recently published open-source repository (MICA; Royer et al. (2021)). The HCP data, derived from a set of 100 unrelated subjects, have been used in several previous studies (for more detailed description see Sporns et al. (2021)). All participants provided informed consent, and the Washington University Institutional Review Board approved all of the study protocols and procedures. A Siemens 3T Connectom Skyra equipped with a 32-channel head coil was used to collect data. Resting-state functional MRI (rs-fMRI) data was acquired during four scans on two separate days. This was done with a gradient-echo echo-planar imaging (EPI) sequence (scan duration: 14:33 min; eyes open). Acquisition parameters of TR = 720 ms, TE = 33.1ms, 52° flip angle, isotropic voxel resolution = 2 mm, with a multiband factor of 8 were used for data collection. A parcellation scheme covering the cerebral cortex developed in ref. Schaefer et al. (2018) was used to map functional data to 200 regions. This parcellation can also be aligned to the canonical resting state networks found in ref. Yeo et al. (2011).
Of the 100 unrelated subjects considered in the original dataset, 95 were retained for inclusion in empirical analysis in this study. Exclusion criteria were established before the present study was conducted. They included the mean and mean absolute deviation of the relative root mean square (RMS) motion across either four resting-state MRI scans or one diffusion MRI scan, resulting in four summary motion measures. Subjects that exceeded 1.5 times the interquartile range (in the adverse direction) of the measurement distribution in two or more of these measures were excluded. Following these criteria, four subjects were excluded. Due to a software error during diffusion MRI processing, one additional subject was excluded. The remaining 95 subjects were 56% female, had a mean age of 29.29 3.66, and an age range of 22 to 36.
The MICA dataset includes 50 unrelated subjects, who also provided written informed consent. The study was approved by the Ethics Committee of the Montreal Neurological Institute and Hospital. Resting state data was collected in a single scan session using a 3T Siemens Magnetom Prisma-Fit with a 64-channel head coil. Resting state scans lasted for 7 minutes during which participants were instructed to look at a fixation cross. Imaging was completed with an EPI sequence, and acquisition parameters of TR = 600ms, TE = 48ms, 52° flip angle, isotropic voxel resolution = 3 mm, and multiband factor 6. The parcellation used in this dataset was the same as the one used for the HCP data (described above).
IV.3 Preprocessing
Minimal preprocessing of the HCP rs-fMRI data followed these steps Glasser et al. (2013): 1) distortion, susceptibility, and motion correction; 2) registration to subjects’ respective T1-weighted data; 3) bias and intensity normalization; 4) projection onto the 32k_fs_LR mesh; and 5) alignment to common space with a multimodal surface registration Robinson et al. (2014). The preprocessing steps described produced an ICA+FIX time series in the CIFTI grayordinate coordinate system. Two additional preprocessing steps were performed: 6) global signal regression and 7) detrending and band pass filtering (0.008 to 0.08 Hz) Parkes et al. (2018). After confound regression and filtering, the first and last 50 frames of the time series were discarded, resulting in a final scan length of 13.2 min (1,100 frames).
Preprocessing of the MICA dataset was performed as described in ref. Royer et al. (2021) for resting state data. Briefly, the data was passed through the Micapipe Cruces et al. (2022) processing pipeline, which includes motion and distortion correction, as well as FSL’s ICA FIX tool trained with an in-house classifier. Time series were projected to each subject’s FreeSurfer surface, where nodes were also defined. Further details about the processing pipeline can be found in Cruces et al. (2022). The data was global signal regressed in addition to the other preprocessing steps described in this pipeline.
For calculating the covariance matrix used in computing O-information, total correlation and dual total correlation, the functional data from all scans and all subjects were combined to create a single COV or FC matrix. Aggregation was carried out by appending the nodal time series across all subjects and runs and then calculating a single Pearson correlation for each node pair. An alternative approach (taking the mean over the single-run, single-subject COV/FC matrices) yielded virtually identical results. Following preprocessing and using the common 200-node parcellation of cerebral cortex, the mean COV/FC matrices for the HCP and MICA data sets were highly correlated ().
IV.4 Random Sampling and Optimization
Subsets of regions were selected from the full-size (200 nodes/regions) FC matrices in two ways, by random sampling and by search through optimization. Random sampling is simple to implement but because of the vast repertoire of potential subsets () it cannot fully disclose the extent of variations in informational measures present in the data. Instead, search under an objective function (optimization) can guide exploration to specific sub-spaces enriched in subsets with distinct informational signatures.
To perform optimizations we implemented a variant of simulated annealing Metropolis et al. (1953). As objectives we chose multivariate informational measures such as the O-information (OI), total correlation (TC), and dual total correlation (DTC), which could be maximized or minimized. Each run of the simulated annealing algorithm was carried out in one FC matrix and for one subset size. We carried out 5000 runs, with subset sizes ranging from 3 to 30 nodes. A random selection of nodes was chosen according to the given subset size to initiate each run. The corresponding covariance matrix was extracted from the full COV/FC and used to compute the information theoretic metric of interest. The composition of the subset was then varied and variations were selected under the objective function. Annealing operates by selecting variations stochastically, depending on a temperature parameter that determines the amount of noise permitted in the selection process. Initially, the temperature is high, resulting in the somewhat random exploration of the landscape. As the temperature is lowered, the optimization becomes more deterministic, focusing more and more on local gradient descent. For each run the algorithm proceeded for a maximum of 10,000 steps. At each step, a new set of nodes was generated by randomly replacing nodes, with the number determined by a normal distribution (frequencies of 1, 2 and 3 element flips were 0.68, 0.27 and 0.04, respectively). A new covariance matrix was computed for the new set of nodes and the objective function was calculated for that set. The set was retained if its cost was lower than the current set or if a random number drawn from the uniform distribution between 0 and 1 was less than , where is the cost of the new set of nodes, is the cost of the current set of nodes and is the current temperature. At each step, the current temperature decays to a fraction of the initial temperature, as a function of the number of steps completed:
| (20) |
where is the current temperature, is the initial temperature (set to ), governs the steepness of the temperature gradient, and is the current iteration step. By decreasing the temperature at every step, the algorithm becomes progressively more deterministic.
Acknowledgements
T.F.V. and M.P. are supported by the NSF-NRT grant 1735095, Interdisciplinary Training in Complex Networks and Systems. The funders had no role in study design, data collection and analysis, decision to publish, or preparation of the manuscript.
References
- Barabási and Pósfai (2016) A.-L. Barabási and M. Pósfai, Network Science (2016).
- Menczer et al. (2020) F. Menczer, S. Fortunato, and C. A. Davis, A First Course in Network Science (2020).
- Sporns and Kötter (2004) O. Sporns and R. Kötter, PLOS Biology 2, e369 (2004).
- Watts and Strogatz (1998) D. J. Watts and S. H. Strogatz, Nature 393, 440 (1998).
- Fortunato (2010) S. Fortunato, Physics Reports 486, 75 (2010).
- Betzel (2020) R. F. Betzel, arXiv:2011.06723 [q-bio] (2020), arXiv: 2011.06723.
- Battiston et al. (2020) F. Battiston, G. Cencetti, I. Iacopini, V. Latora, M. Lucas, A. Patania, J.-G. Young, and G. Petri, Physics Reports Networks beyond pairwise interactions: Structure and dynamics, 874, 1 (2020).
- Battiston et al. (2021) F. Battiston, E. Amico, A. Barrat, G. Bianconi, G. Ferraz de Arruda, B. Franceschiello, I. Iacopini, S. Kéfi, V. Latora, Y. Moreno, M. M. Murray, T. P. Peixoto, F. Vaccarino, and G. Petri, Nature Physics (2021), 10.1038/s41567-021-01371-4.
- Tononi et al. (1994) G. Tononi, O. Sporns, and G. M. Edelman, Proceedings of the National Academy of Sciences 91, 5033 (1994).
- Tononi et al. (1998) G. Tononi, G. M. Edelman, and O. Sporns, Trends in Cognitive Sciences 2, 474 (1998).
- Tononi and Edelman (2000) G. Tononi and G. M. Edelman, Brain Research Reviews 31, 391 (2000).
- Timme et al. (2016a) N. M. Timme, S. Ito, M. Myroshnychenko, S. Nigam, M. Shimono, F.-C. Yeh, P. Hottowy, A. M. Litke, and J. M. Beggs, PLOS Computational Biology 12, e1004858 (2016a).
- Faber et al. (2018) S. P. Faber, N. M. Timme, J. M. Beggs, and E. L. Newman, Network Neuroscience 3, 1 (2018).
- Sherrill et al. (2021) S. P. Sherrill, N. M. Timme, J. M. Beggs, and E. L. Newman, PLOS Computational Biology 17, e1009196 (2021).
- Sherrill et al. (2020) S. P. Sherrill, N. M. Timme, J. M. Beggs, and E. L. Newman, Network Neuroscience 4, 678 (2020).
- Varley et al. (2021a) T. Varley, O. Sporns, H. Scherberger, and B. Dann, bioRxiv , 2021.09.05.458983 (2021a).
- Scagliarini et al. (2021) T. Scagliarini, D. Marinazzo, Y. Guo, S. Stramaglia, and F. E. Rosas, arXiv (2021).
- Rosas et al. (2020) F. E. Rosas, P. A. M. Mediano, H. J. Jensen, A. K. Seth, A. B. Barrett, R. L. Carhart-Harris, and D. Bor, PLOS Computational Biology 16, e1008289 (2020).
- Varley et al. (2020) T. Varley, O. Sporns, A. Puce, and J. Beggs, PLOS Computational Biology 16, e1008418 (2020).
- Luppi et al. (2020) A. I. Luppi, P. A. M. Mediano, F. E. Rosas, J. Allanson, J. D. Pickard, R. L. Carhart-Harris, G. B. Williams, M. M. Craig, P. Finoia, A. M. Owen, L. Naci, D. K. Menon, D. Bor, and E. A. Stamatakis, bioRxiv (2020), 10.1101/2020.11.25.398081.
- Luppi et al. (2022) A. I. Luppi, P. A. M. Mediano, F. E. Rosas, N. Holland, T. D. Fryer, J. T. O’Brien, J. B. Rowe, D. K. Menon, D. Bor, and E. A. Stamatakis, Nature Neuroscience , 1 (2022).
- Gatica et al. (2021) M. Gatica, R. Cofré, P. A. Mediano, F. E. Rosas, P. Orio, I. Diez, S. P. Swinnen, and J. M. Cortes, Brain Connectivity (2021), 10.1089/brain.2020.0982.
- Luppi et al. (2021a) A. I. Luppi, P. A. M. Mediano, F. E. Rosas, D. J. Harrison, R. L. Carhart-Harris, D. Bor, and E. A. Stamatakis, Neuroscience of Consciousness 2021 (2021a), 10.1093/nc/niab027.
- Rosas et al. (2019) F. Rosas, P. A. M. Mediano, M. Gastpar, and H. J. Jensen, Physical Review E 100, 032305 (2019).
- Lizier et al. (2013) J. T. Lizier, B. Flecker, and P. L. Williams, arXiv (2013), 10.1109/ALIFE.2013.6602430.
- James et al. (2011) R. G. James, C. J. Ellison, and J. P. Crutchfield, Chaos: An Interdisciplinary Journal of Nonlinear Science 21, 037109 (2011).
- Deco et al. (2015) G. Deco, G. Tononi, M. Boly, and M. L. Kringelbach, Nature Reviews Neuroscience 16, 430 (2015).
- Shine (2019) J. M. Shine, Trends in Cognitive Sciences 23, 572 (2019).
- Luppi et al. (2019) A. I. Luppi, M. M. Craig, I. Pappas, P. Finoia, G. B. Williams, J. Allanson, J. D. Pickard, A. M. Owen, L. Naci, D. K. Menon, and E. A. Stamatakis, Nature Communications 10, 1 (2019).
- Luppi et al. (2021b) A. I. Luppi, R. L. Carhart-Harris, L. Roseman, I. Pappas, D. K. Menon, and E. A. Stamatakis, NeuroImage 227, 117653 (2021b).
- Williams and Beer (2010) P. L. Williams and R. D. Beer, arXiv (2010).
- McGhee (1991) G. R. McGhee, Short Courses in Paleontology 4, 87 (1991).
- Avena-Koenigsberger et al. (2015) A. Avena-Koenigsberger, J. Goñi, R. Solé, and O. Sporns, Journal of The Royal Society Interface 12, 20140881 (2015).
- Varley et al. (2021b) T. F. Varley, V. Denny, O. Sporns, and A. Patania, Royal Society Open Science 8, 201971 (2021b).
- Cover and Thomas (2012) T. M. Cover and J. A. Thomas, Elements of Information Theory (2012).
- Shannon (1948) C. E. Shannon, Bell System Technical Journal 27, 379 (1948).
- Friston (1994) K. J. Friston, Human Brain Mapping 2, 56 (1994).
- van Diessen et al. (2015) E. van Diessen, T. Numan, E. van Dellen, A. W. van der Kooi, M. Boersma, D. Hofman, R. van Lutterveld, B. W. van Dijk, E. C. W. van Straaten, A. Hillebrand, and C. J. Stam, Clinical Neurophysiology 126, 1468 (2015).
- Ursino et al. (2020) M. Ursino, G. Ricci, and E. Magosso, Frontiers in Computational Neuroscience 14 (2020), 10.3389/fncom.2020.00045.
- Barnett et al. (2020) L. Barnett, S. D. Muthukumaraswamy, R. L. Carhart-Harris, and A. K. Seth, NeuroImage 209, 116462 (2020).
- Sporns (2010) O. Sporns, Networks of the Brain (2010).
- Abdallah and Plumbley (2012) S. A. Abdallah and M. D. Plumbley, Physics Letters A 376, 275 (2012).
- Stramaglia et al. (2021) S. Stramaglia, T. Scagliarini, B. C. Daniels, and D. Marinazzo, Frontiers in Physiology 11 (2021), 10.3389/fphys.2020.595736.
- Sporns et al. (2002) O. Sporns, G. Tononi, and G. M. Edelman, Behavioural Brain Research 135, 69 (2002).
- Ay et al. (2006) N. Ay, E. Olbrich, N. Bertschinger, and J. Jost, ECCS’06 : Proceedings of the European Conference on Complex Systems 2006 (2006).
- Van Essen et al. (2013) D. C. Van Essen, S. M. Smith, D. M. Barch, T. E. J. Behrens, E. Yacoub, and K. Ugurbil, NeuroImage Mapping the Connectome, 80, 62 (2013).
- Royer et al. (2021) J. Royer, R. Rodríguez-Cruces, S. Tavakol, S. Larivière, P. Herholz, Q. Li, R. V. d. Wael, C. Paquola, O. Benkarim, B.-y. Park, A. J. Lowe, D. Margulies, J. Smallwood, A. Bernasconi, N. Bernasconi, B. Frauscher, and B. C. Bernhardt, An Open MRI Dataset for Multiscale Neuroscience, Tech. Rep. (2021).
- Schaefer et al. (2018) A. Schaefer, R. Kong, E. M. Gordon, T. O. Laumann, X.-N. Zuo, A. J. Holmes, S. B. Eickhoff, and B. T. T. Yeo, Cerebral Cortex 28, 3095 (2018).
- Yeo et al. (2011) B. T. Yeo, F. M. Krienen, J. Sepulcre, M. R. Sabuncu, D. Lashkari, M. Hollinshead, J. L. Roffman, J. W. Smoller, L. Zöllei, J. R. Polimeni, B. Fischl, H. Liu, and R. L. Buckner, Journal of Neurophysiology 106, 1125 (2011).
- Griffith and Harel (2013) V. Griffith and J. Harel, arXiv:1311.7442 [cs, math] (2013).
- Ince (2017) R. A. A. Ince, arXiv (2017).
- Finn and Lizier (2020) C. Finn and J. T. Lizier, Entropy 22, 216 (2020).
- Varley (2022) T. F. Varley, arXiv (2022), 10.48550/arXiv.2202.12992.
- Timme et al. (2016b) N. M. Timme, N. J. Marshall, N. Bennett, M. Ripp, E. Lautzenhiser, and J. M. Beggs, Frontiers in Physiology 7 (2016b), 10.3389/fphys.2016.00425.
- Rosas et al. (2022) F. E. Rosas, P. A. M. Mediano, A. I. Luppi, T. F. Varley, J. T. Lizier, S. Stramaglia, H. J. Jensen, and D. Marinazzo, Nature Physics , 1 (2022).
- Varley and Kaminski (2021) T. F. Varley and P. Kaminski, arXiv (2021).
- Sizemore et al. (2019) A. E. Sizemore, J. Phillips-Cremins, R. Ghrist, and D. S. Bassett, Network Neuroscience 3, 656 (2019).
- Saggar et al. (2018) M. Saggar, O. Sporns, J. Gonzalez-Castillo, P. A. Bandettini, G. Carlsson, G. Glover, and A. L. Reiss, Nature Communications 9 (2018), 10.1038/s41467-018-03664-4.
- Billings et al. (2021) J. Billings, M. Saggar, J. Hlinka, S. Keilholz, and G. Petri, Network Neuroscience 5, 549 (2021).
- Stolz et al. (2021) B. J. Stolz, T. Emerson, S. Nahkuri, M. A. Porter, and H. A. Harrington, Journal of Physics: Complexity 2, 035006 (2021).
- Varley and Hoel (2022) T. F. Varley and E. Hoel, Philosophical Transactions of the Royal Society A: Mathematical, Physical and Engineering Sciences 380, 20210150 (2022).
- Wollstadt et al. (2021) P. Wollstadt, S. Schmitt, and M. Wibral, arXiv (2021).
- Novelli et al. (2019) L. Novelli, P. Wollstadt, P. Mediano, M. Wibral, and J. T. Lizier, Network Neuroscience 3, 827 (2019).
- Gutknecht et al. (2021) A. J. Gutknecht, M. Wibral, and A. Makkeh, Proceedings of the Royal Society A: Mathematical, Physical and Engineering Sciences 477, 20210110 (2021).
- Hlinkaa et al. (2011) J. Hlinkaa, M. Paluša, M. Vejmelkaa, D. Mantini, and M. Corbetta, NeuroImage 54, 2218 (2011).
- Liégeois et al. (2021) R. Liégeois, B. T. T. Yeo, and D. Van De Ville, NeuroImage 243, 118518 (2021).
- Schulz et al. (2020) M.-A. Schulz, B. T. T. Yeo, J. T. Vogelstein, J. Mourao-Miranada, J. N. Kather, K. Kording, B. Richards, and D. Bzdok, Nature Communications 11, 4238 (2020).
- Lizier (2014) J. T. Lizier, Frontiers in Robotics and AI 1 (2014), 10.3389/frobt.2014.00011.
- Sporns et al. (2021) O. Sporns, J. Faskowitz, A. S. Teixeira, S. A. Cutts, and R. F. Betzel, Network Neuroscience 5, 405 (2021).
- Glasser et al. (2013) M. F. Glasser, S. N. Sotiropoulos, J. A. Wilson, T. S. Coalson, B. Fischl, J. L. Andersson, J. Xu, S. Jbabdi, M. Webster, J. R. Polimeni, D. C. Van Essen, M. Jenkinson, and WU-Minn HCP Consortium, NeuroImage 80, 105 (2013).
- Robinson et al. (2014) E. C. Robinson, S. Jbabdi, M. F. Glasser, J. Andersson, G. C. Burgess, M. P. Harms, S. M. Smith, D. C. Van Essen, and M. Jenkinson, NeuroImage 100, 414 (2014).
- Parkes et al. (2018) L. Parkes, B. Fulcher, M. Yücel, and A. Fornito, NeuroImage 171, 415 (2018).
- Cruces et al. (2022) R. R. Cruces, J. Royer, P. Herholz, S. Larivière, R. Vos de Wael, C. Paquola, O. Benkarim, B.-y. Park, J. Degré-Pelletier, M. Nelson, J. DeKraker, C. Tardif, J.-B. Poline, L. Concha, and B. C. Bernhardt, Micapipe: A Pipeline for Multimodal Neuroimaging and Connectome Analysis, preprint (2022).
- Metropolis et al. (1953) N. Metropolis, A. W. Rosenbluth, M. N. Rosenbluth, A. H. Teller, and E. Teller, The Journal of Chemical Physics 21, 1087 (1953).