RDU: A Region-based Approach to Form-style Document Understanding
Abstract
Key Information Extraction (KIE) is aimed at extracting structured information (e.g. key-value pairs) from form-style documents (e.g. invoices), which makes an important step towards intelligent document understanding. Previous approaches generally tackle KIE by sequence tagging, which faces difficulty to process non-flatten sequences, especially for table-text mixed documents. These approaches also suffer from the trouble of predefining a fixed set of labels for each type of documents, as well as the label imbalance issue. In this work, we assume Optical Character Recognition (OCR) has been applied to input documents, and reformulate the KIE task as a region prediction problem in the two-dimensional (2D) space given a target field. Following this new setup, we develop a new KIE model named Region-based Document Understanding (RDU) that takes as input the text content and corresponding coordinates of a document, and tries to predict the result by localizing a bounding-box-like region. Our RDU first applies a layout-aware BERT equipped with a soft layout attention masking and bias mechanism to incorporate layout information into the representations. Then, a list of candidate regions is generated from the representations via a Region Proposal Module inspired by computer vision models widely applied for object detection. Finally, a Region Categorization Module and a Region Selection Module are adopted to judge whether a proposed region is valid and select the one with the largest probability from all proposed regions respectively. Experiments on four types of form-style documents show that our proposed method can achieve impressive results. In addition, our RDU model can be trained with different document types seamlessly, which is especially helpful over low-resource documents.
Introduction
Key Information Extraction (KIE) aims to extract structured information, e.g. key (field)-value pairs, from business documents such as invoices, receipts, purchase orders, bank statements, financial reports, etc. (Huang et al. 2019; Jaume, Ekenel, and Thiran 2019; Gralinski et al. 2020; Holt and Chisholm 2018; Yu et al. 2020; Wang et al. 2021). In reality, many companies and organisations use this technique to deal with the large amounts of documents that may vary significantly in content and layout, saving much human effort and cost. In this paper, we address this practical yet challenging task under the assumption that Optical Character Recognition (OCR) has been applied to the documents already.
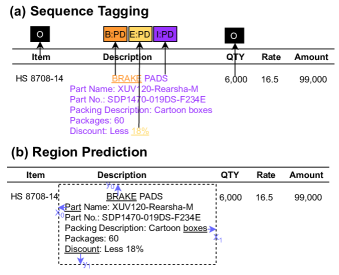
The majority of previous methods transform the two-dimensional document to a one-dimensional input sequence, and formulate the KIE task as a sequence tagging problem (Hwang et al. 2019; Xu et al. 2020; Garncarek et al. 2020; Hong et al. 2021; Yu et al. 2020). These methods first serialize the tokens in the document, and then apply an independent tagging model to classify each token to one of the predefined labels, as illustrated in Figure 1 (a). However, such a sequence tagging approach suffers from several issues that limit its applicability and performance. First of all, due to the diverse and complex spatial layouts of the documents, their serialization is itself a challenging problem that has recently received much research interest (Aggarwal et al. 2020; Li et al. 2020). Also, this requires the definition of customized labels for each type of documents, limiting its application to other domains (Nguyen et al. 2021). Furthermore, sequence tagging may be significantly affected by the existence of imbalanced labels (Tomanek and Hahn 2009; Li et al. 2020).
In this paper, we explore a totally different solution from the traditional sequential tagging. The key idea is to directly locate a bounding-box-like region on the input document and extract the content inside the region as the KIE result. See Figure 1 (b) for an illustration. Given a target field (Product Description) and an OCR processed document (an invoice) as input, the goal is to locate a bounding-box-like region by predicting its four boundary tokens to generate its coordinates, which encloses the value of the field (dotted-line rectangle). This new formulation of the KIE task has several merits. Firstly, by predicting a region in a two-dimensional space instead of the string(s) in a one-dimensional input sequence, the impact of sequential error can be greatly alleviated. Also, by using a two-dimensional region, the KIE model is capable of extracting not only a string of values, but also a column in a table. This is especially important when dealing with table-text mixed documents, as demonstrated in Figure 1 (b), where the Product Description corresponds to a column of the table. Moreover, this approach does not require a predefined label set for each document type as in sequence tagging, and hence gets rid of the bad effect due to imbalanced labels. This also enables a model to be trained on different types of documents seamlessly.
Based on our new formulation of treating KIE as a region prediction problem, we also propose a KIE model named Region-based Document Understanding (RDU). Given an OCR processed document and a target field, RDU first applies a Layout-aware BERT to encode layout information of the document into the representation by leveraging a soft layout attention masking and bias mechanism. Then, some candidate regions are generated from the representations via a Region Proposal Module, which is inspired by object detection models (Girshick et al. 2013; Girshick 2015; Ren et al. 2015). Finally, a Region Categorization Module and a Region Selection Module are respectively adopted to judge whether a proposed region is valid, and select the one with the largest probability, from which the final result is extracted.
Note that although we borrow the concept of generating “region proposals” as in computer vision tasks, we do not tackle KIE as a vision problem; instead, we consider this task from a pure Natural Language Processing perspective. Our proposed RDU takes as input the text content plus coordinates of a document obtained with OCR, and does not use any visual features, which is computationally efficient. We evaluate our method on four different types of documents, including receipts (Huang et al. 2019), invoices, bank statements and bill of ladings. It is shown that RDU can achieve impressive performance on all the types of documents when it is trained separately. We also find that the performance can be further improved if we combine all four document types to train our model. This finding indicates that our task formulation and method may be very helpful for KIE over low-resource document types.
Related Work
Key Information Extraction from Documents
The goal of Key Information Extraction (KIE) is to extract useful structured information from form-style documents such as invoices or medical reports. Previous approaches to KIE generally include three groups based on adopted features: text-only, text-layout, and multimodal models. Text-only methods (Hwang et al. 2019; Guo et al. 2019; Nguyen et al. 2021; Zhu et al. 2021b) treat the document as plain text and only use text information, which usually offer limited performance due to failure to exploit layout information of the input document. Multi-modal models (Xu et al. 2020, 2021b, 2021a; Yu et al. 2020; Appalaraju et al. 2021; Powalski et al. 2021) combine text and vision features and show impressive performance. However, they demand processing over raw images, which costs considerable computational resource and time, hampering their application in the real world. Text-layout models (Katti et al. 2018; Denk and Reisswig 2019; Garncarek et al. 2020; Hong et al. 2021) adopt both text and layout features that are obtained easily from an Optical Character Recognition (OCR) engine, which largely increases the computational efficiency while keeping comparative performance. However, most existing text-layout models address KIE as a sequence tagging problem (Katti et al. 2018; Garncarek et al. 2020; Hong et al. 2021; Zhu et al. 2021a). This setup would hinder the application of the same model over the variety of document types since sequence tagging requires a predefined label set for each document type and suffers from the issues of imbalanced labels. In this work, we re-formalize the KIE task as a region prediction problem in 2D space instead of sequence tagging and propose a RDU model following this new setup, enabling the model to be applied on multiple document types seamlessly.
Layout-aware Transformer
Recently, Layout-aware Transformer has demonstrated noticeable effectiveness for intelligent document understanding, which focuses on exploiting the spatial layout information of the input document. For example, (Garncarek et al. 2020; Xu et al. 2020; Hong et al. 2021; Herzig et al. 2020) extend the positional embeddings by adding the embedding of layout information; (Powalski et al. 2021; Garncarek et al. 2020) choose to modify the raw attention scores in self-attention by adding layout bias terms based on the relative vertical and horizontal distance between two tokens. In our RDU, we adopt both ways to develop a layout-aware BERT. Firstly, we adapt a similar layout embedding method with LayoutLM (Xu et al. 2020) to embed the coordinates of the text, but with modifications which is to embed the width and height instead of bottom-right of a coordinate. We argue that the parameters for the bias terms are not sufficient in number for representing the differences of various layout information (Garncarek et al. 2020; Powalski et al. 2021). Hence, in our model, in addition to a layout attention bias similar as LAMBERT (Garncarek et al. 2020), we also develop a soft layout attention masking method to better differentiate the importance of the text according to the spatial relative distance between words.
Methodology
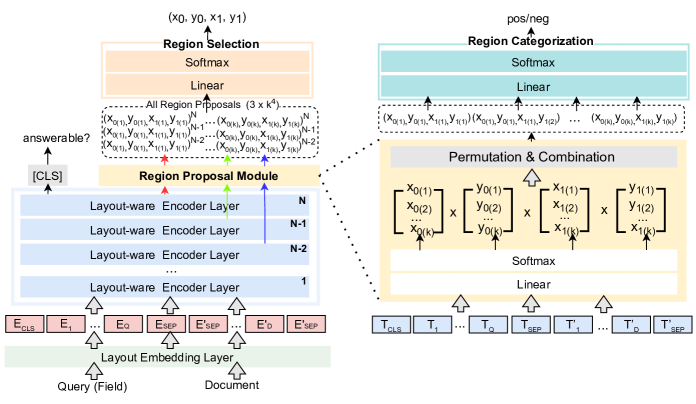
Instead of tackling KIE by sequence tagging, we reformulate it as region prediction over the input document processed by OCR. Then following this new formulation, we develop a Region-based Document Understanding model (abbreviated as RDU). As shown in Figure 2, RDU includes four major parts: 1) a Layout-aware BERT to incorporate spatial layout information of the document into the representation; 2) a Region Proposal Module to propose a list of candidate regions; 3) a Region Categorization Module to judge whether a proposed region is valid or not; and 4) a Region Selection Module to select the best one from all proposed regions.
Task Formulation: Region Prediction
Consider a form-style document. Assume it is pre-processed with an OCR engine and transformed to corresponding text content and coordinates. Serialize and tokenize the text following a left-to-right and top-to-bottom manner based on the coordinates; each token will have its own coordinates. Taking as input the serialized text and corresponding coordinates of this document, the task is to locate a bounding-box-like region by predicting its four boundary tokens and extract all the content inside as the final KIE result for a target field.
Formally, we denote the left, top, right and bottom boundary token of the region as , , and respectively. The coordinates of this region will be . To be more clear, we also take Figure 1 (b) on extracting the given field Product Description from an invoice under our new task formulation as an example. To obtain the target region marked in the dotted-line rectangle, we first predict its four boundary tokens (:Part, :BRAKE, :boxes and : Discount), which are then used to generate the region’s coordinates. Then, all the tokens inside this region will be concatenated following a left-to-right and top-to-bottom manner based on their coordinates as the final result. For each token with coordinates in the document, if , , and , we then regard this token as inside the target region.
Under this novel formulation, we develop a simple yet effective solution to KIE. Below we elaborate on each part of the proposed RDU model sequentially.
Layout-aware BERT
The proposed RDU first applies a Layout-aware BERT built on top of the vanilla BERT (Devlin et al. 2018) to generate the representations. The vanilla BERT (Devlin et al. 2018) is trained on plain text, and hence is “unaware” of the layout information of the document, which however is very crucial to KIE over form-style documents. To effectively encode spatial layout information from the input document into BERT representations, we make two modifications. First, we directly embed the coordinates of each token and add them to the input embeddings in the embedding layer. Second, we apply a soft layout attention masking and bias mechanism when computing the attention scores in self-attention, which depends on the horizontal and vertical relative distance between the tokens. More details are given below.
Layout-aware Embedding
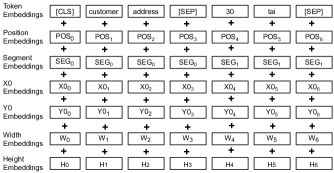
As explained in our new formulation, each token in the input sequence has its own coordinates obtained from OCR processing. We embed the coordinates and add them to the input embedding for this token similar as in LayoutLM (Xu et al. 2020), so as to encode the layout information. See Figure 3 for an illustration. In particular, we normalize and discretize the coordinates of the document to integers within [0, 700] for width and [0, 1000] for height, basically following an A4 paper width/height ratio. Then, we use four separate embedding layers to encode the , , Width and Height of the coordinates of a token. Lastly, we add the four layout embeddings to the input embeddings.
Layout-aware Encoder Layer
We extend the typical transformer encoder layer by applying a soft layout attention masking and bias mechanism to the raw attention scores. This mechanism introduces a soft masking term and a layout attention bias term into the computation of the raw attention scores . These two terms reflect the relative distance between two tokens and in a two-dimensional space based on the intuition that two spatially close tokens should be strongly correlated in semantics and vice versa.
To obtain the final raw attention scores , we multiply the raw attention scores with the masking terms first and then add the bias terms . Formally,
| (1) |
To be more specific, for a token with its coordinates denoted as = (, , , ), we first compute the center point: = (, ); similarly we compute the center of a token : .
To compute the final masking term , we first enable the token to attend to the token by first computing the horizontal masking term and the vertical masking term . We then obtain the final masking term by averaging the above two masking terms. Formally,
| (2) | ||||
| (3) | ||||
| (4) |
Here indicates the sigmoid function; , respectively denote the horizontal and vertical distance between tokens and , which are computed by and respectively; and are the thresholds to make the tokens within the horizontal and vertical distances more important than the ones outside; is a steepness coefficient of the function ; , and are hyper parameters. Since the query/field does not have layout information, we still use the global attention similar to the standard transformer (Vaswani et al. 2017), meaning the tokens in the query can attend to or be attended by all the tokens in the document.
Region Proposal Module
Our Region Proposal Module aims to propose a list of regions that likely include the target value in a 2D space, which is inspired by object detection models (Girshick et al. 2013; Girshick 2015; Ren et al. 2015) but avoids using raw images.
A region in our setup is decided by four boundary tokens represented by (, , , ) corresponding to left, top, right and bottom boundaries respectively. We take the computation of coordinate as an example. As illustrated on the right in Figure 2, this module takes the representations from the layout-aware BERT as input, and predicts the top candidate tokens first using a softmax function. Formally,
| (6) | ||||
| (7) | ||||
| (8) |
Here denotes trainable variables; stands for the outputs of the th layer of the layout-aware BERT; and are the logits and probabilities of the tokens; denotes the predicted top candidate tokens for ; is dot product.
Similarly, we can get the top candidate tokens for , and . After that, a permutation and combination process is applied on all candidate tokens to generate region proposals. In practice, we use the last three layers of layout-aware BERT (based on empirical validation) to generate region proposals, resulting in a total of proposals. Among these proposals, we mask the invalid ones if or .
Region Categorization Module
For each proposed region, we assign a binary class label to define it as valid or not. Similar to (Ren et al. 2015), we assign a positive label to (i) the region with the highest Intersection-over-Union (IoU) overlap with the ground-truth box, or (ii) the region that has an IoU overlap higher than with the ground-truth bounding box. We assign a negative label to a non-positive region if its IoU ratio is lower than . We mask the regions that are neither positive nor negative to ensure that they do not contribute to the training objective.
Before categorizing each region, we need to compute its representation first. Specifically, we represent a region with two features: (i) a content feature that is obtained by applying max-pooling over all tokens within the region, and (ii) a feature of boundaries using the logits of the four boundary tokens obtained in the region proposal step. The two features go through a feed-forward layer separately to get the same hidden size , which are denoted as and , and then are concatenated to form the representation of the region denoted as . Formally,
| (9) | ||||
| (10) | ||||
| (11) |
where and are trainable variables; are all tokens within the region; is max-pooling; ; means concatenation; is the embedding size. After that, a linear layer and a softmax layer are used to predict whether the region is positive or negative:
| (12) |
where is a trainable variable.
Region Selection Module
We the describe how we select the best region from a list of region proposals obtained in the previous step. We treat the region that has the highest IoU overlap with the ground-truth region as the target region. Firstly, we use the same method as in Region Categorization Module to compute the representation of each region, and then apply a linear layer and a softmax layer on all proposed regions. The region with the highest probability is selected by
| (13) |
where is a trainable variable.
Unanswerable Queries
The unanswerable queries refer to the cases where the value of the target field does not exist in the given document. These cases are not rare. To tackle them, we follow the traditional setting of BERT which uses the representation of the token [CLS] for a binary classification task.
Loss Function
Assume the region that has the highest IOU overlap with the ground-truth region is . The loss function is defined as the sum of answerable loss , region categorization loss and region selection loss , which are computed as
| (14) | ||||
| (15) | ||||
| (16) | ||||
| (17) |
Here NLL(·) is the negative log-likelihood loss; is the ground-truth indicating whether the value of the target field exists in the document or not; is the ground-truth category (i.e. positive or negative) of a region; , and are the log-probability of the answerable prediction, region category prediction and region selection respectively; and are the loss weights.
The distribution of proposed regions is usually unbalanced, with a bias towards negative samples. To eliminate the impact of the bias upon training, we set a dynamic loss weight by computing the percentage of the opposite label (positive vs. negative) over the sum of the two labels and multiplying this percentage with the corresponding loss of this label.
Experiments
Datasets
We conduct experiments on four KIE datasets, as summarized in Table 1. Among them, SROIE (Huang et al. 2019) is the most widely used public dataset for KIE, which releases receipts for training and hides receipts for testing. We further split the receipts to train dev and test set in our experiments. Since SROIE also offers its OCR results, including the text and corresponding coordinates, we can obtain the bounding box of the answers via pre-processing.
| No. | Dataset | Train | Dev | Test |
| 1 | SROIE | 439 | 62 | 125 |
| 2 | INV | 1,085 | 155 | 310 |
| 3 | BKS | 614 | 87 | 175 |
| 4 | BL | 568 | 80 | 161 |
| Model | SROIE | INV | BKS | BL |
| EM/F1 | EM/F1 | EM/F1 | EM/F1 | |
| BERT (S) | 55.71/63.43 | 66.62/79.57 | 67.24/71.14 | 27.00/34.72 |
| BERT (H) | 56.31/64.54 | 66.62/80.22 | 68.76/72.88 | 33.12/40.24 |
| RDU (S) | 89.18/93.85 | 75.34/88.56 | 87.79/91.58 | 75.94/82.15 |
| RDU (H) | 90.98/95.32 | 77.96/90.68 | 87.17/90.70 | 74.80/81.68 |
| Dataset | Field | RDU (S) | RDU (H) | ||
| EM | F1 | EM | F1 | ||
| SROIE | Company | 92.00 | 96.85 | 92.00 | 96.68 |
| Date | 98.40 | 98.40 | 99.20 | 99.20 | |
| Address | 80.65 | 94.55 | 83.87 | 96.62 | |
| Total | 85.60 | 85.60 | 88.80 | 88.80 | |
| INV | Invoice No. | 86.77 | 87.17 | 86.45 | 87.07 |
| Issuance Date | 95.16 | 95.38 | 99.35 | 99.35 | |
| Customer Name | 86.60 | 96.89 | 86.60 | 96.85 | |
| Customer Address | 71.91 | 93.68 | 72.24 | 93.53 | |
| Vendor Name | 69.16 | 86.66 | 72.08 | 89.03 | |
| Total Amount | 83.11 | 83.11 | 84.77 | 84.77 | |
| Product Code* | 52.45 | 68.38 | 58.74 | 76.47 | |
| Product Description* | 42.35 | 86.26 | 50.53 | 90.70 | |
| BKS | Bank Name | 87.38 | 89.48 | 87.70 | 89.10 |
| Statement Date | 87.77 | 95.67 | 87.46 | 94.70 | |
| Account Number | 85.60 | 86.12 | 84.44 | 85.21 | |
| Account Holder Name | 93.08 | 97.12 | 91.51 | 96.17 | |
| Account Holder Address | 82.93 | 96.32 | 83.74 | 95.54 | |
| Opening Balance | 91.88 | 91.88 | 92.19 | 92.19 | |
| Closing Balance | 84.38 | 84.38 | 81.88 | 81.88 | |
| BL | BL No. | 75.78 | 78.57 | 79.50 | 80.64 |
| Issuance Date | 70.00 | 74.09 | 68.75 | 72.04 | |
| Issuance Place | 72.30 | 79.29 | 73.65 | 78.15 | |
| Vessel Name | 83.75 | 88.83 | 81.25 | 88.56 | |
| Voyage No. | 77.92 | 79.65 | 76.62 | 78.46 | |
| Port of Loading | 77.02 | 86.11 | 75.16 | 86.77 | |
| Port of Discharge | 81.76 | 88.66 | 78.62 | 88.37 | |
| Place of Delivery | 66.67 | 81.63 | 61.79 | 79.62 | |
The other three datasets, i.e. INV (Invoices), BKS (Bank Statements) and BL (Bill of Ladings), are built and annotated by ourselves. We first gather invoices, bank statements and bill of ladings in English from a variety of real world companies, and process these data with Google OCR111https://cloud.google.com/vision/docs/pdf for scanned PDFs or images and Apache PDFBox222https://pdfbox.apache.org/ for readable PDFs. Then, we employ about university students majored in finance or equivalent disciplines as annotators to annotate each field value by drawing a rectangle on the document with our self-developed dashboard. Each of the datasets is split into train, dev and test set following the ratio 7:1:2.
Evaluation Metrics
We adopt two popular evaluation metrics for extractive question answering (QA) area: Exact Match (EM) and numeracy-focused F1 score similar to those used in (Dua et al. 2019), which both measure the overlap between a bag-of-words representation of the golden answers and predictions. Note that the numeracy-focused F1 will be 0 in case of a number mismatch between gold and predicted answers regardless of any other word overlap.
Baseline
We adapt the classic vanilla BERT to our new task setting as a baseline. After serializing and tokenizing the text following a left-to-right and top-to-bottom manner, vanilla BERT takes the serialized tokens as input and generates the representations. Then, we extend it to predict the four boundary tokens of a region similarly to its basic approach of predicting the start and end tokens of a span answer in extractive QA (Devlin et al. 2018). For each token in the input sequence, its probability scores of being the left/top/right/bottom boundary token are computed by a softmax over all the input tokens. The score of each candidate region is computed by multiplying the probability scores of its four boundary tokens and the valid region with the maximum score is selected.
Implementation
Our RDU is initialized with vanilla BERT and pretrained on form-style documents in an unsupervised manner, since vanilla BERT lacks the understanding of the document layout information. Our pre-training data include text and corresponding bounding box information for 5.3 million English pages of financial statements, invoices, receipts, bank statements and bill of ladings. For the readable PDFs, we apply Apache PDFBox library to extract the text and corresponding coordinates; for scanned PDFs or images, we use Google OCR. We only use the Masked Language Model (MLM) training objective, set longer sequence length and dynamically mask training data for pre-training, following the practice in RoBERTa (Liu et al. 2019).
For all the models, the hidden size and embedding size is set to , and sequence length is . We train all models with an Adam optimizer (Kingma and Ba 2015) and a learning rate of . For Layout-aware BERT, the thresholds and are set to and . The steepness coefficient of the sigmoid function is . In Region Proposal module, we set as 3, i.e. taking the top 3 tokens as candidates for each coordinate. We set loss weights , to and respectively. In pre-training, we train our model using two v100 GPUs for weeks, and in fine-tuning we use one v100 GPU to train one model for up to 30 epochs in days.
Comparison Results
To evaluate the effectiveness of our approach, we run our RDU and the baseline method that are trained separately on each document type, namely INV (Invoices), SROIE (Receipts), BKS (Bank statements) and BL (Bill of ladings), as well as a hybrid of all of them. Models trained on a single document type are marked with a ‘S’ in bracket, meaning Single; similarly, models trained on combined four types of documents are marked with ‘H’ for Hybrid. We summarize the results in Table 2 and present the performance of our RDU model for each field in Table 3.
It can be seen that when trained on each type of documents separately, our RDU model performs much better than the baseline, demonstrating the effectiveness of our design. Especially on BL, the proposed RDU can gain over 47.0% F1 score higher than the baseline method.
We further train both baseline and RDU on the combination of four types of documents, i.e. BERT (H) and RDU (H). From Table 2, we find that the Hybrid models perform similarly or even better than the Single models. In particular, BERT (H) outperforms the BERT (S) on each document type. And, RDU (H) performs better on two document types i.e., INV and SROIE than RDU (S), gaining 1.47% on SROIE and 2.12% on INV in F1 score. This may be because receipts and invoices have similar content or layout, and training on their combination may boost the training over each of them individually. While for other two document types, RDU (H) has a slightly drop, 0.88% on BKS and 0.47% on BL in F1 score. This finding indicates that with our task formulation, a model can be trained on multiple document types and works well. This may be very helpful for KIE over low-resource document types.
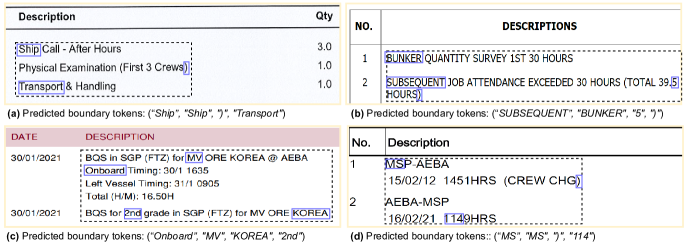
In addition, from Table 3 we can see RDU (H) achieves significantly higher performance on the two “column field” (the value being a column of a table), Produce Code and Product Description, on invoices than RDU (S), achieving 76.47% for Produce Code and 90.70% for Product Description in F1 score. Through error analysis, we find that the RDU (S) model tends to predict a bigger region than the RDU (H), covering more content than the golden answer. The underlying reasons need to be further investigated. In Figure 4 , we present four predicted examples for extracting a column field Product Description.
Ablation Study
We conduct ablation study w.r.t. the layout attention masking, layout attention bias, and Region Categorization module. The results are summarized in Table 4.
We first analyze the influence of our soft layout masking and bias mechanism. By removing either layout masking or layout bias, the model performance has a significantly drop on each of the four datasets. This indicates that they are both effective. Comparing with layout attention masking, the layout attention bias contributes more to the performance, bringing an increase in F1 score of 5.1% on SROIE, 2.15% on INV, 5.62% on BKS and 7.68% on BL. Both layout attention masking and layout attention bias influence the performance most on BL, gaining 3.19% and 7.68% F1 score respectively. This indicates they are more effective for bill of ladings compared to other document types. A possible explanation would be, bill of ladings often have more complex layouts than other document types.
Then, we investigate the importance of the Region Categorization module. By removing this module and only using region selection for deciding the target region, about 1% decrease on EM or F1 can be observed. This indicates the necessity of the multi-task training setting. .
| Model | SROIE | INV | BKS | BL |
| EM/F1 | EM/F1 | EM/F1 | EM/F1 | |
| Full RDU | 90.98/95.32 | 77.96/90.68 | 87.17/90.70 | 74.80/81.68 |
| - LM | 87.78/94.94 | 77.20/90.23 | 85.12/88.98 | 71.86/78.49 |
| - LB | 82.77/90.22 | 75.48/88.53 | 81.40/85.08 | 66.72/74.00 |
| - RC | 88.58/95.64 | 77.03/90.28 | 86.12/89.70 | 74.71/80.46 |
Conclusion and Future Work
We proposed a new formulation of the KIE task, namely treating it as a region prediction problem rather than the traditional sequence tagging. This design greatly relieves the difficulty of processing non-flatten sequences that are very common in table-text documents, and meanwhile enables the model to be applied to various document types. In our experiments, we find that the proposed regions sometimes contain few even no valid regions, which makes our model difficult to be trained. Therefore, for future work we would like to upgrade the Region Proposal module to ensure there will be enough valid regions in the proposals.
References
- Aggarwal et al. (2020) Aggarwal, M.; Gupta, H.; Sarkar, M.; and Krishnamurthy, B. 2020. Form2Seq : A Framework for Higher-Order Form Structure Extraction. In Proceedings of the 2020 Conference on Empirical Methods in Natural Language Processing (EMNLP), 3830–3840. Association for Computational Linguistics.
- Appalaraju et al. (2021) Appalaraju, S.; Jasani, B.; Kota, B. U.; Xie, Y.; and Manmatha, R. 2021. DocFormer: End-to-End Transformer for Document Understanding. CoRR, abs/2106.11539.
- Denk and Reisswig (2019) Denk, T. I.; and Reisswig, C. 2019. BERTgrid: Contextualized Embedding for 2D Document Representation and Understanding. CoRR, abs/1909.04948.
- Devlin et al. (2018) Devlin, J.; Chang, M.; Lee, K.; and Toutanova, K. 2018. BERT: Pre-training of Deep Bidirectional Transformers for Language Understanding. CoRR, abs/1810.04805.
- Dua et al. (2019) Dua, D.; Wang, Y.; Dasigi, P.; Stanovsky, G.; Singh, S.; and Gardner, M. 2019. DROP: A Reading Comprehension Benchmark Requiring Discrete Reasoning Over Paragraphs. In Proc. of NAACL.
- Garncarek et al. (2020) Garncarek, L.; Powalski, R.; Stanislawek, T.; Topolski, B.; Halama, P.; and Gralinski, F. 2020. LAMBERT: Layout-Aware language Modeling using BERT for information extraction. CoRR, abs/2002.08087.
- Girshick (2015) Girshick, R. B. 2015. Fast R-CNN. CoRR, abs/1504.08083.
- Girshick et al. (2013) Girshick, R. B.; Donahue, J.; Darrell, T.; and Malik, J. 2013. Rich feature hierarchies for accurate object detection and semantic segmentation. CoRR, abs/1311.2524.
- Gralinski et al. (2020) Gralinski, F.; Stanislawek, T.; Wróblewska, A.; Lipinski, D.; Kaliska, A.; Rosalska, P.; Topolski, B.; and Biecek, P. 2020. Kleister: A novel task for Information Extraction involving Long Documents with Complex Layout. CoRR, abs/2003.02356.
- Guo et al. (2019) Guo, H.; Qin, X.; Liu, J.; Han, J.; Liu, J.; and Ding, E. 2019. EATEN: Entity-aware Attention for Single Shot Visual Text Extraction. CoRR, abs/1909.09380.
- Herzig et al. (2020) Herzig, J.; Nowak, P. K.; Müller, T.; Piccinno, F.; and Eisenschlos, J. 2020. TaPas: Weakly Supervised Table Parsing via Pre-training. In Proceedings of the 58th Annual Meeting of the Association for Computational Linguistics, 4320–4333. ACL.
- Holt and Chisholm (2018) Holt, X.; and Chisholm, A. 2018. Extracting structured data from invoices. In Proceedings of the Australasian Language Technology Association Workshop 2018, 53–59.
- Hong et al. (2021) Hong, T.; Kim, D.; Ji, M.; Hwang, W.; Nam, D.; and Park, S. 2021. {BROS}: A Pre-trained Language Model for Understanding Texts in Document.
- Huang et al. (2019) Huang, Z.; Chen, K.; He, J.; Bai, X.; Karatzas, D.; Lu, S.; and Jawahar, C. V. 2019. ICDAR2019 Competition on Scanned Receipt OCR and Information Extraction. In 2019 International Conference on Document Analysis and Recognition (ICDAR), 1516–1520.
- Hwang et al. (2019) Hwang, W.; Kim, S.; Seo, M.; Yim, J.; Park, S.; Park, S.; Lee, J.; Lee, B.; and Lee, H. 2019. Post-{OCR} parsing: building simple and robust parser via {BIO} tagging. In Workshop on Document Intelligence at NeurIPS 2019.
- Jaume, Ekenel, and Thiran (2019) Jaume, G.; Ekenel, H. K.; and Thiran, J. 2019. FUNSD: A Dataset for Form Understanding in Noisy Scanned Documents. CoRR, abs/1905.13538.
- Katti et al. (2018) Katti, A. R.; Reisswig, C.; Guder, C.; Brarda, S.; Bickel, S.; Höhne, J.; and Faddoul, J. B. 2018. Chargrid: Towards Understanding 2D Documents. In Proceedings of the 2018 Conference on Empirical Methods in Natural Language Processing.
- Kingma and Ba (2015) Kingma, D. P.; and Ba, J. 2015. Adam: A Method for Stochastic Optimization. In Bengio, Y.; and LeCun, Y., eds., 3rd International Conference on Learning Representations, ICLR 2015, San Diego, CA, USA, May 7-9, 2015, Conference Track Proceedings.
- Li et al. (2020) Li, X.; Sun, X.; Meng, Y.; Liang, J.; Wu, F.; and Li, J. 2020. Dice Loss for Data-imbalanced NLP Tasks. In Proceedings of the 58th Annual Meeting of the Association for Computational Linguistics, 465–476. Association for Computational Linguistics.
- Liu et al. (2019) Liu, Y.; Ott, M.; Goyal, N.; Du, J.; Joshi, M.; Chen, D.; Levy, O.; Lewis, M.; Zettlemoyer, L.; and Stoyanov, V. 2019. RoBERTa: A Robustly Optimized BERT Pretraining Approach. CoRR, abs/1907.11692.
- Nguyen et al. (2021) Nguyen, T. D.; Vu, H. M.; Son, N. H.; and Nguyen, M. 2021. A Span Extraction Approach for Information Extraction on Visually-Rich Documents. CoRR, abs/2106.00978.
- Powalski et al. (2021) Powalski, R.; Borchmann, L.; Jurkiewicz, D.; Dwojak, T.; Pietruszka, M.; and Palka, G. 2021. Going Full-TILT Boogie on Document Understanding with Text-Image-Layout Transformer. CoRR, abs/2102.09550.
- Ren et al. (2015) Ren, S.; He, K.; Girshick, R. B.; and Sun, J. 2015. Faster R-CNN: Towards Real-Time Object Detection with Region Proposal Networks. CoRR, abs/1506.01497.
- Tomanek and Hahn (2009) Tomanek, K.; and Hahn, U. 2009. Reducing Class Imbalance during Active Learning for Named Entity Annotation. In Proceedings of the Fifth International Conference on Knowledge Capture, 105–112. Association for Computing Machinery.
- Vaswani et al. (2017) Vaswani, A.; Shazeer, N.; Parmar, N.; Uszkoreit, J.; Jones, L.; Gomez, A. N.; Kaiser, L.; and Polosukhin, I. 2017. Attention Is All You Need. CoRR, abs/1706.03762.
- Wang et al. (2021) Wang, J.; Liu, C.; Jin, L.; Tang, G.; Zhang, J.; Zhang, S.; Wang, Q.; Wu, Y.; and Cai, M. 2021. Towards Robust Visual Information Extraction in Real World: New Dataset and Novel Solution. In Proceedings of the AAAI Conference on Artificial Intelligence.
- Xu et al. (2020) Xu, Y.; Li, M.; Cui, L.; Huang, S.; Wei, F.; and Zhou, M. 2020. LayoutLM: Pre-Training of Text and Layout for Document Image Understanding. In Proceedings of the 26th ACM SIGKDD International Conference on Knowledge Discovery & Data Mining, 1192–1200. Association for Computing Machinery.
- Xu et al. (2021a) Xu, Y.; Lv, T.; Cui, L.; Wang, G.; Lu, Y.; Florêncio, D.; Zhang, C.; and Wei, F. 2021a. LayoutXLM: Multimodal Pre-training for Multilingual Visually-rich Document Understanding. CoRR, abs/2104.08836.
- Xu et al. (2021b) Xu, Y.; Xu, Y.; Lv, T.; Cui, L.; Wei, F.; Wang, G.; Lu, Y.; Florencio, D.; Zhang, C.; Che, W.; Zhang, M.; and Zhou, L. 2021b. LayoutLMv2: Multi-modal Pre-training for Visually-rich Document Understanding. In Proceedings of the 59th Annual Meeting of the Association for Computational Linguistics and the 11th International Joint Conference on Natural Language Processing (Volume 1: Long Papers), 2579–2591. Association for Computational Linguistics.
- Yu et al. (2020) Yu, W.; Lu, N.; Qi, X.; Gong, P.; and Xiao, R. 2020. PICK: Processing Key Information Extraction from Documents using Improved Graph Learning-Convolutional Networks. In 2020 25th International Conference on Pattern Recognition (ICPR).
- Zhu et al. (2021a) Zhu, F.; Lei, W.; Huang, Y.; Wang, C.; Zhang, S.; Lv, J.; Feng, F.; and Chua, T.-S. 2021a. TAT-QA: A Question Answering Benchmark on a Hybrid of Tabular and Textual Content in Finance. In Proceedings of the 59th Annual Meeting of the Association for Computational Linguistics and the 11th International Joint Conference on Natural Language Processing (Volume 1: Long Papers), 3277–3287. Online: Association for Computational Linguistics.
- Zhu et al. (2021b) Zhu, F.; Lei, W.; Wang, C.; Zheng, J.; Poria, S.; and Chua, T. 2021b. Retrieving and Reading: A Comprehensive Survey on Open-domain Question Answering. CoRR, abs/2101.00774.