OSN Dashboard Tool for Sentiment Analysis
Abstract
The amount of opinionated data on the internet is rapidly increasing. More and more people are sharing their ideas and opinions in reviews, discussion forums, microblogs and general social media. As opinions are central in all human activities, sentiment analysis has been applied to gain insights in this type of data. There are proposed several approaches for sentiment classification. The major drawback is the lack of standardized solutions for classification and high-level visualization. In this study, a sentiment analyzer dashboard for online social networking analysis is proposed. This, to enable people gaining insights in topics interesting to them. The tool allows users to run the desired sentiment analysis algorithm in the dashboard. In addition to providing several visualization types, the dashboard facilitates raw data results from the sentiment classification which can be downloaded for further analysis.
Keywords Sentiment Analysis Machine Learning Twitter Opinion Mining Polarity Assessment
1 Introduction
Sentiment analysis or opinion mining is the computational study of people’s opinions, sentiments, emotions, appraisals, and attitudes towards entities such as products [1, 2, 3], services [4, 5, 6] [7], organizations, individuals [8], education [9, 10, 11], issues [12, 13], movies [14, 15], events [16, 17, 18], topics [19], and their attributes [20, 21]. The main idea with sentiment analysis is to detect polarity in textual data and predict the polarity as either positive, negative or neutral. With the abundance of opinionated data on the internet, this Natural language processing (NLP) technique can be applied to obtain perspective in various topics. Sentiment analysis is applicable when performing decision making tasks. If the uncertainty arises when you are looking to buy a new product, customers will be influenced by product reviews and discussion forums to chose the right product [2]. When conducting business, sentiment analysis can provide the organization important insights in understanding the customers’ feelings towards a product. Since online social media platforms allow users across the world to share ideas, thoughts and feelings, opinion mining is a powerful tool to observe cultural differences because people reason differently [22]. However, recent research shows that countries with similar cultural features acted differently dealing with the coronavirus situation [17]. Sentiment analysis tasks can be carried out at different levels of granularity [9]. The first level is at document level. This analysis is predicting the polarity of sentiments found in the entire document. Second is sentence level sentiment analysis. This refers to classifying the polarity of each sentence. The last level of granularity is the aspect level. Aspect level analysis entails predicting the polarity of different aspect words in a sentence.
Dashboards provide visual representations of data [23]. One of the key features with dashboards, is that they present at-a-glance information. The information on a data dashboard should be easy to understand and look at, rather than complex visualizations that takes a lot of time to process. For example, a car dashboard should be easy to interpret. If it demands too much time to look at, the driver will eventually crash. Dashboards are heavily used in business as it facilitates high-level insights of real time data to monitor the business performance [24]. In addition, it can enhance the decision making of the business. The set of visualization varies from use case to use case, but common visualization types are line charts, bar charts, pie charts and scatter plots. However, certain types of visualization have pre-attentive features where humans can interpret them before paying attention. These kinds of visualization include comparing the length of elements (bar chart) and their positions in two-dimensional space (line charts) [25].
In this article, the main objective is to create a sentiment analyzer dashboard for online social networking analysis. The study is focusing on collecting social media posts from Twitter, as it is one of the most widely used social platforms, having over 365 million users [26]. In addition, the publicly available Twitter API allows for easy fetching of posts. The OSN dashboard will fetch Twitter posts based on given input criteria from the user and perform document sentiment analysis on them. The dashboard will provide an overview of the sentiment polarity in those tweets and the ability to identify trends on people across the world towards a topic of interest.
The contributions of this research work are the following:
-
•
A sentiment analyzer dashboard for Twitter data.
-
•
Perform sentiment analysis on various topics.
-
•
Apply different sentiment analysis algorithm on Twitter data.
-
•
Monitoring interesting trends across the world.
-
•
Accessing raw data for further analysis.
The rest of the article is structured as follow. Section 2 entails related work regarding sentiment analysis and dashboards. The method, including architecture, design and implementation, is presented in section 3. In section 4, we present results and discussions, followed by conclusion and future work in section 5.
2 Related Work
2.1 Sentiment Analysis
Sentiment analysis has become a popular research field in natural language processing (NLP) [27]. Particularly, performing sentiment polarity assessment on Twitter data has been applied in various application domains including forecasting stock prices [28, 29, 30], students’ feedback [11] and predicting president elections [31]. There is a great amount of literature on the subject. For example, [9] provide a systematic mapping study of reviewing literature on sentiment analysis in the context of the education domain. The results show 92 relevant studies conducted between 2015 and 2020. This supports that the field is extensively researched and rapidly growing. There are proposed several approaches to automatic sentiment categorization. Methods can be lexicon-based [32] and dictionary-based [33]. However, recent literature show a transfer from pure NLP techniques to machine learning and deep learning approaches [34]. The major drawback with the methods for sentiment analysis, is the lack of standardized solutions. Current solutions are programming language dependent and perform only certain tasks [9]. Some existing sentiment analysis algorithms are TextBlob, VADER, Flair and Stanza. Table 1 shows an overview of their approach and the accuracy achieved by them on the Sentiment140 dataset.
| Model | Name | Dataset | Accuracy |
|---|---|---|---|
| Lexicon | TextBlob | Sentiment140 | 65.06 |
| Lexicon | Vader | Sentiment140 | 72.29 |
| LSTM | Flair | Sentiment140 | 94.09 |
| CNN | Stanza | Sentiment140 | 88.18 |
The authors in [35] address the issue that off-the-shelf sentiment analysis tools are primarily trained on general social media data. Therefore, a classifier trained to support sentiment analysis in developers’ communication channels is proposed to accommodate jargon within technical domains. The model exploited a series of lexicon-based, keyword-based [36, 37], and semantic-based features [38, 39, 40]. It was trained on a dataset consisting of over 4000 posts on Stack Overflow. With respect to an off-the-shelf sentiment analysis baseline, SentiStrength, results show that the proposed model improves 19% in precision for negative polarity and a 25% improvement in recall for the neutral class.
Research conducted by Imran et al. [17] propose cross-cultural polarity and emotion detection in the context of COVID-19 tweets. Deep learning models were used to classify positive and negative sentiments and corresponding emotions in tweets. The performance of the trained models provided state of the art accuracy of the sentiment140 dataset.
Due to the fact that many people express feelings in their native languages, literature has attempted to develop approaches for multilingual sentiment analysis [41, 42]. Zhu et al. propose a semi-supervised method based on bootstrapping and a SVM classifier to predict sentiment and polarity classification on microblog data [43]. Various combination of features such as the word and part of speech were used to improve the performance. A problem with multilingual sentiment analysis is the lack of lexical resources [44, 45]. This can be solved by utilizing translation systems [46] and synthetic data [47] which also can affect the validity of the original resource. In that case, the authors in [48] propose a concept-level knowledge base for multilingual sentiment analysis which is available in 40 languages.
2.2 Dashboards
Mahadzir et al. [49] developed a sentiment analysis dashboard using real-time Twitter data, with the objective to understand the imbalance between supply and demand in the property industry of Malaysia. Data was extracted by limiting the Twitter posts to a specific keyword. Twitter posts were retrieved in both Malay and English. The authors performed sentence-based and aspect-based classification using a Naıve Bayes classifier to predict the polarity of the overall tweet and the polarity of the aspects within the post. The dashboard provided an overview of the overall sentiment and aspect-based analysis, real-time Twitter monitoring statistics and the detail of tweets based on their features and polarity. There are some limitations with this study. First, it is domain specific and lets users only get an overview of the property industry in Malaysia. Second, only 745 tweets was collected related to the domain. Maybe utilizing other social media platforms would resulted in more data. Lastly, the data was classified using one machine learning algorithm. By supporting the users to choose the desired sentiment analysis approach to be used in the dashboard, the results may change.
Most existing sentiment analysis dashboards are highly based on customer reviews. Different organizations use these dashboards to retrieve feedback from customers related to specific products and services. The solutions mine opinions from websites such as Amazon Reviews [50], Google Reviews and social media including YouTube, Twitter, Twitch and TikTok. Brandwatch 1 and Repustate 2 are examples of such customer intelligence platforms. The former is using a hybrid approach of manual and automated NLP techniques when assessing sentiments. Their approach is structured in three steps: In the first step, a sentence is processed trough a knowledge based rule and is classified as positive, neutral or negative. The rules are based on common language and does not deal with domain specific language. The second step deals with sentences that the knowledge based system is unable to classify. Here, the sentence is processed through a machine learning classifier that is taught to understand technical jargon. Lastly, the third step enables users to customize rules that are domain specific which will enhance the accuracy of the model. Repustate uses an extensive multilingual sentiment analysis approach which classifies sentiments in 23 languages. This can be helpful for international brands to perceive different opinions across regions and cultures.
3 Methodology
This section entails the architecture aspect of the application and the funcational requirements for the tool.
3.1 Architecture
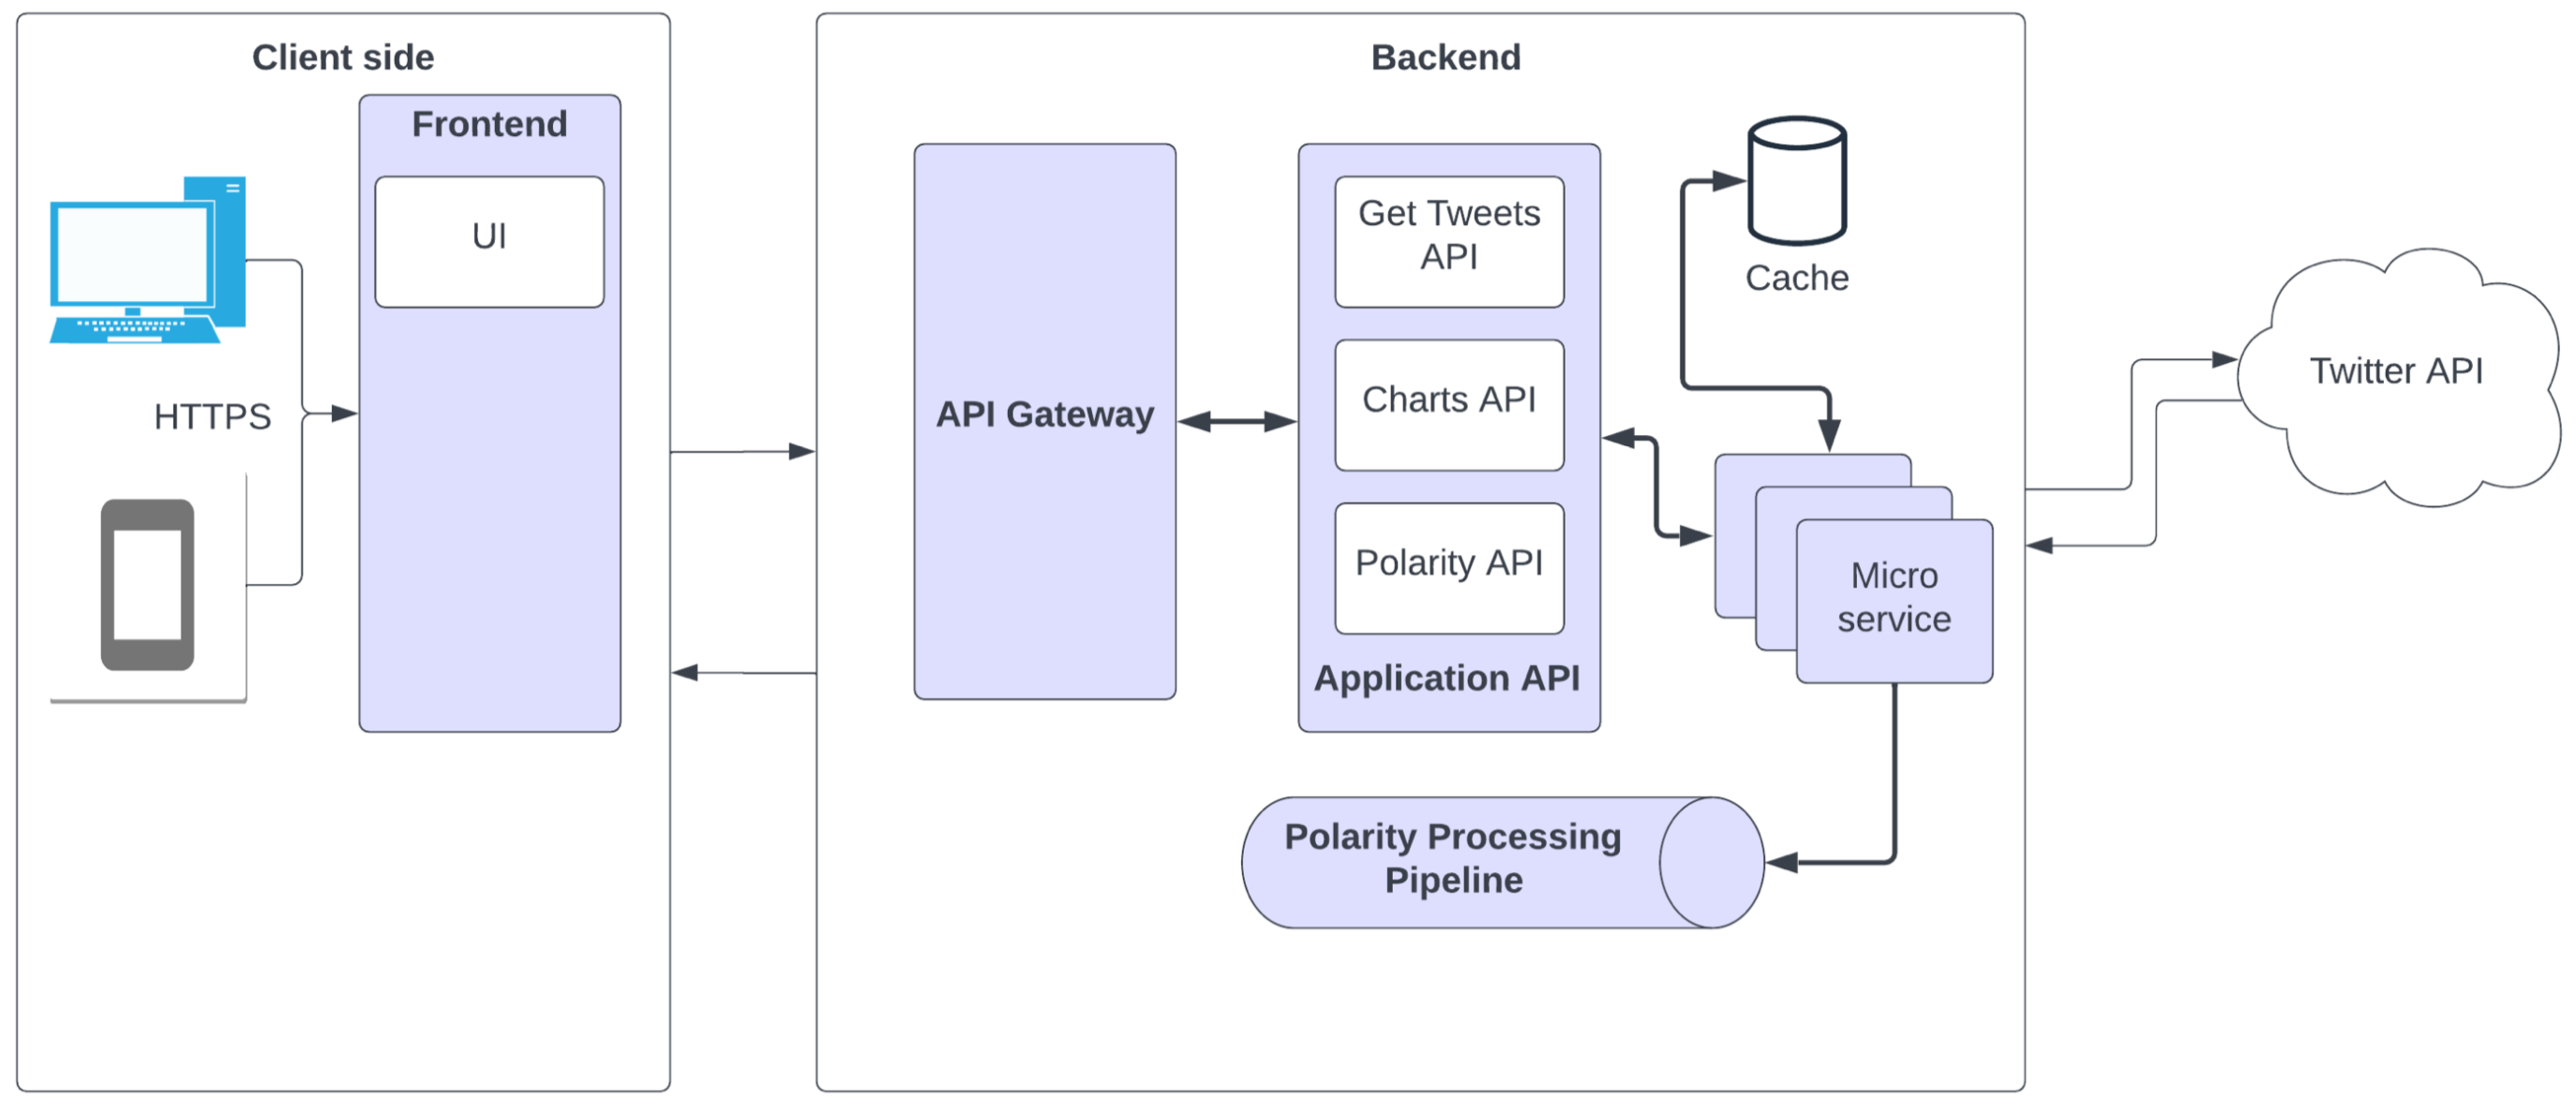
The high-level architecture for the dashboard is made up of a microservices architecture, as shown in Figure 1. The main separation in the architecture is between the client side and backend. The client side is for the content that is displayed on the end-devices such as PC and smartphone while the backend is where the data is gathered and processed. To give a more detailed description of each component in the architecture: On the client side is a frontend service represented as a web application. In the back-end there is an "API Gateway" that handles all the tasks involved in accepting and processing up to hundreds of thousands concurrent API calls, that are presented in the "Application API" service. The API calls gather the data from the respective microservice that handles the part of the process. For the most demanding tasks, there will be a caching service, for example collecting a lot of tweets in real-time. Connected to the polarity microservice is a "Polarity Processing Pipeline" to handle big data in real-time with regards to social media posts. The Twitter API is added as a 3rd party service connected to the backend.
A microservices architecture offers several benefits. Since the functionality is decoupled into separate services, it becomes possible to deploy and make changes to each service independently from the rest of the application. Whereas in a monolithic application, adding new features requires the entire application to be redeployed, and changing one feature might also result in unwanted side effects in other parts of the application [51]. For example, with a microservices architecture, we are able to easily change our microservice that is responsible for the sentiment analysis.
Another benefit of microservices architecture, is that it is easier to maintain each microservice. A monolithic application can become quite complex as it grows, with many different features that depends on each other. With a microservices architecture, each microservice only has one responsibility [51].
Having an application split into separate microservices also allows each microservice to be written in different programming languages. This allows the programmers to choose the language that is best suited for a microservice’s task [51].
There are however some drawbacks that needs to be taken into account when using a microservices architecture. Microservices increases the complexity of the application, as it introduces more points of failure, since microservices needs to communicate with each other. The application needs error handling to take care of cases where a microservice is unavailable. If a microservice fails, it is important that data between each microservice stays consistent [51].
An application with a microservices architecture might also perform slower due to network latency when microservices communicate with each other, while a monolithic application can call functions directly [51].
3.2 Functional requirements
As introduced in Section 1, the tool will fetch Twitter posts and provide a sentiment analysis overview on the given different topics. To be able to reach the end goals, we formulated functional requirements which describe the functionality of the system:
-
•
The system must allow users to search on Twitter posts based on keywords, hashtags and usernames.
-
•
The system must allow users to perform a extended search on Twitter posts including language, time frame, origin and the number of posts.
-
•
The system must allow users to perform sentiment analysis on the Twitter posts.
-
•
The system must allow users to choose the desired sentiment analysis algorithm to use in the dashboard.
-
•
The system must provide appropriate data visualization such as plots, word cloud and map.
-
•
The system must allow users to monitor the raw data provided by the dashboard.
-
•
The system must allow users to download the raw data in a .csv format.
The following non-functional requirements are also created:
-
•
The user must be able to perform a simple search within max two steps.
-
•
The application should handle 100 requests simultaneously when requesting less than 1000 Tweets.
-
•
When requesting x Tweets each page must load within second(s).
-
•
The system must meet Web Content Accessibility Guidelines WCAG 2.1.
3.3 Implementation
The backend will consist of a Flask111https://flask.palletsprojects.com/en/2.1.x/ API framework and Redis222https://redis.io/ for database cache. Redis will be connected to API calls that fetches data from the Twitter API. This is done to make the API calls faster and less fragile for DDOS attacks. The cache time will be set to 60 seconds, because the user expects the latest Tweets to be returned.
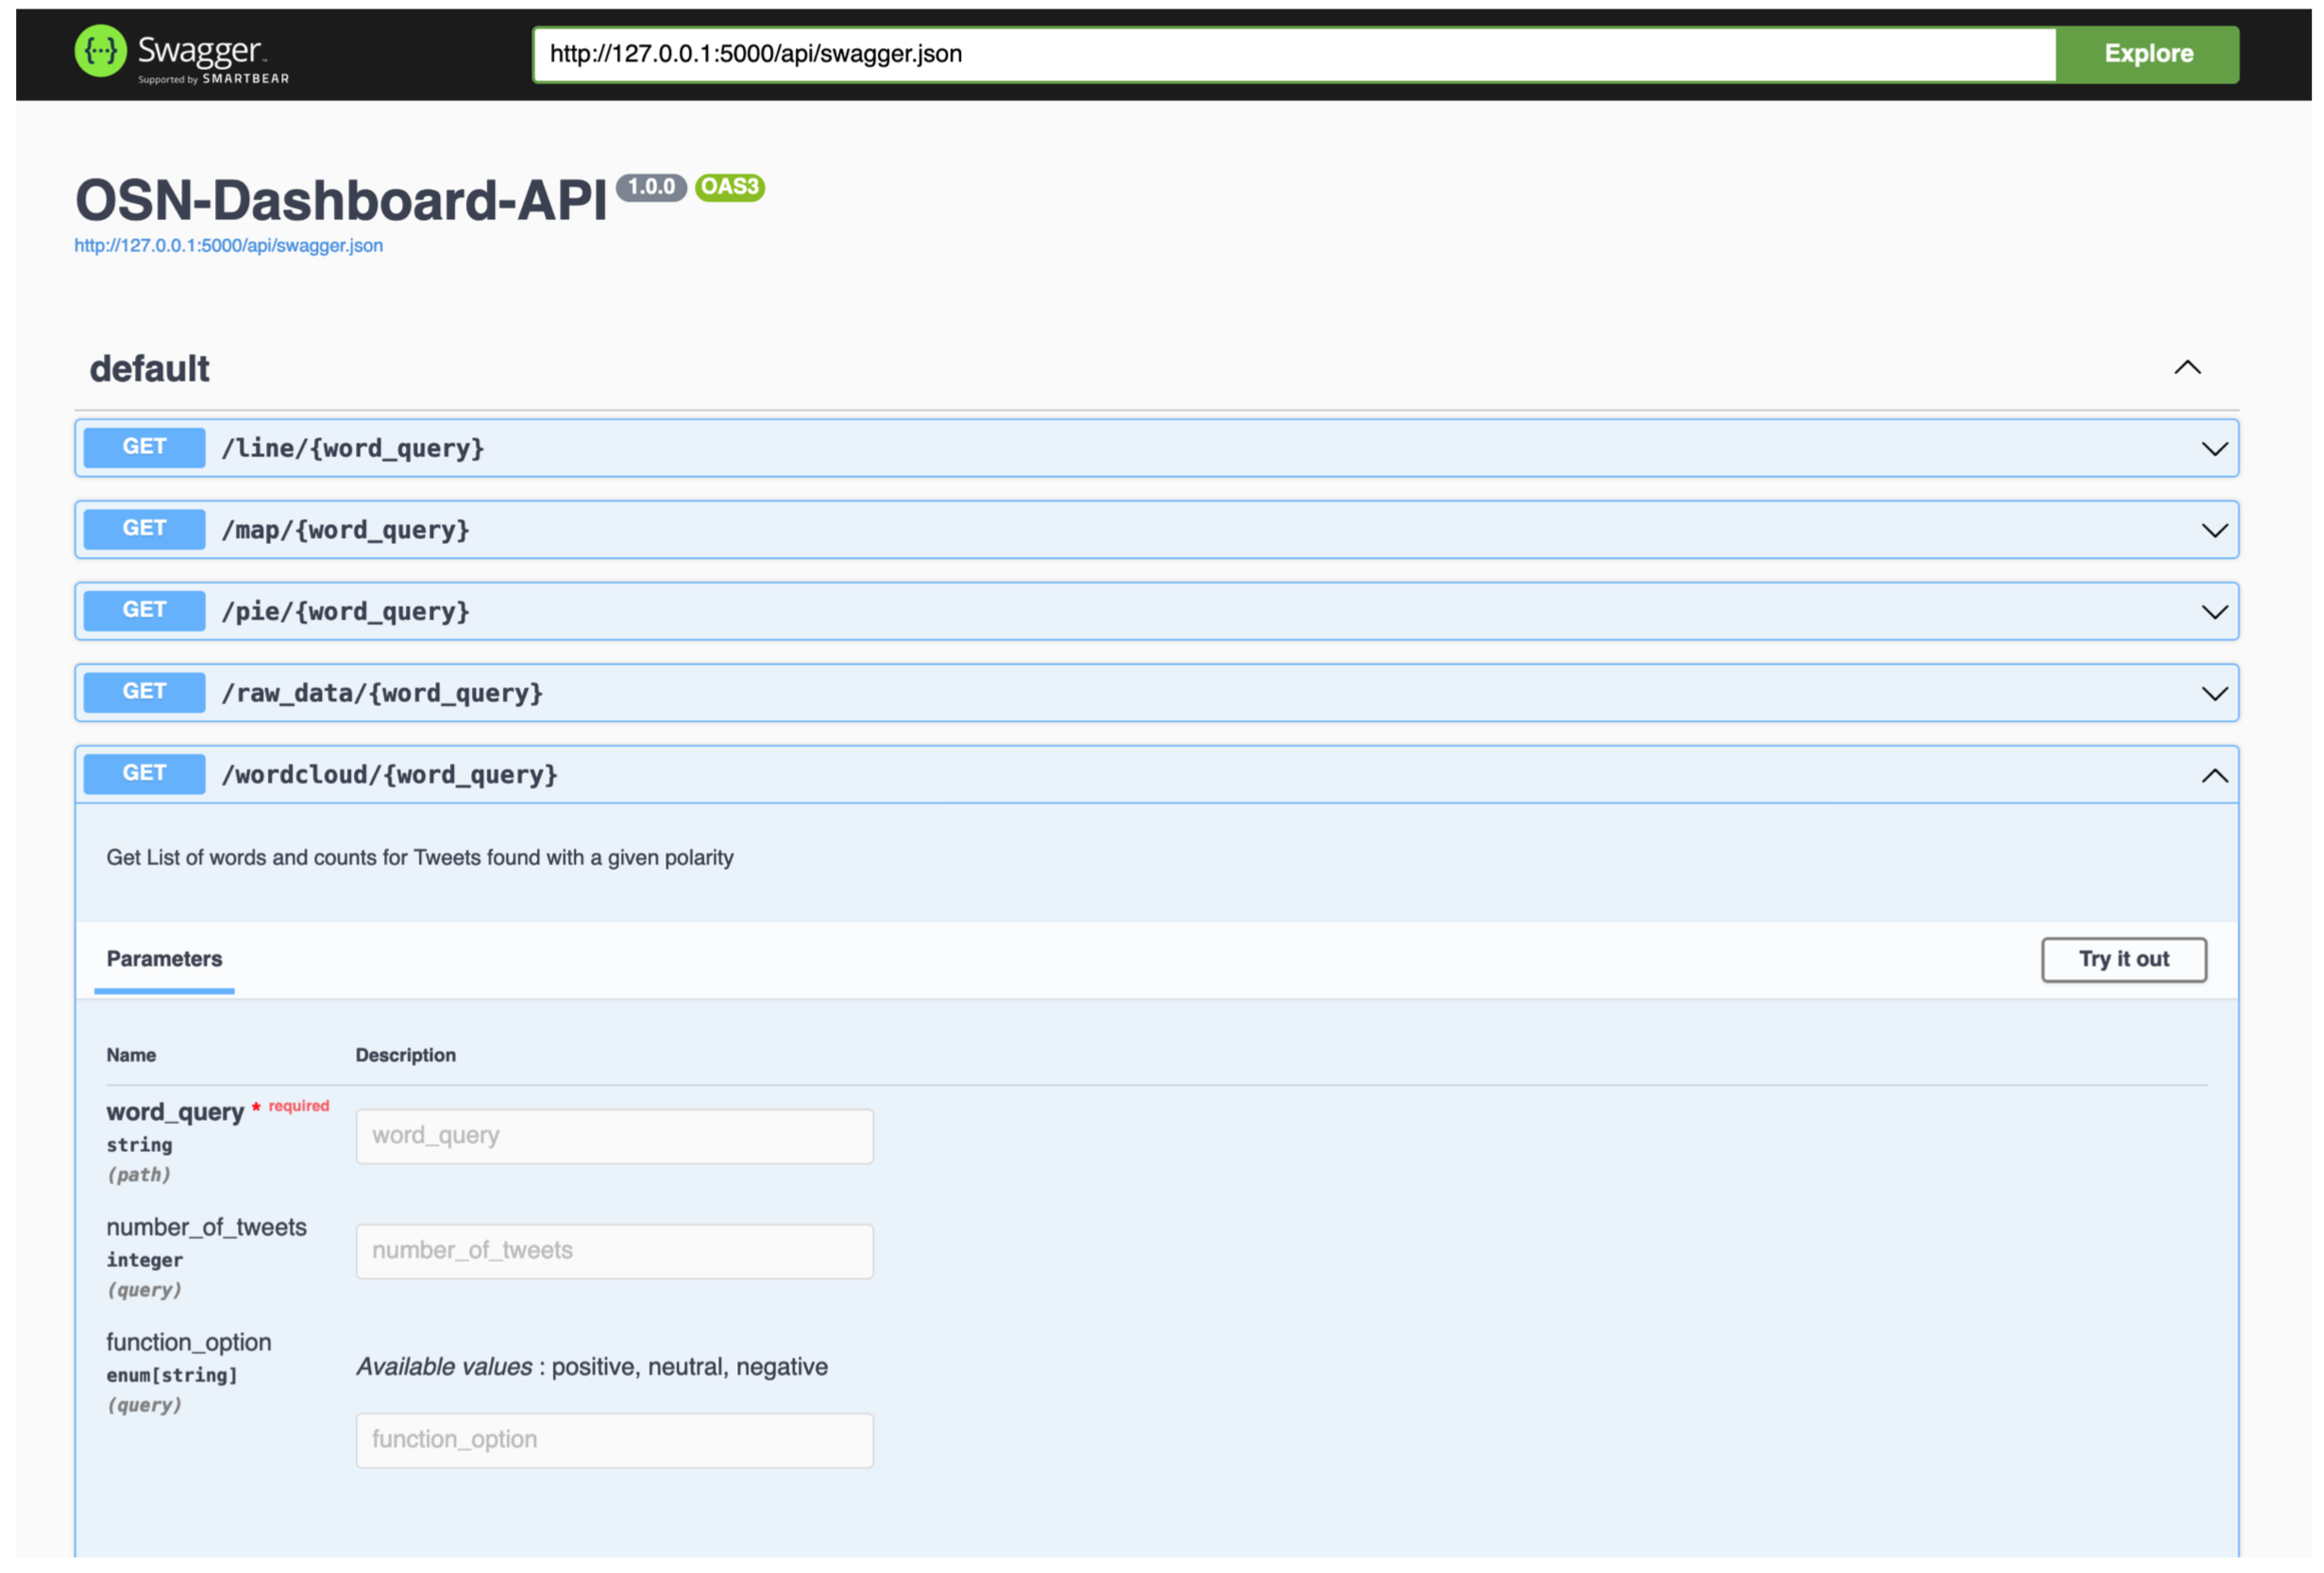
The API will be a REST API that have multiple API calls. Each call will be independent to each module in the frontend (pie chart, raw table data, etc.). The documentation will be provided with Swagger333https://swagger.io/ that also functions like a user interface for the API calls, like shown in Figure 2. Each call will be made with focus on minimising bigger calls to the Twitter API, because that is demanding and time consuming.
The frontend is built using the web framework React444https://reactjs.org/.
Table 2 summarizes the major security concerns for the tool.
| Type | Requirement Description | Comments | Priority |
|---|---|---|---|
| Authentication | The system shall have authentication measures at all the entry points or inbound network connection. | To avoid unauthorized access | 1 |
| The system shall support authentication based on a API token with the back-end. | Improving the security using a unique token. | 1 | |
| The system shall only allow incoming network requests from within a network. | To avoid unauthorized access. | 2 | |
| Availability | There has to be a hard limit for how many Tweets to fetch. | To not create a huge overhead. | 3 |
| The system shall apply caching of Twitter data | Help minimizing the impact of potential system failures. | 3 | |
| Auditing | The system shall keep historical records (logging) of events and processes executed in or by the application. | Define more specific security loggings to allow recreating a clear picture of security events. | 1 |
| Authorization | The user token shall possess privileges within the application to perform their activities. However, the privileges must be limited. | Avoid an unauthorized user execute activities as another user. | 1 |
| The system shall ensure system level accounts have limited privileges. | Help avoiding attackers escalate user’s accounts to access administrator’s features. | 1 | |
| The system shall ensure the Twitter token is performed using parameterized store procedures to allow all access to be revoked. | Apply security principles. | 1 |
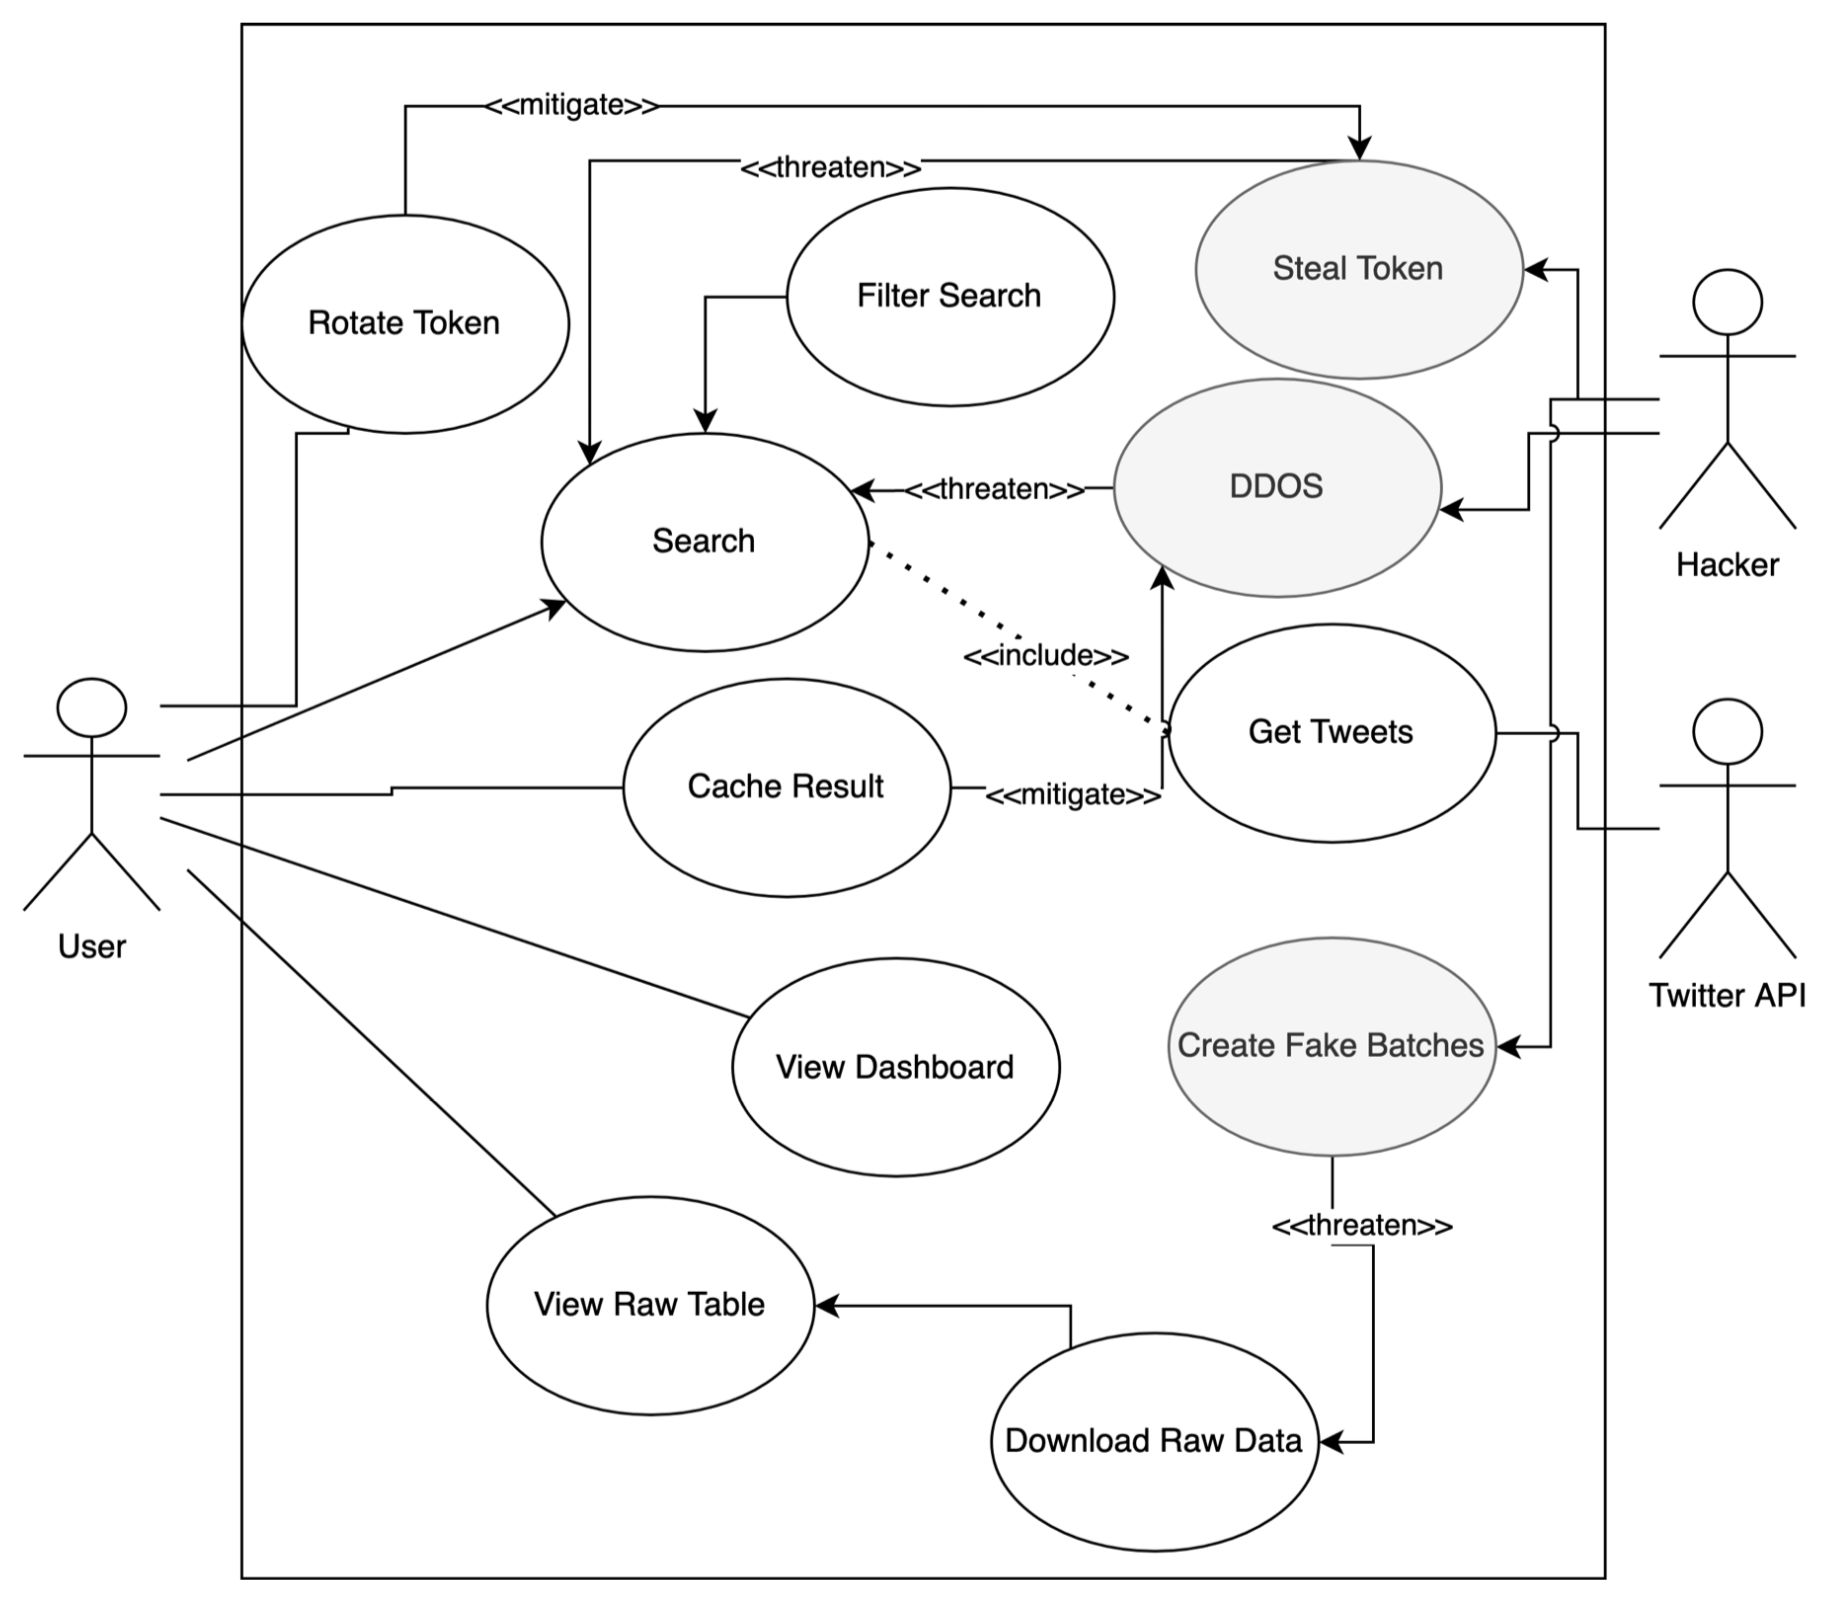
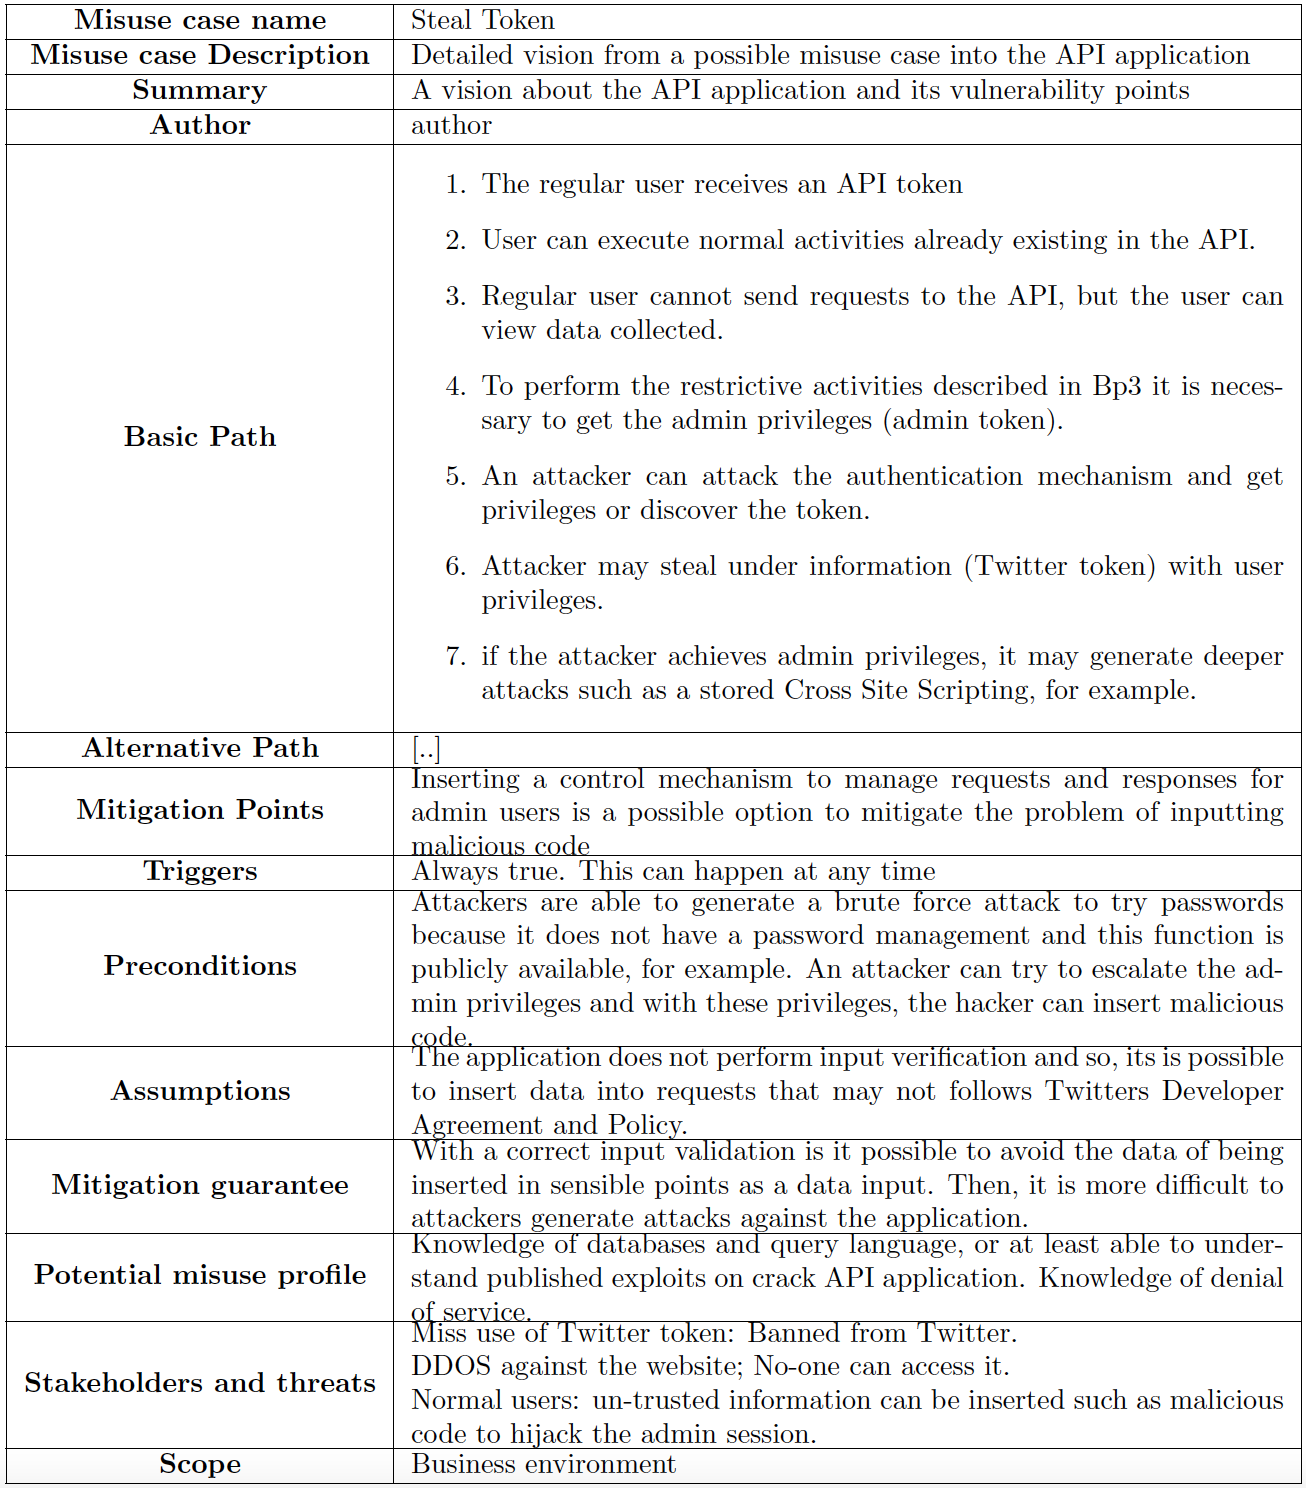
The research work in 3 illustrates how a hacker can exploit the system. In this Section there is created an abuse case description for one misuse case. This approach allows the Test Analyst to create test cases for Security Requirements.
3.4 Design principles
The following design principles are considered in this study.
Least privilege: When utilizing the API, different users should have different privileges. By following the least privilege principle that minimize the occurrence of unintentional, unwanted, or improper uses of privileges.
Minimizing attack surface area: The minimizing attack surface principle will be used to minimize the entry points to the application. Since the Token from Twitter has a limit in number of fetch data, it is required to limit access for only authorized users and the application can only be used within an institution’s network.
Economy of mechanism: This principle will be covered by implementing simpler and smaller functions that are easy to maintain.
Fail securely: It is important that the application do not crash unexpectedly. Therefore, will the fail securely principle by handling errors, such as timeouts and fault inputs.
Do NOT trust: This principle will be implemented by restricting user’s access, and validate user input.
4 Results & Discussions
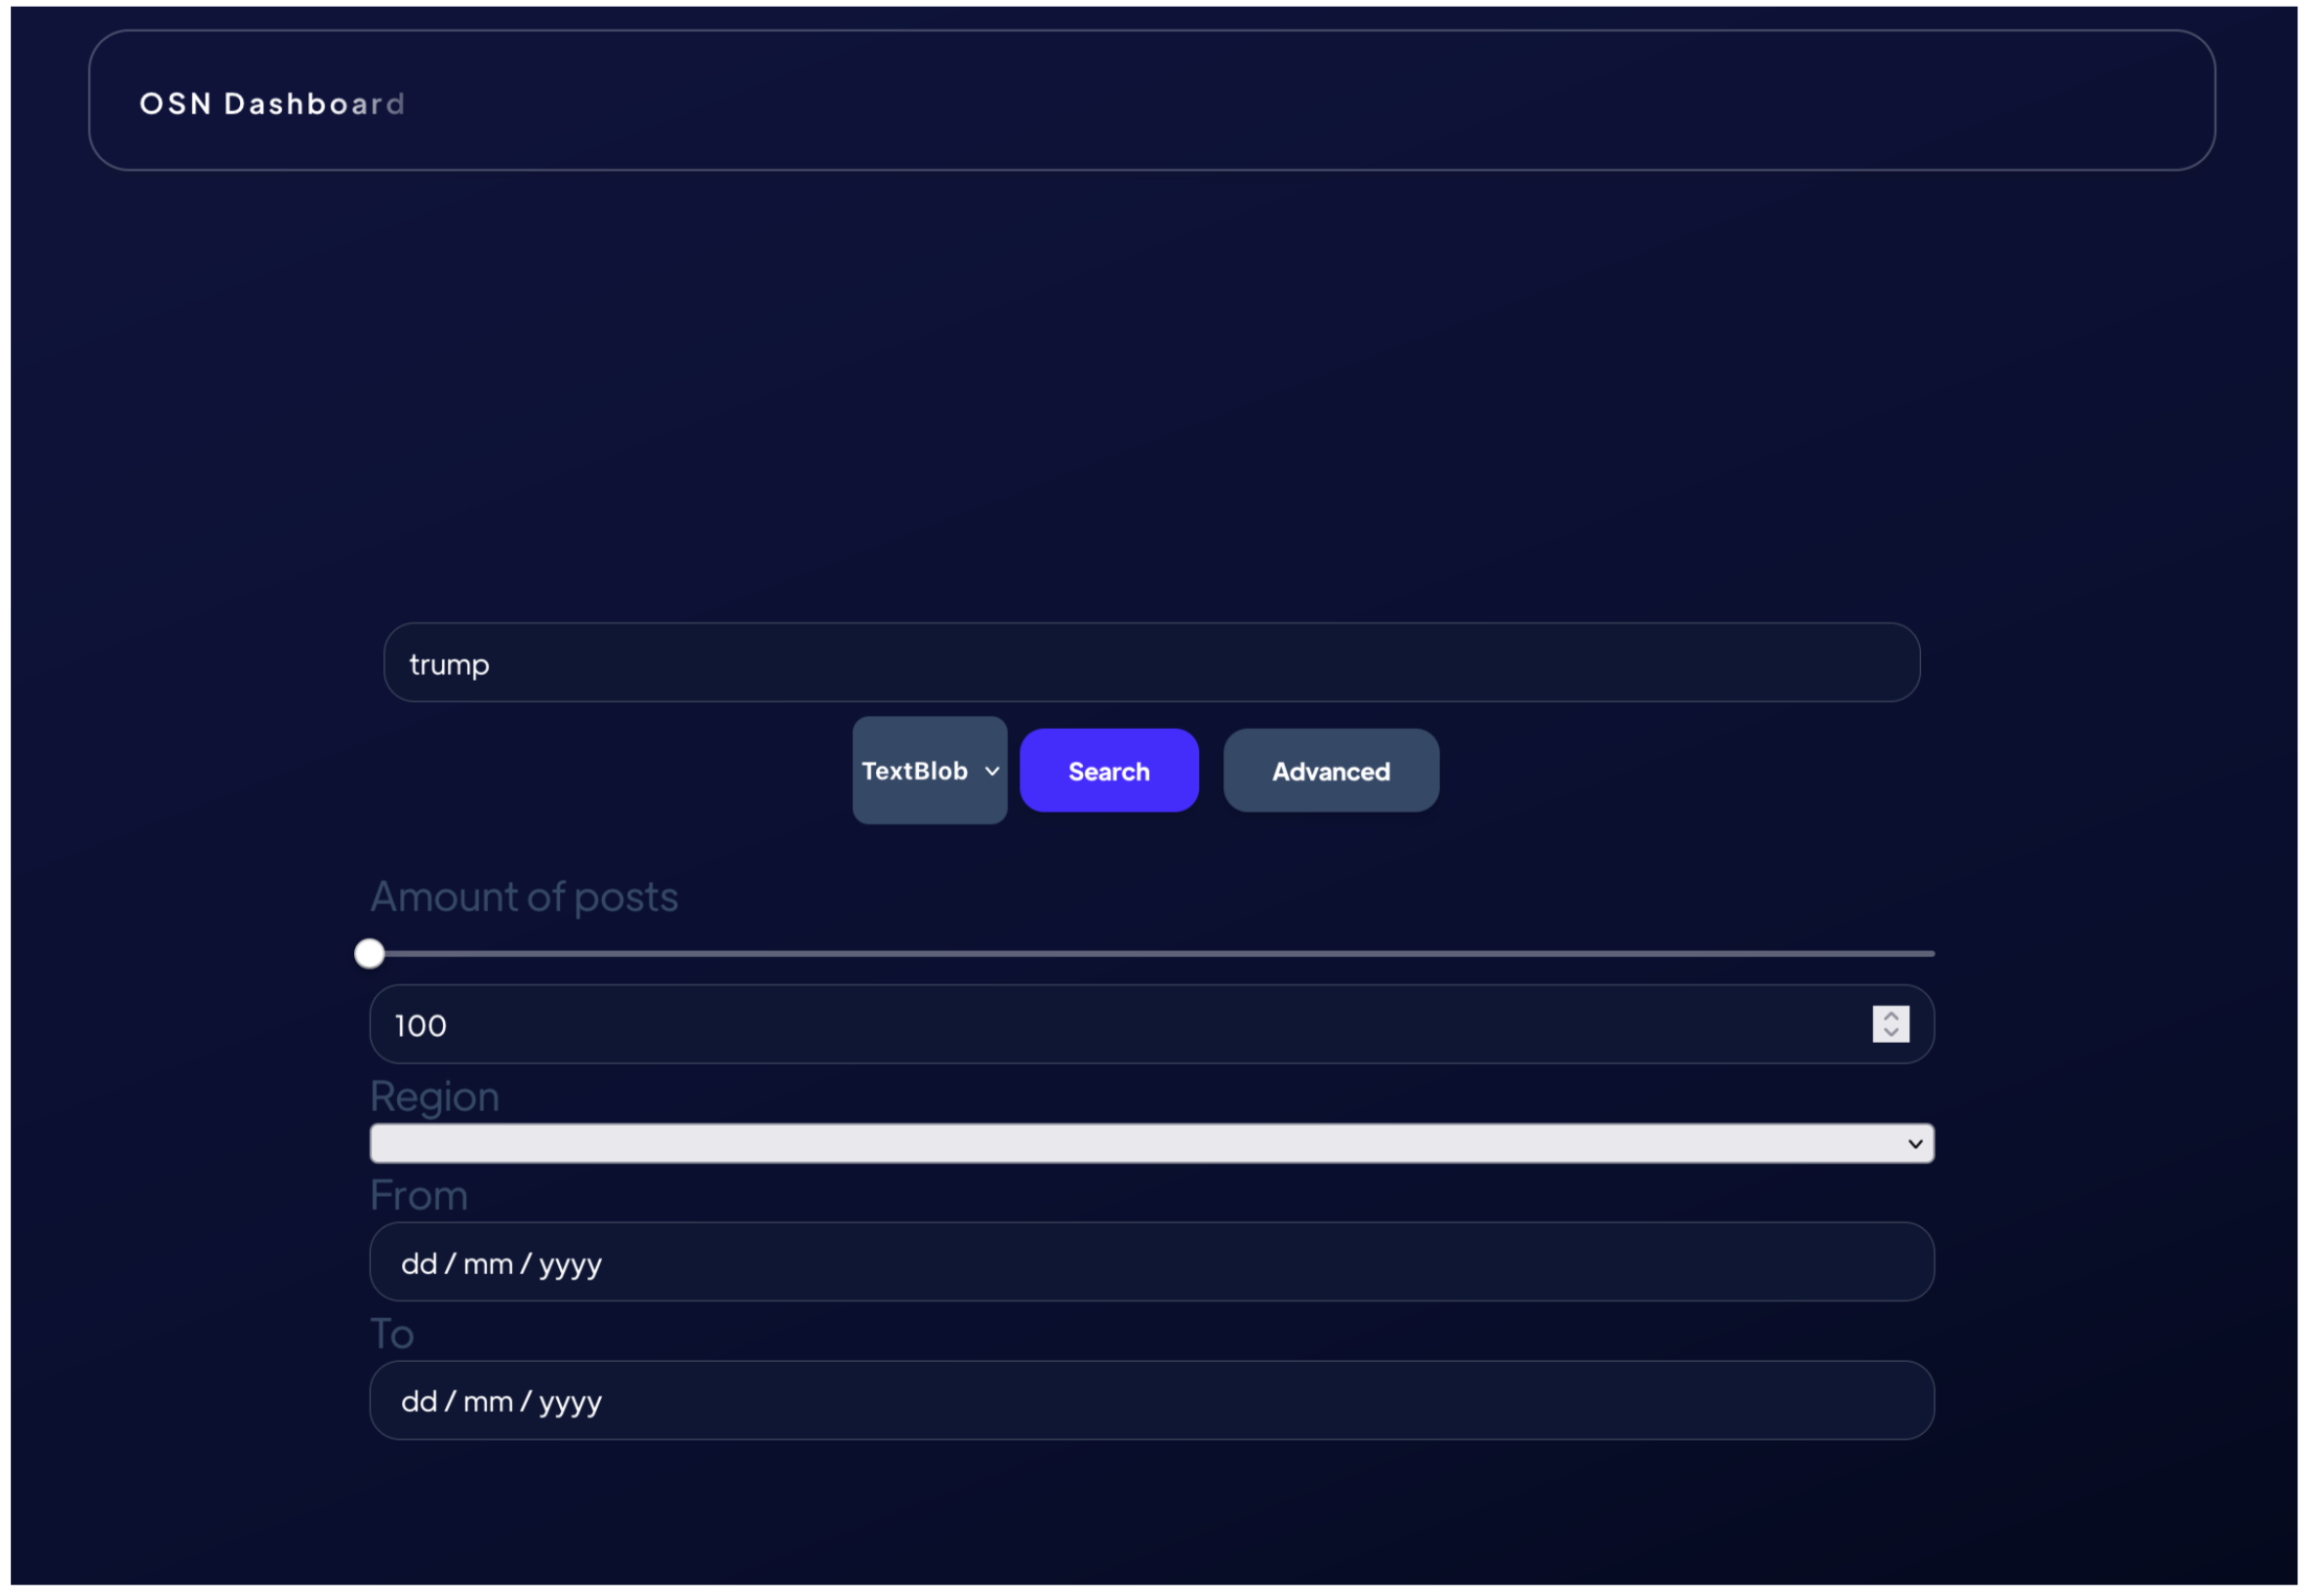
Following the design principles described in Section 3.4, the final product is created. Figure 5 illustrates the search page. Here, users can search on tweets based on keywords, username or hashtags. In addition the user can choose a preferable sentiment algorithm to use in the dashboard. The users can also extend the search by applying more criteria in the advanced search page.
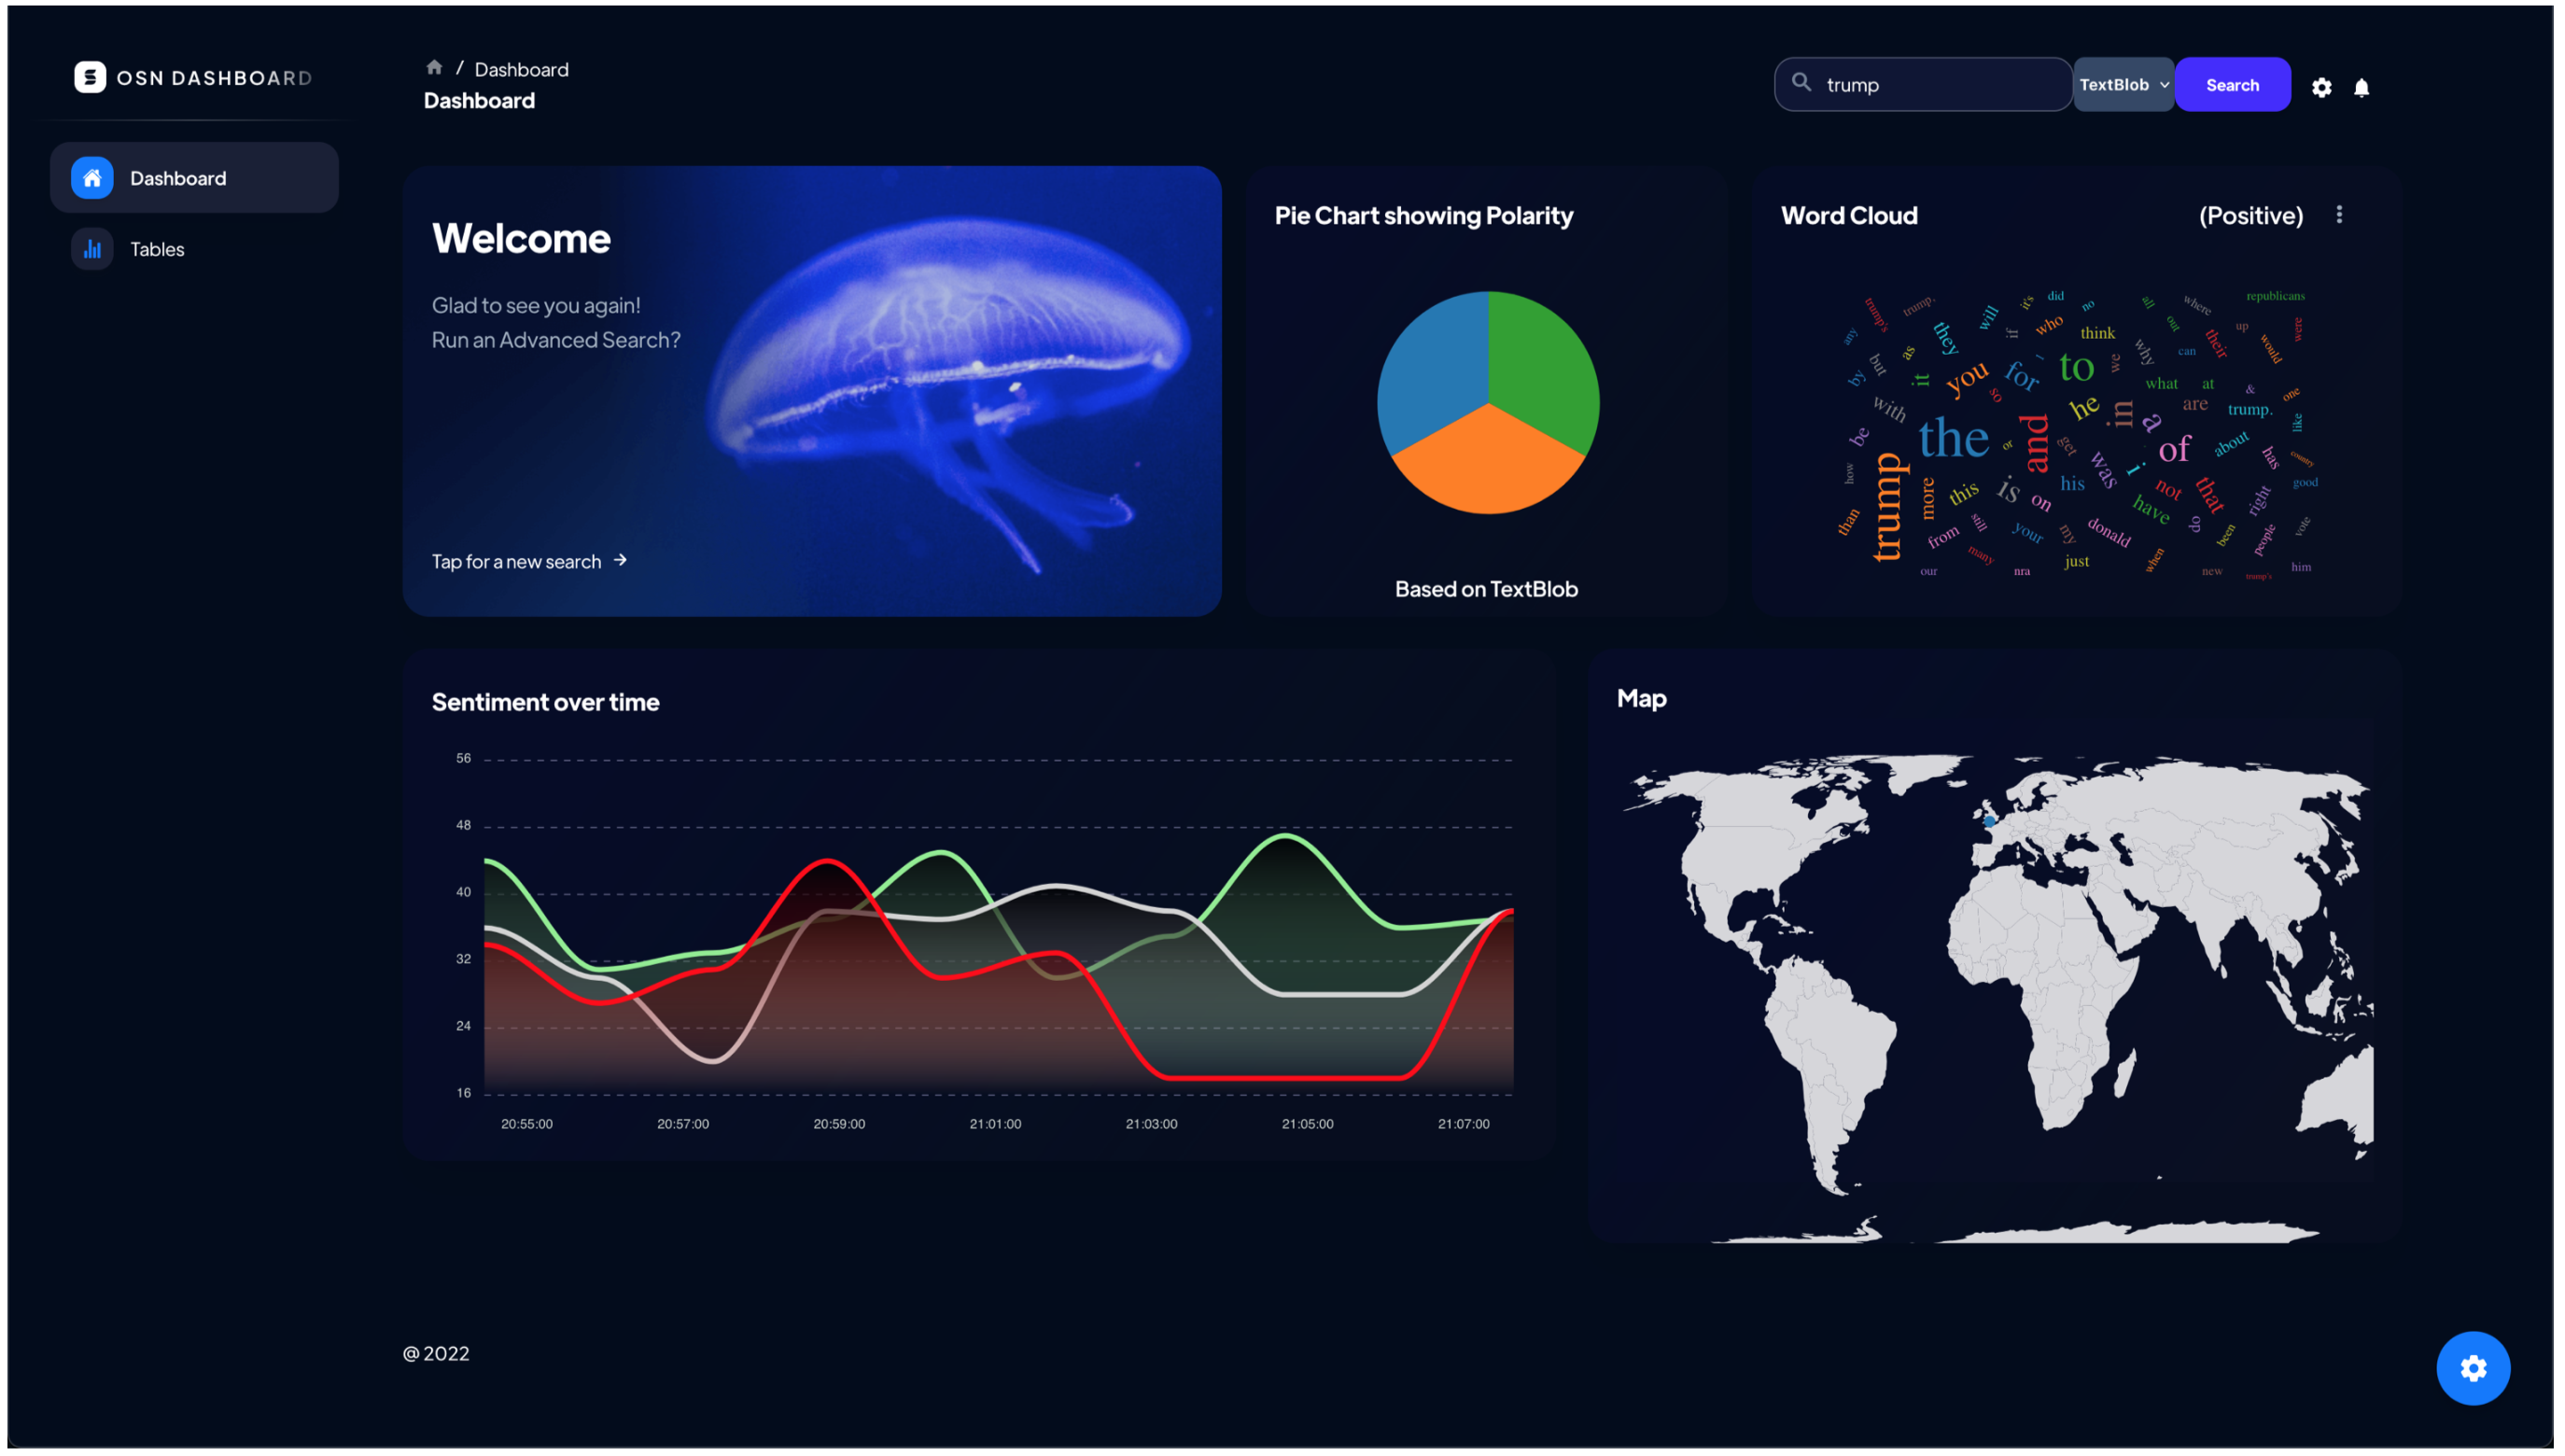
As a search is performed, the user will arrive the dashboard page (Figure 6), where the user can visualize pie chart, line chart, tag cloud and map. In the top of the screen a new search can be performed.
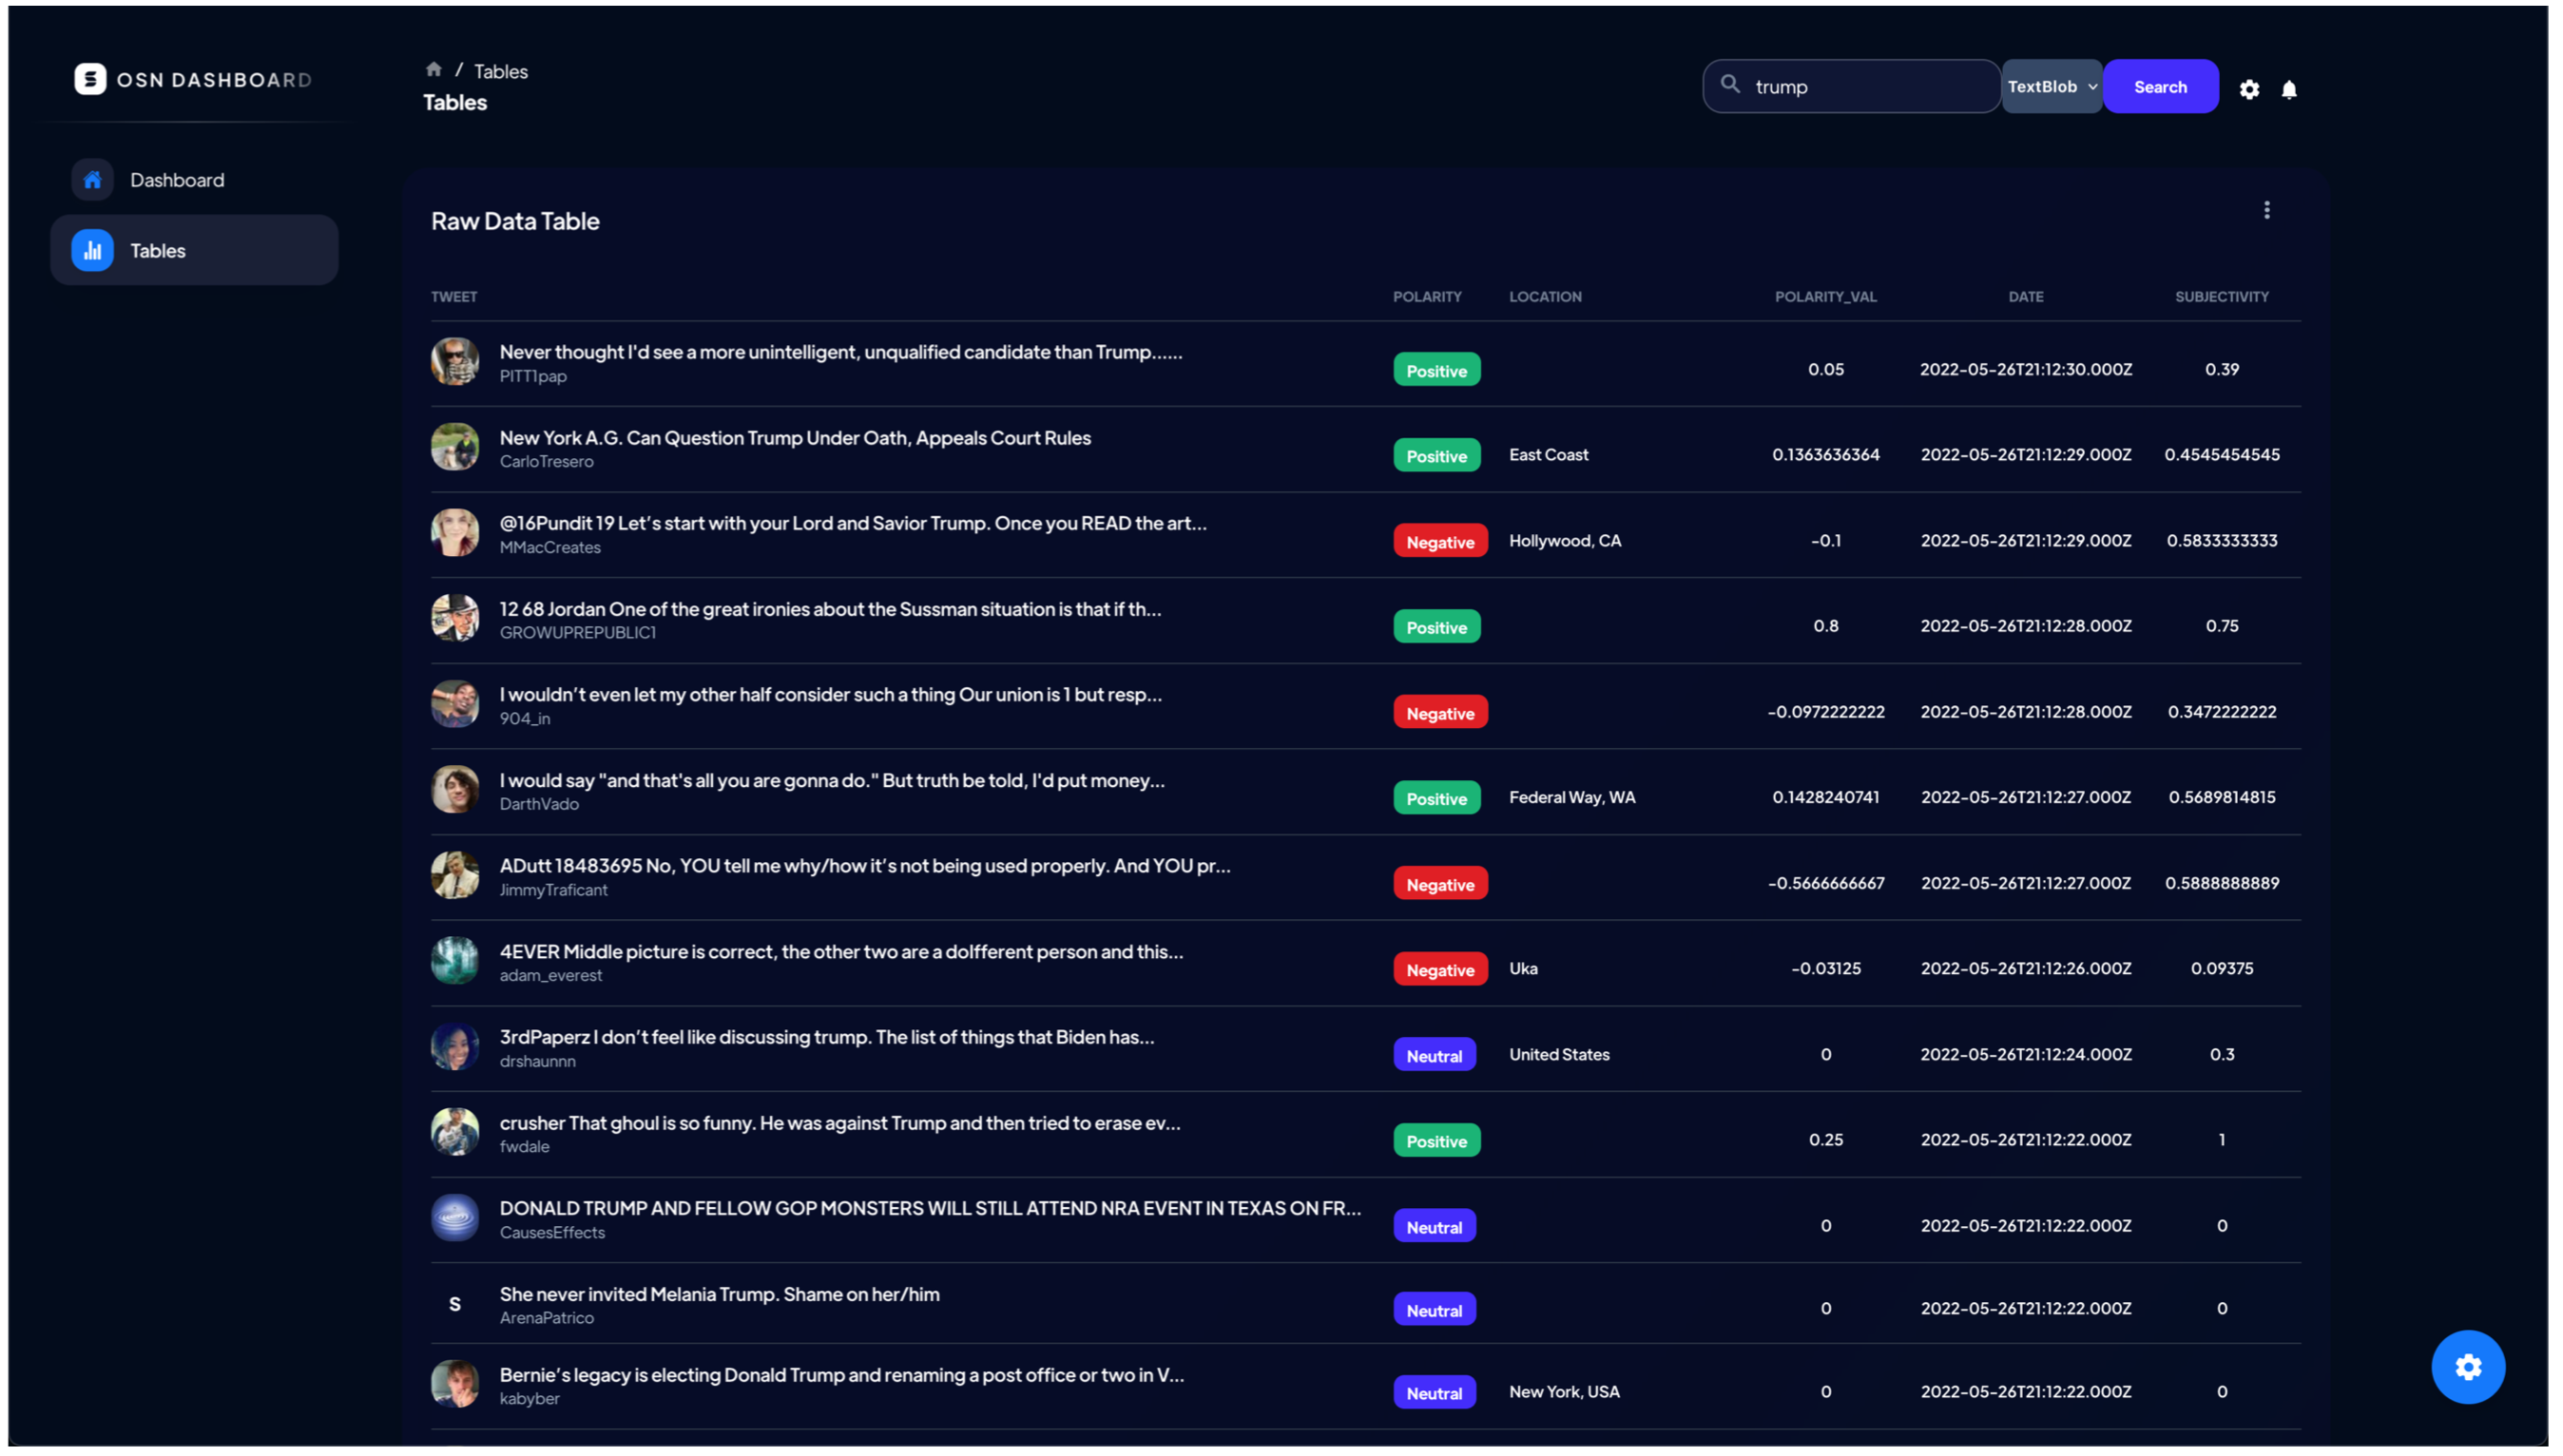
By clicking the "Table" button in the side navigation bar, direct the users to the raw data page depicted in Figure 7.
The OSN dashboard is also a responsive website. It can be scaled such that it works fine on smaller devices such as mobile and tablets. The dashboard is using a dark blue color scheme. The reason behind the choice of color is based on how colors arouse emotions in users. Based on research in color psychology, the color blue is associated with trust and stability [52].
To assess the novelty of the OSN dashboard, two models named Level of Inventiveness and Norwegian Research Council (NRC) Scale are used.
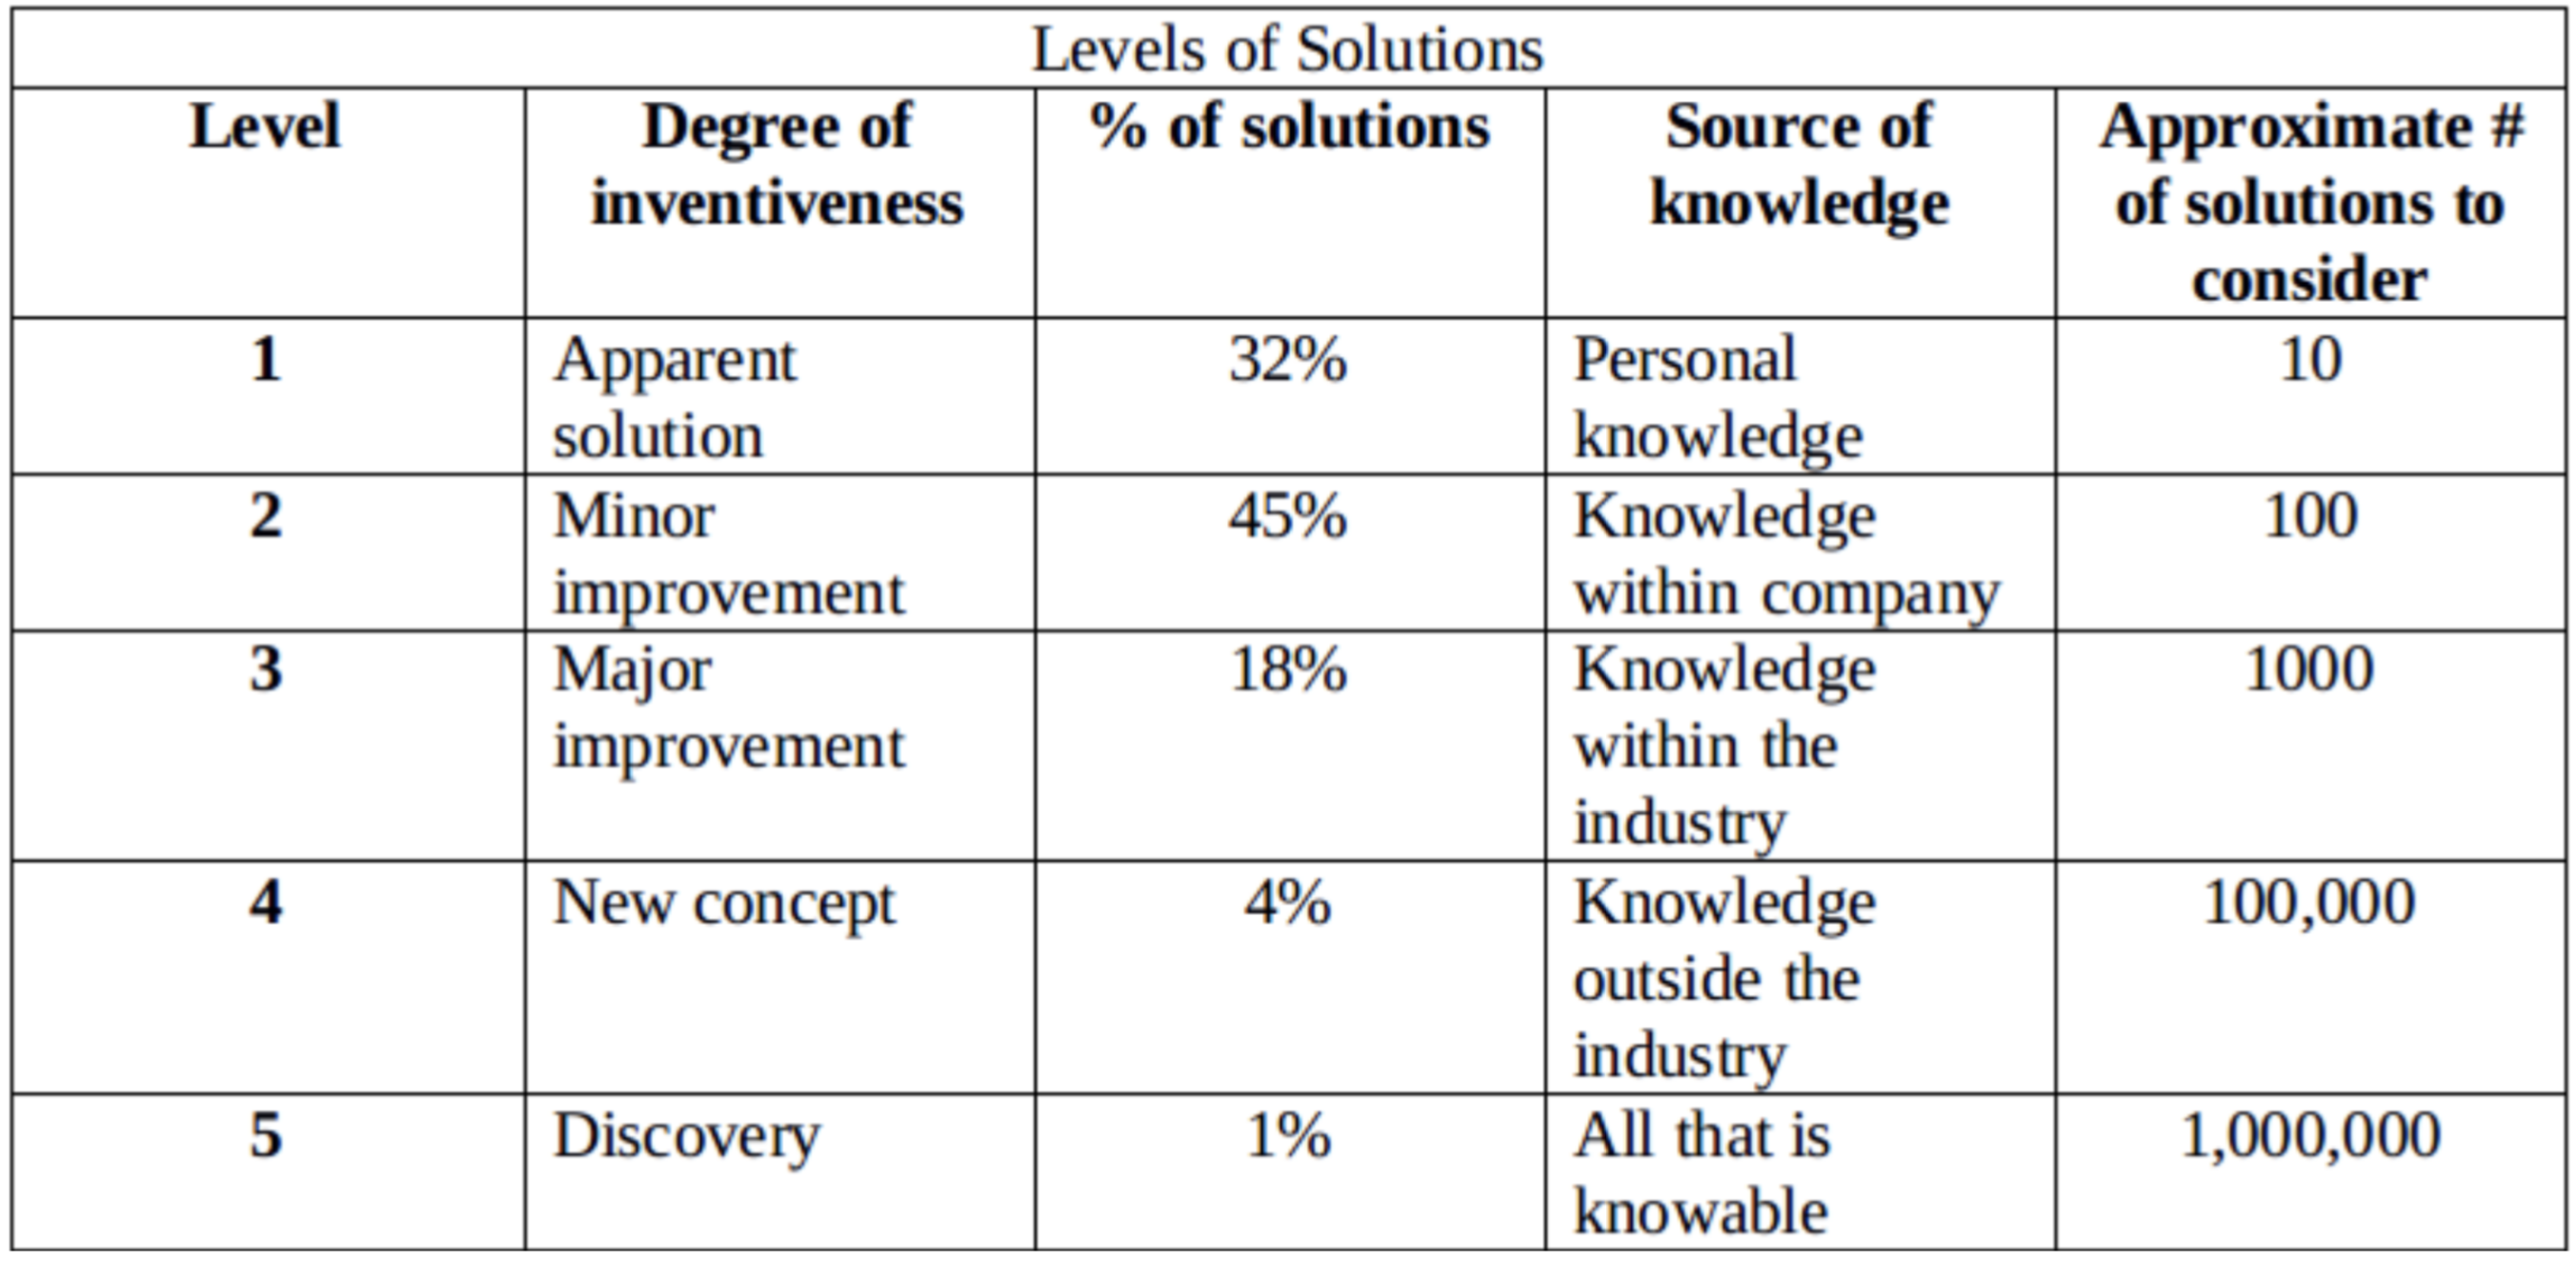
Level of Inventiveness: With respect to the Level of Inventiveness scale depicted in Figure 8 [53], we believe the study is at level three. The major improvements are that the OSN dashboard is a more conventional way to perform sentiment analysis on online social media data. It is possible to search on various topics of interest and receive high-level insights. With the use of visualization such as map, the users will perceive how different regions and countries express different opinions about the same topic. Another improvement is that researchers can choose the desired sentiment analysis algorithm to use in the dashboard and compare their results. In addition, integrating sentiment analysis algorithms which support multilingual posts will provide more and better results on tweets around the world. All these above mentioned improvements are knowledge within the industry, but the solution differ from the industry competitors in the way that search on topics do not need to be domain specific and it provides an intuitive way to perform sentiment analysis.
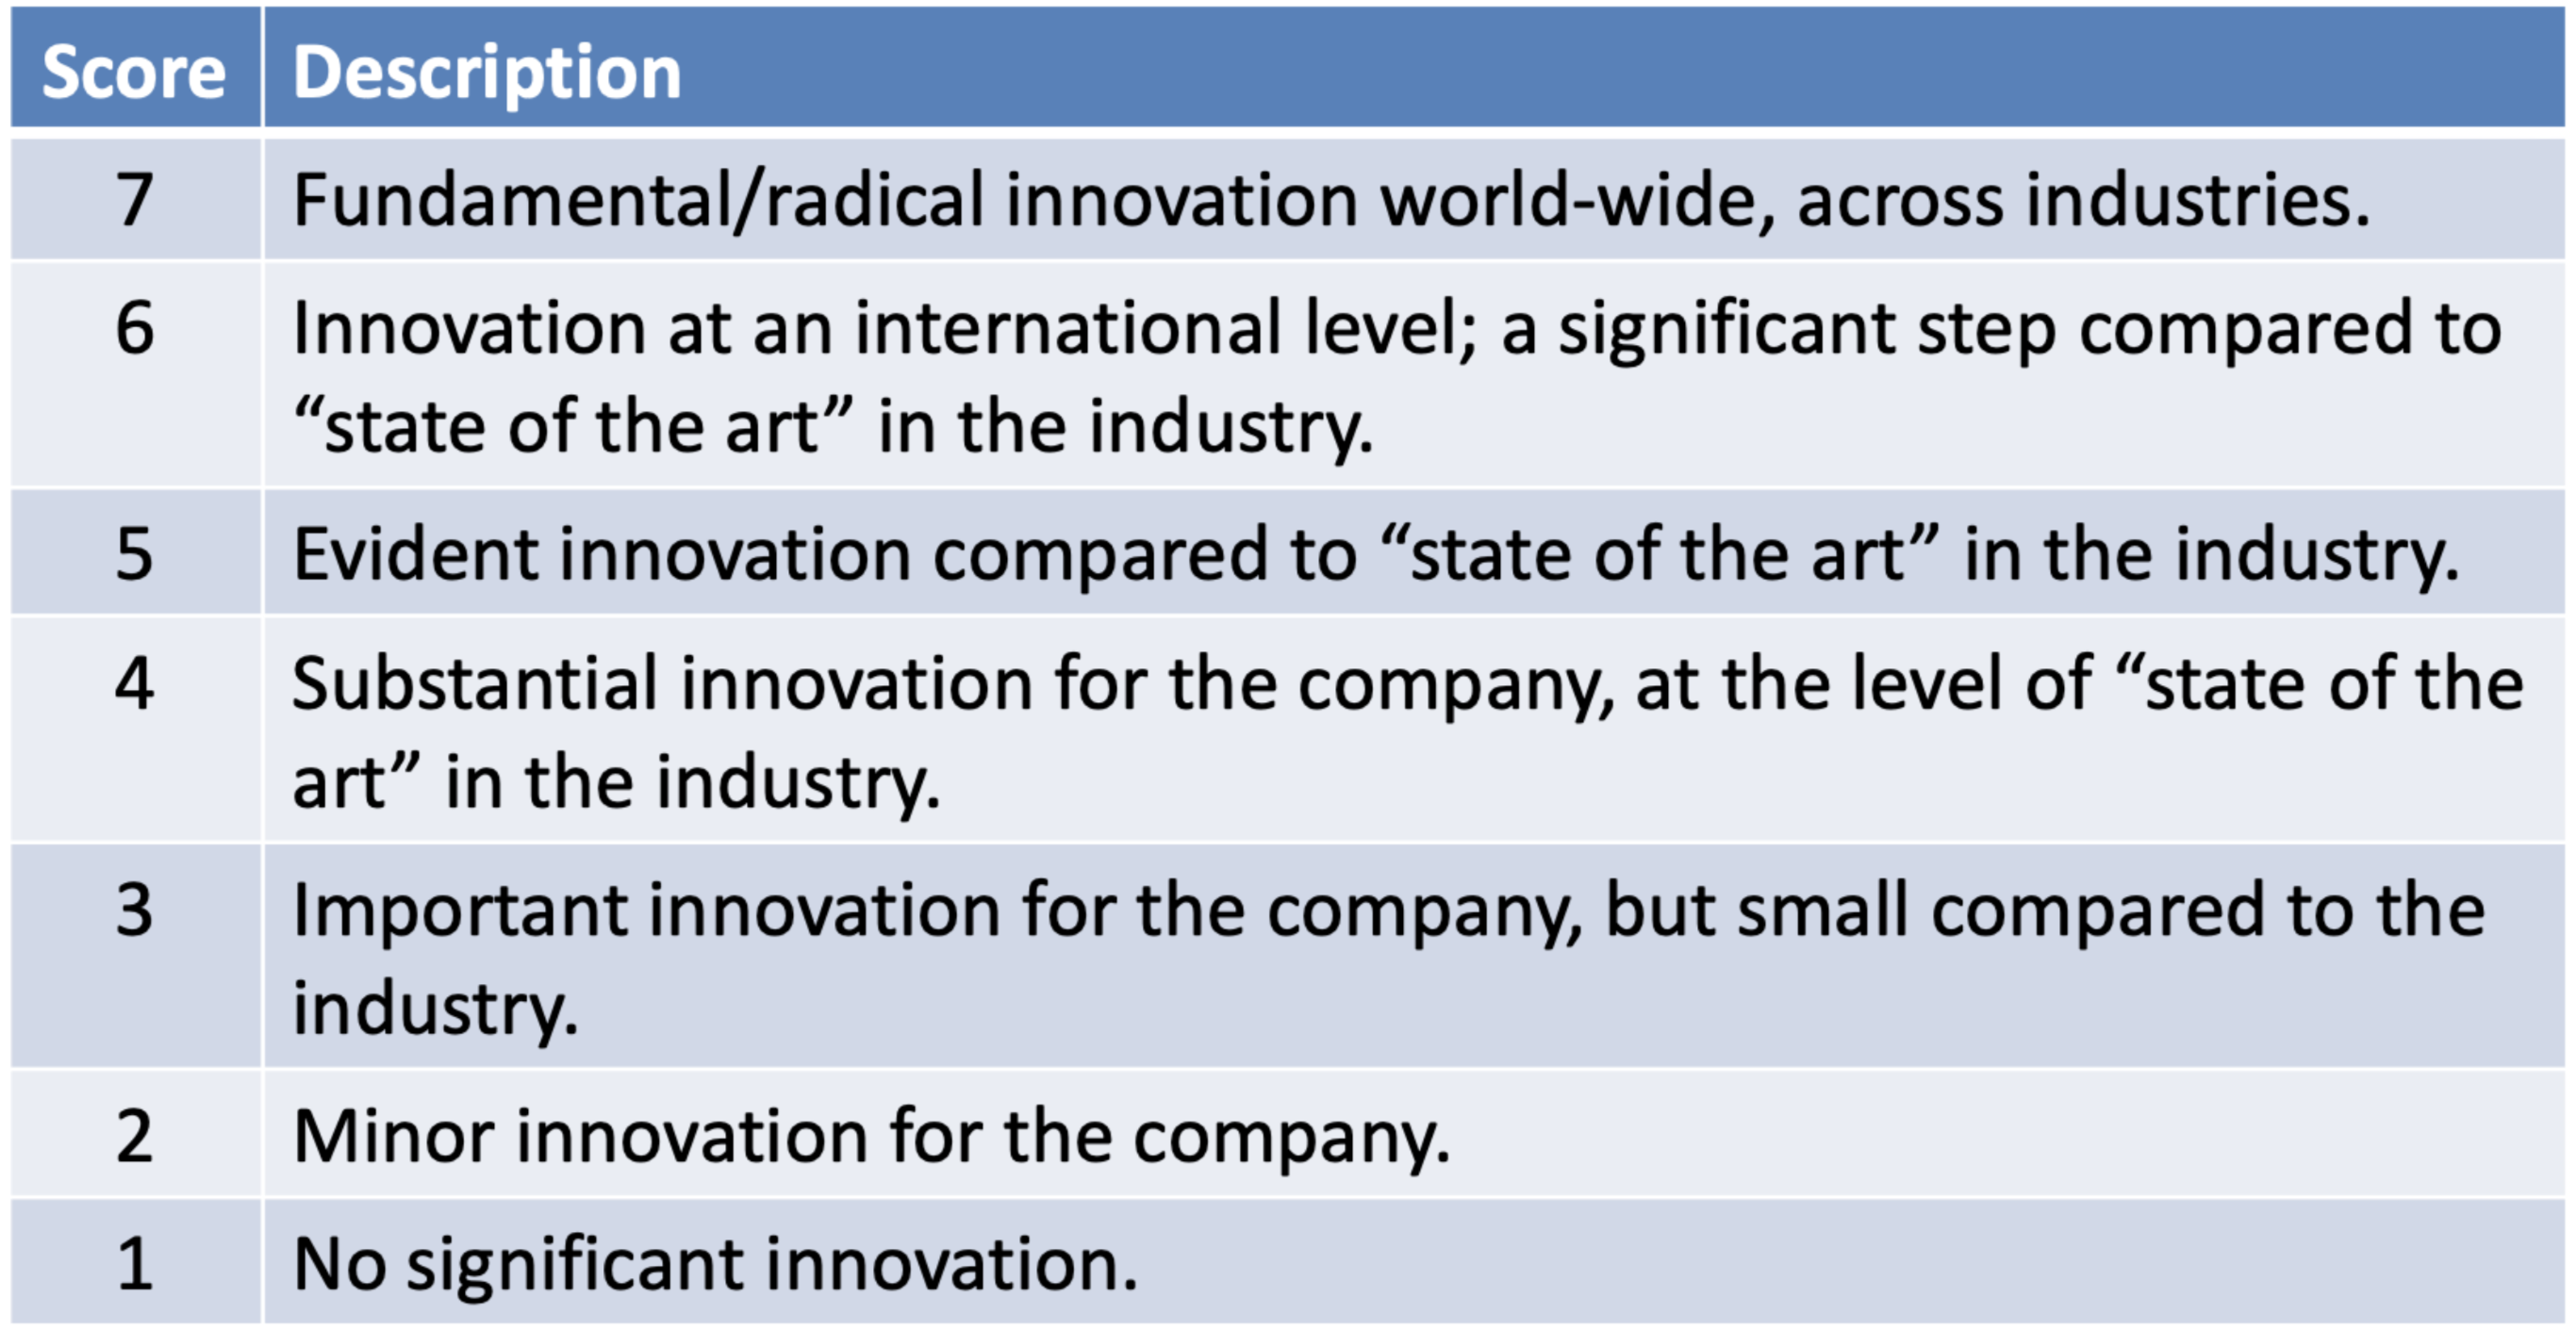
NRC Scale: In regards to the NRC scale shown in Figure 9 [54], the OSN dashboard is given a score of four. Recall the improvements mentioned in Section 4.2.1, the tool is a substantial innovation as it provides a new combination of knowledge within the industry. A concern with assessing the OSN dashboard is how to evaluate if it is at the level with the state-of-the-art in the industry. The dashboard consists of aspects which are not directly countable in any measure. By utilizing sentiment analysis algorithms, it will naturally perform similarly. However, the assessment of how intuitive the dashboard is requires usability testing and the need for the users to compare the tool with stat-of-the-art sentiment analysis dashboards in the industry.
4.1 Integration
There are several application domains the OSN dashboard is suited for. First and foremost the tool can be integrated to the Twitter application. Here, users can retrieve public opinions regarding news, products, politics etc. Second, the dashboard can have huge impact on any decision making process and can be used with existing frameworks for getting students’ opinions in education for instance, such as in [55, 56, 57]. Another example can be an organization such as Foodora555https://www.foodora.com which can integrate the tool and utilize it as a part of their market campaign because the peoples opinions influence how they will conduct the business in the future. Another example of decision making is in the financial domain. The finance world becomes more and more quantitative. However, it has been shown that social media can affect the stock market to a great extent [58]. Therefore, the OSN dashboard can be integrated to the portfolio management tools to collect qualitative data. This data will support any decision towards investments. The study however doesn’t incorporate embedding models [59] and advanced deep learning algorithms for sentiment analysis [60, 61]. So, the support for these can be provided in the tool in future.
4.2 Deployment
The complete application is Dockerized666https://www.docker.com/ to ship all the applications with all the necessary functionalities as one package with Docker Compose (multi-container). The Twitter API has both an app rate limit and user rate limit that is controlled around requests per minute. Twitter has an options for a paid "Premium" API that allows many more requests per minute. As long as the application will not have to many users, using the public API should be sufficient.
5 Conclusion & Future Work
The OSN analysis dashboard is developed to enable users gaining insights in various topics. This, to get a perspective of the world. The tool can be utilized for several purposes such as decision making and research. Therefore, the dashboard can be integrated to several application domains including the Twitter website, product websites or portfolio management tools. In this article, an implementation of a sentiment analyzer dashboard was proposed. Sentiment analysis was performed on Twitter data based on keywords, hashtags or usernames given by the user. Different sentiment analysis algorithms were integrated to perform sentiment categorization. The analysis results are visualized in form of a dashboard to provide at-a-glance information. The data on the dashboard is presented in appropriate plots and charts with the addition of raw data from the sentiment analysis results.
When it comes to future work, there are always room for improvements as not every implementation goal is reached within the given time frame. Currently, the sentiment analysis algorithms integrated are lexicon-based. It would be interesting to add algorithms which are machine learning-based to compare the differences and train them on domain-specific topics using ontology [62, 63] or concept vectors [64]. Another aspect regarding the future work is multilingual compatibility [46]. TextBlob classifies non-English languages by using Google translate. This work to some extent, but can affect the validity of the original resource [45]. In that case, an improvement of the proposed tool will be to include sentiment algorithms which supports different languages. Lastly, the OSN analysis dashboard only covers Twitter data. To be able to understand peoples opinions about certain topics, it is required to include other social media platforms such as Instagram, Facebook and Reddit.
References
- [1] X. Fang and J. Zhan, “Sentiment analysis using product review data,” Journal of Big Data, vol. 2, no. 1, pp. 1–14, 2015.
- [2] M. Bibi, W. A. Abbasi, W. Aziz, S. Khalil, M. Uddin, C. Iwendi, and T. R. Gadekallu, “A novel unsupervised ensemble framework using concept-based linguistic methods and machine learning for twitter sentiment analysis,” Pattern Recognition Letters, vol. 158, pp. 80–86, 2022.
- [3] W. Zhao, Z. Guan, L. Chen, X. He, D. Cai, B. Wang, and Q. Wang, “Weakly-supervised deep embedding for product review sentiment analysis,” IEEE Transactions on Knowledge and Data Engineering, vol. 30, no. 1, pp. 185–197, 2017.
- [4] Z. Kastrati, B. Arifaj, A. Lubishtani, F. Gashi, and E. Nishliu, “Aspect-based opinion mining of students’ reviews on online courses,” in Proceedings of the 2020 6th International Conference on Computing and Artificial Intelligence. New York, NY, USA: ACM, 2020, p. 510–514.
- [5] S. Sadriu, K. P. Nuci, A. S. Imran, I. Uddin, and M. Sajjad, “An automated approach for analysing students feedback using sentiment analysis techniques,” in Mediterranean Conference on Pattern Recognition and Artificial Intelligence. Springer, 2022, pp. 228–239.
- [6] M. Edalati, A. S. Imran, Z. Kastrati, and S. M. Daudpota, “The potential of machine learning algorithms for sentiment classification of students’ feedback on MOOC,” in Proceedings of SAI Intelligent Systems Conference. Springer, 2021, pp. 11–22.
- [7] R. Feldman, B. Rosenfeld, R. Bar-Haim, and M. Fresko, “The stock sonar—sentiment analysis of stocks based on a hybrid approach,” in Proceedings of the AAAI Conference on Artificial Intelligence, vol. 25, no. 2, 2011, pp. 1642–1647.
- [8] R. Batra, A. S. Imran, Z. Kastrati, A. Ghafoor, S. M. Daudpota, and S. Shaikh, “Evaluating polarity trend amidst the coronavirus crisis in peoples’ attitudes toward the vaccination drive,” Sustainability, vol. 13, no. 10, p. 5344, 2021.
- [9] Z. Kastrati, F. Dalipi, A. S. Imran, K. Pireva Nuci, and M. A. Wani, “Sentiment analysis of students’ feedback with NLP and deep learning: A systematic mapping study,” Applied Sciences, vol. 11, no. 9, p. 3986, 2021.
- [10] L. Sandra, G. Gunarso, O. W. Riruma et al., “Are university students independent: Twitter sentiment analysis of independent learning in independent campus using roberta base indolem sentiment classifier model,” in 2021 International Seminar on Machine Learning, Optimization, and Data Science (ISMODE). IEEE, 2022, pp. 249–253.
- [11] Z. Kastrati, A. S. Imran, and A. Kurti, “Weakly supervised framework for aspect-based sentiment analysis on students’ reviews of MOOCs,” IEEE Access, vol. 8, pp. 106 799–106 810, 2020.
- [12] Z. B. Nezhad and M. A. Deihimi, “Twitter sentiment analysis from iran about covid 19 vaccine,” Diabetes & Metabolic Syndrome: Clinical Research & Reviews, vol. 16, no. 1, p. 102367, 2022.
- [13] A. S. Imran, S. M. Daudpota, Z. Kastrati, and Batra, “Cross-cultural polarity and emotion detection using sentiment analysis and deep learning–a case study on covid-19,” arXiv e-prints, pp. arXiv–2008, 2020.
- [14] N. M. Ali, M. M. Abd El Hamid, and A. Youssif, “Sentiment analysis for movies reviews dataset using deep learning models,” International Journal of Data Mining & Knowledge Management Process (IJDKP) Vol, vol. 9, 2019.
- [15] M. Yasen and S. Tedmori, “Movies reviews sentiment analysis and classification,” in 2019 IEEE Jordan International Joint Conference on Electrical Engineering and Information Technology (JEEIT). IEEE, 2019, pp. 860–865.
- [16] K.-W. Fu, H. Liang, N. Saroha, Z. T. H. Tse, P. Ip, and I. C.-H. Fung, “How people react to zika virus outbreaks on twitter? a computational content analysis,” American Journal of Infection Control, vol. 44, no. 12, pp. 1700–1702, 2016.
- [17] A. S. Imran, S. M. Daudpota, Z. Kastrati, and R. Batra, “Cross-cultural polarity and emotion detection using sentiment analysis and deep learning on covid-19 related tweets,” Ieee Access, vol. 8, pp. 181 074–181 090, 2020.
- [18] Z. Kastrati, L. Ahmedi, A. Kurti, F. Kadriu, D. Murtezaj, and F. Gashi, “A deep learning sentiment analyser for social media comments in low-resource languages,” Electronics, vol. 10, no. 10, 2021.
- [19] B. Stamm and K. Loomis, “What does it mean to “engage” for learning on social media?: an analysis of global read aloud twitter participation,” Journal of Research on Technology in Education, pp. 1–18, 2022.
- [20] B. Liu, Frontmatter. Cambridge University Press, 2015.
- [21] F. Dalipi, A. S. Imran, F. Idrizi, and H. Aliu, “An analysis of learner experience with MOOCs in mobile and desktop learning environment,” in Advances in human factors, business management, training and education. Springer, 2017, pp. 393–402.
- [22] P. N. Johnson-Laird and N. Y. L. Lee, “Are there cross-cultural differences in reasoning?” 2006.
- [23] K. Pauwels, T. Ambler, B. H. Clark, P. LaPointe, D. Reibstein, B. Skiera, B. Wierenga, and T. Wiesel, “Dashboards as a service: Why, what, how, and what research is needed?” Journal of Service Research, vol. 12, no. 2, pp. 175–189, 2009.
- [24] A. Group. (2020) The importance of dashboards in business: Why use dashboard reports? [Online]. Available: https://blog.azuregroup.com.au/the-importance-of-dashboard-reporting-in-business-why-use-dashboard-reports
- [25] N. N. Group. (2020) Data visualizations for dashboards. [Online]. Available: https://www.nngroup.com/videos/data-visualizations-dashboards/,
- [26] B. Dean. (2022) How many people use twitter in 2022. [Online]. Available: https://backlinko.com/twitter-users#twitter-users, January 2022.
- [27] J. Yang and J. Yang, “Aspect based sentiment analysis with self-attention and gated convolutional networks,” in 2020 IEEE 11th International Conference on Software Engineering and Service Science (ICSESS), 2020, pp. 146–149.
- [28] J. Kim, J. Seo, M. Lee, and J. Seok, “Stock price prediction through the sentimental analysis of news articles,” in 2019 Eleventh International Conference on Ubiquitous and Future Networks (ICUFN), 2019, pp. 700–702.
- [29] D. Shah, H. Isah, and F. Zulkernine, “Predicting the effects of news sentiments on the stock market,” in 2018 IEEE International Conference on Big Data (Big Data), 2018, pp. 4705–4708.
- [30] T. Mankar, T. Hotchandani, M. Madhwani, A. Chidrawar, and C. Lifna, “Stock market prediction based on social sentiments using machine learning,” in 2018 International Conference on Smart City and Emerging Technology (ICSCET), 2018, pp. 1–3.
- [31] F. Nausheen and S. H. Begum, “Sentiment analysis to predict election results using python,” in 2018 2nd International Conference on Inventive Systems and Control (ICISC), 2018, pp. 1259–1262.
- [32] M. T. K. V. M. S. Maite Taboada, Julian Brooke, “Lexicon-based methods for sentiment analysis.” Computational Linguistics, vol. 37, pp. 267–307, 2011.
- [33] S. Yadav and N. Saleena, “Sentiment analysis of reviews using an augmented dictionary approach,” in 2020 5th International Conference on Computing, Communication and Security (ICCCS), 2020, pp. 1–5.
- [34] L. Zhang, S. Wang, and B. Liu, “Deep learning for sentiment analysis : A survey,” 2018.
- [35] F. Calefato, F. Lanubile, F. Maiorano, and N. Novielli, “Sentiment polarity detection for software development,” CoRR, vol. abs/1709.02984, 2017.
- [36] Q. Rajput, S. Haider, and S. Ghani, “Lexicon-based sentiment analysis of teachers’ evaluation,” Applied computational intelligence and soft computing, vol. 2016, 2016.
- [37] J. Puigcerver, A. H. Toselli, and E. Vidal, “Querying out-of-vocabulary words in lexicon-based keyword spotting,” Neural Computing and Applications, vol. 28, no. 9, pp. 2373–2382, 2017.
- [38] Z. Kastrati, A. S. Imran, and S. Yildirim-Yayilgan, “SEMCON: a semantic and contextual objective metric for enriching domain ontology concepts,” International Journal on Semantic Web and Information Systems (IJSWIS), vol. 12, no. 2, pp. 1–24, 2016.
- [39] G. Tsatsaronis, I. Varlamis, and K. Nørvåg, “Semanticrank: ranking keywords and sentences using semantic graphs,” in Proceedings of the 23rd international conference on computational linguistics (Coling 2010), 2010, pp. 1074–1082.
- [40] Z. Kastrati, A. S. Imran, and S. Y. Yayilgan, “SEMCON: semantic and contextual objective metric,” in Proceedings of the 2015 IEEE 9th International Conference on Semantic Computing (IEEE ICSC 2015). IEEE, 2015, pp. 65–68.
- [41] B. A. Chandio, A. S. Imran, M. Bakhtyar, S. M. Daudpota, and J. Baber, “Attention-based ru-bilstm sentiment analysis model for roman urdu,” Applied Sciences, vol. 12, no. 7, p. 3641, 2022.
- [42] R. Batra, Z. Kastrati, A. S. Imran, S. M. Daudpota, and A. Ghafoor, “A large-scale tweet dataset for urdu text sentiment analysis,” arXiv e-prints, pp. arXiv–2021, 2021.
- [43] S. Zhu, B. Xu, D. Zheng, and T. Zhao, “Chinese microblog sentiment analysis based on semi-supervised learning,” in Semantic Web and Web Science, J. Li, G. Qi, D. Zhao, W. Nejdl, and H.-T. Zheng, Eds. New York, NY: Springer New York, 2013, pp. 325–331.
- [44] N. Fatima, A. S. Imran, Z. Kastrati, S. M. Daudpota, A. Soomro, and S. Shaikh, “A systematic literature review on text generation using deep neural network models,” IEEE Access, 2022.
- [45] A. H. E. C. A. Y. A. H. A. G. . Q. Z. Kia Dashtipour, Soujanya Poria, “Multilingual sentiment analysis: State of the art and independent comparison of techniques,” Cognitive Computation, vol. 7, pp. 757–771, 2016.
- [46] A. Ghafoor, A. S. Imran, S. M. Daudpota, Z. Kastrati, R. Batra, M. A. Wani et al., “The impact of translating resource-rich datasets to low-resource languages through multi-lingual text processing,” IEEE Access, vol. 9, pp. 124 478–124 490, 2021.
- [47] A. S. Imran, R. Yang, Z. Kastrati, S. M. Daudpota, and S. Shaikh, “The impact of synthetic text generation for sentiment analysis using gan based models,” Egyptian Informatics Journal, 2022.
- [48] D. Vilares, H. Peng, R. Satapathy, and E. Cambria, “Babelsenticnet: A commonsense reasoning framework for multilingual sentiment analysis,” in 2018 IEEE Symposium Series on Computational Intelligence (SSCI), 2018, pp. 1292–1298.
- [49] M. N. M. N. Nurul Husna Mahadzir, Mohd Faizal Omar, “A sentiment analysis visualization system for the property industry,” International Journal of Technology, vol. 9, no. 8, pp. 1609–1617, 2018.
- [50] K. L. S. Kumar, J. Desai, and J. Majumdar, “Opinion mining and sentiment analysis on online customer review,” in 2016 IEEE International Conference on Computational Intelligence and Computing Research (ICCIC), 2016, pp. 1–4.
- [51] Google. (2021) Introduction to microservices — google cloud. [Online]. Available: https://cloud.google.com/architecture/microservices-architecture-introduction
- [52] S. Sasidharan and G. S. Dhanesh, “The role of color in influencing trust the role of color in influencing trust in e-commerce web site,” in "Proceedings of the Second Midwest United States Association for Information Systems, Springfield, IL May 18–19, 2007.", 2007.
- [53] Softqube. (2022) New innovative approach of problem solving. [Online]. Available: https://www.softqubes.com/blog/triz
- [54] T. R. C. of Norway. (2020) Scale of marks and assessment criteria. [Online]. Available: https://www.forskningsradet.no/en/processing-grant-applications/processing-applications/Scale-marks-assessment-criteria/
- [55] A. S. Imran and F. A. Cheikh, “Multimedia learning objects framework for e-learning,” in 2012 International Conference on E-Learning and E-Technologies in Education (ICEEE). IEEE, 2012, pp. 105–109.
- [56] M. Misuraca, A. Forciniti, G. Scepi, and M. Spano, “Sentiment analysis for education with r: packages, methods and practical applications,” arXiv preprint arXiv:2005.12840, 2020.
- [57] A. S. Imran and S. J. Kowalski, “HIP–a technology-rich and interactive multimedia pedagogical platform,” in International Conference on Learning and Collaboration Technologies. Springer, 2014, pp. 151–160.
- [58] M. Costola, M. Iacopini, and C. R. Santagiustina, “On the “mementum” of meme stocks,” Economics Letters, vol. 207, p. 110021, 2021.
- [59] Z. Kastrati, A. Kurti, and A. S. Imran, “WET: Word embedding-topic distribution vectors for MOOC video lectures dataset,” Data in brief, vol. 28, p. 105090, 2020.
- [60] L. Zhang, S. Wang, and B. Liu, “Deep learning for sentiment analysis: A survey,” Wiley Interdisciplinary Reviews: Data Mining and Knowledge Discovery, vol. 8, no. 4, p. e1253, 2018.
- [61] C. Sun, L. Huang, and X. Qiu, “Utilizing bert for aspect-based sentiment analysis via constructing auxiliary sentence,” arXiv preprint arXiv:1903.09588, 2019.
- [62] Z. Kastrati, A. S. Imran, and S. Y. Yayilgan, “An improved concept vector space model for ontology based classification,” in 2015 11th International Conference on Signal-Image Technology & Internet-Based Systems (SITIS). IEEE, 2015, pp. 240–245.
- [63] S. Nirenburg and V. Raskin, “Ontological semantics, formal ontology, and ambiguity,” in Proceedings of the international conference on Formal Ontology in Information Systems-Volume 2001, 2001, pp. 151–161.
- [64] Z. Kastrati and A. S. Imran, “Performance analysis of machine learning classifiers on improved concept vector space models,” Future Generation Computer Systems, vol. 96, pp. 552–562, 2019.