A Non-Detection of Red Supergiant Convection in Gaia
Abstract
Large scale surface convection on red supergiants (RSGs) can lead to shifts in the photocenter of the star which might be measured by Gaia and used as a new probe of the surface dynamics of these rare but important stars. Unlike brightness variations, photocenter motions would provide information on the physical scale of the convective cells. The signal would be that RSGs show an excess astrometric noise at the level of a few percent of the stellar radius. Unfortunately, we find that the excess astrometric noise level of Gaia EDR3 is roughly an order of magnitude too large to detect the predicted motions and that RSGs have excess astrometric noise indistinguishable from other stars of similar magnitude and parallax. The typical excess astrometric noise steadily decreases with magnitude (for mag), so it is crucial to compare stars of similar brightness.
keywords:
stars: massive – supernovae: general – supernovae1 Introduction
Most of the stars exploding as supernovae are red supergiants (RSGs) producing Type IIP/IIL supernovae (e.g., Smartt et al. 2009, Li et al. 2011). Models of the light curves of these supernovae have difficulty matching the data, leading to invocations of large scale mass loss just prior to the explosion (e.g., Morozova, Piro, & Valenti 2018, Morozova et al. 2020). However, direct observations of the pre-supernova variability of RSGs find that they vary no more than any other RSG (Kochanek et al. 2017, Johnson, Kochanek, & Adams 2018), which would seem to rule this possibility out.
It is, however, possible that the problem lies in the structure of the RSG progenitors used for the light curve models. The atmospheres of RSGs are so unstable that stellar evolution models generally apply an artificial external pressure to stabilize them (e.g., Heger, Langer, & Woosley 2000), giving the progenitor model a sharp outer edge. In real stars, however, the atmospheres are dynamical with large scale convective flows that are directly observed in the case of Betelgeuse (e.g., Haubois et al. 2009, López Ariste et al. 2022). In simulations, these surface flows lead to a very extended, dynamic atmosphere (e.g., Arroyo-Torres et al. 2015, Goldberg, Jiang, & Bildsten 2022) which is not present in supernova progenitor models.
Chiavassa et al. (2011) noted that the brightness changes associated with the convective cells would cause the photocenter of an RSG to wander and that this might be detectable with Gaia (Gaia Collaboration et al. 2016, Gaia Collaboration et al. 2021). They also argued that there was evidence for the effect in the Hipparcos (ESA 1997, van Leeuwen 2007) observations of Betelgeuse. In Chiavassa, Freytag, & Schultheis (2018) and Chiavassa et al. (2022), they argue for detections of the effect in Gaia observations for Asymptotic Giant Branch (AGB) stars and RSGs, respectively. The discussion of RSGs appeared as we were doing this analysis and will be discussed.
The expected signal is a fluctuation in the photocenter of the star by where is the radius of the star and for the six models in Chiavassa et al. (2022). The shift in the angular position is then where is the distance to the star. Note that is independent of distance if the radius of the star is derived from the observed spectral energy distribution: for luminosity and flux . The parameter in the Gaia astrometric solutions which is directly sensitive to the photocenter wandering is the astrometric excess noise (see Lindegren et al. 2021). This is the quantity which must be added in quadrature to the known sources of noise in the astrometric measurements to produce a statistically good astrometric fit. The photocenter wander is simply one term contributing in quadrature to . Given a sample of RSGs spanning a range of angular sizes , the expected signal is an excess noise with an amplitude of . If the photocenter wander does not dominate the excess noise, then the effect is undetectable absent a quantitative knowledge of the other effects that dominate the excess noise. In §2 we describe our search for the signal and how we reach the conclusion that the signal is presently undetectable. As noted above, Chiavassa et al. (2022) came to the opposite conclusion using stars in the Per cluster as we were working on this study. In §3 we show that the conclusion of §2 also holds for these stars. We discuss future prospects in §4.
2 Searching for the Signal
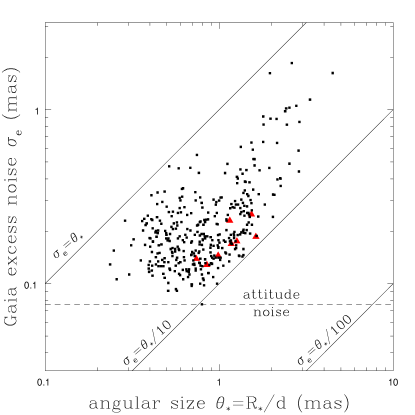
We used the Messineo & Brown (2019) catalog of RSGs. The catalog is based on modeling the spectral energy distributions of red stars with Gaia DR2 parallaxes. The initial catalog is heavily contaminated by asymptotic giant branch (AGB) stars so we focus on their groups A and B which should be dominated by RSGs. We convert their estimates of the luminosity and temperature to radius and then to the angular size using the same Bailer-Jones et al. (2018) distances used by Messineo & Brown (2019). Because is independent of distance, it is important to use the same distance as was used to estimate . We also only used stars with parallax mas and mag. We use the Gaia EDR3 (Gaia Collaboration et al. 2021, Lindegren et al. 2021) astrometric data for the actual analysis. This left us with 360 stars. Fig. 1 shows the results, with a remarkably good linear correlation between and as expected for photocenter fluctuations. While this initially led to a frisson of excitement, there is a problem – the amplitude is roughly an order of magnitude too large, with ( with a scatter of dex) instead of .
The excess astrometric noise is actually the quadrature sum of a time dependent excess noise associated with the satellite and an excess noise associated with the particular source (Lindegren et al. 2021). Obviously, this analysis should be done with the excess noise associated with the individual source, but there seems to be no way to access the two contributions separately in the existing interfaces. Lindegren et al. (2021) reports that the median excess attitude noise is 0.076 mas, and this noise level is also shown in Fig. 1. If this is the dominant source of spacecraft noise, then the total excess noise is dominated by the source contribution and subtracting the mas in quadrature from does not markedly change the character of Fig. 1.
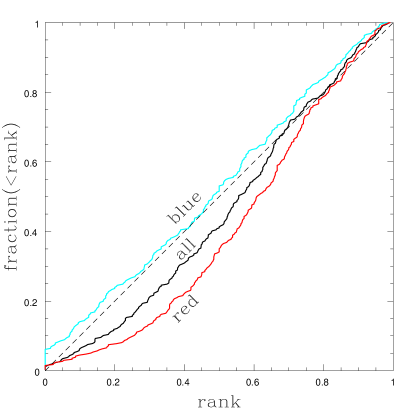
We can also examine whether the excess noise seen for the RSGs is any different from that of other stars. We do this by building a comparison sample of stars with the similar G magnitudes and parallaxes for each RSG. We selected stars within mag in magnitude, have parallaxes between and of the RSG parallax and excluding the RSGs themselves. We sorted each RSGs comparison stars by their astrometric excess noise and then found the rank of the RSG relative to the comparison sample. A rank of () means the excess noise of the RSG was less (greater) than that of all the comparison stars and a rank of means it is at the median.
RSGs are sufficiently rare that there is should be no problem from contamination by unrecognized RSGs, but we might worry about contamination by (pulsating) AGB stars since Chiavassa, Freytag, & Schultheis (2018) argue for a detection of the photocenter wobble in AGB stars. As a check for any such effects, we subdivided the comparison samples into blue () and red () stars. The blue stars should generally be much smaller, non-pulsating main sequence (MS) stars with no photocenter shifts due to convection (simply because they are much smaller in radius if nothing else). We required the comparison sample to have at least 10 stars, which left us with 346, 326, and 334 stars for the all, blue, and red comparison samples.
Fig. 2 shows the distributions of the RSGs by rank. If the ranks of the RSGs were randomly chosen from their comparison samples, then their rank distribution should simply be straight line, and we see this is very close to what we see for the blue stars. The RSGs tend to have higher ranks in the red star comparison samples (i.e. the red star curve is below the dashed line), but only for low and intermediate ranks. The fraction of RSGs at the highest ranks (most excess noise) are again very similar to the comparison sample. Compared to red stars, there are fewer RSGs with low excess noise, more with intermediate excess noise, and comparable numbers with high excess noise. Since the full sample is a combination of the red and blue samples, the rank distribution for all stars is intermediate to the red and blue distributions. Overall, the astrometric noise of the RSGs is not very different from the noise seen for stars of similar magnitude and parallax.
Between the high amplitudes and the similarity to other stars, it is clear that the astrometric shifts due to convection are not presently detected. Since the RSGs are of similar sizes and temperatures, the axis in Fig. 1 is essentially the same as the logarithm of the flux (i.e., the G magnitude). This suggests that the correlation in Fig. 1 is really showing that the excess noise depends on magnitude and the correlation with magnitude just happens to mimic the linear correlation expected for the photocenter motions due to convection. Exploring this leads to an explanation of the Chiavassa et al. (2022) results.
3 The Magnitude of the Problem
As we were working through the discussion in §2, Chiavassa et al. (2022) appeared with the claim of a detection at the expected amplitude. Needless to say, this was puzzling given the results of §2. Chiavassa et al. (2022) examined the parallax measurement errors for 8 RSGs and 30 MS stars in the Per cluster, finding that the RSGs had parallax errors larger than the MS stars roughly by the expected amplitude of the astrometric jitter from convection at the distance to Per ( kpc). They interpret this as a detection of the convectively driven motions.
Fig. 1 also includes the 8 Per RSGs, and they have astrometric excess noises consistent with the sample we considered (although they seem not to be included in the Messineo & Brown (2019) sample). So like that sample, the excess noise is an order of magnitude too large to be due to convection. The effect on the parallax errors is much smaller simply because the parallax and its errors come from a fit to all of the astrometric measurements. The RSGs in §2 had an average of good astrometric measurements (astrometric_n_good_al), so the contribution of the excess noise to the parallax error is where there is a dimensionless coefficient that depends on the sensitivity of the parallax to measurements and the level of parameter degeneracies. With , the numbers of measurements are of the right order of magnitude to convert the excess noise into a parallax error that is comparable to the expected signal. But, the convective motion signal is a direct contribution to the excess noise and then gets reduced by averaging as a contribution to astrometric variables like the parallax.
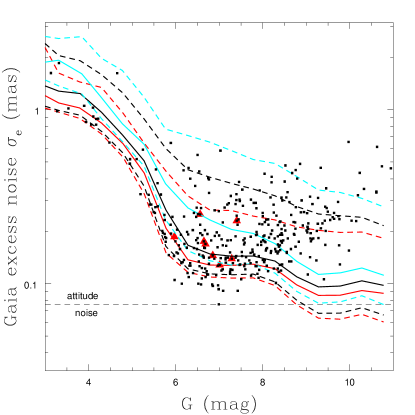
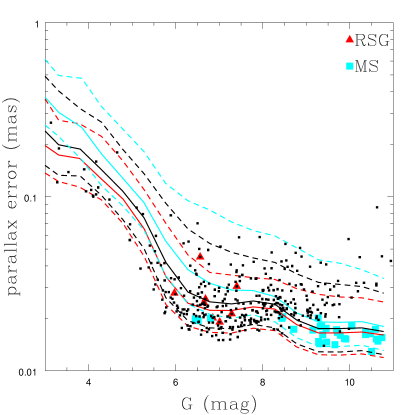
At the end of §2, our hypothesis for explaining Fig. 1 was that the excess noise must depend on magnitude. To explore this, we selected all Gaia EDR3 stars with mag and then random samples of stars down to mag. We also restricted the stars to have mas and . For bins mag wide we computed the median excess astrometric error and parallax error along with their symmetric ranges. We computed the statistics for all stars, blue stars ( mag) and red stars ( mag). These are shown in Fig. 3. The errors show a systematic decrease with increasing magnitude for both quantities and all three ways of dividing the sample. Lindegren et al. (2021) includes the lower panel over a broader magnitude range, and the typical parallax uncertainties remain roughly constant to and then begin to increase for fainter sources.
These trends explain the correlation in Fig. 1 as expected. The axis is basically just flux where the largest stars have and the smallest stars have , so Fig. 1 is simply a recasting of the trends in Fig. 3. Fig. 3 also include the Messineo & Brown (2019) RSGs and they largely follow the trends for all other stars, consistent with the rank distribution in Fig. 2. The faintest RSGs do begin to lie above the trends, and this turns out to be a consequence of selecting stars only in magnitude and not also in parallax. This was done so that there would be enough stars to do these statistics at bright magnitudes.
Fig. 3 also include the Per RSGs and MS stars from Chiavassa et al. (2022). For their magnitudes, the Per stars have relatively low excess noise and parallax error. This is likely due to differences between the number and pattern of Gaia scans of Per as compared to an average location. However, most of the MS stars are fainter than the RSGs, so they have less excess noise and smaller parallax errors simply because both quantities decrease as you examine fainter stars over this magnitude range. The RSGs are noisier than the two brightest MS stars, but not to a degree that is statistically significant compared to red stars of similar brightness.
4 Discussion
It is a remarkable feat that Gaia can measure the angular positions of these RSGs to a small fraction of the stellar radii. Unfortunately, the sources of excess astrometric noise from other sources are presently too large to detect the predicted photocenter variability created by convection on the surfaces of RSGs. The observed excess noise is roughly an order of magnitude too large (Fig. 1). If we build a comparison sample of stars for each RSG with similar magnitudes and parallaxes, the RSGs do not stand out for having distinctive amounts of excess astrometric noise (Fig. 2 and 3).
Chiavassa et al. (2022) argue for a detection based on the parallax error differences between RSG and MS stars in the Per cluster. However, most of the difference between the RSG and MS stars is simply due to the magnitude dependence of the errors – for the magnitude range in question, fainter stars have smaller parallax errors (see Lindegren et al. 2021). More generally, both the excess noise and parallax errors of the Per RSGs are typical of stars of their magnitude. In fact, they are modestly smaller than average, presumably because of differences between the average Gaia coverage and the detailed coverage of Per. That the difference in parallax errors is comparable to the expected photocenter wander is simply a coincidence.
The detection of the photocenter variability due to convection remains an interesting physical prospect, but it requires a reduction in the Gaia excess astrometric noise from other sources by over an order of magnitude. As noted earlier, the excess noise is a quadrature sum of contributions from the spacecraft and the source where for the stars we consider, the reported median space craft contribution ( mas, Lindegren et al. 2021) appears to be sub-dominant. Nonetheless, it would be useful to have the estimated source noise contribution separate from the spacecraft noise contribution. Note, however, that the excess noise associated with the spacecraft is frequently going to be larger than the expected contribution of the photocenter motions to the excess noise
Acknowledgments
The author thanks T. Thompson for suggesting this as a question to look into. CSK is supported by NSF grants AST-1908570 and AST-1814440. This work has made use of data from the European Space Agency (ESA) mission Gaia (https://www.cosmos.esa.int/gaia), processed by the Gaia Data Processing and Analysis Consortium (DPAC, https://www.cosmos.esa.int/web/gaia/dpac/consortium). Funding for the DPAC has been provided by national institutions, in particular the institutions participating in the Gaia Multilateral Agreement.
Data Availability Statement
All data used in this paper are publicly available.
References
- Arroyo-Torres et al. (2015) Arroyo-Torres B., Wittkowski M., Chiavassa A., Scholz M., Freytag B., Marcaide J. M., Hauschildt P. H., et al., 2015, A&A, 575, A50. doi:10.1051/0004-6361/201425212
- Bailer-Jones et al. (2018) Bailer-Jones C. A. L., Rybizki J., Fouesneau M., Mantelet G., Andrae R., 2018, AJ, 156, 58. doi:10.3847/1538-3881/aacb21
- Chiavassa et al. (2011) Chiavassa A., Pasquato E., Jorissen A., Sacuto S., Babusiaux C., Freytag B., Ludwig H.-G., et al., 2011, A&A, 528, A120. doi:10.1051/0004-6361/201015768
- Chiavassa, Freytag, & Schultheis (2018) Chiavassa A., Freytag B., Schultheis M., 2018, A&A, 617, L1. doi:10.1051/0004-6361/201833844
- Chiavassa et al. (2022) Chiavassa A., Kudritzki R., Davies B., Freytag B., de Mink S. E., 2022, A&A, 661, L1. doi:10.1051/0004-6361/202243568
- Currie et al. (2010) Currie T., Hernandez J., Irwin J., Kenyon S. J., Tokarz S., Balog Z., Bragg A., et al., 2010, ApJS, 186, 191. doi:10.1088/0067-0049/186/2/191
- ESA (1997) ESA, 1997, ESASP, 1200
- Gaia Collaboration et al. (2016) Gaia Collaboration, Prusti T., de Bruijne J. H. J., Brown A. G. A., Vallenari A., Babusiaux C., Bailer-Jones C. A. L., et al., 2016, A&A, 595, A1. doi:10.1051/0004-6361/201629272
- Gaia Collaboration et al. (2021) Gaia Collaboration, Brown A. G. A., Vallenari A., Prusti T., de Bruijne J. H. J., Babusiaux C., Biermann M., et al., 2021, A&A, 649, A1. doi:10.1051/0004-6361/202039657
- Goldberg, Jiang, & Bildsten (2022) Goldberg J. A., Jiang Y.-F., Bildsten L., 2022, ApJ, 929, 156. doi:10.3847/1538-4357/ac5ab3
- Haubois et al. (2009) Haubois X., Perrin G., Lacour S., Verhoelst T., Meimon S., Mugnier L., Thiébaut E., et al., 2009, A&A, 508, 923. doi:10.1051/0004-6361/200912927
- Heger, Langer, & Woosley (2000) Heger A., Langer N., Woosley S. E., 2000, ApJ, 528, 368. doi:10.1086/308158
- Johnson, Kochanek, & Adams (2018) Johnson S. A., Kochanek C. S., Adams S. M., 2018, MNRAS, 480, 1696. doi:10.1093/mnras/sty1966
- Kochanek et al. (2017) Kochanek C. S., Fraser M., Adams S. M., Sukhbold T., Prieto J. L., Müller T., Bock G., et al., 2017, MNRAS, 467, 3347. doi:10.1093/mnras/stx291
- Li et al. (2011) Li W., Leaman J., Chornock R., Filippenko A. V., Poznanski D., Ganeshalingam M., Wang X., et al., 2011, MNRAS, 412, 1441. doi:10.1111/j.1365-2966.2011.18160.x
- Lindegren et al. (2021) Lindegren L., Klioner S. A., Hernández J., Bombrun A., Ramos-Lerate M., Steidelmüller H., Bastian U., et al., 2021, A&A, 649, A2. doi:10.1051/0004-6361/202039709
- López Ariste et al. (2022) López Ariste A., Georgiev S., Mathias P., Lèbre A., Wavasseur M., Josselin E., Konstantinova-Antova R., et al., 2022, A&A, 661, A91. doi:10.1051/0004-6361/202142271
- Messineo & Brown (2019) Messineo M., Brown A. G. A., 2019, AJ, 158, 20. doi:10.3847/1538-3881/ab1cbd
- Morozova, Piro, & Valenti (2018) Morozova V., Piro A. L., Valenti S., 2018, ApJ, 858, 15. doi:10.3847/1538-4357/aab9a6
- Morozova et al. (2020) Morozova V., Piro A. L., Fuller J., Van Dyk S. D., 2020, ApJL, 891, L32. doi:10.3847/2041-8213/ab77c8
- Smartt et al. (2009) Smartt S. J., Eldridge J. J., Crockett R. M., Maund J. R., 2009, MNRAS, 395, 1409. doi:10.1111/j.1365-2966.2009.14506.x
- van Leeuwen (2007) van Leeuwen F., 2007, A&A, 474, 653. doi:10.1051/0004-6361:20078357