A tentative 1000 km s-1 offset between the [CII] 158 m and Ly line emission in a star-forming galaxy at
GN-108036 is a star-forming galaxy at , and one of the most distant known sources in the Northern hemisphere. Based on observations from the NOrthern Extended Millimeter Array (NOEMA), here we report the tentative detection of the [C ii] line at significance. The integrated [C ii] line emission is spatially offset about kpc from the rest-frame ultraviolet (UV) emission. The total [C ii] luminosity () is consistent with the relation between [C ii] luminosity and star formation rate (SFR) observed in nearby and high- star forming galaxies. More interestingly, the [C ii] line is blueshifted with respect to the Ly line by km s-1. If confirmed, this corresponds to the largest velocity offset reported to date between the Ly line and a non-resonant line at . According to trends observed in other high redshift galaxies, the large Ly velocity offset in GN-108036 is consistent with its low Ly equivalent width and high UV absolute magnitude. Based on Ly radiative transfer models of expanding shells, the large Ly velocity offset in GN-108036 could be interpreted as the presence of a large column density of hydrogen gas, and/or an outflow with a velocity of km s-1. We also report the 3 detection of a potential galaxy companion located kpc east of GN-108036, at a similar systemic velocity, and with no counterpart rest-frame UV emission.
Key Words.:
Galaxies: high-redshift - Galaxies: ISM - Galaxies: star formation1 Introduction
The first galaxies most likely formed during the first 200-300 Myr of the Universe lifetime (e.g., Bromm & Yoshida 2011; Wise et al. 2011). These early galaxies represent the primordial building blocks of the galaxy population we observe today. During that early epoch (), the gas in the Universe was mostly neutral, which makes the first galaxies, and their increasing star formation activity, natural contributors to the reionization of the Universe (e.g., Fan et al. 2006). To better understand the properties of these first systems, it is important to consider a multi-wavelength approach, that takes into account the interplay between stars, dust, and warm and cold gas.
Until recently, the study of the first galaxies was limited to the characterization of its nebular and stellar emission: Hubble Space Telescope (HST) near-infrared observations of young and massive stars, Spitzer mid-infrared observations of the bulk of the stellar population, and rest-frame ultraviolet (UV) observations from ground telescopes of the Ly and higher ionization lines (e.g., Ono et al. 2012; Zitrin et al. 2015; Stark et al. 2017). Over the last decade, and thanks to the advent of the improved capabilities of the NOrthern Extended Millimeter Array (NOEMA) and the Atacama Large Millimeter/sub-millimeter Array (ALMA), we now have access to the study of the cold and neutral gas component in these early systems.
The main tracer of the cold gas in high- galaxies is the [C ii] 157.74 m fine structure transition, one of the major coolants of the neutral gas (e.g., Wolfire et al. 2003). One advantage of the [C ii] line is that is bright (typically -1% of the far-infrared luminosity (e.g., Stacey et al. 1991; Herrera-Camus et al. 2018), and remains bright in metal-poor environments (e.g., Israel & Maloney 2011; Cormier 2014; Cigan 2015; Bouwens et al. 2021). Because the C ions can be collisionally excited by hydrogen atoms and molecules, the [C ii] line represents a powerful alternative to trace the neutral gas. This is particularly relevant at high- given the difficulties or serious limitations to observe the CO and HI transitions. At , [C ii] line observations of star-forming galaxies have revealed clumpy gas structure, which is typically spatially offset from the UV emission, and follows in general the observed relation between the star formation rate (SFR) and the [C ii] luminosity observed in nearby galaxies (e.g., Maiolino et al. 2015; Carniani et al. 2017, 2018).
In combination with the [C ii] transition, another important tracer of these very high- systems is the Ly line, produced by young massive stars. The Ly line is resonant, therefore, it is typically offset in velocity with respect to non-resonant lines (e.g., Steidel et al. 2010; Erb et al. 2014; Hashimoto et al. 2015; Cassata et al. 2020). The observed Ly line structure offers valuable information about the interstellar medium (ISM) and it surrounding intergalactic medium (IGM). For example, blueshifted or redshifted Ly emission with respect to the systemic redshift of a system could indicate the presence of inflowing or outflowing gas, respectively (e.g., Dijkstra et al. 2006; Verhamme et al. 2006; Gronke et al. 2015). A compilation by Hashimoto et al. (2019) of Ly, [C ii], and [O iii] 88 m line observations of star-forming galaxies, shows that these systems tend to have Ly velocity offsets in the km s-1 range, and that galaxies with the largest velocity offsets have lower Ly equivalent widths and higher star formation rates. Based on simple expanding spherical shell models, these large velocity offsets could be interpreted as if the galaxy has a large neutral hydrogen column density and/or an outflow (e.g., Verhamme et al. 2006, 2015).
In this letter we focus on the combined analysis of the Ly and [C ii] line emission GN-108036, a star-forming galaxy at . The redshift of GN-108036 is based on the detection of the Ly line from deep Keck/DEIMOS spectroscopy (Ono et al. 2012). This makes GN-108036 one of the most distant sources known in the Northern Hemisphere (dec. +62:08:07). The stellar mass of GN-108036 is , and its star formation rate (SFR) is in the 29 to 100 range based on calculations using the rest-frame UV continuum and stellar population synthesis models, respectively (Ono et al. 2012).
This work is organized as follows. In Section 2 we describe the observations and data reduction. In Section 3 we present the results. In Section 4 we discuss the [C ii] properties of the galaxy and the velocity offset with respect to the Ly line emission. In Section 5 we present the summary and conclusions. For this work we adopt the following cosmological parameters: , and (Planck Collaboration et al. 2020). For a source at , this results in a physical scale of 5.24 kpc/′′.
2 Observations and data reduction
We used NOEMA to observe GN-108036 in the [C ii] 158 m transition and dust continuum. At the redshift of the source, the [C ii] transition is redshifted to GHz, which falls into NOEMA Band 3. GN-108036 was first observed in March 2019 using the most compact array configuration (D) for an on-source time of 3.2 hrs. The second set of observations was taken on March 2020 using array configuration C for an on-source time of 3.7 hrs. We reduced and combined both data sets using the CLIC and MAPPING software by IRAM.111CLIC and MAPPING are part of the GILDAS package (Guilloteau & Lucas 2000): http://www.iram.fr/IRAMFR/GILDAS. For the imaging of the [C ii] cube and the dust continuum map we use natural weighting to maximize the sensitivity. The resulting synthesized beam for the D, C, and combined C+D data was , , and , respectively. The rms noise for the D, C, and combined C+D line cubes is 0.46, 0.35, and 0.35 mJy beam-1 in 25 km s-1 channels, respectively.
We also created a dust continuum map using part of the sidebands of the C+D data where we do not expect line emission from the source. The rms noise in this map is 13 Jy beam-1. Assuming a characteristic dust temperature for a galaxy of K (e.g., Schreiber et al. 2018; Faisst et al. 2020), and a dust emissivity index of , the expected non detection indicates a dust mass upper limit of . The low dust content in GN-108036 is consistent with that observed in other massive (), star-forming galaxies at , including: A2744-YD4 at (; Laporte et al. 2017), B14-65666 at (; Hashimoto et al. 2019), A1689-zD1 at (; Bakx et al. 2021), and a handful of luminous Lyman-break galaxies at ( if the dust temperature is K; Schouws et al. 2022).
3 Results
3.1 Tentative detection of the [C ii] 158 m transition in GN-108036
We performed a blind search for [C ii] line emission by systematically placing apertures of the beam size across the cubes separated by a distance of a quarter of a beam size. We tentatively detected two sources with an integrated signal-to-noise (S/N) of in two regions of the cube: 1) in the center, and slightly offset from the spatial position of the detection of GN-108036 in the HST rest-frame UV and Ly data, and 2) about 30 kpc east from the HST detection of GN-108036.
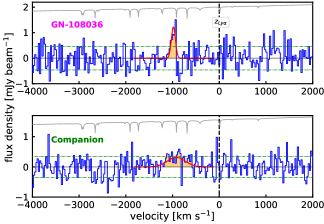
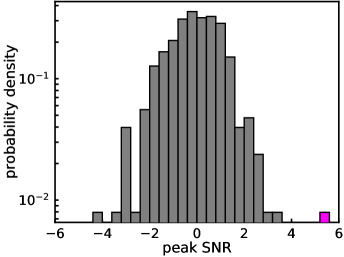
The top-left panel of Fig. 1 shows the [C ii] spectrum of the potential detection of GN-108036 extracted from the compact array NOEMA data. From a single Gaussian fit we find that the line is centered at km s-1 with respect to the detection of the Ly line (Ono et al. 2012). We discuss more about this large velocity offset in Section 4.2. The curve of atmospheric transmission overploted as a gray line shows that the tentative line detection is not a result of a strong or broad atmospheric absorption line. The integrated [C ii] flux is 0.220.06 Jy km s-1, which corresponds to a detection of the source with a S/N of . In Appendix A we also show the histogram of the peak S/N per beam in the compact array data. As expected, the distribution roughly follows a Gaussian shape, and the potential detection of GN-108036 with a peak S/N of 5.4 (magenta bin) corresponds to a high-S/N “outlier”.
The left panel of Fig. 5 in the Appendix shows the spectra extracted in the same region from the extended array and combined array data. The signal is present in the higher angular resolution dataset at the same velocity range, but with lower significance. This could be the result of the [C ii] line emission in GN-108036 to be significantly more extended than ( kpc), as it has been observed in other star-forming galaxies (e.g., Carniani et al. 2020).
| Source | SFR | Central velocity | FWHM | Integrated Flux | Luminosity | ||
|---|---|---|---|---|---|---|---|
| [ yr-1] | [km s-1] | [km s-1] | [Jy km s-1] | 10 | |||
| GN-108036 | 7.213 | 7.180 | 12.7 | 102.7 29.9 | 0.22 0.06 | 2.7 | |
| Companion | 7.188 | 57.2 | 503.5 134.7 | 0.47 0.15 | 6.0 |
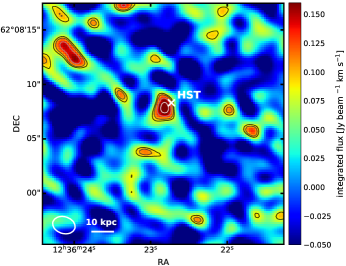
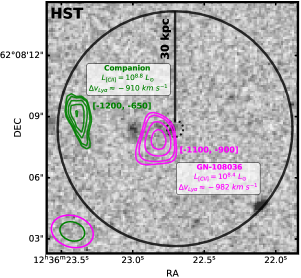
We constructed a [C ii] integrated intensity map (or moment 0) integrating the [C ii] line emission around the potential detection of the line centered at the velocity of km s-1.The peak signal-to-noise in the integrated [C ii] line emission map is . Fig. 6 in the Appendix shows the [C ii] moment 0 map, and the right panel of Fig. 1 shows the [C ii] integrated intensity contours (at significance levels of 2.5, 3, 4 and 5) overplotted on the HST/WFC3 map of the field. The dotted black circle in the center indicates the position of GN-108036 as detected in the rest-frame UV and Ly emission (Ono et al. 2012). The peak of the integrated [C ii] line emission is offset with respect to the peak of the rest-frame UV and Ly emission by kpc in the south-east direction. We checked the astrometric accuracy of the HST images using stars in the field in the GAIA catalog (Gaia Collaboration et al. 2018), and this is not the source of the observed offset. Spatial offsets between the star-forming regions and [C ii] line emission have been observed in other star-forming galaxies at (e.g., Carniani et al. 2018), and could be related to difference in the ionizing state of the gas, dust obscuration, and/or the effect of stellar feedback destroying molecular gas (e.g., Vallini et al. 2015; Katz et al. 2017).
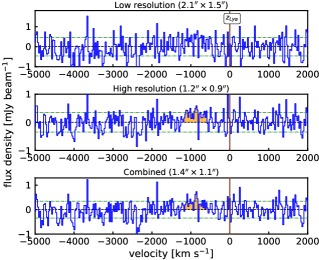
Together with the tentative detection of the [C ii] line in GN-108036, we identify a potential additional system located approximately at 30 kpc in the east direction. The spectrum is shown in the lower-left panel of Fig. 1. Interestingly, the tentative detection is at a similar velocity ( km s-1) of the possible detection of the [C ii] line in GN-108036, but the line profile is significantly wider ( km s-1). The integrated [C ii] flux is 0.470.15 Jy km s-1, which corresponds to a tentative detection with a S/N of . As Fig. 6 in the Appendix shows, the signal is much weaker in the compact array data. The contours of the integrated [C ii] line emission from the extended array data are shown in green in the right panel of Fig. 1.
Table 1 summarizes the [C ii] line properties of the tentative detections of GN-108036 and the companion. We include the redshift of the source (Ly and [C ii]), the central velocity and FWHM of the [C ii] line from the best 1-D Gaussian fit, the integrated [C ii] flux, and the [C ii] luminosity.
4 Analysis
4.1 Relation between [C ii] line emission and star formation activity
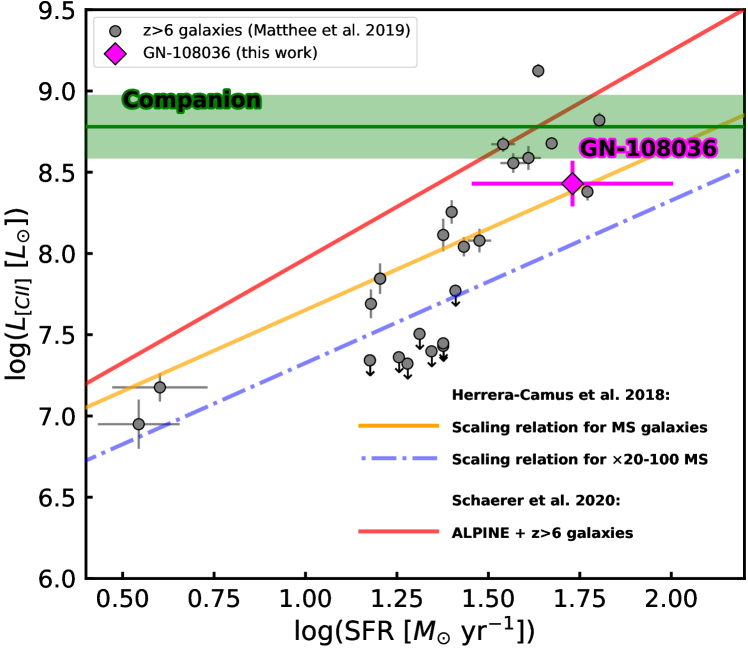
Under the assumption of an interstellar medium in thermal equilibrium, and considering that the [C ii] transition is one of the main cooling channels (e.g., Wolfire et al. 2003), a tight relation is expected between the [C ii] line emission and the star formation activity. This relation has been observed in nearby, star-forming galaxies and high-, main-sequence systems (e.g., De Looze et al. 2014; Herrera-Camus et al. 2015, 2018; Schaerer et al. 2020). Fig. 2 shows the [C ii] luminosity - SFR relation for star-forming galaxies detected at (Matthee et al. 2019). The solid (orange) and dot-dashed (blue) lines represent the best fit to star-forming galaxies on and above () the main-sequence (corrected by the redshift dependence of the main-sequence; Herrera-Camus et al. 2018), and the red line represents the best fit to ALPINE () and other galaxies (Schaerer et al. 2020). GN-108036, with SFR estimates from different indicators ranging between 30 and 100 (Ono et al. 2012), follows the main relation observed in other galaxies, and lies in between the [C ii] scaling relations for galaxies on and above the main-sequence. Regarding the potential companion of GN-108036, there is no HST counterpart or SFR estimate available, so we include the [C ii] luminosity value as an horizontal green line.222 All measurements and scaling relations in Figure 2 have been scaled to the same initial mass function (Salpeter 1955) following the conversion factors listed in Madau & Dickinson (2014).
The fact that GN-108036 follows the [C ii] relation observed in other star-forming galaxies, combined with the small spatial offset observed between the peak of the [C ii] line and the rest-frame UV and Ly emission, argues in favor of the interpretation of the [C ii] line detection in GN-108036 as real and associated with the galaxy.
4.2 Ly - [C ii] velocity offset
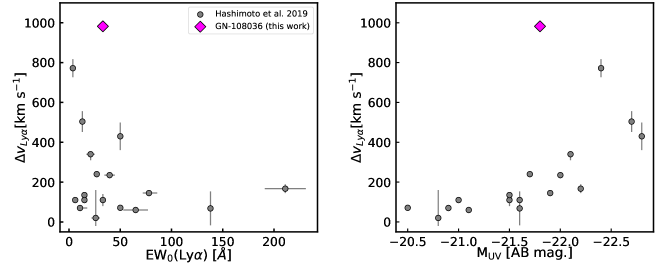
Ly is a resonant line, thus its profile carries important information about the content, geometry and kinematics of the atomic gas. At , star-forming galaxies can show significant velocity differences between Ly and non-resonant lines (e.g., H, H, [O iii]) that range between 100 to 1000 km s-1 (e.g., Hashimoto et al. 2013; Erb et al. 2014). At , Lyman Break galaxies show Ly velocity offsets with respect to the [C ii] line that are typically between 100 to 500 km s-1. The record belongs to the star-forming galaxy B14-65666 at , with Ly line emisison redshifted with respect to the [C ii] and [O iii] lines by km s-1 (Hashimoto et al. 2019).
In the case of GN-108036, the tentative detection of the [C ii] line is blueshifted with respect to the Ly line by km s-1, the largest velocity offset reported to date for a system at . Figure 3 compares the Ly velocity offset in GN-108036 with star-forming galaxies at compiled by Hashimoto et al. (2019). The left panel shows the anti-correlation observed between and Ly equivalent width (EW), and the right panel shows the positive correlation observed between and the UV absolute magnitude () of the system.
To first order, and based on models of Ly radiative transfer in expanding shells, there are two scenarios that can explain the large velocity offset observed in GN-108036. In the first scenario, the presence of a large column density of atomic hydrogen implies that Ly photons suffer from more dust attenuation due to a larger optical path length, which causes a reduction of the Ly equivalent width and an increase in the Ly velocity offset (e.g., Erb et al. 2014). In the second scenario, the increasing UV absolute magnitude is correlated with stronger star formation activity, which can drive outflows including atomic gas that would increase the Ly velocity offset. In a simple approximation, it is expected that the velocity of the outflow () is correlated with as (e.g., Verhamme et al. 2006). This would imply an atomic gas outflow velocity for GN-108036 of km s-1. This outflow velocity is consistent with those observed in local starburst with comparable levels of star formation activity (e.g., Shapley et al. 2003; Heckman & Borthakur 2016).
5 Summary and conclusions
We report new NOEMA Band 3 observations of the [C ii] 158 m transition and dust continuum in one of the most distant sources in the Northern hemisphere, the star-forming galaxy GN-108036 detected in Ly emission at (Ono et al. 2012). Our main results can be summarized as follows:
-
1.
We tentatively detect GN-108036 in [C ii] line emission with a . The peak of the integrated emission is spatially offset about 4 kpc with respect to the peak of the rest-frame UV and Ly line detection (Ono et al. 2012). Spatial offsets of similar magnitudes are commonly observed in star-forming systems at (e.g., Carniani et al. 2018). The potential [C ii] detection is blueshifted with respect to the Ly emission by km s-1. If confirmed, this would be the largest Lya velocity offset reported to date for a star-forming galaxy. GN-108036 is not detected in the dust continuum, and the dust mass upper limit is .
-
2.
Together with GN-108036, we tentatively detect () in [C ii] line emission one additional source at similar systemic velocity but located kpc east of GN-108036. This source has no counterpart in the HST imaging of the field.
-
3.
GN-108036, with a SFR that ranges between (Ono et al. 2012), follows the relation between the [C ii] luminosity and the SFR observed in star-forming galaxies at (e.g., Matthee et al. 2019), and is consistent with the scaling relations of observed in nearby and high-z main-sequence star-forming galaxies (e.g., Herrera-Camus et al. 2018; Schaerer et al. 2020). The fact that the potential [C ii] emission in GN-108036 is almost co-spatial with the rest-frame UV and Ly emission, and that GN-108036 follows the relation, argues in favor of the [C ii] line detection to be real.
-
4.
The Ly velocity offset observed in GN-108036 is consistent with the positive and negative correlations observed between and EW and in star-forming galaxies, respectively. If models of Ly radiative transfer in expanding shells apply to GN-108036, the physical scenarios that could explain the observed large Lya velocity offset, the low EW and high are: 1) the presence of a large HI column density, 2) the existence of an outflow with velocity km s-1. Certainly deeper, higher angular resolutions observations of GN-108036 are needed to confirm the [C ii] line detection, and further explore these two scenarios.
The upgraded NOEMA capabilities, which will have 12 antennas by the end of the summer of 2022, and has a correlator () with a bandwidth of GHz, offers a great opportunity to search and detect in [C ii] line emission galaxies based on robust photometric redshifts estimates. The latter should become available in large numbers in the near future thanks to the James Webb Space Telescope.
Acknowledgements.
We thank the referee for very useful comments and suggestions that improved the manuscript. R. B.-S and R.H.-C. thank the Max Planck Society for support under the Partner Group project ”The Baryon Cycle in Galaxies” between the Max Planck for Extraterrestrial Physics and the Universidad de Concepción. R.H-C also acknowledge financial support from Millenium Nucleus NCN19_058 (TITANs) and support by the ANID BASAL projects ACE210002 and FB210003.References
- Bakx et al. (2021) Bakx, T. J. L. C., Sommovigo, L., Carniani, S., et al. 2021, MNRAS, 508, L58
- Bouwens et al. (2021) Bouwens, R., Smit, R., Schouws, S., et al. 2021, arXiv preprint arXiv:2106.13719
- Bromm & Yoshida (2011) Bromm, V. & Yoshida, N. 2011, ARA&A, 49, 373
- Carniani et al. (2020) Carniani, S., Ferrara, A., Maiolino, R., et al. 2020, MNRAS, 499, 5136
- Carniani et al. (2017) Carniani, S., Maiolino, R., Pallottini, A., et al. 2017, A&A, 605, A42
- Carniani et al. (2018) Carniani, S., Maiolino, R., Smit, R., & Amorín, R. 2018, ApJ, 854, L7
- Cassata et al. (2020) Cassata, P., Morselli, L., Faisst, A., et al. 2020, A&A, 643, A6
- Cigan (2015) Cigan, P. J. 2015, PhD thesis, New Mexico Institute of Mining and Technology
- Cormier (2014) Cormier, D. 2014, Disentangling the ISM phases of the nearby low-metallicity dwarf galaxy NGC4214 using velocity-resolved [CII], SOFIA Proposal
- De Looze et al. (2014) De Looze, I., Cormier, D., Lebouteiller, V., et al. 2014, A&A, 568, A62
- Dijkstra et al. (2006) Dijkstra, M., Haiman, Z., & Spaans, M. 2006, ApJ, 649, 37
- Erb et al. (2014) Erb, D. K., Steidel, C. C., Trainor, R. F., et al. 2014, ApJ, 795, 33
- Faisst et al. (2020) Faisst, A. L., Fudamoto, Y., Oesch, P. A., et al. 2020, MNRAS, 498, 4192
- Fan et al. (2006) Fan, X., Strauss, M. A., Becker, R. H., et al. 2006, The Astronomical Journal, 132, 117
- Gaia Collaboration et al. (2018) Gaia Collaboration, Brown, A. G. A., Vallenari, A., et al. 2018, A&A, 616, A1
- Gronke et al. (2015) Gronke, M., Bull, P., & Dijkstra, M. 2015, ApJ, 812, 123
- Guilloteau & Lucas (2000) Guilloteau, S. & Lucas, R. 2000, in Astronomical Society of the Pacific Conference Series, Vol. 217, Imaging at Radio through Submillimeter Wavelengths, ed. J. G. Mangum & S. J. E. Radford, 299
- Hashimoto et al. (2019) Hashimoto, T., Inoue, A. K., Mawatari, K., et al. 2019, Publications of the Astronomical Society of Japan, 71, 71
- Hashimoto et al. (2013) Hashimoto, T., Ouchi, M., Shimasaku, K., et al. 2013, ApJ, 775, 140
- Hashimoto et al. (2015) Hashimoto, T., Verhamme, A., Ouchi, M., et al. 2015, ApJ, 812, 157
- Heckman & Borthakur (2016) Heckman, T. M. & Borthakur, S. 2016, ApJ, 822, 9
- Herrera-Camus et al. (2015) Herrera-Camus, R., Bolatto, A. D., Wolfire, M. G., et al. 2015, ApJ, 800, 1
- Herrera-Camus et al. (2018) Herrera-Camus, R., Sturm, E., Graciá-Carpio, J., et al. 2018, The Astrophysical Journal, 861, 95
- Israel & Maloney (2011) Israel, F. P. & Maloney, P. R. 2011, in EAS Publications Series, Vol. 52, EAS Publications Series, ed. M. Röllig, R. Simon, V. Ossenkopf, & J. Stutzki, 287–288
- Katz et al. (2017) Katz, H., Kimm, T., Sijacki, D., & Haehnelt, M. G. 2017, MNRAS, 468, 4831
- Laporte et al. (2017) Laporte, N., Ellis, R. S., Boone, F., et al. 2017, ApJ, 837, L21
- Madau & Dickinson (2014) Madau, P. & Dickinson, M. 2014, ARA&A, 52, 415
- Maiolino et al. (2015) Maiolino, R., Carniani, S., Fontana, A., et al. 2015, MNRAS, 452, 54
- Matthee et al. (2019) Matthee, J., Sobral, D., Boogaard, L. A., et al. 2019, ApJ, 881, 124
- Ono et al. (2012) Ono, Y., Ouchi, M., Mobasher, B., et al. 2012, ApJ, 744, 83
- Planck Collaboration et al. (2020) Planck Collaboration, Aghanim, N., Akrami, Y., et al. 2020, A&A, 641, A6
- Salpeter (1955) Salpeter, E. E. 1955, ApJ, 121, 161
- Schaerer et al. (2020) Schaerer, D., Ginolfi, M., Béthermin, M., et al. 2020, A&A, 643, A3
- Schouws et al. (2022) Schouws, S., Stefanon, M., Bouwens, R., et al. 2022, ApJ, 928, 31
- Schreiber et al. (2018) Schreiber, C., Elbaz, D., Pannella, M., et al. 2018, A&A, 609, A30
- Shapley et al. (2003) Shapley, A. E., Steidel, C. C., Pettini, M., & Adelberger, K. L. 2003, The Astrophysical Journal, 588, 65
- Stacey et al. (1991) Stacey, G., Geis, N., Genzel, R., et al. 1991, The Astrophysical Journal, 373, 423
- Stark et al. (2017) Stark, D. P., Ellis, R. S., Charlot, S., et al. 2017, MNRAS, 464, 469
- Steidel et al. (2010) Steidel, C. C., Erb, D. K., Shapley, A. E., et al. 2010, ApJ, 717, 289
- Vallini et al. (2015) Vallini, L., Gallerani, S., Ferrara, A., Pallottini, A., & Yue, B. 2015, ApJ, 813, 36
- Verhamme et al. (2015) Verhamme, A., Orlitová, I., Schaerer, D., & Hayes, M. 2015, A&A, 578, A7
- Verhamme et al. (2006) Verhamme, A., Schaerer, D., & Maselli, A. 2006, A&A, 460, 397
- Wise et al. (2011) Wise, J. H., Turk, M. J., Norman, M. L., & Abel, T. 2011, The Astrophysical Journal, 745, 50
- Wolfire et al. (2003) Wolfire, M. G., McKee, C. F., Hollenbach, D., & Tielens, A. G. G. M. 2003, ApJ, 587, 278
- Zitrin et al. (2015) Zitrin, A., Labbé, I., Belli, S., et al. 2015, ApJ, 810, L12
Appendix A Significance of the potential [C ii] detections of GN-108036 and its companion
Fig. 4 shows the distribution of positive and negative peak S/N values per beam of the compact array data, respectively. The tentative detection of GN-108036 is shown as a magenta bin with a peak S/N value of 5.3.
Appendix B NOEMA [C ii] line observations of GN-108036 with different array configurations
Fig. 5 shows the [C ii] line spectra of GN-108036 (left) and the potential companion (right) extracted from the D, C, and combined array configuration data, respectively.
Fig. 6 shows the [C ii] line integrated intensity map of GN-108036 based on the compact array (D) data. The contours correspond to 2.5, 3, 3.5, 4, 4.5, 5 and 5.5 significance levels. The white cross at the center corresponds to the position of the HST rest-frame UV emission from GN-108036.