Nature and Nurture? Comparing Ly Detections in UV-bright and Fainter [O III]+H Emitters at With Keck/MOSFIRE
Abstract
The 100% detection rate of Ly emission in a sample of four luminous galaxies with red Spitzer/IRAC colors suggests objects with unusual ionizing capabilities that created early ionized bubbles in a neutral era. Whether such bubbles reflect enhanced ionizing properties (nature) or an overdense environment (nurture), however, remains unclear. Here we aim to distinguish between these hypotheses via a search for Ly emission in five fainter galaxies drawn from the CANDELS-GOODS fields using a similar IRAC excess and UV magnitudes that should reflect reduced clustering effects. Using Keck/MOSFIRE we tentatively detect line emission in only two targets at redshifts =7.1081 and =7.9622 with rest-frame EWs of 16-17 Å, 1.5 weaker compared to their brighter counterparts. Thus we find a reduced rate for Ly emission of compared to for more luminous examples. The lower rate agrees with predictions from simulations of a mostly neutral IGM and an intrinsic EW0,Lyα distribution for galaxies. However, even with an extreme EW0,Lyα model, it is challenging to match the detection rate for the luminous objects. SED-fitting of our fainter sample indicates young and star-forming systems, albeit with less extreme SFRs and ionization parameters compared to their luminous counterparts. The enhanced Ly rate in luminous galaxies is thus likely a byproduct of both extreme ionizing properties as well as environment effects. Further studies with JWST may be required to resolve the physical nature of this puzzling population.
1 Introduction
Pinpointing the birth of the first stars and galaxies and determining their role in transforming the intergalactic medium (IGM) from a neutral state to completely ionized remains one of the holy grails of observational cosmology and one of the main motivations for next generation telescopes (e.g., the James Webb Space Telescope, Square Kilometre Array, and optical/IR Extremely Large Telescopes). A popular view is that reionization was driven largely by the abundant population of faint galaxies dominating the faint end of the galaxy luminosity function (Robertson et al., 2015; Robertson, 2021). However, the rapid change in the ionization state of the IGM at redshifts (Mason et al., 2019b; Qin et al., 2021), may suggest that rarer, more luminous sources provided a dominant contribution in concluding the process (e.g., Naidu et al., 2020). While the high neutral fraction of the IGM beyond 8 is well established (Treu et al., 2013; Mason et al., 2019b; Hoag et al., 2019; Bolan et al., 2021), constraints on the sources that governed the reionization process are still sorely lacking: are their properties similar to those of galaxies found at 7.5 or do they differ, perhaps reflecting an alternate evolutionary pathway as one approaches the first galaxies (e.g., Oesch et al., 2014; McLeod et al., 2016; Oesch et al., 2018)?
An important clue comes from spectroscopic observations of luminous galaxies with red Spitzer Space Telescope IRAC 3.6-4.5 m colors - a so-called “IRAC excess”, generally attributed to intense [O III]+H line emission polluting the IRAC 4.5 m band. With rest-frame equivalent widths of EW1500 Å, such line emission is suggestive of extreme sources with intense radiation fields, resulting in unusually high fractions of Ly detections at 7.5 (Oesch et al., 2015; Zitrin et al., 2015; Roberts-Borsani et al., 2016; Laporte et al., 2017b, a; Stark et al., 2017; Hashimoto et al., 2018; Endsley et al., 2021; Laporte et al., 2021) in contrast with the much lower detection rates in magnitude-limited samples (c.f. Fontana et al., 2010; Pentericci et al., 2011; Schenker et al., 2014; Mason et al., 2018b, 2019b; Hoag et al., 2019). Perhaps the most marked example was the recent spectroscopic follow up of a sample of four luminous ( AB; mag), IRAC-excess galaxies selected by Roberts-Borsani et al. (2016, henceforth RB16) in the CANDELS fields, which revealed Ly emission in each of the four objects with Keck/MOSFIRE and VLT/X-Shooter spectroscopy (RB16; Stark et al., 2017; Laporte et al., 2017a). The surprising 100% detection rate of the line is strong evidence for early ionized bubbles in a predominantly neutral medium.
Given the especially luminous nature of the sources, whether these bubbles are the consequence of extreme ionizing properties (i.e., nature) and/or due to clustered environments typical of more massive galaxies (i.e., nurture) remains an open question. As examples of the former, Endsley et al. (2021) showed a clear correlation between the EW distribution of detected Ly and the strength of [O III]+H (as indicated by their Spitzer/IRAC excesses) in a sample of 22 UV-bright galaxies at , suggestive of intrinsic properties playing a key role. Furthermore, additional spectroscopy of a number of IRAC-excess sources revealed line emission from high-excitation UV lines (e.g., N V1240, [C III],C III]1907,1909, and He II1640) suggestive of hard spectra, extreme radiation fields (Stark et al., 2017) and possible non-thermal contributions (Laporte et al., 2017a; Mainali et al., 2018). The detection of these lines suggests this particular population of galaxies may harbor unusual properties and stellar populations that are able to more efficiently carve out large, early ionized bubbles and have enhanced Ly production.
However, environmental effects likely also play a role. With three of the four luminous RB16 galaxies residing in the same CANDELS-EGS field, cosmic variance and a clustered environment may play a significant role: indeed, spectroscopic confirmations of fainter satellite galaxies around two of the RB16 EGS objects indicates the likely presence of overdensities, with physical separations between the galaxies extending merely 0.7-3.5 physical Mpc (pMpc) along the line of sight (Tilvi et al., 2020; Larson et al., 2022). Furthermore, the recent photometric analysis by Leonova et al. (2021) using deep HST band and Spitzer/IRAC imaging revealed an enhancement of neighbouring galaxies around each of the three UV-bright EGS galaxies of the RB16 sample, by a factor of compared to blank fields. Such analyses suggest a ubiquity of overdense regions around luminous, Ly-emitting IRAC-excess sources, although deep spectroscopic measurements are required for confirmation.
Thus, recent analyses have revealed evidence for both exceptional properties and clustered environments for these intriguing samples, making it challenging to discern the primary cause of the early ionized bubbles. One way to disentangle the effects of nature (intrinsic properties) and nurture (environment) is to extend such analyses to fainter galaxies that are less subject to the same clustering effects expected in predominantly luminous samples (Barone-Nugent et al., 2014; Qiu et al., 2018; Harikane et al., 2022; Qin et al., 2022). As such, in this paper we seek to determine whether the fainter-end of the IRAC-excess galaxy population reside in ionized bubbles to the same extent as their luminous counterparts, via the presence of Ly. We therefore present the spectroscopic search for Ly in five fainter ( mag) IRAC-excess sources with Keck/MOSFIRE, selected as part of the extended RB16 sample with identical data sets and thus minimizing selection effects and ideally suited for a one-to-one comparison with their luminous ( mag) counterparts.
The paper is structured as follows. In Section 2 we describe the target selection and photometric data sets adopted, Section 3 describes our Keck/MOSFIRE observations and presents the results of those observations. Section 4 compares the detection rates of Ly across bright and fainter samples with LyIGM modelling, while Section 5 derives and contrasts their intrinsic properties via SED-fitting. Finally, we present a summary and our conclusions in Section 6. Where relevant, we assume H70 km/s/Mpc, 0.3, and 0.7. All magnitudes are in the AB system (Oke & Gunn, 1983).
2 Target Selection & Photometry
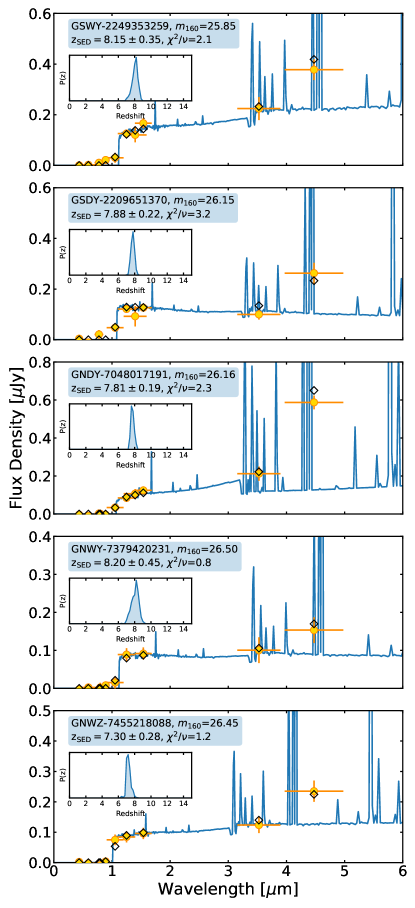
To compare Ly visibility statistics with the primary, luminous IRAC-excess sample of RB16 galaxies, we select a subset of the fainter galaxies presented in Table 5 of the same paper, which were selected in identical fashion to the bright sample - i.e., through an initial NIR color cut to constrain the location of the Lyman break, followed by photo- modelling with EAzY (see RB16 for details) - albeit with fainter magnitude limits. A total of 5 galaxies were selected here (GSWY-2249353259, GSDY-2209651370, GNDY-7048017191, GNWY-7379420231, and GNWZ-7455218088) based on their approximate values and visibility with the Keck telescopes. Three of the targets reside in the GOODS-North field, two in the GOODS-South field and all have , [3.6]-[4.5]0.5 and reported photometric redshifts of from EAzY. Each of the targets benefit from deep HST and Spitzer/IRAC photometry, which we adopt from Bouwens et al. (2015): the filters included as part of the data set are optical filters from HST/ACS (F435W, F606W, F775W, F814W, F850LP), NIR filters from HST/WFC3 (F098M, F105W, F125W, F140W, F160W) and IR filters from Spitzer/IRAC (CH1 and CH2) - for details on the construction of the data set and RB16 selection, we refer the reader to Bouwens et al. (2015) and RB16. We fit all of the available photometry for each object using the Bayesian Analysis of Galaxies for Physical Inference and Parameter EStimation (Bagpipes; Carnall et al., 2018) SED-fitting code, adopting an exponentially delayed star formation history. The choice of model is primarily motivated by previous studies highlighting the need for extended star formation to trace the bulk of the stellar mass formed as well as more recent and intense star formation to account for the boosting of [O III]+H nebular line emission in the Spitzer/IRAC bands (e.g., Stark et al. 2017; Roberts-Borsani et al. 2020; Laporte et al. 2021). The model and its parameter ranges are similar to those adopted by Stark et al. (2017) for characterization of the luminous RB16 IRAC-excess objects and thus allow for a close comparison of results. The free parameters were a stellar mass formed (log ) of [6,10], a star formation timescale () of [0,100] Gyrs, a metallicity () of [0,0.5], stellar ages of [0,0.1] Gyrs, dust attenuation (/mag) of [0,1] mag, and an ionization parameter (log ) of [] with a velocity dispersion for all absorption and emission lines of 150 km s-1. Redshifts were allowed to vary between [0,15]. The resulting photo- distributions and SEDs are plotted in Figure 1, where we find the photometric redshift solutions are virtually identical (and within errors) to those reported in Table 5 of RB16. We note that we perform a similar fit to the data with the addition of a bursty component with age 0-10 Myrs, mass formed (in log units) 6-10 and shared metallicity and dust components, however we find that the model is poorly constrained by the data and results in poorer fits. We summarize the list of targets, along with their basic photometric quantities, in Table 1. For comparison, we also compile the photometric properties of the luminous RB16 sample in the bottom half of Table 1. Our faint sample has a mean magnitude of 26.220.15 AB and absolute magnitude (assuming photometric redshifts and a UV slope of ) of mag, compared to 25.120.06 and (assuming spectroscopic redshifts) for the bright sample. Adopting the relation (where denotes the dark matter halo mass) from Mason et al. (2015), we estimate the mag difference to translate to the bright galaxies residing in halos more massive than the fainter ones, and consistent with simulations showing AB galaxies residing in larger ionized bubbles (Qin et al., 2022).
3 Keck/MOSFIRE Observations
3.1 band Spectroscopy
For our spectroscopic campaign, we used the Multi-Object Spectrometer for Infra-Red Exploration (MOSFIRE; McLean et al., 2012) on the Keck I telescope, targeting each of our sources with band spectroscopy in search for Ly emission. MOSFIRE slitmasks were constructed using the MOSFIRE Automatic GUI-based Mask Application (MAGMA) software and slit widths of 0.7′′ (affording a spectral resolution of ). Thanks to MOSFIRE’s large FOV () the primary targets were multiplexed over a total of 2 slitmasks to increase observing efficiency - the primary targets included on Mask 1 were GSWY-2249353259 and GSDY-2209651370, while those included on Mask 2 were GNDY-7048017191, GNWY-7379420231 and GNWZ-7455218088. In both slitmasks, a bright nearby star was included in one of the slits for seeing- and throughput-monitoring purposes.
The observations were distributed over an approximate 7-month window and carried out over a total of 6 nights (5 full nights and 2 half nights; 24th November 2020, 25th November 2020, 7th December 2020, 20th April 2021, 21st April 2021, 16th May 2021 and 17th May 2021 - the latter two of which were half nights) using a ABBA dither pattern - the precise amplitude of the dither was carefully checked to ensure the primary sources did not fall on any slit-contaminating sources. While most of the first half of 24th November 2020 was lost due to poor weather conditions and the entire night of 20th April 2020 lost due to cloud coverage, the rest of the observations were carried out in good weather conditions and sub-arcsec seeing (, , , , and for 24th November 2020, 25th November 2020, 7th December 2020, 21st April 2021, 16th May 2021 and 17th May 2021, respectively). A summary of the targets and the telescope observations is provided in Table 1. In the case of Mask 1, it became apparent after the second night that the slit containing GSDY-2209651370 was too long (), causing some curvature of the resulting sky lines at the opposite end of the target’s position. As such, the slit was shortened to to avoid the issue further.
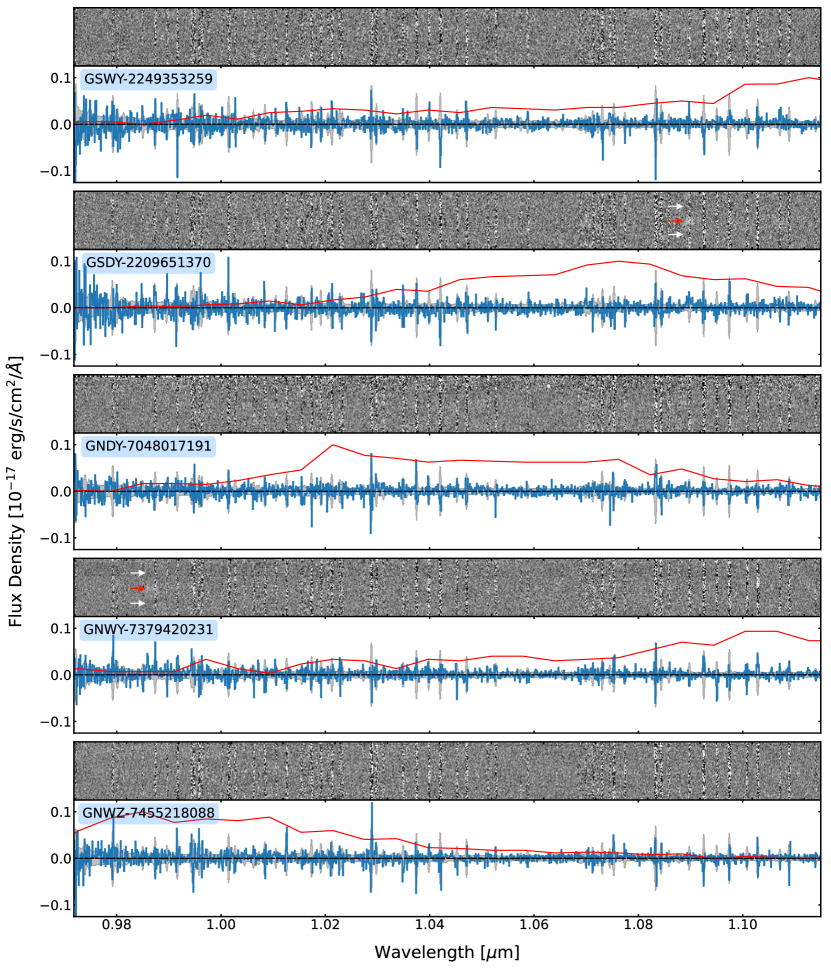
The data were reduced using the PypeIt data reduction package (Prochaska et al., 2020, 2020), which uses telescope/instrument-specific data reduction scripts invoked from an input configuration file (henceforth referred to as the “PypeIt file”). The PypeIt file takes as input the science and calibration files to reduce, as well the parameters required to reduce, calibrate and co-add the data. We adopt the default Keck/MOSFIRE parameters 111https://pypeit.readthedocs.io/en/release/pypeit_par.html and reduce the data in ABBA sequence blocks (i.e., for a given sequence, A-B and B-A subtraction is performed for background subtraction before co-adding AB frames and BA frames, resulting in two background-subtracted images), using the spectral trace of a bright star in one of the slits on each mask as a position reference. The co-added science exposures were used for wavelength calibration and tilt measurements, while flat frames were used for slit edge tracing in addition to flat-fielding. We note that in the case of Mask 1 (i.e., the GOODS-S targets), we used only the flats of 7th December 2020, since this allowed us to artificially define the slit traces of that night onto the data taken on 24th and 25th November 2020, thereby providing us with a significantly improved wavelength solution based on the smaller slit adopted for the December observations. The reduced A-B (or B-A) data frames were subsequently co-added using the extracted 1D spectra from each frame as weights, and flux-calibrated using a sensitivity function (i.e., the ratio of flux density to electron count density) generated from an archived, flux-calibrated standard star spectrum from ESO, providing us with fully reduced, calibrated and co-added 2D and 1D spectra which we display in Figure 2. The total exposure times resulting from the observations and data reduction were 6.3 hours for the GOODS-S mask and 11.8 hours for the GOODS-N mask.
3.2 Detections of Ly at
Each of the resulting 1D and 2D band spectra presented in Figure 2 were visually (and independently) inspected by two authors (GRB and NL) to search for Ly emission. Tentative emission lines were found in two of the targeted galaxies, namely GNWY-7379420231 and GSDY-2209651370, and are shown in Figure 3.
For GNWY-7379420231, a single, narrow emission line is clearly visible in the 2D spectrum, showing a positive, central component with two negative counterparts above and below it separated by approximately 14 pixels, which corresponds to our dither choice of 1.25′′. The line resides between sky lines and a simple Gaussian fit (ignoring potential line asymmetries due to a neutral IGM) finds the central wavelength to lie at 9859.5 Å with an integrated signal-to-noise ratio (SNR) of (using the integral of the fitted Gaussian and noise measured in sky line-free regions of the spectrum either side of the line). No other convincing emission line is seen in the rest of the 1D or 2D spectra. To ensure the line is not due to a spurious bad frame or artefact in the data, we first visually inspect and measure the S/N ratio at the position of the line in all individual 1D spectra (integrating over the spectrum at the position of the original Gaussian and again adopting noise from the same sky line-free regions used in the full stack) from the AB and BA exposure pairs, finding no single exposure where a significant peak is found. To add statistical robustness and asses whether the line is consistently found in randomly-sampled portions of the data, we adopt a Monte Carlo approach where we randomly sample (without replacement) 50% of all AB and BA exposure pairs and 2D co-add those selected spectra before re-extracting the 1D spectrum and re-estimating the SNR of the apparent line. Repeating this 100 times, we find that 67% of the iterations reveal a (scaled from 4.5) line, while this increases to 73% (at ) if we perform the same simulations with 75% of the data. The detection rates lie above those expected for a spurious line in 1-2 bad frames (39% and 64% when using half or three quarters of the full data set, respectively), but not significantly enough to make this test conclusive.
A similar case is found for GSDY-2209651370, which displays a single, broad emission line: the line itself falls behind a sky line, however it is sufficiently broad to be clearly visible either side of the sky line and a positive/negative trace pattern similar to the line in GNWY-7379420231 is seen at the expected positions. Again, no other line is found in the rest of the 1D or 2D spectra. Masking the sky line and fitting another simple Gaussian profile, we find the emission line has a central wavelength of 10898.0 Å and an integrated SNR of . Given its location behind a sky line, we cannot reliably extend the above statistical analyses to GSDY-2209651370, since measurements at the center of the line would be contaminated by the overlapping sky line, and the “wings” of the line either side of the sky line would be too faint for any reliable measurements.
Both of the identified lines are consistent with Ly emission at and the hypothesis of strong [O III]+H emission lines as the cause of the especially red Spitzer/IRAC band (see Roberts-Borsani et al. 2020 for a description of Balmer break contributions to the red colors at , however). As such, we tentatively confirm GNWY-7379420231 and GSDY-2209651370 at redshifts of and , respectively, consistent with their ’s estimated with Bagpipes. We caution, however, that considering the detection rates estimated above for GNWY-7379420231 and the faintness of the lines, we cannot conclusively rule out a spurious nature for either, and thus ensuing detection rates should effectively be regarded as upper limits.
Correcting for instrumental broadening with a Gaussian fit to a nearby sky line, we find the emission line of GNWY-7379420231 to be just unresolved ( Å) and thus assume a maximum FWHM given by the sky line. This is not the case for GSDY-2209651370, whose emission line is significantly wider. The instrumentally-corrected Gaussian fits to the lines yield peak fluxes of 4.71.6 erg s-1 cm-2 Å-1 and 2.00.5 erg s-1 cm-2 Å-1, integrated fluxes of 1.50.7 erg s-1 cm-2 and 2.40.8 erg s-1 cm-2, and line FWHMs of 31 Å and 123 Å (corresponding to km s-1 and km s-1) for GNWY-7379420231 and GSDY-2209651370, respectively. Assuming a flat, underlying continuum given by the photometry, these would correspond to rest-frame equivalent widths of EW Å and EW Å.
For non-detections of Ly in GSWY-224935325, GNDY-7048017191, and GNWZ-7455218088, we place upper limits on the integrated flux and EW of the line. For the former, we take the median noise value in an uncontaminated (i.e., free of sky lines) portion of the noise spectrum, close to the photometric redshift of each galaxy and multiply the resulting value by the square-root of the number of pixels considered. For the latter, we use the resulting upper limit on the integrated flux and divide by the continuum as well as a (1+) factor as above to obtain the upper limit on the rest-frame EW. The derived range of values is 6-9 Å, and we summarize these properties in Table 1. We note here that we do not account for slit loss effects.
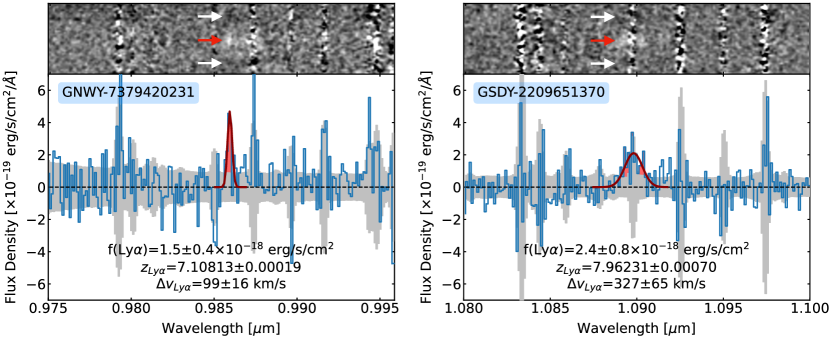
shown in the top panel, with red and white arrows to mark the positive and negative Ly traces respectively, while the bottom panels show the collapsed 1D spectra (blue line), the associated 1 uncertainty array (grey fill), and the best fit Gaussian model (dark red line) to each line (red fill).
4 Comparing Lyman- Detection Rates with Models
Here we aim to place the detection rates found for the UV-bright ( mag) and fainter ( mag) IRAC-excess samples into context: how do the rates compare, and how well (or poorly) are they matched to simulations of a neutral intergalactic medium and an assumed EW0,Lyα distribution function? Quantifying the first of the two points determines whether any apparent differences are statistically significant, while the second determines whether our understanding of the IGM and underlying physics of typical galaxy populations can explain the derived detection rates - the models account for clustering effects (i.e., the nurture effect), and thus allow us to quantify whether a change in the intrinsic properties of galaxies (i.e., the nature effect) is also needed.
For the first point, out of our five faint IRAC-excess sources targeted with Keck/MOSFIRE, we find tentative Ly detections in only two sources. Using the small number statistical limits presented by Gehrels (1986), this places the Ly detection rate in our sample at 0.40 (assuming 16% and 84% binomial percentiles). While the small number statistics prevent us from claiming statistically significant differences, the detection rate found here suggests differences with the 1.00 detection rate of Ly in the primary, luminous sample of RB16 determined by Stark et al. (2017). The low intensities, integrated line fluxes and small EWs of the probable lines also make these among the faintest and weakest Ly emission found thus far at comparable redshifts (c.f. Finkelstein et al. 2015; Oesch et al. 2015; Zitrin et al. 2015; Song et al. 2016; Laporte et al. 2017b; Hashimoto et al. 2018): both of our lines display rest-frame EWs of 16-17 Å, well below the Ly emitter threshold of EW Å generally assumed for inclusion as LBGs in reionization-constraining studies, and a median factor of weaker than the EWs reported for their luminous IRAC-excess counterparts.
On the second point, the flux of Ly we observe is the product of the intrinsic Ly flux that emerges from the ISM and the fraction that is transmitted through the reionizing IGM. The transmitted fraction is thus a function of the integrated optical depth of Ly through the IGM, determined by the distribution of neutral gas due to reionization, and the line shape of Ly determined from radiative transfer of the line through the galaxy ISM. To interpret our observations we compare our Ly detection rate to that expected from inhomogeneous reionization simulations using a Monte Carlo simulation. For each IRAC-selected galaxy we generate 1000 mock Ly observations by simulating a line EW from an underlying distribution and converting the EW to a corresponding line flux. We then compare to the reported flux uncertainties (from Table 1) to classify the mock observations as a detection or not. The Ly EWs are sampled from the model EW distributions by (Mason et al., 2018a, b) which are a function of UV magnitude and the IGM neutral fraction , constructed by forward-modelling an assumed intrinsic Lya EW distribution through the realistic inhomogeneous reionization Evolution of Structure simulations over thousands of sightlines (Mesinger et al., 2016). In this way we account for the expected UV magnitude dependence of Ly transmission during reionization, whereby the brightest galaxies live in overdensities that should reionize early and thus have higher Ly transmission (e.g., Mason et al., 2018a, b; Qin et al., 2021; Leonova et al., 2021).
For each galaxy, we sample a UV magnitude, and redshift, from within the uncertainties in Table 2 (see Section 5) and Table 1, respectively assuming Gaussian errors. We then sample the IGM neutral fraction at the spectroscopic or sampled photometric redshift from the constraints on the IGM timeline by Mason et al. (2019a), which conservatively includes only the Planck Collaboration et al. (2020) electron scattering optical depth and quasar dark pixel fraction (McGreer et al., 2015). For example, at the inferred IGM neutral fraction is . We then sample from the corresponding Ly EW distribution by Mason et al. (2018a). For each realization we draw a Ly EW and forward-model the Ly emission line using the continuum flux density derived using and slopes from Table 2, we then sample a Ly velocity offset from the model by Mason et al. (2018a) and set FWHM equal to the velocity offset following Verhamme et al. (2015). We then perform a mock observation summing the flux over a wavelength region with width FWHM, centered on the peak “observed” Ly wavelength, and summing the noise from our MOSFIRE observations in quadrature in that wavelength range. Simulated fluxes above the limit (we choose a threshold to mimic the lowest significance of the detected line EWs in Table 1) given the galaxy’s observed flux uncertainty is classified as a detection. We repeat this process 1000 times for each galaxy to build a probability distribution for the expected number of detections.
In Figure 4 we show the results of these simulations. The left panels shows the probability distribution of the expected number of (EW) detections for the UV-bright IRAC-selected sample by RB16, and the right panels shows the same for the fainter sample presented here - we report the results for the expected number of and detections in the top and bottom panels of the figure, respectively. The grey shaded region shows the expected number of detections for the “normal” EW distribution model by Mason et al. (2018a), which assumes an intrinsic Ly EW distribution from an empirical model built using Lyman break galaxies at , which were not selected by strong IRAC excesses (De Barros et al., 2017; Fuller et al., 2020; Bolan et al., 2021).
As discussed by Mason et al. (2018b) this intrinsic distribution fails to match the observed frequency of detections in the bright IRAC-excess galaxies, implying that these galaxies have enhanced Ly emission compared to non IRAC-excess galaxies, or enhanced IGM transmission that is not accounted for in current simulations (as these galaxies are situated already in the most transmissive, early reionized regions in our simulations), or a combination of these factors. We thus also predict the expected number of detections for two additional intrinsic Ly EW models. The first is an “extreme” model where these galaxies are given the intrinsic EW distribution for UV-faint galaxies, which typically have higher EW at lower redshifts (this is identical to the “high EW” model by Mason et al., 2018b). The second is an EW distribution for galaxies at , including a number with strong IRAC-excesses, by Endsley et al. (2021) which may be more appropriate for our sample. We find the bright galaxies challenging to explain with any of our models. Only our “extreme” EW model has some probability of all 4 galaxies being detected. We ran an additional simulation in a fully ionized universe and found that, even then, detecting Ly in 4/4 UV-bright galaxies was unlikely given our intrinsic EW models. On the other hand, we find that our fainter sample is consistent within with all three intrinsic EW models, and most consistent with the “high EW” and Endsley et al. (2021) distributions. Such a result suggests that these fainter IRAC-excess galaxies are fully consistent with current constraints on reionization, though their implied ionizing properties may favour enhanced Ly emission compared to galaxies not selected with an IRAC excess (the “normal” model).
From our derived detection rate, measured line strengths, and Ly simulations (which account for both intrinsic galaxy physics and clustering effects), we conclude that the brightest IRAC-excess galaxies likely transmit enhanced levels of Ly due to both (i) very high intrinsic EWs ( Å) and (ii) residing in the most overdense, early reionized regions. Their fainter IRAC-selected counterparts, on the other hand, do not emit such strong Ly, likely due to having less intense ionizing radiation fields, and are consistent with models where they reside in less overdense environments ionized by galaxies. We note that in a case of zero Ly detections in the fainter sample, the contrast between the two samples would only increase and our conclusions reinforced. Should GNWY-7379420231 and GSDY-2209651370 be revealed as low- interlopers, our conclusions would remain unchanged but at lower statistical significance.
5 Are Bright and Fainter IRAC-Excess Galaxies Intrinsically Different? Clues from SED Modelling
Quantifying the gaseous and stellar properties of our sample of fainter galaxies and comparing to those of the UV-bright IRAC-excess galaxies allows us to assess whether the differences in their Ly detection rates (quantified and discussed in Section 4) are attributable to differences in physical properties (i.e., nature). While the fainter objects do not possess the additional and band MOSFIRE spectra used by e.g., Stark et al. (2017) and Mainali et al. (2018), or longer-wavelength NIR X-Shooter data by Laporte et al. (2017a), to constrain the radiation fields of the UV-bright RB16 galaxies through detections (or upper limits) of N V, C IV, He II, and [C III] line emission, it is nevertheless instructive to determine and contrast their properties using the deep photometry available and new spectroscopic redshifts. We thus update the best-fit models for GNWY-7379420231 and GSDY-2209651370 by incorporating their spectroscopic redshifts and re-running Bagpipes as described in Section 2. Additionally, we also run our SED-fitting procedure over the luminous galaxies using the photometry presented in RB16.
We find in all cases the photometry of our faint objects is well fit by the models and reveal underlying properties within expected ranges, with stellar mass values of log M∗/M, star formation rate (SFR) values of log SFR/M, specific SFR values of log sSFR/yr, stellar ages of Myrs, metallicities of , dust obscuration of A, and ionization parameters of log . We calculate absolute UV magnitudes and slopes directly from the best-fit SED - i.e., we adopt a bootstrap method where, for a sample of 1000 SEDs extracted using the posterior distributions of the Bagpipes free parameters, we fit the flux density between (rest-frame) wavelengths of 1300-2100 Å with a simple power law to measure . Simultaneously, we measure assuming the flux density at 1600 Å and distance modulus given by the spectroscopic (or photometric) redshift. Such an approach results in UV slopes of and absolute UV magnitudes of .
Our reported values - shown in Table 2 - are broadly consistent with those determined by Stark et al. (2017, see their Table 3) for EGS-zs8-1, EGS-zs8-2 and COS-zs7-1 (referred to as COSY here), in that they indicate more extreme systems than more representative samples of galaxies (e.g., Strait et al. 2020; Roberts-Borsani et al. 2022), with generally young stellar populations, low dust and metal contents, high ionization parameters, blue UV slopes, and elevated specific SFR values. Interestingly, we also observe some hints of a dichotomy between some properties of the bright and faint IRAC-excess samples. With ranges of log SFR/=[1.05,1.63], , and log , the bright sample displays enhanced SFRs, bluer UV slopes, and larger ionization parameters, indicative of more extreme star-forming systems that are likely to have boosted Ly emission and enhanced ionizing capabilities to carve out early ionized bubbles. Although spectroscopic confirmations are required to validate such interpretations (through emission line diagnostics and continuum measurements), the distinction in photometric properties found here suggests the physics of the two populations may differ and provide some explanation for the differing detection rates of Ly.
Of course, the visibility of Ly also depends on its velocity offset relative to the systemic redshift of the host galaxy, and thus whether it is sufficiently offset to be shifted out of resonance. As shown by several works (e.g., Erb et al. 2014; Stark et al. 2015; Mason et al. 2018a), the observed velocity offset is empirically correlated with galaxy UV luminosity at fixed redshift, implying UV-bright objects display larger Lya offsets compared to their fainter counterparts and thus enhanced Lya detection fractions. While we cannot quantify these parameters directly, we obtain predictions for the two IRAC-excess samples based on the , relation derived by Mason et al. (2018a). Although the scatter in the literature data is large, we find a median velocity offset of km/s for the fainter sample of galaxies, consistent with the lower end of values reported in the literature. Although uncertain, the median value is significantly lower than the 340-545 km/s values (a factor of ) reported for the EGS objects in the luminous sample with Keck and JWST/NIRSpec (Stark et al., 2017; Tang et al., 2023). The low value also contrasts with those reported for other UV-luminous galaxies displaying Ly and additional lines through ground-based or JWST/NIRSpec observations (e.g., Willott et al. 2015; Tang et al. 2023), by similar factors. The contrasting Ly velocity offsets between the two IRAC-excess populations suggests these could be playing a significant role in the transmission of the line through the neutral IGM.
Direct verification of the Ly offsets in the fainter galaxies is required to confirm such a contrast, and observations (spectroscopic and photometric) with JWST (e.g., GO 1747, ERS 1324, ERS 1345, and GO 2279) will confirm these tantalizing clues by providing the rest-frame UV, optical, and IR diagnostics (Roberts-Borsani et al., 2021) required to disentangle intrinsic galaxy physics (nature) from environmental (nurture) effects and determine the primary cause of the early ionized bubbles.
6 Summary & Conclusions
We present deep Keck/MOSFIRE spectroscopy over five sources in the GOODS fields, selected on account of their Spitzer/IRAC excesses, intrinsically fainter ( mag) magnitudes to minimize clustering effects, and photometric redshifts. We tentatively confirm two of our sources with Ly emission at and and, through a comparison of Ly detection rates, detailed simulations of IGMLy opacity, and characterization of galaxy physics with SED-fitting, we offer a comparison in the potential of these faint galaxies and their more UV luminous counterparts to carve out early ionized bubbles in the Epoch of Reionization. Our findings can be summarized as follows:
-
•
We determine the detection rate of Ly in our fainter galaxies to be 0.40, compared to 1.00 for the luminous sample of RB16 selected in identical fashion. The rest-frame EWs of our detections are 16-17 Å, marking some of the weakest Ly detections yet at these redshifts, and we place strong (3) upper limits of 6-9 Å on the rest of our sources using sky line-free regions of the spectrum. In the event that the tentative lines turn out to be spurious, the resulting 0% detection rate in the fainter sample would increase the contrast between the two samples and strengthen the following conclusions.
-
•
We find simulations of Ly detection rates in a mostly neutral medium are able to match the observed fainter sample detection rate with a rest-frame EW0,Lyα distribution characterized by “normal” galaxies selected with or without an IRAC-excess, while we are unlikely to reproduce the detection rate of their luminous counterparts even with the most extreme EW distribution, suggesting boosted Ly emission in the latter sample.
-
•
A comparison of galaxy properties from photoionization models shows the UV-fainter sample is potentially governed by less extreme star formation and reduced ionization parameters compared to their bright counterparts.
In this study we confirm the special nature of luminous, IRAC-excess galaxies by investigating whether their fainter counterparts - who are less subject to clustering and environmental effects - also reside in early ionized bubbles to comparable extent, via the detection of Ly in a predominantly neutral medium. The contrasting detection rates and photometric properties found here suggest the more extreme systems of UV-bright galaxies are able to produce and emit larger amounts of Ly photons and more efficiently carve out large, early ionized bubbles. However, whether the primary cause of this is their enhanced ionizing properties or the collective ionizing output from neighboring galaxies remains an open question. The arrival of JWST and its unprecedented spectroscopic and photometric capabilities will provide the required measurements of emission line diagnostics (e.g., rest-frame UV lines such as Ly, [C III], He II, and C IV, as well as rest-frame optical lines such as [O III] 5007 Å and H) as well as confirmations of clustered environments. In addition, the expected confirmation of both existing and new samples from the telescope will add statistical robustness to the interpretations presented here, and settle the extent to which luminous IRAC-excess objects drive an early reionization.
References
- Barone-Nugent et al. (2014) Barone-Nugent, R. L., Trenti, M., Wyithe, J. S. B., et al. 2014, ApJ, 793, 17, doi: 10.1088/0004-637X/793/1/17
- Bolan et al. (2021) Bolan, P., Lemaux, B. C., Mason, C., et al. 2021, arXiv e-prints, arXiv:2111.14912. https://arxiv.org/abs/2111.14912
- Bouwens et al. (2015) Bouwens, R. J., Illingworth, G. D., Oesch, P. A., et al. 2015, ApJ, 803, 34, doi: 10.1088/0004-637X/803/1/34
- Carnall et al. (2018) Carnall, A. C., McLure, R. J., Dunlop, J. S., & Davé, R. 2018, MNRAS, 480, 4379, doi: 10.1093/mnras/sty2169
- De Barros et al. (2017) De Barros, S., Pentericci, L., Vanzella, E., et al. 2017, A&A, 608, A123, doi: 10.1051/0004-6361/201731476
- Endsley et al. (2021) Endsley, R., Stark, D. P., Charlot, S., et al. 2021, MNRAS, 502, 6044, doi: 10.1093/mnras/stab432
- Erb et al. (2014) Erb, D. K., Steidel, C. C., Trainor, R. F., et al. 2014, ApJ, 795, 33, doi: 10.1088/0004-637X/795/1/33
- Finkelstein et al. (2015) Finkelstein, S. L., Ryan, Russell E., J., Papovich, C., et al. 2015, ApJ, 810, 71, doi: 10.1088/0004-637X/810/1/71
- Fontana et al. (2010) Fontana, A., Vanzella, E., Pentericci, L., et al. 2010, ApJ, 725, L205, doi: 10.1088/2041-8205/725/2/L205
- Fuller et al. (2020) Fuller, S., Lemaux, B. C., Bradač, M., et al. 2020, ApJ, 896, 156, doi: 10.3847/1538-4357/ab959f
- Gehrels (1986) Gehrels, N. 1986, ApJ, 303, 336, doi: 10.1086/164079
- Harikane et al. (2022) Harikane, Y., Ono, Y., Ouchi, M., et al. 2022, ApJS, 259, 20, doi: 10.3847/1538-4365/ac3dfc
- Hashimoto et al. (2018) Hashimoto, T., Laporte, N., Mawatari, K., et al. 2018, Nature, 557, 392, doi: 10.1038/s41586-018-0117-z
- Hoag et al. (2019) Hoag, A., Bradač, M., Huang, K., et al. 2019, ApJ, 878, 12, doi: 10.3847/1538-4357/ab1de7
- Laporte et al. (2021) Laporte, N., Meyer, R. A., Ellis, R. S., et al. 2021, MNRAS, 505, 3336, doi: 10.1093/mnras/stab1239
- Laporte et al. (2017a) Laporte, N., Nakajima, K., Ellis, R. S., et al. 2017a, ApJ, 851, 40, doi: 10.3847/1538-4357/aa96a8
- Laporte et al. (2017b) Laporte, N., Ellis, R. S., Boone, F., et al. 2017b, ApJ, 837, L21, doi: 10.3847/2041-8213/aa62aa
- Larson et al. (2022) Larson, R. L., Finkelstein, S. L., Hutchison, T. A., et al. 2022, ApJ, 930, 104, doi: 10.3847/1538-4357/ac5dbd
- Leonova et al. (2021) Leonova, E., Oesch, P. A., Qin, Y., et al. 2021, arXiv e-prints, arXiv:2112.07675. https://arxiv.org/abs/2112.07675
- Mainali et al. (2018) Mainali, R., Zitrin, A., Stark, D. P., et al. 2018, MNRAS, 479, 1180, doi: 10.1093/mnras/sty1640
- Mason et al. (2019a) Mason, C. A., Naidu, R. P., Tacchella, S., & Leja, J. 2019a, MNRAS, 489, 2669, doi: 10.1093/mnras/stz2291
- Mason et al. (2015) Mason, C. A., Trenti, M., & Treu, T. 2015, ApJ, 813, 21, doi: 10.1088/0004-637X/813/1/21
- Mason et al. (2018a) Mason, C. A., Treu, T., Dijkstra, M., et al. 2018a, ApJ, 856, 2, doi: 10.3847/1538-4357/aab0a7
- Mason et al. (2018b) Mason, C. A., Treu, T., de Barros, S., et al. 2018b, ApJ, 857, L11, doi: 10.3847/2041-8213/aabbab
- Mason et al. (2019b) Mason, C. A., Fontana, A., Treu, T., et al. 2019b, MNRAS, 485, 3947, doi: 10.1093/mnras/stz632
- McGreer et al. (2015) McGreer, I. D., Mesinger, A., & D’Odorico, V. 2015, MNRAS, 447, 499, doi: 10.1093/mnras/stu2449
- McLean et al. (2012) McLean, I. S., Steidel, C. C., Epps, H. W., et al. 2012, in Society of Photo-Optical Instrumentation Engineers (SPIE) Conference Series, Vol. 8446, Ground-based and Airborne Instrumentation for Astronomy IV, ed. I. S. McLean, S. K. Ramsay, & H. Takami, 84460J, doi: 10.1117/12.924794
- McLeod et al. (2016) McLeod, D. J., McLure, R. J., & Dunlop, J. S. 2016, MNRAS, 459, 3812, doi: 10.1093/mnras/stw904
- Mesinger et al. (2016) Mesinger, A., Greig, B., & Sobacchi, E. 2016, MNRAS, 459, 2342, doi: 10.1093/mnras/stw831
- Naidu et al. (2020) Naidu, R. P., Tacchella, S., Mason, C. A., et al. 2020, ApJ, 892, 109, doi: 10.3847/1538-4357/ab7cc9
- Oesch et al. (2018) Oesch, P. A., Bouwens, R. J., Illingworth, G. D., Labbé, I., & Stefanon, M. 2018, ApJ, 855, 105, doi: 10.3847/1538-4357/aab03f
- Oesch et al. (2014) Oesch, P. A., Bouwens, R. J., Illingworth, G. D., et al. 2014, ApJ, 786, 108, doi: 10.1088/0004-637X/786/2/108
- Oesch et al. (2015) Oesch, P. A., van Dokkum, P. G., Illingworth, G. D., et al. 2015, ApJ, 804, L30, doi: 10.1088/2041-8205/804/2/L30
- Oke & Gunn (1983) Oke, J. B., & Gunn, J. E. 1983, ApJ, 266, 713, doi: 10.1086/160817
- Pentericci et al. (2011) Pentericci, L., Fontana, A., Vanzella, E., et al. 2011, ApJ, 743, 132, doi: 10.1088/0004-637X/743/2/132
- Planck Collaboration et al. (2020) Planck Collaboration, Aghanim, N., Akrami, Y., et al. 2020, A&A, 641, A6, doi: 10.1051/0004-6361/201833910
- Prochaska et al. (2020) Prochaska, J. X., Hennawi, J. F., Westfall, K. B., et al. 2020, Journal of Open Source Software, 5, 2308, doi: 10.21105/joss.02308
- Prochaska et al. (2020) Prochaska, J. X., Hennawi, J., Cooke, R., et al. 2020, pypeit/PypeIt: Release 1.0.0, v1.0.0, Zenodo, doi: 10.5281/zenodo.3743493
- Qin et al. (2021) Qin, Y., Mesinger, A., Bosman, S. E. I., & Viel, M. 2021, MNRAS, 506, 2390, doi: 10.1093/mnras/stab1833
- Qin et al. (2022) Qin, Y., Wyithe, J. S. B., Oesch, P. A., et al. 2022, MNRAS, 510, 3858, doi: 10.1093/mnras/stab3733
- Qiu et al. (2018) Qiu, Y., Wyithe, J. S. B., Oesch, P. A., et al. 2018, MNRAS, 481, 4885, doi: 10.1093/mnras/sty2633
- Roberts-Borsani et al. (2022) Roberts-Borsani, G., Morishita, T., Treu, T., Leethochawalit, N., & Trenti, M. 2022, ApJ, 927, 236, doi: 10.3847/1538-4357/ac4803
- Roberts-Borsani et al. (2021) Roberts-Borsani, G., Treu, T., Mason, C., et al. 2021, ApJ, 910, 86, doi: 10.3847/1538-4357/abe45b
- Roberts-Borsani et al. (2020) Roberts-Borsani, G. W., Ellis, R. S., & Laporte, N. 2020, MNRAS, 497, 3440, doi: 10.1093/mnras/staa2085
- Roberts-Borsani et al. (2016) Roberts-Borsani, G. W., Bouwens, R. J., Oesch, P. A., et al. 2016, ApJ, 823, 143, doi: 10.3847/0004-637X/823/2/143
- Robertson (2021) Robertson, B. E. 2021, arXiv e-prints, arXiv:2110.13160. https://arxiv.org/abs/2110.13160
- Robertson et al. (2015) Robertson, B. E., Ellis, R. S., Furlanetto, S. R., & Dunlop, J. S. 2015, ApJ, 802, L19, doi: 10.1088/2041-8205/802/2/L19
- Schenker et al. (2014) Schenker, M. A., Ellis, R. S., Konidaris, N. P., & Stark, D. P. 2014, ApJ, 795, 20, doi: 10.1088/0004-637X/795/1/20
- Song et al. (2016) Song, M., Finkelstein, S. L., Livermore, R. C., et al. 2016, ApJ, 826, 113, doi: 10.3847/0004-637X/826/2/113
- Stark et al. (2015) Stark, D. P., Richard, J., Charlot, S., et al. 2015, MNRAS, 450, 1846, doi: 10.1093/mnras/stv688
- Stark et al. (2017) Stark, D. P., Ellis, R. S., Charlot, S., et al. 2017, MNRAS, 464, 469, doi: 10.1093/mnras/stw2233
- Strait et al. (2020) Strait, V., Bradač, M., Coe, D., et al. 2020, ApJ, 888, 124, doi: 10.3847/1538-4357/ab5daf
- Tang et al. (2023) Tang, M., Stark, D. P., Chen, Z., et al. 2023, arXiv e-prints, arXiv:2301.07072, doi: 10.48550/arXiv.2301.07072
- Tilvi et al. (2020) Tilvi, V., Malhotra, S., Rhoads, J. E., et al. 2020, ApJ, 891, L10, doi: 10.3847/2041-8213/ab75ec
- Treu et al. (2013) Treu, T., Schmidt, K. B., Trenti, M., Bradley, L. D., & Stiavelli, M. 2013, ApJ, 775, L29, doi: 10.1088/2041-8205/775/1/L29
- Verhamme et al. (2015) Verhamme, A., Orlitová, I., Schaerer, D., & Hayes, M. 2015, A&A, 578, A7, doi: 10.1051/0004-6361/201423978
- Willott et al. (2015) Willott, C. J., Carilli, C. L., Wagg, J., & Wang, R. 2015, ApJ, 807, 180, doi: 10.1088/0004-637X/807/2/180
- Zitrin et al. (2015) Zitrin, A., Labbé, I., Belli, S., et al. 2015, ApJ, 810, L12, doi: 10.1088/2041-8205/810/1/L12
| ID | RA | DEC | [3.6]-[4.5] | f(Ly) | FWHM | EW0,Lyα | Mask ID | iTime | |||
| [J2000] | [J2000] | [AB] | [AB] | [ erg s-1 cm-2] | [Å] | [Å] | [s] | ||||
| GSWY-2249353259 | 03:32:24.93 | -27:53:26.04 | 25.850.13 | 0.570.25 | 8.150.35 | — | 0.18(3) | — | 6(3) | Mask1 | 22546 |
| GSDY-2209651370 | 03:32:20.96 | -27:51:37.06 | 26.140.12 | 1.050.28 | 7.880.22 | 7.962 | 2.390.83 | 123 | 176 | Mask1 | 22546 |
| GNDY-7048017191 | 12:37:04.81 | +62:17:18.98 | 26.160.07 | 1.100.20 | 7.810.19 | — | 0.15(3) | — | 6(3) | Mask2 | 42587 |
| GNWY-7379420231 | 12:37:37.94 | +62:20:22.82 | 26.500.19 | 0.460.44 | 8.200.45 | 7.108 | 1.500.71 | 31 | 168 | Mask2 | 42587 |
| GNWZ-7455218088 | 12:37:45.52 | +62:18:08.87 | 26.440.21 | 0.700.28 | 7.300.28 | — | 0.24(3) | — | 9(3) | Mask2 | 42587 |
| EGSY8p7[1] | 14:20:08.50 | +52:53:26.60 | 25.260.09 | 0.760.14 | — | 8.683 | 17.07.5 | 118 | 2813 | — | — |
| EGS-zs8-1[2] | 14:20:34.89 | +53:00:15.35 | 25.030.05 | 0.530.09 | — | 7.730 | 17.03.0 | 133 | 214 | — | — |
| EGS-zs8-2[3] | 14:20:12.09 | +53:00:26.97 | 25.120.05 | 0.970.18 | — | 7.477 | 7.41.0 | — | 91 | — | — |
| COSY[3] | 10:00:23.76 | +02:20:37.00 | 25.060.06 | 1.030.15 | — | 7.154 | 25.04.0 | — | 284 | — | — |
| ID | log sSFR | Stellar Age | Av | log | |||
|---|---|---|---|---|---|---|---|
| [mag] | [yr-1] | [Myrs] | [mag] | [] | |||
| GSWY-2249353259 | -21.220.08 | -1.820.15 | -7.930.02 | 62.1926.36 | 0.720.14 | 0.260.14 | -1.870.60 |
| GSDY-2209651370 | -20.990.07 | -2.350.14 | -7.960.03 | 25.5027.29 | 0.280.12 | 0.280.11 | -1.630.41 |
| GNDY-7048017191 | -20.770.05 | -1.650.12 | -8.000.01 | 3.733.48 | 0.940.06 | 0.240.09 | -1.840.40 |
| GNWY-7379420231 | -20.270.15 | -1.880.18 | -7.940.02 | 53.1127.40 | 0.680.16 | 0.260.14 | -2.380.81 |
| GNWZ-7455218088 | -20.570.15 | -1.930.21 | -7.940.02 | 43.5526.92 | 0.640.16 | 0.270.12 | -1.980.63 |
| EGSY8p7 | -21.990.06 | -1.890.10 | -7.940.02 | 46.0527.28 | 0.720.10 | 0.260.11 | -1.610.37 |
| EGS-zs8-1 | -22.140.04 | -1.980.09 | -7.930.01 | 67.0521.22 | 0.590.10 | 0.300.13 | -1.790.46 |
| EGS-zs8-2 | -22.050.04 | -2.200.17 | -7.980.02 | 12.0420.78 | 0.470.14 | 0.270.10 | -1.590.35 |
| COSY | -21.740.04 | -1.940.11 | -8.000.00 | 3.002.48 | 0.740.09 | 0.280.09 | -1.580.38 |