IllustrisTNG Snapshots for 10 Gyr of Dynamical Evolution of Brightest Cluster Galaxies and Their Host Clusters
Abstract
We explore the redshift evolution of the dynamical properties of massive clusters and their brightest cluster galaxies (BCGs) at based on the IllustrisTNG-300 simulation. We select 270 massive clusters with at and trace their progenitors based on merger trees. From 67 redshift snapshots covering , we compute the 3D subhalo velocity dispersion as a cluster velocity dispersion (). We also calculate the 3D stellar velocity dispersion of the BCGs (). Both and increase as universe ages. The BCG velocity dispersion grows more slowly than the cluster velocity dispersion. Furthermore, the redshift evolution of the BCG velocity dispersion shows dramatic changes at some redshifts resulting from dynamical interaction with neighboring galaxies (major mergers). We show that is comparable with at , offering an interesting observational test. The simulated redshift evolution of and generally agrees with an observed cluster sample for , but with large scatter. Future large spectroscopic surveys reaching to high redshift will test the implications of the simulations for the mass evolution of both clusters and their BCGs.
1 INTRODUCTION
Brightest cluster galaxies (BCGs) are the most luminous galaxies in the universe usually found near the center of galaxy clusters. BCGs have several additional distinctive features including large sizes and large velocity dispersions even compared to similarly massive galaxies that are not resident in rich clusters (Von Der Linden et al., 2007; Bernardi, 2009). The BCG formation process could thus have features that are distinctive from other galaxies.
The special location of BCGs suggests that BCG evolution is tightly connected with cluster evolution. In the hierarchical structure formation model, galaxy clusters grow through stochastic accretion of less massive systems (e.g., van den Bosch, 2002; McBride et al., 2009; Zhao et al., 2009; Fakhouri et al., 2010; Kravtsov & Borgani, 2012; De Boni et al., 2016; Pizzardo et al., 2021, 2022). BCGs grow along with their host clusters. BCGs grow through active accretion of other, generally less massive, cluster members and intracluster material. Baryonic physics also plays an important role in BCG evolution. Thus, the study of the co-evolution of clusters and BCGs offers tests of both structure and galaxy formation models.
Many observational studies investigate the co-evolution of clusters and their BCGs (e.g., Lin & Mohr, 2004; Oliva-Altamirano et al., 2014; Lin et al., 2017; Loubser et al., 2018; Kravtsov et al., 2018; Wen & Han, 2018; Erfanianfar et al., 2019; DeMaio et al., 2020; Jung et al., 2022). In particular, a large number of cluster samples provide the stellar mass to halo mass relation (e.g., Moster et al., 2010; Kravtsov et al., 2018; Erfanianfar et al., 2019). The observed mass ratio between clusters and their BCGs decreases as a function of cluster mass for cluster masses (e.g., (Erfanianfar et al., 2019; Girelli et al., 2020)). The stellar mass to halo mass relation suggests that BCG mass growth is suppressed in more massive cluster halos presumably by strong feedback processes including active galactic nuclei (AGN). This observed stellar mass to halo mass relation agrees well with the theoretical prediction (e.g., Ragone-Figueroa et al., 2018; Behroozi et al., 2019).
Sohn et al. (2020) and Sohn et al. (2021) explore the co-evolution of clusters and their BCGs based on the cluster velocity dispersion () and the stellar velocity dispersion of the BCGs () (see also Lauer et al., 2014; Kim et al., 2017; Loubser et al., 2018). The dynamical scaling relations provide independent tools for studying the co-evolution of clusters and BCGs. Furthermore, the velocity dispersions are insensitive to systematic biases that may affect the photometric measurements (i.e., luminosity and stellar mass). The observed ratio decreases as a function of , consistent with the stellar mass to halo mass relation.
The observed velocity dispersion scaling relation is generally consistent with the theoretical predictions derived from numerical simulations. Marini et al. (2021) showed that the relation derived from the DIANOGA simulations agrees with the observed relation (see also Dolag et al., 2010; Remus et al., 2017). Sohn et al. (2022) use the IllustrisTNG-300 simulation that includes 280 massive cluster halos () to derive the relation. Again the relations from observations and simulations are generally consistent even when more simulated clusters with low are included.
Cosmological numerical simulations enable identification of clusters and BCGs with their progenitors (e.g., Vogelsberger et al., 2014a, 2020; Nelson et al., 2019). Ragone-Figueroa et al. (2018) investigate the stellar mass assembly of BCGs at . Marini et al. (2021) explore the evolution of the dynamical scaling relation by tracing the progenitors of clusters and BCGs at . Sohn et al. (2022) also derive the dynamical scaling relation between clusters and their BCGs at . They identify the most massive halos with in each redshift snapshot and investigate the dynamical properties of clusters and BCGs. This approach yields a direct comparison sample for high redshift observations.
Here we use IllustrisTNG-300 simulations to explore the redshift evolution of dynamical properties of massive clusters and their BCGs by tracing the progenitors of massive cluster halos () at directly. Based on this approach, we explore the evolution of dynamical properties of clusters and BCGs at . We also investigate the redshift evolution of dynamical scaling relations. The dynamical properties and the dynamical scaling relations we derive from the simulations promise interesting tests for future large spectroscopic surveys covering the full redshift range . These tests are subtle because of the observational challenge of connecting progenitors and descendants.
We describe the cluster samples we derive from IllustrisTNG simulations in Section 2. We derive the physical properties of clusters and BCGs. We explore the redshift evolution of scaling relations and trace the redshift evolution of individual systems in Section 3. We discuss the implications of the dynamical scaling relations along with basic approaches to observational tests based on the prediction from the simulations in Section 4. We conclude in Section 5. We use the Planck cosmological parameters (Planck Collaboration et al., 2016) with , , and = 0.6911 throughout the paper.
2 Clusters and BCGs from IllustrisTNG
We explore the nature and evolution of scaling relations between the mass and velocity dispersion of clusters and their most massive subhalo (BCG) based on large hydrodynamic simulations. We use the IllustrisTNG simulations that provide a large set of clusters covering the redshift range . We describe the IllustrisTNG simulation in Section 2.1. We derive the mass and the velocity dispersion of the sample clusters in Section 2.2 and those of their brightest cluster galaxies in Section 2.3.
2.1 The IllustrisTNG Simulation
IllustrisTNG is a suite of state-of-art magnetohydrodynamic (MHD) simulations of galaxy formation and evolution (Pillepich et al., 2018; Springel et al., 2018; Nelson et al., 2018; Naiman et al., 2018; Marinacci et al., 2018; Nelson et al., 2019) that succeeds Illustris simulations (Vogelsberger et al., 2013, 2014b). The large scale of IllustrisTNG allows investigation of galaxy and galaxy system formation in a cosmological context. Here we explore the evolution of massive galaxies (BCGs) in rare massive systems (i.e., galaxy clusters). We complement and extend studies by Sohn et al. (2022) based on IllustrisTNG and by Marini et al. (2021) based on other simulations.
IllustrisTNG 300-1 covers Mpc3 comoving cube. TNG300-1 (hereafter TNG300) has the highest resolution among simulations covering this box size: the dark matter particle mass and the target gas cell mass . The minimum gravitational softening length is 1.48 kpc.
To identify clusters of galaxies, we use the group catalog provided by the TNG project. The TNG collaboration constructs the group catalog based on a friends-of-friends algorithm applied to all types of particles (including dark matter, stars, gas, and black holes) with a proportional linking length . Group catalogs are available for each redshift snapshot. Thus it is possible to explore cluster redshift evolution.
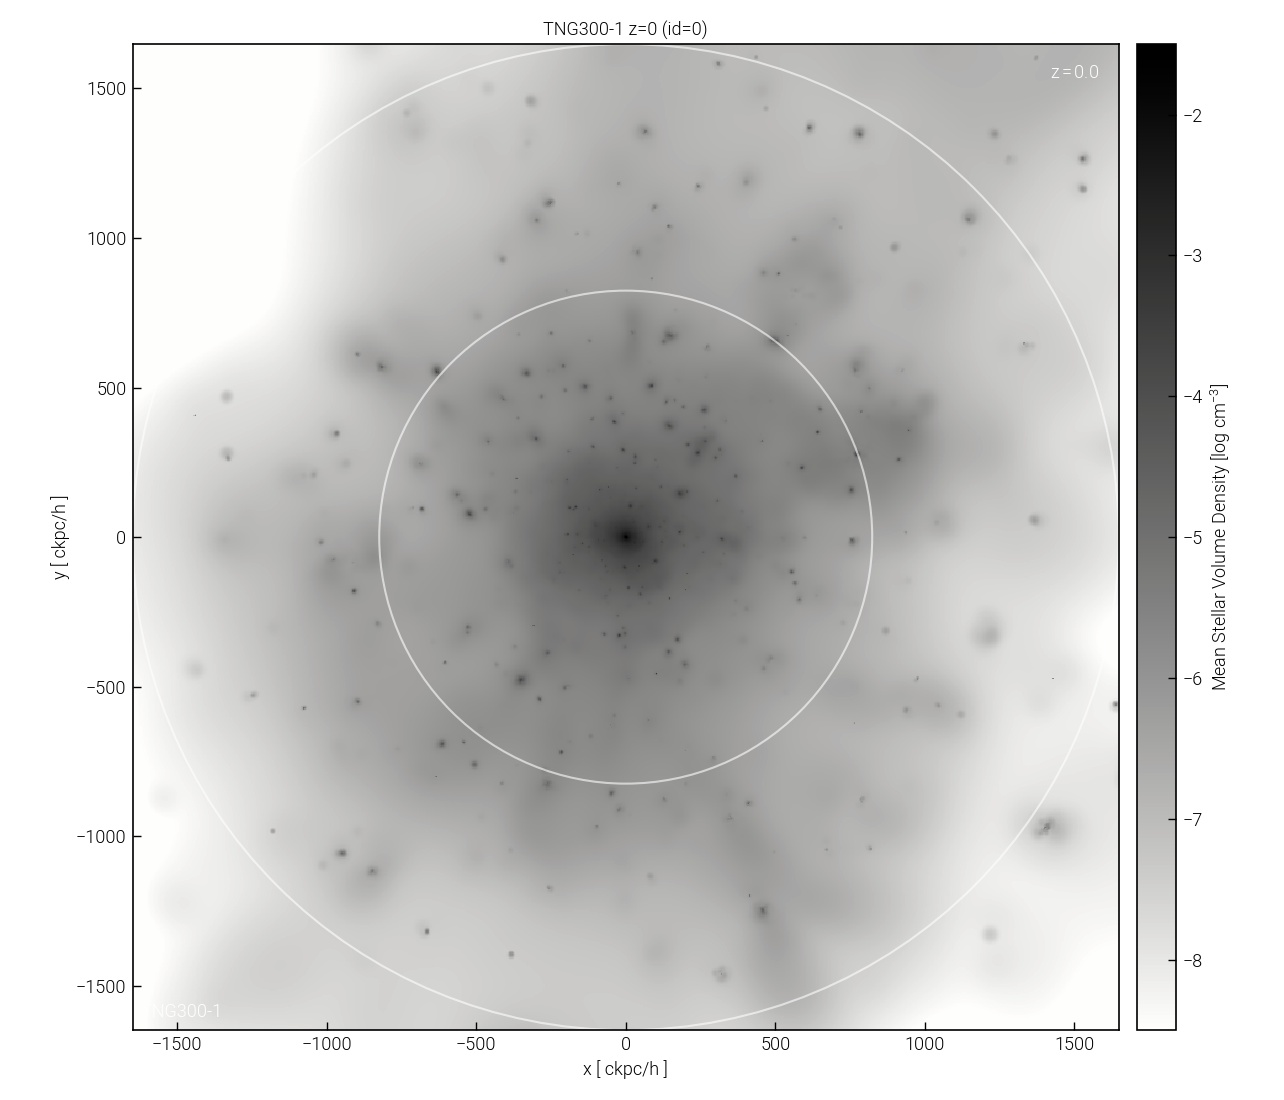
We select the 280 most massive halos with (hereafter clusters) from the snapshot in TNG300. Here, is the characteristic mass enclosed within , where the mass density is 200 times of the mean density of the universe at a given redshift (in this case, ). Figure 1 shows the mean stellar particle density distribution around the most massive cluster halo at . We also select the most massive subhalo within each of these these halos as the Brightest Cluster Galaxy (BCG).
Next we use the merger trees for identifying the progenitors of both the clusters and their BCGs. The SubLink algorithm (Rodriguez-Gomez et al., 2015) provides the merger trees. Based on these merger trees, we identify the progenitors of each BCG at in the relevant higher redshift snapshots with . We note that we only trace the main progenitor branch (by applying “onlyMPB = True”).
Sometimes a BCG () at lower redshift has a progenitor that is not the most massive subhalo within its higher redshift parent cluster. BCGs can exchange mass during interactions with surrounding subhalos. We include these lower mass BCG progenitors in our analysis.
There are 10 BCGs without a clear progenitor at higher redshift. Among these, 8 BCGs lack an obvious progenitor in a single redshift snapshot; an additional two BCGs lack obvious progenitors in multiple snapshots at and presumably formed at a very recent epoch. We exclude all of these 10 BCGs and their host clusters from our analysis. Our final simulated cluster sample then includes 270 systems.
Our approach here complements the approach to the study of clusters and their BCGs in IllustrisTNG by Sohn et al. (2022). Sohn et al. identify all massive clusters with within each redshift snapshot and investigate the statistical evolution of the relationship between the velocity dispersions of the clusters and their BCGs. This approach mimics standard observational approaches. Sohn et al. (2022) do not identify individual clusters/BCGs with their specific progenitors as we do here. Here, by contrast, we study the evolution of individual clusters and their BCGs by tracking their progenitors back in time. Our approach here highlights evolutionary effects that are not directly observable. However the understanding gained is an important ingredient for motivating and interpreting future observations.
2.2 Physical Properties of Clusters
We obtain the characteristic size and mass (i.e., and ) of 270 massive cluster halos from the TNG dataset. The cluster mass is the sum of the masses of all of the simulated components: stellar/gas particles, dark matter, and black holes.
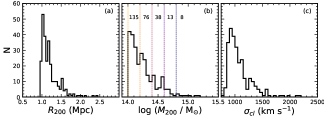
Figure 2 (a) shows the distribution of 270 massive cluster halos at . The median for simulated clusters with is Mpc. Figure 2 (b) displays the distribution of the simulated clusters. We trace cluster evolution in five bins indicated by vertical lines in Figure 2 (b). Table 1 lists the mass ranges and the number of clusters in each mass subsample.
| Mass subsample | Mass range | Nhalo |
|---|---|---|
| [] | ||
| msub0 | 8 | |
| msub1 | 13 | |
| msub2 | 38 | |
| msub3 | 76 | |
| msub4 | 135 |
Figure 2 (c) shows the velocity dispersion distribution of the clusters. We compute the velocity dispersion of member subhalos as a cluster velocity dispersion following Sohn et al. (2022). We select the member subhalos within , where is the distance from the cluster center111. are the distances between the subhalo and the cluster center along the x-, y-, and z-axes.. We then compute the cluster velocity dispersion (hereafter ) by summing the velocity dispersions along the axes in quadrature: . We use the bi-weight technique (Beers et al., 1990) to compute the components of the velocity dispersion.
The cluster velocity dispersion we derive here differs from that measured in Sohn et al. (2022). In Sohn et al. (2022), the cluster velocity dispersion mimics the observed velocity dispersion by computing the line-of-sight velocity dispersion of the subhalos within a cylindrical volume that penetrates the cluster core. In contrast, we compute the 3D velocity dispersion of the subhalos within a spherical volume to elucidate the physical relationship between the cluster and BCG properties in each redshift view.
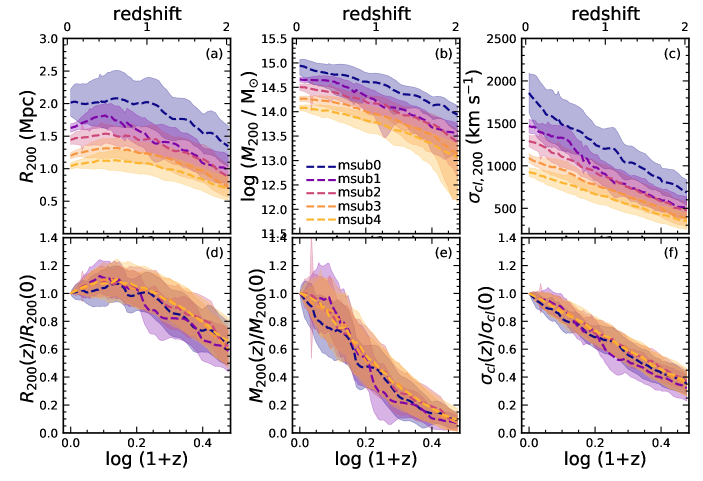
Figure 3 shows the evolution of (a) , (b) , and (c) as a function of redshift for . The dashed lines show the median evolutionary trend. The shaded region shows the distribution around the median trend. We indicate the evolution of clusters in five mass subsamples (Table 1) with different colors. In general, cluster size, mass, and velocity dispersion increase as universe ages. However, their evolution, particularly the size evolution, fluctuates because cluster halos experience mergers and other dynamical interactions with neighboring halos. During these interactions, components of interacting halos mix thus producing departures from the median relations. Figure 3 panels (d), (e), and (f) display the evolution of , , and normalized to the relations at , respectively. The evolutionary trends in the five mass subsamples are similar.
2.3 Physical Properties of Brightest Cluster Galaxies
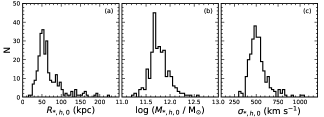
Next we derive the physical properties of the BCG subhalos, including their sizes, stellar masses, and the velocity dispersions. Figure 4 (a) and (b) display distributions of the half mass radius () and the stellar mass within the half mass radius () of the BCGs at . We obtain the half mass radius and the stellar mass of the BCGs within the half mass radius from the TNG database (i.e., SubhaloMassInHalfRadType[4]). The stellar mass is the sum of the masses of the stellar particles within the half mass radius of the subhalo.
We compute the velocity dispersion among the stellar particles of each BCG subhalo. We select the stellar particles within a spherical volume with the half mass radius (). As for the cluster velocity dispersion, we compute the 3D velocity dispersion of the BCG stellar particles based on the quadratic sum of the velocity dispersions within the half mass radius along the three principle axes. Hereafter, we refer to this stellar velocity dispersion as .
The we derive here differs from the BCG velocity dispersion in Sohn et al. (2022). Sohn et al. measure the line-of-sight velocity dispersion of the BCG stellar particles within a cylindrical volume with a 3 kpc physical aperture that penetrates the BCG center. The here is measured within a larger aperture and in a 3D spherical volume. This has greater fidelity for demonstrating the simulated physical relationship between the cluster and BCG properties at different redshifts.
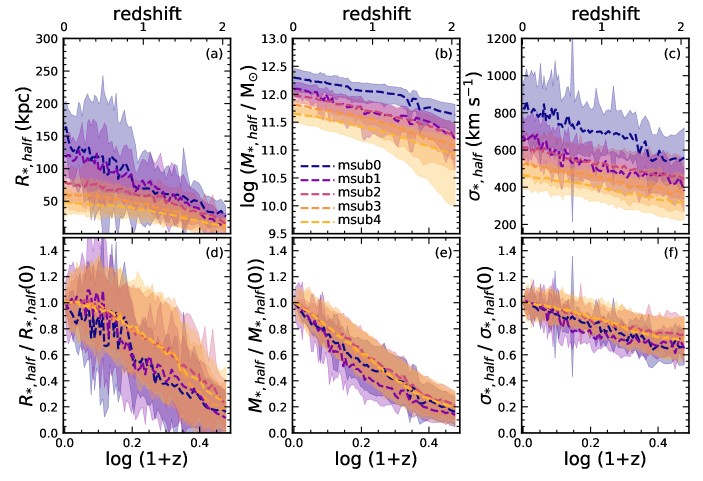
We trace the redshift evolution of BCG properties for clusters in the five cluster mass subsamples in Table 1 (Figure 5). The sizes of the BCGs generally increase as the universe ages, but the size evolution fluctuates significantly. These fluctuations result from dynamical interactions between the BCGs and surrounding subhalos. During these interactions, stellar particles of the BCG subhalos can be distributed to larger radii thus inflating the size.
Both the stellar mass and stellar velocity dispersion of BCGs increase as the universe ages. The redshift evolution of these properties also oscillates as a result of interactions between BCGs and surrounding subhalos.
Nonetheless Figure 5 shows that the BCG stellar mass and velocity dispersion growth rates are insensitive to the halo mass of the host cluster. The upper panels of Figure 5 show the evolution; the lower panels show the evolution scaled to zero redshift and demonstrate the insensitivity to the cluster halo mass. Both the mass and velocity dispersion growth of the BCGs are slower than the growth of the parent cluster halos.
3 RESULTS
We derive the physical properties of clusters and their BCGs from multiple redshift snapshots in IllustrisTNG-300. To highlight the relationship between the BCGs and their host clusters, we explore the redshift evolution of various dynamical scaling relations between clusters and their BCGs (Section 3.1). We also trace the evolution of individual clusters and BCGs in Section 3.2.
3.1 Redshift Evolution of Dynamical Scaling Relations
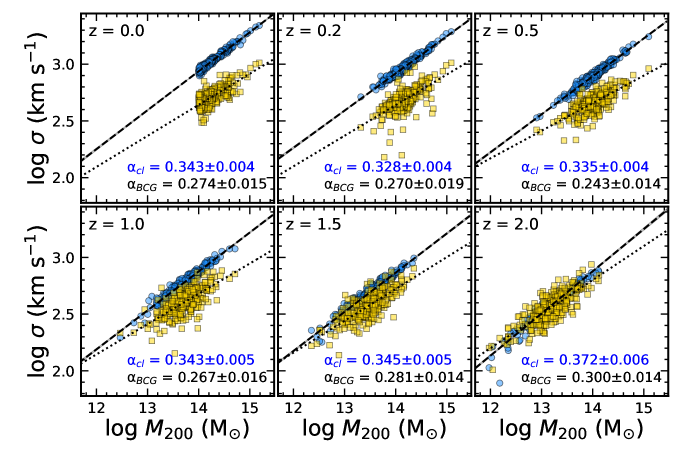
We first investigate the redshift evolution of the relation (Figure 6) based on five redshift snapshots (i.e., ). In Figure 6, blue circles show and yellow squares show as a function of . We derive the best-fit relation based on the MCMC approach; dashed and dotted lines indicate the best-fit relations. The numbers in each panel indicate the slope of the relation: .
The relation is generally steeper than the relation at . The slope of the relation is , consistent with previous studies (Marini et al., 2021; Sohn et al., 2022). The normalization of the relation is slightly higher than that in Sohn et al. (2022) because they use the line-of-sight cluster velocity dispersion (instead of the 3D ) for direct comparison with the observations. In contrast, the relation is significantly shallower than the relation; the typical slope at is . Because we also use the 3D rather than line-of-sight BCG stellar velocity dispersion, the normalization of the relation is higher than in Sohn et al. (2022).
Sohn et al. (2022) investigated the relation based on the observed cluster sample, HeCS-omnibus. They also showed that the relation is significantly shallower than the relation at . Furthermore, the typical slopes of the observed relations are consistent with the relations we derived from the simulations.
It is interesting that the difference between and is smaller at higher redshift. In fact, the and relations overlap at . Thus increases significantly faster as the universe ages than does.
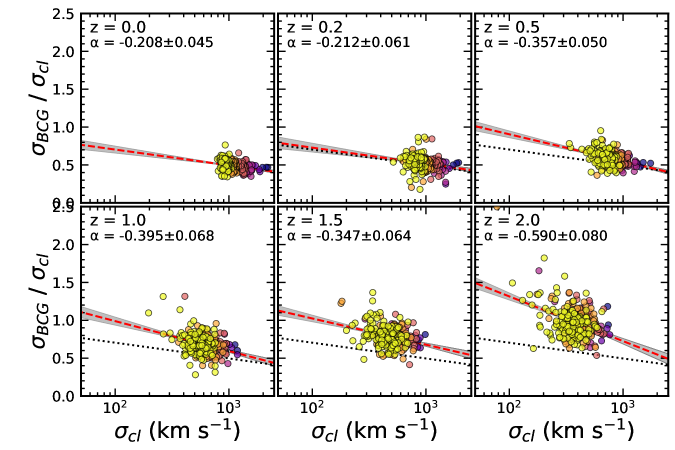
Figure 7 shows the relation of simulated clusters from six redshift snapshots. In general, the ratio decreases as a function of . The relation becomes significantly steeper at higher redshift. In other words, the is comparable with at high redshift.
The sample completeness is an important issue when we trace the evolution of galaxy systems over a wide redshift range. In Sohn et al. (2022), we select a mass complete sample at different redshifts to study the evolution of scaling relations between and . In contrast, our focus here is tracing the evolution of the progenitors of clusters in the mass complete sample at . At high redshifts, the progenitors of the currently most massive systems may not constitute a mass-complete because of fluctuations in the mass evolution but they still trace the scaling relation defined by the mass complete sample of Sohn et al. (2022).
3.2 Tracing the Evolution of Simulated Clusters
We next investigate the evolution of and for individual clusters and their BCGs at . This approach traces the evolution of clusters and the BCGs as a function of time. We trace the dependence of cluster and BCG evolution on the cluster halo mass.
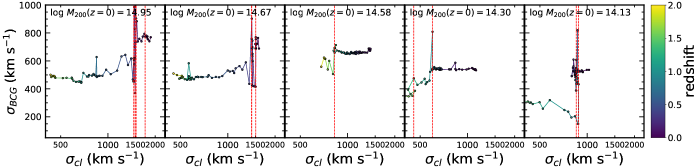
Figure 8 shows the evolution of the relation for five simulated clusters randomly selected from each of the five mass subsamples (Table 1). The systems generally move from left to right as increases for . The of individual systems generally slowly increases as the universe ages.
The relations show a few spikes during the evolution. Abrupt changes in cause these spikes. The BCG velocity dispersion, , increases dramatically just after interactions with a neighboring galaxy; subsequently the dispersion settles down. Vertical lines in Figure 8 mark the redshift epoch when these major mergers occur. Here, we define a major merger as a dynamical interaction where the mass ratio between the BCG subhalo and the merging subhalo is less than 5:1.
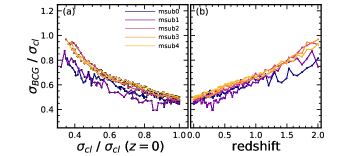
Figure 9 (a) displays the median as a function of for the clusters in the five mass subsamples. We derive these parameters to investigate the redshift evolution of the relation. We also normalize the x-axis in Figure 9 (a) by the median of the clusters at . Figure 9 is thus a direct comparison of the evolution of scaling relations derived from each of the mass subsamples.
Interestingly, the trends of the evolution are remarkably similar for the five mass subsamples. The relations derived agree within the standard deviation (we omit the range from the Figure for the clarity). The slope of the relations steepens at . This change in slope coincides with the trends in the redshift evolution of and . Figure 3 shows that increases steadily for . In contrast, the increase in slows at ; not evolve significantly at .
Figure 9 (b) shows the median as a function of redshift. In all subsamples, decreases continuously at . Furthermore, the slopes of all of the relations are remarkably consistent. This consistency indicates that the increase and is insensitive to cluster halo mass for .
4 Discussion
Based on 67 IllustrisTNG-300 snapshots covering , we derive physical properties of the clusters and their BCGs and investigate the redshift evolution of various dynamical scaling relations.
We first discuss the impact of aperture effects on the BCG velocity dispersion (Section 4.1). We then compare the dynamical scaling relations we derive with scaling relations based on cluster mass and BCG stellar mass in Section 4.2. Finally, we discuss tests of the simulated results with current and future spectroscopic surveys (Section 4.3).
4.1 Aperture Effect and
In previous sections we used the BCG stellar velocity dispersion, , within . This velocity dispersion is tightly correlated with the stellar mass within throughout the redshift range we explore. Thus, is a mass proxy that complements the stellar mass. Used together the two proxies can be a foundation for limiting systematic error in BCG mass determination.
Observations of are, however, not completely straightforward. Observational determination of the half-mass radius is challenging. Measurement of the half-light radius may be affected by superposition of other objects and by failure to account for the extended BCG halo. Furthermore, the half-light radius is not identical to the half-mass radius.
The half-mass radius of BCGs derived from the simulations are typically very large. Figure 4 shows the distribution; the values range from 20 to 200 kpc at corresponding to 16 to 160 arcmin.
Measurements of the BCG velocity dispersions are often based on fiber spectrographs (e.g., SDSS/BOSS or MMT/Hectospec) that usually cover only the core region of the BCG (Sohn et al., 2017, 2020) that is much smaller . Thus a significant aperture correction is required to convert from the observations to the larger half-mass radii.
For direct comparison with the observations, Sohn et al. (2022) derive the dynamical scaling relations from TNG based on the BCG velocity dispersion measured within 3 kpc at . We note that the BCG velocity dispersion () used in Sohn et al. (2022) differs from the BCG velocity dispersion () we use here. The scaling relations in Sohn et al. (2022) show generally similar trends with the relation we derive here. For example, and are proportional to . Both and decrease as a function of . In other words, the behavior of the dynamical scaling relations is relatively insensitive to the aperture size.
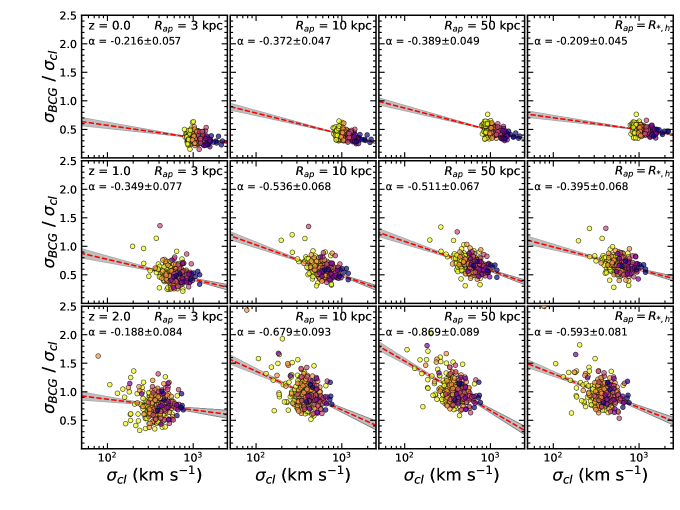
We next explore the impact of the aperture size on the dynamical scaling relations in more detail. Figure 10 displays the relations for systems in three redshift snapshots (i.e., and 2.0). We derive the relations based on the BCG stellar velocity dispersion measured within 3 kpc, 10 kpc, 50 kpc, and apertures from top to bottom.
The relations have negative slopes regardless of the BCG velocity dispersion aperture. Red dashed lines show the best-fit relations. The decreasing as a function of is insensitive to the aperture size used to measure the BCG velocity dispersion.
In general, the relations are steeper at higher redshift regardless of the aperture size. The larger scatter at high redshift indicates that the higher redshift BCGs are usually unrelaxed. Sohn et al. (2022) demonstrate that the BCG subhalos at higher redshift () indeed show a more disturbed distribution of the line-of-sight velocities of stellar particles compared to the analogous distributions for their counterparts at low redshift. Indeed, the BCG subhalos at higher redshift we explore generally have complex velocity distributions that drive the larger scatter in the scaling relations.
The slopes of the relations are relatively shallower when we use measured within 3 kpc and compared to those measured within 10 and 30 kpc. This variation is related to the velocity dispersion profiles. Bose & Loeb (2021) display velocity dispersion profile of halos as a function of projected radius. The stellar velocity dispersion increases as a function of projected radius up to 10 - 100 kpc (depending on the halo mass) and decreases at larger projected radius. Thus, the velocity dispersions measured within 3 kpc and are generally comparable; the resulting dynamical scaling relations then have similar slopes.
We note that the scaling relation based on the 3 kpc velocity dispersion at has a shallower slope and large scatter. Because the stellar particles in the core region of the high redshift BCGs are unrelaxed, the BCG velocity dispersions have a large scatter, resulting in a weaker correlation. Sohn et al. (2022) display the phase-space diagrams of the high redshift BCGs (their Figure 12) that show more a disturbed velocity distribution of the stellar particles in the central region compared to their counterpart at low redshift. In other words, using a large aperture for measuring the high redshift BCGs yield more reliable measurement, insensitive to the unrelaxed dynamics of the BCG core region.
We note that the stellar velocity dispersion within the core region (e.g., kpc, 2.8 times the softening length scale, Campbell et al., 2017) may be underestimated. In this core region, scattering interactions among the particles are softened significantly leading to the probable underestimation of the dispersion.
4.2 Stellar Mass and Velocity Dispersion as BCG Mass Proxies
Studying the co-evolution of clusters and their BCGs provides tests of both structure and massive galaxy formation models. In initial explorations of BCG properties and evolution, the luminosities of BCGs were the basis for estimating the BCG mass. For example, Lin & Mohr (2004) showed that more massive clusters host brighter (i.e., more massive) BCGs. More recently, the stellar mass to halo mass relations as a key to BCG evolution have been explored in observations and simulations (e.g., Kravtsov et al., 2018; Erfanianfar et al., 2019). The ratio between BCG stellar mass and cluster halo mass decreases as a function of cluster mass at .
Sohn et al. (2020) suggest that the relation provides an independent observational test for studying the relation between cluster and BCG masses (see also Sohn et al., 2021). They used and as mass proxies for the BCG subhalo and cluster halo masses.
Many studies demonstrate that is a good cluster mass proxy based on the relation. In contrast, or relations are not widely discussed. In particular, the redshift evolution of these relations is not well known. Exploring these relations based on simulations provides an independent assay of the use of as a BCG mass tracer. This theoretical test provides guidance for using from future spectroscopy, particularly of high redshift systems, as a window on the evolution of the most massive galaxies in the universe.
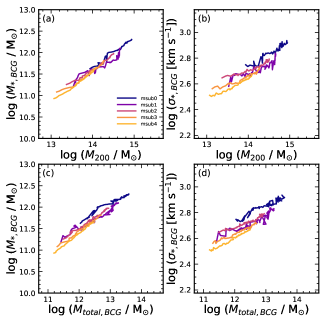
Figure 11 (a) displays the redshift evolution of the BCG subhalo stellar mass and cluster halo mass relation. We derive the relation based on systems in the usual five mass subsamples (separated with colors). We then identify their progenitors in the higher redshift snapshots. In each redshift snapshot, we compute the median cluster mass and the BCG subhalo mass. The lines show how the median and the median change with time; both the median and increase as the universe ages (moving from bottom left to upper right). Although the normalization changes, the slope of the redshift evolution for the mass subsamples is similar in all cases. This result suggests that the relative mass growth rate of BCGs and clusters are independent of the host cluster halo mass.
Figure 11 (b) shows the redshift evolution of the relation. The general trends are essentially identical to those for the relations. The median increases monotonically as a function of . The slopes of the scaling relations are similar in all of the mass subsamples. In other words, the BCG stellar velocity dispersion is a mass proxy that is interchangeable with and complementary to the stellar mass estimates.
We also investigate the relations between BCG stellar mass and stellar velocity dispersion and the total mass of BCGs (Figure 11 (c) and (d)). Here, the total mass indicates that the sum of dark matter, gas, and stellar particle mass belonging to the BCG subhalo within the half mass radius. Both the and relations show similar redshift evolution. In other words, tracing the relation is an independent probe of the co-evolution of clusters and their BCGs.
4.3 Observational Tests
We investigate the dynamical properties of clusters and their BCGs available from future spectroscopic surveys reaching . These dynamical properties can be used for tests of the model developed here for coordinated BCG and cluster evolution. Here, we compare the evolution we trace based on IllustrisTNG with currently available observations and we suggest some future observations.
One of the distinctive predictions from TNG300 simulation is that BCG and cluster velocity dispersions at higher redshift are comparable. Figure 6 and Figure 7 show that is comparable with at . At lower redshift generally exceeds . Future IFU observations will provide the velocity dispersion of the cluster members along with the spatially resolved BCG stellar velocity dispersion for high redshift clusters. A mass complete sample of tens of clusters covering the range would provide a direct test of the when the clusters are identified with their probable descendants.
Figure 12 shows the and evolution as a function of redshift and provides further testable insights. We derive the evolution for clusters in five mass subsamples. Figure 3 shows that both and increase as the universe ages.
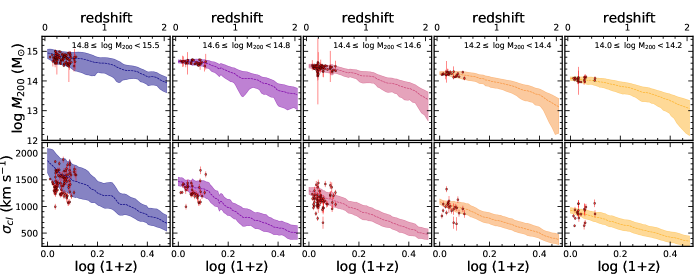
We compare the redshift evolution of and derived from simulations with observations by making a statistical connection between the observed clusters and the zero redshift mass of their descendant.
We use the observed HeCS-omnibus sample, a large spectroscopic compilation of 227 clusters at (Rines & Diaferio, 2006; Rines et al., 2013, 2016, 2018; Sohn et al., 2020). The HeCS-omnibus clusters typically contain spectroscopically identified members. The dense spectroscopy provides a dynamical mass based on the caustic technique (Diaferio & Geller, 1997; Diaferio, 1999; Serra & Diaferio, 2013) along with the cluster velocity dispersion (Sohn et al., 2020). The uncertainly in the observed cluster mass is generally smaller than the 1 range in the masses of clusters in each of the redshift bins that trace the cluster evolution.
We identify HeCS-omnibus clusters with the ancestors of clusters in the zero redshift bins of Figure 12 based on the observed caustic masses. At the redshift of each HeCS-omnibus cluster, we compute the boundary for the cluster ancestors (progenitors) in each mass subsample. We then place the observed cluster in all bins that includes its caustic mass. A HeCS-Omnibus cluster may appears in one (136) to two (40) or three (3) simulation test bins.
The HeCS-Omnibus sample includes the most massive clusters in its redshift range. Thus among the 227 HeCS-omnibus clusters, 48 systems are excluded because their masses exceed the mass range of the simulated progenitors. In other words, in spite the size of IllustrisTNG, the simulations are not large enough to include the most massive systems observed at zero redshift.
In Figure 12, red points mark the HeCS-omnibus clusters in each bin. We select the observational comparison sample based on mass: the observed cluster masses are consistent with the theoretical model but their distribution does not always cover the full simulated range as a result of observational selection. In particular the lower mass systems are underrepresented in the data. The lower panels of Figure 12 compare the evolution. We multiply the observed line-of-sight by for comparison with the 3D simulated cluster velocity dispersions. The observed s are consistent with the theoretical model because the scaling relation between cluster mass and velocity dispersion is similar in the data and in the simulations (Figure 6).
We next compare the observed and simulated BCG properties. We use the BCGs of the observed cluster sample selected for Figure 12. Figure 13 displays and as a function of redshift. We also overlay the observed BCG properties from HeCS-omnibus (red circles, Sohn et al., 2020). The HeCS-omnibus sample includes stellar mass estimates based on SDSS photometry and stellar velocity dispersions measured within a 3 kpc aperture (see details in Sohn et al., 2020). For direct comparison with the observations, we use the simulated measured within a cylindrical volume that penetrates the center of BCGs within a 3 kpc aperture (see Sohn et al., 2022). The substantial extension of the cylinder along the line-of-sight significantly reduces the impact of gravitational softening in this comparison between the observed and simulated velocity dispersions.
The s of the observed BCGs overlap the models, but the observed of most clusters are smaller than the simulated . The difference presumably results from challenges in estimating the BCG stellar mass. We use stellar mass estimates based on the SDSS composite Model (cModel) magnitude, which is unlikely to account completely for the extended BCG halo. Furthermore, the stellar mass from simulations is measured within the half-mass radius, not from the cModel magnitude.
The distribution of for massive clusters (log ) is in better agreement with the simulations. However, the observed s in lower mass systems exceeds the simulated s. Sohn et al. (2022) note this discrepancy based on comparison between the observed and simulated scaling relations. They suggest that the observed sample generally includes more massive systems with generally larger s as a result of observational selection. The difference in the distributions needs to be further investigated with much larger observed samples of BCGs covering a wider redshift range and a larger cluster mass range at each redshift. Moreover, spatially resolved BCG velocity dispersion measurements are important for suppressing aperture effects.
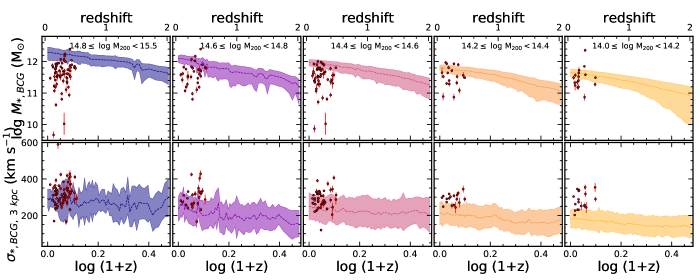
Figure 12 and Figure 13 promise interesting tests for future observations of high redshift () clusters and BCGs. Current and future large spectroscopic surveys including DESI, 4MOST, MOONS, and Subaru/PFS will obtain dense spectroscopy for large numbers of high redshift cluster galaxies. Direct comparison between the cluster and BCG velocity dispersions derived from these surveys will be an immediate test of the simulations.
Sohn et al. (2022) suggest a similar test based on comparison between observed and simulated dynamical scaling relations. Sohn et al. (2022) selected the most massive cluster halos ( at snapshots rather than tracing the progenitors of massive cluster halos at . Tracing the progenitors requires dense observations at a succession of discrete redshifts. It is important that the observed samples are large enough and deep enough to select mass limited samples of possible progenitors at every redshift.
The impact of major mergers on the velocity dispersion evolution is another interesting testable prediction of the IllustrisTNG models. The BCG velocity dispersion increases abruptly when the BCG experiences a major merger. These precipitous changes in the velocity dispersion can be tested with IFU observations of hundreds of high redshift clusters selected to constitute mass limited cluster samples covering a significant redshift range. Because the mergers are rare, the number of clusters must be large enough to catch the mergers in action and to outline any differences in merger frequency between high redshift and lower redshift samples. Deep photometric observations would provide additional confirmation of merging features associated with the BCGs. Taken together the spatially resolved spectroscopy and deep imaging would provide a picture of BCG evolution for direct comparison with the IllustrisTNG predictions.
5 Conclusion
We investigate the evolution of massive clusters and their BCG at based on the IllustrisTNG-300 cosmological simulation. We select 270 massive clusters with at . We trace the main progenitors of clusters and their BCGs in higher redshift snapshots using SubLink merger trees.
We derive the physical properties of clusters and their BCGs from redshift snapshots for . We explore the sizes, masses and velocity dispersions of the systems: , and for clusters and , , and for BCGs. These properties of clusters and BCGs generally increase as the universe ages. The redshift evolution of these properties fluctuates because the clusters and BCGs interact dynamically with surrounding systems.
We explore various scaling relations and their redshift evolution. The relations have a consistent slope of at . The relations have a relatively shallower slopes. Interestingly, s are comparable with at high redshift (), while s are significantly smaller than at low redshift. The ratio is correlated with over the redshift range we explore. The decreases as a function of . The relation is steeper at higher redshift. The underlying large of high redshift cluster promises an interesting test of these models with future spectroscopic observations.
We also trace the evolution of individual clusters and BCGs. We show that the generally decreases as a function of (and redshift). In some cases, the evolutions show abrupt changes because the BCG velocity dispersion is inflated as a result of major mergers between the BCGs and surrounding subhalos. The trends in and relations are insensitive to the cluster halo mass.
We explore the impact of aperture size on the dynamical scaling relations. Depending on the aperture size we use to measure s, the slopes of the dynamical scaling relations vary, but the general trends do not change. We note that s measured within a tight aperture of 3 kpc at high redshift () is not a good physical proxy because of the complicated dynamical nature of BCGs at high redshift. A large aperture ( kpc) measurement at higher redshift is required to understand the BCG dynamical properties.
Comparison between the relation and the relation demonstrates that is a useful BCG mass proxy in tandem with . Testing the scaling relations based on provides an independent probe of the co-evolution of BCGs and their host clusters. Investigation on these relations also tests the prescription for quenching by supermassive black holes that is implemented in the IllustrisTNG simulation (e.g., Vogelsberger et al., 2013; Weinberger et al., 2018). The impact of this quenching only affects the mass and velocity dispersion growth of the BCGs. The mass and velocity dispersion evolutions of the host clusters are insensitive to feedback. Thus the relative evolution of clusters and their BCGs provides an independent test of feedback models.
The redshift evolution of cluster and BCG properties we derive from simulations provide theoretical guidance for future observations. The models overlap the observed properties of clusters and BCGs from the HeCS-omnibus survey covering . Future much larger spectroscopic surveys, including IFU observations, will enable more extensive tests of the behavior higher redshift systems against the model predictions. These tests include examination of the impact of major mergers on BCG evolution as a function of cosmological epoch.
References
- Beers et al. (1990) Beers, T. C., Flynn, K., & Gebhardt, K. 1990, AJ, 100, 32, doi: 10.1086/115487
- Behroozi et al. (2019) Behroozi, P., Wechsler, R. H., Hearin, A. P., & Conroy, C. 2019, MNRAS, 488, 3143, doi: 10.1093/mnras/stz1182
- Bernardi (2009) Bernardi, M. 2009, MNRAS, 395, 1491, doi: 10.1111/j.1365-2966.2009.14601.x
- Bose & Loeb (2021) Bose, S., & Loeb, A. 2021, ApJ, 912, 114, doi: 10.3847/1538-4357/abec77
- Campbell et al. (2017) Campbell, D. J. R., Frenk, C. S., Jenkins, A., et al. 2017, MNRAS, 469, 2335, doi: 10.1093/mnras/stx975
- De Boni et al. (2016) De Boni, C., Serra, A. L., Diaferio, A., Giocoli, C., & Baldi, M. 2016, ApJ, 818, 188, doi: 10.3847/0004-637X/818/2/188
- DeMaio et al. (2020) DeMaio, T., Gonzalez, A. H., Zabludoff, A., et al. 2020, MNRAS, 491, 3751, doi: 10.1093/mnras/stz3236
- Diaferio (1999) Diaferio, A. 1999, MNRAS, 309, 610, doi: 10.1046/j.1365-8711.1999.02864.x
- Diaferio & Geller (1997) Diaferio, A., & Geller, M. J. 1997, ApJ, 481, 633, doi: 10.1086/304075
- Dolag et al. (2010) Dolag, K., Murante, G., & Borgani, S. 2010, MNRAS, 405, 1544, doi: 10.1111/j.1365-2966.2010.16583.x
- Erfanianfar et al. (2019) Erfanianfar, G., Finoguenov, A., Furnell, K., et al. 2019, A&A, 631, A175, doi: 10.1051/0004-6361/201935375
- Fakhouri et al. (2010) Fakhouri, O., Ma, C.-P., & Boylan-Kolchin, M. 2010, MNRAS, 406, 2267, doi: 10.1111/j.1365-2966.2010.16859.x
- Girelli et al. (2020) Girelli, G., Pozzetti, L., Bolzonella, M., et al. 2020, A&A, 634, A135, doi: 10.1051/0004-6361/201936329
- Jung et al. (2022) Jung, S. L., Rennehan, D., Saeedzadeh, V., et al. 2022, arXiv e-prints, arXiv:2203.00016. https://arxiv.org/abs/2203.00016
- Kim et al. (2017) Kim, J.-W., Ko, J., Hwang, H. S., et al. 2017, ApJ, 836, 105, doi: 10.3847/1538-4357/aa5b8e
- Kravtsov & Borgani (2012) Kravtsov, A. V., & Borgani, S. 2012, ARA&A, 50, 353, doi: 10.1146/annurev-astro-081811-125502
- Kravtsov et al. (2018) Kravtsov, A. V., Vikhlinin, A. A., & Meshcheryakov, A. V. 2018, Astronomy Letters, 44, 8, doi: 10.1134/S1063773717120015
- Lauer et al. (2014) Lauer, T. R., Postman, M., Strauss, M. A., Graves, G. J., & Chisari, N. E. 2014, ApJ, 797, 82, doi: 10.1088/0004-637X/797/2/82
- Lin & Mohr (2004) Lin, Y.-T., & Mohr, J. J. 2004, ApJ, 617, 879, doi: 10.1086/425412
- Lin et al. (2017) Lin, Y.-T., Hsieh, B.-C., Lin, S.-C., et al. 2017, ApJ, 851, 139, doi: 10.3847/1538-4357/aa9bf5
- Loubser et al. (2018) Loubser, S. I., Hoekstra, H., Babul, A., & O’Sullivan, E. 2018, MNRAS, 477, 335, doi: 10.1093/mnras/sty498
- Marinacci et al. (2018) Marinacci, F., Vogelsberger, M., Pakmor, R., et al. 2018, MNRAS, 480, 5113, doi: 10.1093/mnras/sty2206
- Marini et al. (2021) Marini, I., Borgani, S., Saro, A., et al. 2021, MNRAS, 507, 5780, doi: 10.1093/mnras/stab2518
- McBride et al. (2009) McBride, J., Fakhouri, O., & Ma, C.-P. 2009, MNRAS, 398, 1858, doi: 10.1111/j.1365-2966.2009.15329.x
- Moster et al. (2010) Moster, B. P., Somerville, R. S., Maulbetsch, C., et al. 2010, ApJ, 710, 903, doi: 10.1088/0004-637X/710/2/903
- Naiman et al. (2018) Naiman, J. P., Pillepich, A., Springel, V., et al. 2018, MNRAS, 477, 1206, doi: 10.1093/mnras/sty618
- Nelson et al. (2018) Nelson, D., Pillepich, A., Springel, V., et al. 2018, MNRAS, 475, 624, doi: 10.1093/mnras/stx3040
- Nelson et al. (2019) Nelson, D., Springel, V., Pillepich, A., et al. 2019, Computational Astrophysics and Cosmology, 6, 2, doi: 10.1186/s40668-019-0028-x
- Oliva-Altamirano et al. (2014) Oliva-Altamirano, P., Brough, S., Lidman, C., et al. 2014, MNRAS, 440, 762, doi: 10.1093/mnras/stu277
- Pillepich et al. (2018) Pillepich, A., Nelson, D., Hernquist, L., et al. 2018, MNRAS, 475, 648, doi: 10.1093/mnras/stx3112
- Pizzardo et al. (2022) Pizzardo, M., Sohn, J., Geller, M. J., Diaferio, A., & Rines, K. 2022, ApJ, 927, 26, doi: 10.3847/1538-4357/ac5029
- Pizzardo et al. (2021) Pizzardo, M., Di Gioia, S., Diaferio, A., et al. 2021, A&A, 646, A105, doi: 10.1051/0004-6361/202038481
- Planck Collaboration et al. (2016) Planck Collaboration, Ade, P. A. R., Aghanim, N., et al. 2016, A&A, 594, A13, doi: 10.1051/0004-6361/201525830
- Ragone-Figueroa et al. (2018) Ragone-Figueroa, C., Granato, G. L., Ferraro, M. E., et al. 2018, MNRAS, 479, 1125, doi: 10.1093/mnras/sty1639
- Remus et al. (2017) Remus, R.-S., Dolag, K., & Hoffmann, T. 2017, Galaxies, 5, 49, doi: 10.3390/galaxies5030049
- Rines & Diaferio (2006) Rines, K., & Diaferio, A. 2006, AJ, 132, 1275, doi: 10.1086/506017
- Rines et al. (2013) Rines, K., Geller, M. J., Diaferio, A., & Kurtz, M. J. 2013, ApJ, 767, 15, doi: 10.1088/0004-637X/767/1/15
- Rines et al. (2016) Rines, K. J., Geller, M. J., Diaferio, A., & Hwang, H. S. 2016, ApJ, 819, 63, doi: 10.3847/0004-637X/819/1/63
- Rines et al. (2018) Rines, K. J., Geller, M. J., Diaferio, A., Hwang, H. S., & Sohn, J. 2018, ApJ, 862, 172, doi: 10.3847/1538-4357/aacd49
- Rodriguez-Gomez et al. (2015) Rodriguez-Gomez, V., Genel, S., Vogelsberger, M., et al. 2015, MNRAS, 449, 49, doi: 10.1093/mnras/stv264
- Serra & Diaferio (2013) Serra, A. L., & Diaferio, A. 2013, ApJ, 768, 116, doi: 10.1088/0004-637X/768/2/116
- Sohn et al. (2020) Sohn, J., Geller, M. J., Diaferio, A., & Rines, K. J. 2020, ApJ, 891, 129, doi: 10.3847/1538-4357/ab6e6a
- Sohn et al. (2021) Sohn, J., Geller, M. J., Hwang, H. S., et al. 2021, ApJ, 923, 143, doi: 10.3847/1538-4357/ac29c3
- Sohn et al. (2022) Sohn, J., Geller, M. J., Vogelsberger, M., & Danjanov, I. 2022, arXiv e-prints, arXiv:2201.08853. https://arxiv.org/abs/2201.08853
- Sohn et al. (2017) Sohn, J., Geller, M. J., Zahid, H. J., et al. 2017, ApJS, 229, 20, doi: 10.3847/1538-4365/aa653e
- Springel et al. (2018) Springel, V., Pakmor, R., Pillepich, A., et al. 2018, MNRAS, 475, 676, doi: 10.1093/mnras/stx3304
- van den Bosch (2002) van den Bosch, F. C. 2002, MNRAS, 331, 98, doi: 10.1046/j.1365-8711.2002.05171.x
- Vogelsberger et al. (2013) Vogelsberger, M., Genel, S., Sijacki, D., et al. 2013, MNRAS, 436, 3031, doi: 10.1093/mnras/stt1789
- Vogelsberger et al. (2020) Vogelsberger, M., Marinacci, F., Torrey, P., & Puchwein, E. 2020, Nature Reviews Physics, 2, 42, doi: 10.1038/s42254-019-0127-2
- Vogelsberger et al. (2014a) Vogelsberger, M., Genel, S., Springel, V., et al. 2014a, Nature, 509, 177, doi: 10.1038/nature13316
- Vogelsberger et al. (2014b) —. 2014b, MNRAS, 444, 1518, doi: 10.1093/mnras/stu1536
- Von Der Linden et al. (2007) Von Der Linden, A., Best, P. N., Kauffmann, G., & White, S. D. M. 2007, MNRAS, 379, 867, doi: 10.1111/j.1365-2966.2007.11940.x
- Weinberger et al. (2018) Weinberger, R., Springel, V., Pakmor, R., et al. 2018, MNRAS, 479, 4056, doi: 10.1093/mnras/sty1733
- Wen & Han (2018) Wen, Z. L., & Han, J. L. 2018, MNRAS, 481, 4158, doi: 10.1093/mnras/sty2533
- Zhao et al. (2009) Zhao, D. H., Jing, Y. P., Mo, H. J., & Börner, G. 2009, ApJ, 707, 354, doi: 10.1088/0004-637X/707/1/354