Hierarchical Attention Network for Explainable Depression Detection
on Twitter Aided by Metaphor Concept Mappings
Abstract
†† These authors contributed equally.Automatic depression detection on Twitter can help individuals privately and conveniently understand their mental health status in the early stages before seeing mental health professionals. Most existing black-box-like deep learning methods for depression detection largely focused on improving classification performance. However, explaining model decisions is imperative in health research because decision-making can often be high-stakes and life-and-death. Reliable automatic diagnosis of mental health problems including depression should be supported by credible explanations justifying models’ predictions. In this work, we propose a novel explainable model for depression detection on Twitter. It comprises a novel encoder combining hierarchical attention mechanisms and feed-forward neural networks. To support psycholinguistic studies, our model leverages metaphorical concept mappings as input. Thus, it not only detects depressed individuals, but also identifies features of such users’ tweets and associated metaphor concept mappings.
Hierarchical Attention Network for Explainable Depression Detection
on Twitter Aided by Metaphor Concept Mappings
Sooji Han∗, Rui Mao∗, and Erik Cambria School of Computer Science and Engineering Nanyang Technological University {sooji.han,rui.mao,cambria}@ntu.edu.sg
1 Introduction
Depression is a serious health and social issue that afflicts many individuals in modern society and its prevalence is predicted to increase globally. People with depression are likely to express their feelings and mental states over their social media before seeing health professionals Guntuku et al. (2017); Ansari et al. (2022). An automatic, efficient approach for depression identification is imperative to recommend adequate treatment, achieving remission and preventing relapse. Recent studies on automatic depression detection on social media Gui et al. (2019); Lin et al. (2020); Ji et al. (2021); Zogan et al. (2021) have largely focused on achieving higher detection accuracy. However, it is impossible to explain and interpret those black-box models that rely on state-of-the-art (SOTA) deep learning techniques. The recent development of explainable AI emphasizes that it is crucial for health professionals to fully comprehend, monitor and trust the AI decision-making mechanisms.
People suffering from depression often use metaphors to describe their emotions and the experience of living with mental illness Coll-Florit et al. (2021); Roystonn et al. (2021). In psychotherapy, metaphors are a pivotal tool for helping people with depression better understand themselves and their problems and facilitating effective communication between therapists and patients Kopp (2013); Siegelman (1993). This is because metaphorical expressions implicitly reflect people’s different ways of understanding the same target. Metaphor is not only a linguistic phenomenon, but also a reflection of cognitive mappings of source and target concepts Lakoff and Johnson (1980). Analyzing metaphor concept mappings (MCMs) helps us understand the inner world of people with depression. Metaphoric expressions associated with depression have been widely studied in psychology, particularly as a form of case studies Roystonn et al. (2021); Coll-Florit et al. (2021). To the best of our knowledge, however, there has not been an automatic method that leverages MCM features extracted from a large corpus for depression detection. We are motivated to bridge the gap and offer better insights into automatic depression detection on social media and conceptual metaphor understanding. Furthermore, we argue that psychological and psycholinguistic research communities can benefit from automated, explainable tools for studying the relationship between depression and metaphors.
In this work, we propose an explainable framework for depression detection on Twitter, called Hierarchical Attention Network (HAN). We propose a novel attention-based encoder which allows HAN to learn important inputs for user-level binary classification (i.e., depressed and non-depressed users). To further improve the interpretability of depression detection, we introduce MCMs as an additional feature into the model. Health professionals and potential patients can use learned features (i.e., characteristics of depressive tweets and MCMs) as justification. We evaluate our model on a publicly available Twitter depression detection dataset Shen et al. (2017) and show that HAN achieves the SOTA performance. It outperforms the strongest baseline Zogan et al. (2021) by increasing an F1 score by 6.0% on average. Additionally, our newly proposed encoder outperforms several classical encoders. In particular, HAN improves LSTM Hochreiter and Schmidhuber (1997) (the most competitive benchmark encoder for our task) by 1.9% on a validation set with a quarter of the number of parameters of LSTM. Finally, we visualize and analyze examples of attention weights learned by HAN to demonstrate its explainability.
The main contributions of this work can be summarized as follows: (1) We propose an explainable model for depression detection on Twitter. Unlike most SOTA methods employing attention mechanisms at word level Vaswani et al. (2017); Liu et al. (2021), our model employs context-level attention mechanisms to identify the relative importance of certain tweets and metaphors, which is crucial for filtering out less significant information in the final representation of contexts and justifying the outputs of the model. (2) We introduce MCMs as a feature to improve explainability and performance. This also helps a better understanding of the cognition of depressive individuals. (3) We demonstrate that HAN achieves outstanding performance and produces accurate and explainable results with a smaller number of training parameters than classical encoders via extensive experiments.
2 Related Work
Traditional studies on depression focus on social, psychological and biological factors, which are not often readily available. This paper mainly focuses on social media texts and machine-learning-based depression detection. Several studies in psychology have reported that conceptual metaphors are used to express and understand the experience of depression, but they are often used unconsciously and pass unnoticed. Research into metaphors can help better understand individuals with depression.
Depression Detection on Social Media. Zogan et al. (2021) proposed a model combining CNNs (LeCun et al., 1989) and BiGRUs (Deng et al., 2019) for learning users’ behavior and textual contents. For user behavior modeling, manually curated features, which are associated with emotions, domains, topics and social media metadata, were employed. Some research exploited sentiment analysis techniques for depression detection. Rao et al. (2020) proposed a hierarchical architecture leveraging gated units and CNNs to learn textual contents of social media posts and users’ emotional states expressed in posts. Aragon et al. (2021) proposed an emotion-aware SVM-based model which learns emotional dynamics expressed in social media posts. Chiong et al. (2021) proposed 90 features, based on sentiment lexicons and textual contents and used them as input to depression detection classifiers. A recent trend is to exploit multimodal learning frameworks for depression detection Gui et al. (2019); Chiu et al. (2021); Lin et al. (2020); Yang et al. (2018). Gui et al. (2019) proposed a multimodal multi-agent reinforcement learning model incorporating BiGRU and VGGNet (Simonyan and Zisserman, 2014) to learn texts and images posted by users on Twitter, respectively. Chiu et al. (2021) proposed a multimodal BiLSTM-based Schuster and Paliwal (1997) architecture jointly learning texts, images and temporal behaviors (i.e., time intervals between posts) on Instagram. Lin et al. (2020) proposed a multimodal model comprising a CNN and a BERT. It jointly learns representations of images and texts and fused them using a low-rank multimodal fusion method. Zhang et al. (2021) proposed a model combining BiLSTM and CNN based on metaphor features and text. However, their metaphor features are shallow, e.g., Part-of-Speech (PoS) tags and the number of metaphors.
Metaphor Understanding. Traditional metaphor studies on depression were mainly based on qualitative analysis and case studies Roystonn et al. (2021); Coll-Florit et al. (2021). This is because of a lack of automatic tools that help psycholinguistic researchers parse and analyze metaphorical expressions from large corpora. Recently, automatic metaphor processing has achieved significant developments. Metaphors can be identified with sequence-tagging-based models (Mao et al., 2019; Choi et al., 2021; Chen et al., 2021; Mao and Li, 2021). Then, the identified metaphors can be interpreted by linguistic meanings (Bollegala and Shutova, 2013; Mao et al., 2018, 2021) or concept mappings (Mason, 2004; Shutova et al., 2017; Ge et al., 2022). Linguistic metaphor interpretation focuses on paraphrasing metaphors into their literal counterparts. For example, Mao et al. (2022a) proposed a system for metaphor identification and interpretation, called MetaPro. It can be used as a text pre-processing technique to achieve metaphor paraphrases from end to end. Thus, NLP techniques for downstream tasks, such as sentiment analysis (Mao et al., 2022a) or machine translation (Mao et al., 2018), can achieve better performance on the effectiveness of metaphor paraphrasing. However, Lakoff and Johnson (1980) argued that metaphor is not only a linguistic phenomenon, but also a reflection of humans’ cognition. Given “this is the core111A metaphor is in italics. of the matter”, core implies “importance” (target) is “interiority” (source) (Lakoff et al., 1991). Thus, one can analyze the inner world of depressed people from their metaphoric expressions and the associated concept mappings, e.g., importance is interiority.
In this paper, we identify several limitations of existing works on depression detection. Existing methods have largely focused on improving classification performance by using advanced encoders, features and deep architectures, while leaving model outputs inexplicable. The majority of SOTA methods are limited to textual contents of posts or rely on shallow features based on social media metadata. To our best knowledge, it is the first work incorporating MCMs into machine-learning-based depression detection on social media. Additionally, our model comprises context-level explainable encoders while word-level attention mechanisms have been widely employed in SOTA methods. This helps better understand how certain tweets and MCMs are used by depressed individuals, thereby justifying model predictions.
3 Methodology
3.1 Problem statement
In our task, a user () is represented as a set of tweets () and a set of the associated MCMs () in the tweets. Therefore, a set of users is denoted by , where each user . A set of a user’s tweet contents is denoted by which contains tweets. is a tweet represented as a sequence of words. A set of a user’s MCMs is denoted by which contains mappings. is an MCM that is represented as a sequence of “a is b”, where a is a target concept, b is a source concept, and is a relation mapping a to b. An example is “importance is interiority”. The task is to predict the most probable label () for a user , where . if is a depressed user, otherwise. denotes a ground truth label.
3.2 Model Architecture
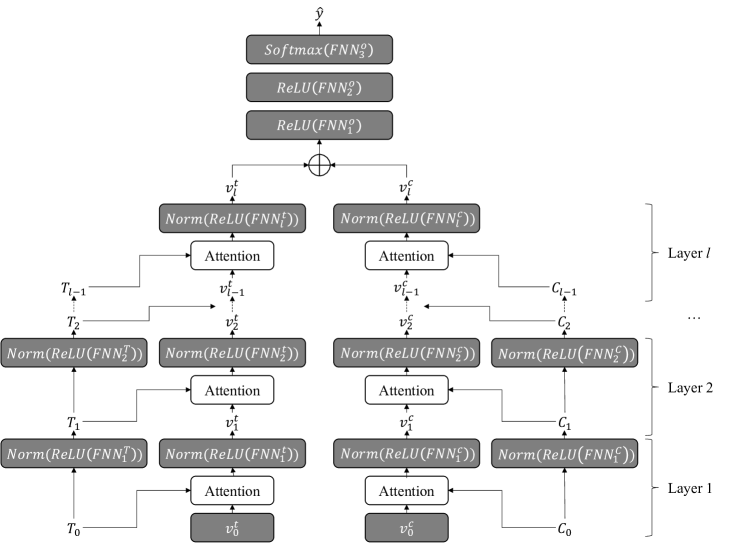
The overall architecture of HAN is shown in Figure 1. Given a set of tweets () of a user, we first obtain embeddings of all tweets in using a pre-trained language model. BERT-base-uncased Devlin et al. (2019) is used to be in line with our strongest baseline Zogan et al. (2021). Special tokens [CLS] and [SEP] are added at the beginning and at the end of each tweet , respectively. The padded sequence “[CLS] [SEP]” is fed into BERT. The vector representation at the [CLS] position of BERT output is used as the embedding of . We obtain an embedding matrix of all tweets in , denoted by . Formally,
| (1) |
Similarly, we obtain an embedding matrix of all MCMs in , denoted by . Formally,
| (2) |
Details about the acquisition of are described in Section 3.3.
HAN consists of attention-based encoder layers. The encoder layer is defined as (see Section 3.4 for details), where . Given a query vector and a key matrix, yields an updated query vector and key matrix. Thus, given the query vector () of tweets () and the tweet embedding (key) matrix in the layer, the updated and are given by
| (3) |
Similarly, given the query vector () of MCM () and the MCM embedding (key) matrix in the layer, the updated and are given by
| (4) |
For the first layers of the first training step, the inputs and (trainable parameters) are randomly initialized. For the other training steps, and are values learned in the previous step.
Next, the output of the last layer of the tweet encoder () and that of the MCM encoder () are concatenated (). The concatenated representation is fed to three feed-forward neural networks (FNNs), denoted by . The first two are activated by ReLU () (Agarap, 2018). The last FNN, , is activated by the Softmax. We do not change the size of the hidden state given by the outputs of the first two FNN layers. The last FNN layer projects the hidden state into a vector of the label size. Then, the probability of a predicted label () is given by
| (5) | ||||
| (6) |
where is the hidden state after the first two () FNNs. Cross-entropy loss is used to optimize the parameters in the model and is given by
| (7) |
3.3 Concept mapping acquisition
Concept mapping acquisition process consists of three components: a) metaphor identification () Mao and Li (2021), b) metaphor paraphrasing () Mao et al. (2021) and c) concept mapping generation () Ge et al. (2022). These algorithms are used because they enable the end-to-end acquisition of MCM features without pre-processing and domain-specific knowledge. Here, we briefly introduce their algorithms, inputs and outputs. For the details, please refer to the original papers.
Given a tweet () comprising tokens , i.e., . The metaphor identification module (MI) is a multi-task-learning-based sequence tagging model, yielding a metaphor label sequence () and a PoS label sequence () defined by
| (8) |
where and . and is a Universal-Dependency-scheme-based PoS label, where denotes the index of a token in . To boost model performance, Mao and Li (2021) proposed a Gated Bridging Mechanism for soft-parameter sharing between the metaphor identification and PoS tagging tasks.
Next, given an identified metaphoric open-class word222Closed-class words are not paraphrased because they do not convey much semantic information in their context. (i.e., one of verbs, nouns, adjectives and adverbs), the metaphor paraphrasing module first lemmatizes as . Then, a pre-trained language model is used to select the best fit word () from a candidate set that consists of hypernyms and synonyms of in WordNet Fellbaum (1998) and their inflections with the same PoS. The best fit word denotes a candidate word that appears in the context and has the highest probability. A probability is given by a masked word prediction of the pre-trained language model, which has been widely used in prompt-based zero-short learning tasks (Mao et al., 2022b). The best fit word is lemmatized as , which is considered the lemma of the paraphrased metaphor in the context of . The above process is defined by
| (9) |
Finally, the concept mapping generation module abstracts the source concept (aϵ,j) from and the target concept (bϵ,j) from . Formally,
| (10) | ||||
| (11) |
is a knee algorithm (Satopaa et al., 2011) and a WordNet-based conceptualization method, proposed by Ge et al. (2022). It abstracts a word into a concept by looking up a hypernym that can cover the major senses of a word. After obtaining aϵ,j and bϵ,j, the concept mapping is defined as
| (12) |
Ge et al. (2022) argued that Lakoff et al. (1991) summarized concept mappings with different patterns due to the subjectivity of annotators. We take the concept mappings given by Eq. 12, which follows one of the concept mapping principles of Lakoff et al. (1991) (see Section 2). We obtain all concept mappings in . If no metaphor is detected in , concept mapping is none for such a tweet. All concept mappings from all tweets of each user are collected, forming an MCM feature set () for depression detection.
3.4 Hierarchical attention network encoder
The HAN encoder () is based on scaled dot-product attention and FNNs. Attention mechanisms enable the model to identify input features (i.e., tweets and MCMs) that are highly significant and useful for depression detection, thereby enhancing model explainability. FNNs allow feature embeddings to better fit the task via multiple non-linear projections. Unlike self-attention Vaswani et al. (2017), the feature information of our encoder is not shared with each other within each feature set, i.e., and in Eqs. 3 and 4. Thus, features fed to the last encoder layer (i.e., and ) represent the features of individual inputs even after several non-linear projections. Important features are learned by query vectors. These are the main differences between our explainable encoder and other classical black-box-like encoders, e.g., LSTM, BiLSTM, GRU Cho et al. (2014), BiGRU and Transformer Vaswani et al. (2017), hidden states of which cannot be easily disentangled after encoding.
Given a query vector () and a key matrix () in the layer, where denotes an embedding size and denotes the number of input features, attention weights () in the layer are given by
| (13) |
where denotes matrix product. The query vector () in the layer is given by the weighted sum of the vectors in and a non-linear projection. Formally,
| (14) |
where denotes layer normalization (Ba et al., 2016). The key matrix () in the layer is defined by
| (15) |
The input and output of the HAN encoder have the same size. For the tweet content encoder, and denote a tweet query vector (), a tweet embedding matrix () and the number of tweets (), respectively. For the MCM encoder, , and denote an MCM query vector (), an MCM embedding matrix () and the number of MCMs (), respectively. We use the attention weights from the last (the ) encoder layer as the final representation of tweet contents and MCMs. shows important inputs that have higher attention weights for the depression status prediction of a user. Analysis results of attention weights to demonstrate model explainability are described in Section 5.5.
4 Experiments
4.1 Datasets and pre-processing
| Dataset | Total # of tweets |
|
||||
| Positive | Negative | Positive | Negative | |||
| D1 | 156,013 | 153,328 | 72 | 75 | ||
| D2 | 151,538 | 119,188 | 71 | 58 | ||
| D3 | 142,057 | 118,611 | 66 | 58 | ||
| D4 | 143,725 | 124,925 | 66 | 61 | ||
| D5 | 148,039 | 134,700 | 69 | 66 | ||
Table 1 presents the statistics of the datasets used in our experiments. We use a publicly available Twitter dataset, called MDL (Shen et al., 2017), which was designed for depression detection. In this dataset, Twitter users, who have posted tweets containing pre-defined patterns (i.e., I’m/I was/I am/I’ve been diagnosed depression), were labeled as depressive (i.e., positive). Those who never posted any tweet containing the term “depress” were labeled as users not suffering from depression (i.e., negative). Due to the updates of MDL over time, its statistics varies across existing works which used it for their experiments (Gui et al., 2019; Lin et al., 2020; Zogan et al., 2021). We argue that the model of Zogan et al. (2021) is the most comparable to our model as regards architecture and features, e.g., employing two independent encoders to encode textual features from multiple sources. To make our results comparable with the work of Zogan et al. (2021), 2,159 positive and 2,049 negative users are randomly sampled from the latest version of MDL. For a fair comparison, we generate five datasets with randomly selected users. 60%, 20% and 20% of the full dataset are used for train, validation and test sets, respectively, which results in 2,524 users in a train set and 842 users in each of validation and test sets. We exclude tweets with less than 4 tokens because they are less informative for depression detection and analysis. URLs, mentions and emojis are removed from tweets because they are likely to introduce noise to the classification task (Gao et al., 2020).
4.2 Baselines
We compare our model with three depression detection baselines.
Gui et al. (2019): A reinforcement-learning-based model based on cooperative multi-agent policy gradients. Tweet texts and images are encoded using GRUs and VGGNets, respectively.
Lin et al. (2020): A model comprising a CNN and a BERT for learning images and texts, respectively. The final representation of inputs is obtained via low-rank multimodal fusion.
Zogan et al. (2021): A model jointly learning tweet texts and user behavior using CNNs and BiGRUs. BERT-base and BART-large are used for tweet text modeling.
We do not benchmark the work by Zhang et al. (2021) because their model was designed for classifying different types of mental disorders. Besides, their model (i.e., CNNs+BiLSTMs) is similar to the architecture proposed by Zogan et al. (2021).
| Model | P | R | F1 | Acc. |
|---|---|---|---|---|
| Gui et al. (2019) | 0.900 | 0.901 | 0.900 | 0.900 |
| Lin et al. (2020) | 0.903 | 0.870 | 0.886 | 0.884 |
| Zogan et al. (2021) | 0.909 | 0.904 | 0.912 | 0.901 |
| HANours-AvgD1-D5 | 0.975 | 0.969 | 0.972 | 0.971 |
| D1 | 0.981 | 0.965 | 0.973 | 0.973 |
| D2 | 0.988 | 0.956 | 0.972 | 0.971 |
| D3 | 0.972 | 0.972 | 0.972 | 0.971 |
| D4 | 0.968 | 0.970 | 0.969 | 0.968 |
| D5 | 0.964 | 0.981 | 0.972 | 0.971 |
4.3 Setups
We employ two HAN encoder layers (i.e., ). The maximum input length (i.e., the maximum numbers of tweets and MCMs per user) is set to 200. The batch size (i.e., the number of users per batch) is 64. Dropout rates for query vectors and key matrices are set to 0.2. The learning rate and weight decay of the Adam optimizer (Kingma and Ba, 2015) are set to 1e-4 and 1e-5, respectively. BERT-base-uncased is used to obtain tweet and MCM embeddings. The model is trained with a GeForce GTX 1080 Ti GPU with CUDA 9.2 (NVIDIA et al., 2020) and PyTorch 1.7.1 (Paszke et al., 2019). Following our baselines, four performance metrics are adopted in our experiments: accuracy (Acc.), precision (P), recall (R) and F1 score (F1). P, R and F1 are computed with respect to the positive class, i.e., depressive. Overall performance is the average of results achieved with the five datasets.
| Model | F1 on MDL-validation | F1 on IMDL-validation | ||||||||||
|---|---|---|---|---|---|---|---|---|---|---|---|---|
| D1 | D2 | D3 | D4 | D5 | Avg | D1 | D2 | D3 | D4 | D5 | Avg | |
| HAN | 0.985 | 0.960 | 0.971 | 0.976 | 0.975 | 0.973 | 0.939 | 0.911 | 0.933 | 0.927 | 0.931 | 0.928 |
| HAN-MCM | 0.972 | 0.947 | 0.963 | 0.967 | 0.962 | 0.962 | 0.914 | 0.897 | 0.914 | 0.905 | 0.918 | 0.909 |
| 0.013 | 0.013 | 0.008 | 0.009 | 0.013 | 0.011 | 0.025 | 0.014 | 0.019 | 0.022 | 0.014 | 0.019 | |
5 Results
5.1 Classification performance
As shown in Table 2, our proposed model advances SOTA performance in terms of all of the performance metrics for all of the five datasets. HAN achieves an average F1 score of 97.2% and an accuracy of 97.1%. The comparison results show that HAN yields the increases of 6.0% and 7.0% in F1 score and accuracy over the strongest baseline model (Zogan et al., 2021), respectively. We observe that performance is almost identical for different randomly sampled datasets (i.e., D1-5), which shows that HAN is robust to different characteristics of users on Twitter.
5.2 Ablation study
A set of exploratory experiments is conducted to study the relative contribution of MCMs in our model. To this end, we generate a variation of MDL, called Implicit Twitter Depression Data (IMDL), by removing explicit linguistic cues for depression (i.e., “I’m/I was/I am/I’ve been diagnosed depression” and words containing “depress”, “diagnos”, “anxiety”, “bipolar” and “disorder”) from all tweets. IMDL makes the task more challenging.
We evaluate our full model (HAN) and HAN without the MCM encoder, called “HAN-MCM”, using both MDL and IMDL. Table 3 shows average F1 scores achieved with the validation sets. Overall, HAN and HAN-MCM achieve higher performance on MDL than on IMDL in terms of F1 score. This verifies our hypothesis that the removal of explicit linguistic cues for depression from tweets makes the task more difficult. The ablation study of the internal baseline model (i.e., “HAN-MCM”) proves that MCMs can provide additional information effective in identifying depressive users.
For MDL, HAN outperforms HAN-MCM by 1.1%. It is worth noting that the performance difference is slightly larger for IMDL (1.9%), which indicates that MCMs can provide effective complementary evidence when no explicit cues for depression exist in tweets. The above experiments on both datasets demonstrate the usefulness of understanding MCMs in identifying depressive users.
| # of HAN layers | 1 | 2 | 4 | 8 |
| MDL D1 validation | 0.542 | 0.985 | 0.983 | 0.979 |
5.3 Hyperparameter analysis
The major hyperparameter of HAN is the number of encoder layers (i.e., ). We experiment with different values (i.e., 1, 2, 4 and 8) for the MDL D1 validation set. Table 4 shows that the best F1 score is achieved when is set to 2. Using more than two layers does not reap benefits of an increase in model performance.
| LSTM | BiLSTM | GRU | BiGRU | TF-first | HAN-TF | HAN | |
|---|---|---|---|---|---|---|---|
| F1 on MDL D1 val. | 0.966 | 0.965 | 0.961 | 0.959 | 0.898 | 0.976 | 0.985 |
| # of param. per layer | 4.72M | 9.45M | 3.54M | 7.09M | 3.55M | 4.14M | 1.18M |
5.4 Encoder benchmarking
To prove the effectiveness of our HAN encoder, we compare it with six widely used encoders: LSTM, BiLSTM, GRU, BiGRU, TF-first and HAN-TF. HAN encoders are replaced with each of them in our framework. For LSTM and GRU, the final representation of input features is the hidden state of the last token. For BiLSTM and BiGRU, the concatenation of the forward and backward hidden states of the last and first tokens is used. TF-first and HAN-TF are encoders based on Transformer. In TF-first, Transformer is used as an encoder. The hidden state of the first input instance333We experimented with different fusion methods (e.g., summation, average and linear transformation of concatenated representations) and found that using the hidden state of the first input instance works best. (a tweet or an MCM) of each user is used by Eq. 5. In HAN-TF, we use Transformer to replace the input matrix projection layer (i.e., FNN in Eq. 15) of HAN encoders.
The size of the input and output hidden states of each encoder is set to 768, which is in line with that of BERT-base-uncased. The size of FNNs and the number of heads in Transformer are 768 and 8, respectively. The other hyperparameters remain the same. CNNs are not used as a baseline because they need to be used with other encoders to learn context dependencies Wang et al. (2016); Rhanoui et al. (2019).
Table 5 shows F1 scores achieved with the MDL D1 validation set and the number of parameters per encoder layer. HAN encoder achieves better results than all the baseline encoders on our task in terms of F1 score. HAN and HAN-TF outperform LSTM by 1.9% and 1.0%, respectively. Although HAN and HAN-TF achieve comparable performance, it is worth noting that using Transformer instead of FNNs in the HAN encoder significantly increases the number of parameters (+2.96M). The number of parameters of the HAN encoder is the smallest among all the encoders. The parameter size of HAN is just a third of that of the second smallest encoder (GRU).
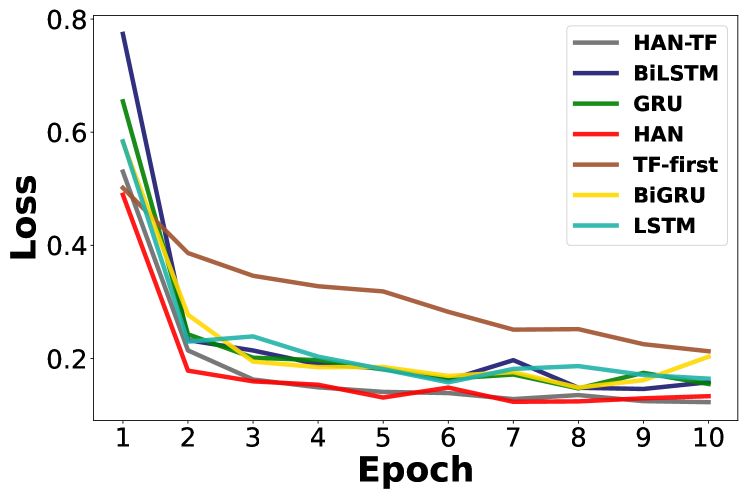
Figure 2 shows training loss curves for different encoders plotted using the MDL D1. HAN (the red line) converges faster than the other encoders. Overall, the experiments on different encoders prove that HAN has advantages over the others in terms of effectiveness and efficiency.
| User | Tweet | Metaphor |
| 1 | 1. I hate how I can’t tell if I have allergies or I’m getting sick. | 1. level is importance |
| 2. get better, I love you | 2. person is extremity | |
| 3. I’m slightly allergic to cats but I still have them and I don’t CARE IF I SNEEZE | 3. situation is happening | |
| 4. I’m having a bad night | 4. athlete is area | |
| 5. So I’m so nervous for my MAC interview tomorrow but I know I’ll do great. Everything will be okay | 5. morpheme is extremity | |
| 2 | 1. Today is not a good day: Driver, teen shot to death after vehicle hits and kills -year-old | 1. concern is state |
| 2. Autistic th Grader Assaulted by School Cop, Now He is a Convicted Felon | 2. position is disappearance | |
| 3. Thank you Father, GM FB! I gotta start taking My butt to bed at night, woke late again | 3. level is importance | |
| 4. Cellphone Video Surfaces Showing Moments After Police Shot -Year-Old Boy in the Back | 4. feeling is ill_health | |
| 5. Freddie Gray dies one week after Baltimore arrest | 5. artifact is support |
5.5 Explainability demonstration
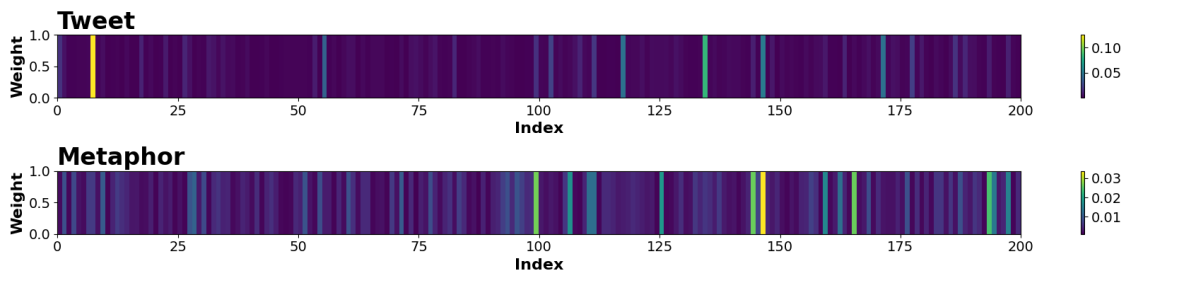
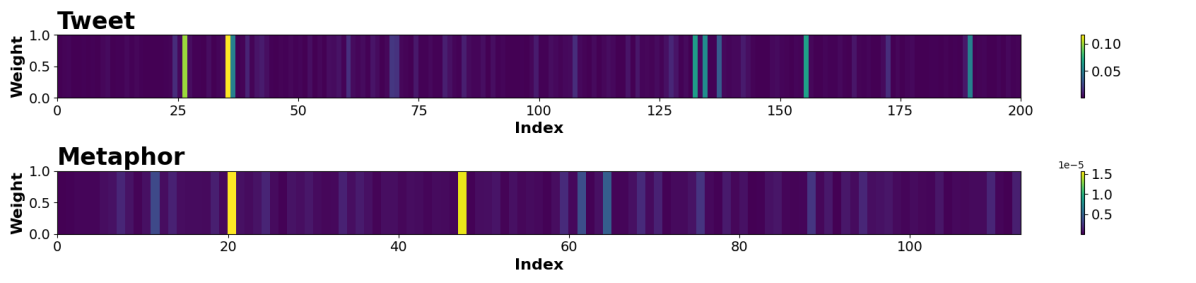
Figure 3 visualizes the attention weights ( given by Eq. 13) for tweets posted by two example users with depression and MCMs in their tweets. As shown in the figure, HAN can selectively focus on the most important and useful tweets and metaphors by progressively refining feature maps. Attention weights are useful for justifying the decision-making mechanism of HAN because they quantitatively describe how much each tweet and MCM contributes to a predicted label (see Eq. 14). Higher attention weights denote greater utility of tweets and MCMs in detecting depression.
Table 6 shows the top 5 tweets and MCMs, ranked according to the attention weights learned during training, for two example users. User 1 tends to use negative expressions to describe personal feelings, state and emotions such as “bad”, “sick”, “hate” and “nervous”. The user also uses positive expressions, such as “love”, “I’ll do great” and “everything will be ok”. However, these positive tweets tend to express self-soothing for negative events. User 2 tends to repost or quote tragic news and add personal comments. The two depressed users show different behaviors on social media, e.g., self-soothing and quoting tragic news.
The listed MCMs in Table 6 show that both example users have the same MCM in their tweets, i.e., level is importance. The conceptual projection from level to importance may exacerbate depression because level simply refers to “a position on a scale of intensity or amount or quality”, whereas importance normally refers to a subjective feeling about “the worthy of note” (Fellbaum, 1998).
The imageability of importance may increase stress and anxiety, and thus arouse more depressive feelings (Vedhara et al., 2003). For example, there is a tweet saying that “If a transgender student is bullied, they are put at a greater risk of suicide” posted by a depressed user in the dataset (Shen et al., 2017). In this tweet, “greater” is metaphorical. Its contextual meaning refers to a higher risk. “High” is one of the manifestations of the target concept level. However, the literal imageability of “great” likely refers to the source concept importance, e.g., “a great work of art” (Fellbaum, 1998). Thus, the metaphorical expression in the example tweet also implies that the “risk of suicide” is high and important, which probably increases the subject’s nervousness because of their perception about the importance of the risk. We also find that a metaphoric term “great” is common in the MCM level is importance and its associated tweets posted by depressed users.
This case study demonstrates that we can further discover common MCMs and metaphorical language patterns among depressed individuals using our proposed model. In general, we argue that HAN is potentially useful for identifying depressed individuals and analyzing different types of such individuals, their cognition and risk factors.
6 Ethical Considerations
This research work was conducted based on a public dataset published by Shen et al. (2017). We solely used textual content for concept mapping acquisition, training, and evaluating the model. We did not leverage any information related to user profiles. We oppose the use of our model in any breach of data security, privacy protection, and ethics.
7 Conclusion
While most deep learning architectures for depression detection left the impact of different input features on model performance inexplicable, our work attempted to interpret what was going on in the model and justify model predictions. We proposed an attention-based encoder to better understand decision-making process for depression detection. We introduced novel metaphor concept mapping features into our model to investigate how depressed people describe their emotions and experiences. Our extensive experiments and comparative evaluations showed that our model could achieve SOTA performance. An ablation study proved the advantage of utilizing metaphors in depression detection. We argue that a better understanding of metaphors associated with depression can enhance interpretability and help health professionals provide tailored, timely therapy to patients. In future research, we plan to conduct a large-scale study to categorize different characteristics of depression using users’ metaphorical and cognitive expressions.
Acknowledgments
We appreciate Rekha Samrajyutha Sajja and Shreyas Nagesh for evaluating metaphor concept mappings. We also appreciate reviewers and Frank Guerin for the constructive comments.
References
- Agarap (2018) Abien Fred Agarap. 2018. Deep learning using rectified linear units (ReLU). arXiv preprint arXiv:1803.08375.
- Ansari et al. (2022) Luna Ansari, Shaoxiong Ji, Qian Chen, and Erik Cambria. 2022. Ensemble hybrid learning methods for automated depression detection. IEEE Transactions on Computational Social Systems, pages 1–9.
- Aragon et al. (2021) Mario Ezra Aragon, Adrian Pastor Lopez-Monroy, Luis-Carlos Gonzalez Gonzalez-Gurrola, and Manuel Montes. 2021. Detecting mental disorders in social media through emotional patterns-the case of anorexia and depression. IEEE Transactions on Affective Computing.
- Ba et al. (2016) Jimmy Lei Ba, Jamie Ryan Kiros, and Geoffrey E Hinton. 2016. Layer normalization. arXiv preprint arXiv:1607.06450.
- Bollegala and Shutova (2013) D Bollegala and E Shutova. 2013. Metaphor interpretation using paraphrases extracted from the web. PLoS ONE, 8(9).
- Chen et al. (2021) Xin Chen, Zhen Hai, Suge Wang, Deyu Li, Chao Wang, and Huanbo Luan. 2021. Metaphor identification: A contextual inconsistency based neural sequence labeling approach. Neurocomputing, 428:268–279.
- Chiong et al. (2021) Raymond Chiong, Gregorious Satia Budhi, and Sandeep Dhakal. 2021. Combining sentiment lexicons and content-based features for depression detection. IEEE Intelligent Systems, 36(6):99–105.
- Chiu et al. (2021) Chun Yueh Chiu, Hsien Yuan Lane, Jia Ling Koh, and Arbee LP Chen. 2021. Multimodal depression detection on instagram considering time interval of posts. Journal of Intelligent Information Systems, 56(1):25–47.
- Cho et al. (2014) Kyunghyun Cho, Bart van Merriënboer, Caglar Gulcehre, Dzmitry Bahdanau, Fethi Bougares, Holger Schwenk, and Yoshua Bengio. 2014. Learning phrase representations using RNN encoder–decoder for statistical machine translation. In Proceedings of the 2014 Conference on Empirical Methods in Natural Language Processing (EMNLP), pages 1724–1734.
- Choi et al. (2021) Minjin Choi, Sunkyung Lee, Eunseong Choi, Heesoo Park, Junhyuk Lee, Dongwon Lee, and Jongwuk Lee. 2021. MelBERT: Metaphor detection via contextualized late interaction using metaphorical identification theories. In Proceedings of the 2021 Conference of the North American Chapter of the Association for Computational Linguistics: Human Language Technologies, pages 1763–1773.
- Coll-Florit et al. (2021) Marta Coll-Florit, Salvador Climent, Marco Sanfilippo, and Eulàlia Hernández-Encuentra. 2021. Metaphors of depression. Studying first person accounts of life with depression published in blogs. Metaphor and Symbol, 36(1):1–19.
- Deng et al. (2019) Yaping Deng, Lu Wang, Hao Jia, Xiangqian Tong, and Feng Li. 2019. A sequence-to-sequence deep learning architecture based on bidirectional GRU for type recognition and time location of combined power quality disturbance. IEEE Transactions on Industrial Informatics, 15(8):4481–4493.
- Devlin et al. (2019) Jacob Devlin, Ming-Wei Chang, Kenton Lee, and Kristina Toutanova. 2019. BERT: Pre-training of deep bidirectional transformers for language understanding. In Proceedings of the 2019 Conference of NAACL-HLT, pages 4171–4186, Minneapolis, Minnesota. Association for Computational Linguistics.
- Fellbaum (1998) Christiane Fellbaum. 1998. WordNet: An Electronic Lexical Database. Bradford Books.
- Gao et al. (2020) Jie Gao, Sooji Han, Xingyi Song, and Fabio Ciravegna. 2020. RP-DNN: A tweet level propagation context based deep neural networks for early rumor detection in social media. In Proceedings of The 12th Language Resources and Evaluation Conference, pages 6094–6105, Marseille, France. European Language Resources Association.
- Ge et al. (2022) Mengshi Ge, Rui Mao, and Erik Cambria. 2022. Explainable metaphor identification inspired by conceptual metaphor theory. In Proceedings of AAAI, pages 10681–10689.
- Gui et al. (2019) Tao Gui, Liang Zhu, Qi Zhang, Minlong Peng, Xu Zhou, Keyu Ding, and Zhigang Chen. 2019. Cooperative multimodal approach to depression detection in twitter. In Proceedings of the AAAI conference on Artificial Intelligence, volume 33, pages 110–117.
- Guntuku et al. (2017) Sharath Chandra Guntuku, David B Yaden, Margaret L Kern, Lyle H Ungar, and Johannes C Eichstaedt. 2017. Detecting depression and mental illness on social media: An integrative review. Current Opinion in Behavioral Sciences, 18:43–49.
- Hochreiter and Schmidhuber (1997) Sepp Hochreiter and Jürgen Schmidhuber. 1997. Long short-term memory. Neural computation, 9(8):1735–1780.
- Ji et al. (2021) Shaoxiong Ji, Tianlin Zhang, Luna Ansari, Jie Fu, Prayag Tiwari, and Erik Cambria. 2021. MentalBERT: Publicly available pretrained language models for mental healthcare. CoRR, abs/2110.15621.
- Kingma and Ba (2015) Diederik P Kingma and Jimmy Ba. 2015. Adam: A method for stochastic optimization. In Proceedings of the International Conference on Learning Representations.
- Kopp (2013) Richard R Kopp. 2013. Metaphor therapy: Using client generated metaphors in psychotherapy. Routledge.
- Lakoff et al. (1991) George Lakoff, Jane Espenson, and Alan Schwartz. 1991. Master Metaphor List, 2nd edition. University of California at Berkeley.
- Lakoff and Johnson (1980) George Lakoff and Mark Johnson. 1980. Metaphors We Live by. University of Chicago press.
- LeCun et al. (1989) Yann LeCun, Bernhard Boser, John S Denker, Donnie Henderson, Richard E Howard, Wayne Hubbard, and Lawrence D Jackel. 1989. Backpropagation applied to handwritten zip code recognition. Neural computation, 1(4):541–551.
- Lin et al. (2020) Chenhao Lin, Pengwei Hu, Hui Su, Shaochun Li, Jing Mei, Jie Zhou, and Henry Leung. 2020. Sensemood: Depression detection on social media. In Proceedings of the 2020 International Conference on Multimedia Retrieval, pages 407–411.
- Liu et al. (2021) Qian Liu, Jie Lu, Guangquan Zhang, Tao Shen, Zhihan Zhang, and Heyan Huang. 2021. Domain-specific meta-embedding with latent semantic structures. Information Sciences, 555:410–423.
- Mao and Li (2021) Rui Mao and Xiao Li. 2021. Bridging towers of multitask learning with a gating mechanism for aspect-based sentiment analysis and sequential metaphor identification. In Proceedings of the 35th AAAI Conference on Artificial Intelligence, pages 13534–13542.
- Mao et al. (2022a) Rui Mao, Xiao Li, Mengshi Ge, and Erik Cambria. 2022a. MetaPro: A computational metaphor processing model for text pre-processing. Information Fusion, 86-87:30–43.
- Mao et al. (2018) Rui Mao, Chenghua Lin, and Frank Guerin. 2018. Word embedding and WordNet based metaphor identification and interpretation. In Proceedings of the 56th Annual Meeting of the Association for Computational Linguistics, volume 1, pages 1222–1231.
- Mao et al. (2019) Rui Mao, Chenghua Lin, and Frank Guerin. 2019. End-to-end sequential metaphor identification inspired by linguistic theories. In Proceedings of the 57th Annual Meeting of the Association for Computational Linguistics, pages 3888–3898.
- Mao et al. (2021) Rui Mao, Chenghua Lin, and Frank Guerin. 2021. Interpreting verbal metaphors by paraphrasing. arXiv preprint arXiv:2104.03391.
- Mao et al. (2022b) Rui Mao, Qian Liu, Kai He, Wei Li, and Erik Cambria. 2022b. The biases of pre-trained language models: An empirical study on prompt-based sentiment analysis and emotion detection. IEEE Transactions on Affective Computing, pages 1–11.
- Mason (2004) Zachary J Mason. 2004. CorMet: A computational, corpus-based conventional metaphor extraction system. Computational linguistics, 30(1):23–44.
- NVIDIA et al. (2020) NVIDIA, Péter Vingelmann, and Frank H.P. Fitzek. 2020. CUDA, release: 9.2.148.
- Paszke et al. (2019) Adam Paszke, Sam Gross, Francisco Massa, Adam Lerer, James Bradbury, Gregory Chanan, Trevor Killeen, Zeming Lin, Natalia Gimelshein, Luca Antiga, Alban Desmaison, Andreas Kopf, Edward Yang, Zachary DeVito, Martin Raison, Alykhan Tejani, Sasank Chilamkurthy, Benoit Steiner, Lu Fang, Junjie Bai, and Soumith Chintala. 2019. PyTorch: An imperative style, high-performance deep learning library. In H. Wallach, H. Larochelle, A. Beygelzimer, F. d’Alche Buc, E. Fox, and R. Garnett, editors, Advances in Neural Information Processing Systems 32, pages 8024–8035. Curran Associates, Inc.
- Rao et al. (2020) Guozheng Rao, Yue Zhang, Li Zhang, Qing Cong, and Zhiyong Feng. 2020. MGL-CNN: A hierarchical posts representations model for identifying depressed individuals in online forums. IEEE Access, 8:32395–32403.
- Rhanoui et al. (2019) Maryem Rhanoui, Mounia Mikram, Siham Yousfi, and Soukaina Barzali. 2019. A CNN-BiLSTM model for document-level sentiment analysis. Machine Learning and Knowledge Extraction, 1(3):832–847.
- Roystonn et al. (2021) Kumarasan Roystonn, Wen Lin Teh, Ellaisha Samari, Laxman Cetty, Fiona Devi, Shazana Shahwan, Nisha Chandwani, and Mythily Subramaniam. 2021. Analysis and interpretation of metaphors: Exploring young adults’ subjective experiences with depression. Qualitative Health Research, 31(8):1437–1447.
- Satopaa et al. (2011) Ville Satopaa, Jeannie Albrecht, David Irwin, and Barath Raghavan. 2011. Finding a “kneedle” in a haystack: Detecting knee points in system behavior. In 2011 31st international conference on distributed computing systems workshops, pages 166–171. IEEE.
- Schuster and Paliwal (1997) Mike Schuster and Kuldip K Paliwal. 1997. Bidirectional recurrent neural networks. IEEE Transactions on Signal Processing, 45(11):2673–2681.
- Shen et al. (2017) Guangyao Shen, Jia Jia, Liqiang Nie, Fuli Feng, Cunjun Zhang, Tianrui Hu, Tat-Seng Chua, and Wenwu Zhu. 2017. Depression detection via harvesting social media: A multimodal dictionary learning solution. In IJCAI, pages 3838–3844.
- Shutova et al. (2017) Ekaterina Shutova, Lin Sun, Elkin Darío Gutiérrez, Patricia Lichtenstein, and Srini Narayanan. 2017. Multilingual metaphor processing: Experiments with semi-supervised and unsupervised learning. Computational Linguistics, 43(1):71–123.
- Siegelman (1993) Ellen Y Siegelman. 1993. Metaphor and Meaning in Psychotherapy. Guilford Press.
- Simonyan and Zisserman (2014) Karen Simonyan and Andrew Zisserman. 2014. Very deep convolutional networks for large-scale image recognition. In Proceedings of the International Conference on Learning Representations.
- Vaswani et al. (2017) Ashish Vaswani, Noam Shazeer, Niki Parmar, Jakob Uszkoreit, Llion Jones, Aidan N Gomez, Łukasz Kaiser, and Illia Polosukhin. 2017. Attention is all you need. Advances in neural information processing systems, 30.
- Vedhara et al. (2003) Kav Vedhara, Jeremy Miles, Paul Bennett, Sue Plummer, Deborah Tallon, Emily Brooks, Lone Gale, Katherine Munnoch, Christa Schreiber-Kounine, Clare Fowler, et al. 2003. An investigation into the relationship between salivary cortisol, stress, anxiety and depression. Biological psychology, 62(2):89–96.
- Wang et al. (2016) Jin Wang, Liang-Chih Yu, K Robert Lai, and Xuejie Zhang. 2016. Dimensional sentiment analysis using a regional CNN-LSTM model. In Proceedings of the 54th annual meeting of the association for computational linguistics (volume 2: Short papers), pages 225–230.
- Yang et al. (2018) Le Yang, Dongmei Jiang, and Hichem Sahli. 2018. Integrating deep and shallow models for multi-modal depression analysis—hybrid architectures. IEEE Transactions on Affective Computing, 12(1):239–253.
- Zhang et al. (2021) Dongyu Zhang, Nan Shi, Ciyuan Peng, Abdul Aziz, Wenhong Zhao, and Feng Xia. 2021. MAM: A metaphor-based approach for mental illness detection. In International Conference on Computational Science, pages 570–583. Springer.
- Zogan et al. (2021) Hamad Zogan, Imran Razzak, Shoaib Jameel, and Guandong Xu. 2021. DepressionNet: A novel summarization boosted deep framework for depression detection on social media. arXiv preprint arXiv:2105.10878.