:
\theoremsep
\jmlrvolume1
\firstpageno1
\jmlryear2022
\jmlrworkshopMachine Learning for Health (ML4H) 2022
Efficient HLA imputation from sequential SNPs data by Transformer
Abstract
Human leukocyte antigen (HLA) genes are associated with a variety of diseases, however direct typing of HLA is time and cost consuming. Thus various imputation methods using sequential SNPs data have been proposed based on statistical or deep learning models, e.g. CNN-based model, named DEEP*HLA. However, imputation efficiency is not sufficient for infrequent alleles and a large size of reference panel is required. Here, we developed a Transformer-based model to impute HLA alleles, named ”HLA Reliable IMputatioN by Transformer (HLARIMNT)” to take advantage of sequential nature of SNPs data. We validated the performance of HLARIMNT using two different reference panels; Pan-Asian reference panel () and Type 1 Diabetes Genetics Consortium (T1DGC) reference panel (), as well as the mixture of those two panels (). HLARIMNT achieved higher accuracy than DEEP*HLA by several indices, especially for infrequent alleles. We also varied the size of data used for training, and HLARIMNT imputed more accurately among any size of training data. These results suggest that Transformer-based model may impute efficiently not only HLA types but also any other gene types from sequential SNPs data.
Relevant codes are available at https://github.com/seitalab/HLARIMNT.
1 Introduction
The major histocompatibility complex (MHC) region is located on the short arm of chromosome 6, and is strongly associated with complex human traits (Dendrou et al., 2018). It has been also found that Human leukocyte antigen (HLA) genes, which are abundant within the MHC region, explain much of the risk there (Dendrou et al., 2018). Indeed, some HLA alleles are known to be at risk for the development of serious diseases, such as adverse reactions to drugs (Halevy et al., 2008; Ko et al., 2015). Therefore, HLA genotyping is important in medicine.
However, it is quite difficult to directly type the HLA alleles due to the complexity of the MHC region. Sanger sequencing and next-generation sequencing (NGS) are commonly used for direct typing of alleles, but these methods are time-consuming, expensive, and not suitable for mass production of analysis results. Furthermore, the limitation in terms of HLA gene coverage and allele resolution make it more difficult to type alleles (Hirata et al., 2019; Erlich, 2012).
For these reasons, HLA alleles are usually computationally imputed by statistical models, based on observed single nucleotide polymorphism (SNP) data from ethnicity-specific reference panels (Hirata et al., 2019; Pereyra et al., 2010; Raychaudhuri et al., 2012; Okada et al., 2015).
For example, HLA*IMP is one of the imputation methods based on the Li & Stephens haplotype model (Leslie et al., 2008) using SNP data from European populations (Dilthey et al., 2011; Li and Stephens, ). HLA*IMP:02 is the subsequently developed method, which uses SNP data from multiple populations (Dilthey et al., 2013). SNP2HLA, which uses the imputation software package Beagle to impute classical HLA alleles, is also one of the tools with high accuracy (Jia et al., 2013). HLA Genotype Imputation with Attribute Bagging (HIBAG), which is a method using multiple expectation–maximization-based classifiers, estimates the likelihood of HLA alleles (Zheng et al., 2014). CookHLA is based on the standard hidden Markov model that can incorporate the genetic distance as input, using Beagle v4 and v5 (Cook et al., 2021).
Nevertheless, there was still room for improvement in these imputation methods, in terms of imputation accuracy, especially for infrequent alleles. Since reference panels were used directly other than HIBAG, there were restrictions on the data that can be accessed from the standpoint of personal information protection, which further reduced the accuracy of the imputation.
Turning to the area of machine learning, deep learning has made great strides in various domains. In addition to classical models like CNN and RNN, Transformer boasts high accuracy (Vaswani et al., 2017). Taking advantage of the attention mechanism and positional encoding, Transformer is good at handling sequential data, e.g. natural language (Vaswani et al., 2017). Now Transformer has been applied not only to natural language processing (Brown et al., 2020; Adiwardana et al., 2020), but also to image recognition (Dosovitskiy et al., 2020), predictions of protein structures (Jumper et al., 2021), music generation (Huang et al., 2018), and image generation (Saharia et al., 2022; Ramesh et al., 2022), by processing data as sequential. Deep learning models like these have also been applied to the field of medicine (Egger et al., 2022; Wang et al., 2021), including genetics (Chu et al., 2022; Kojima et al., 2020).
DEEP*HLA, which is a CNN-based model, was developed for HLA imputation (Naito et al., 2021). DEEP*HLA was a great advance in the field of HLA imputation in that it allowed more accurate imputation than existing methods, without the need to use a direct reference panel. Nevertheless, there was still room for improvement in DEEP*HLA, especially in accuracy for infrequent alleles, and a large size of reference panel required for efficient imputation.
In this study, we propose a Transformer-based model to impute eight HLA classical alleles, named ”HLA Reliable IMputatioN by Transformer (HLARIMNT)”, which allows the Transformer to take advantage of the sequential nature of SNPs. HLARIMNT performed imputations with generally higher accuracy than DEEP*HLA.
2 Methods
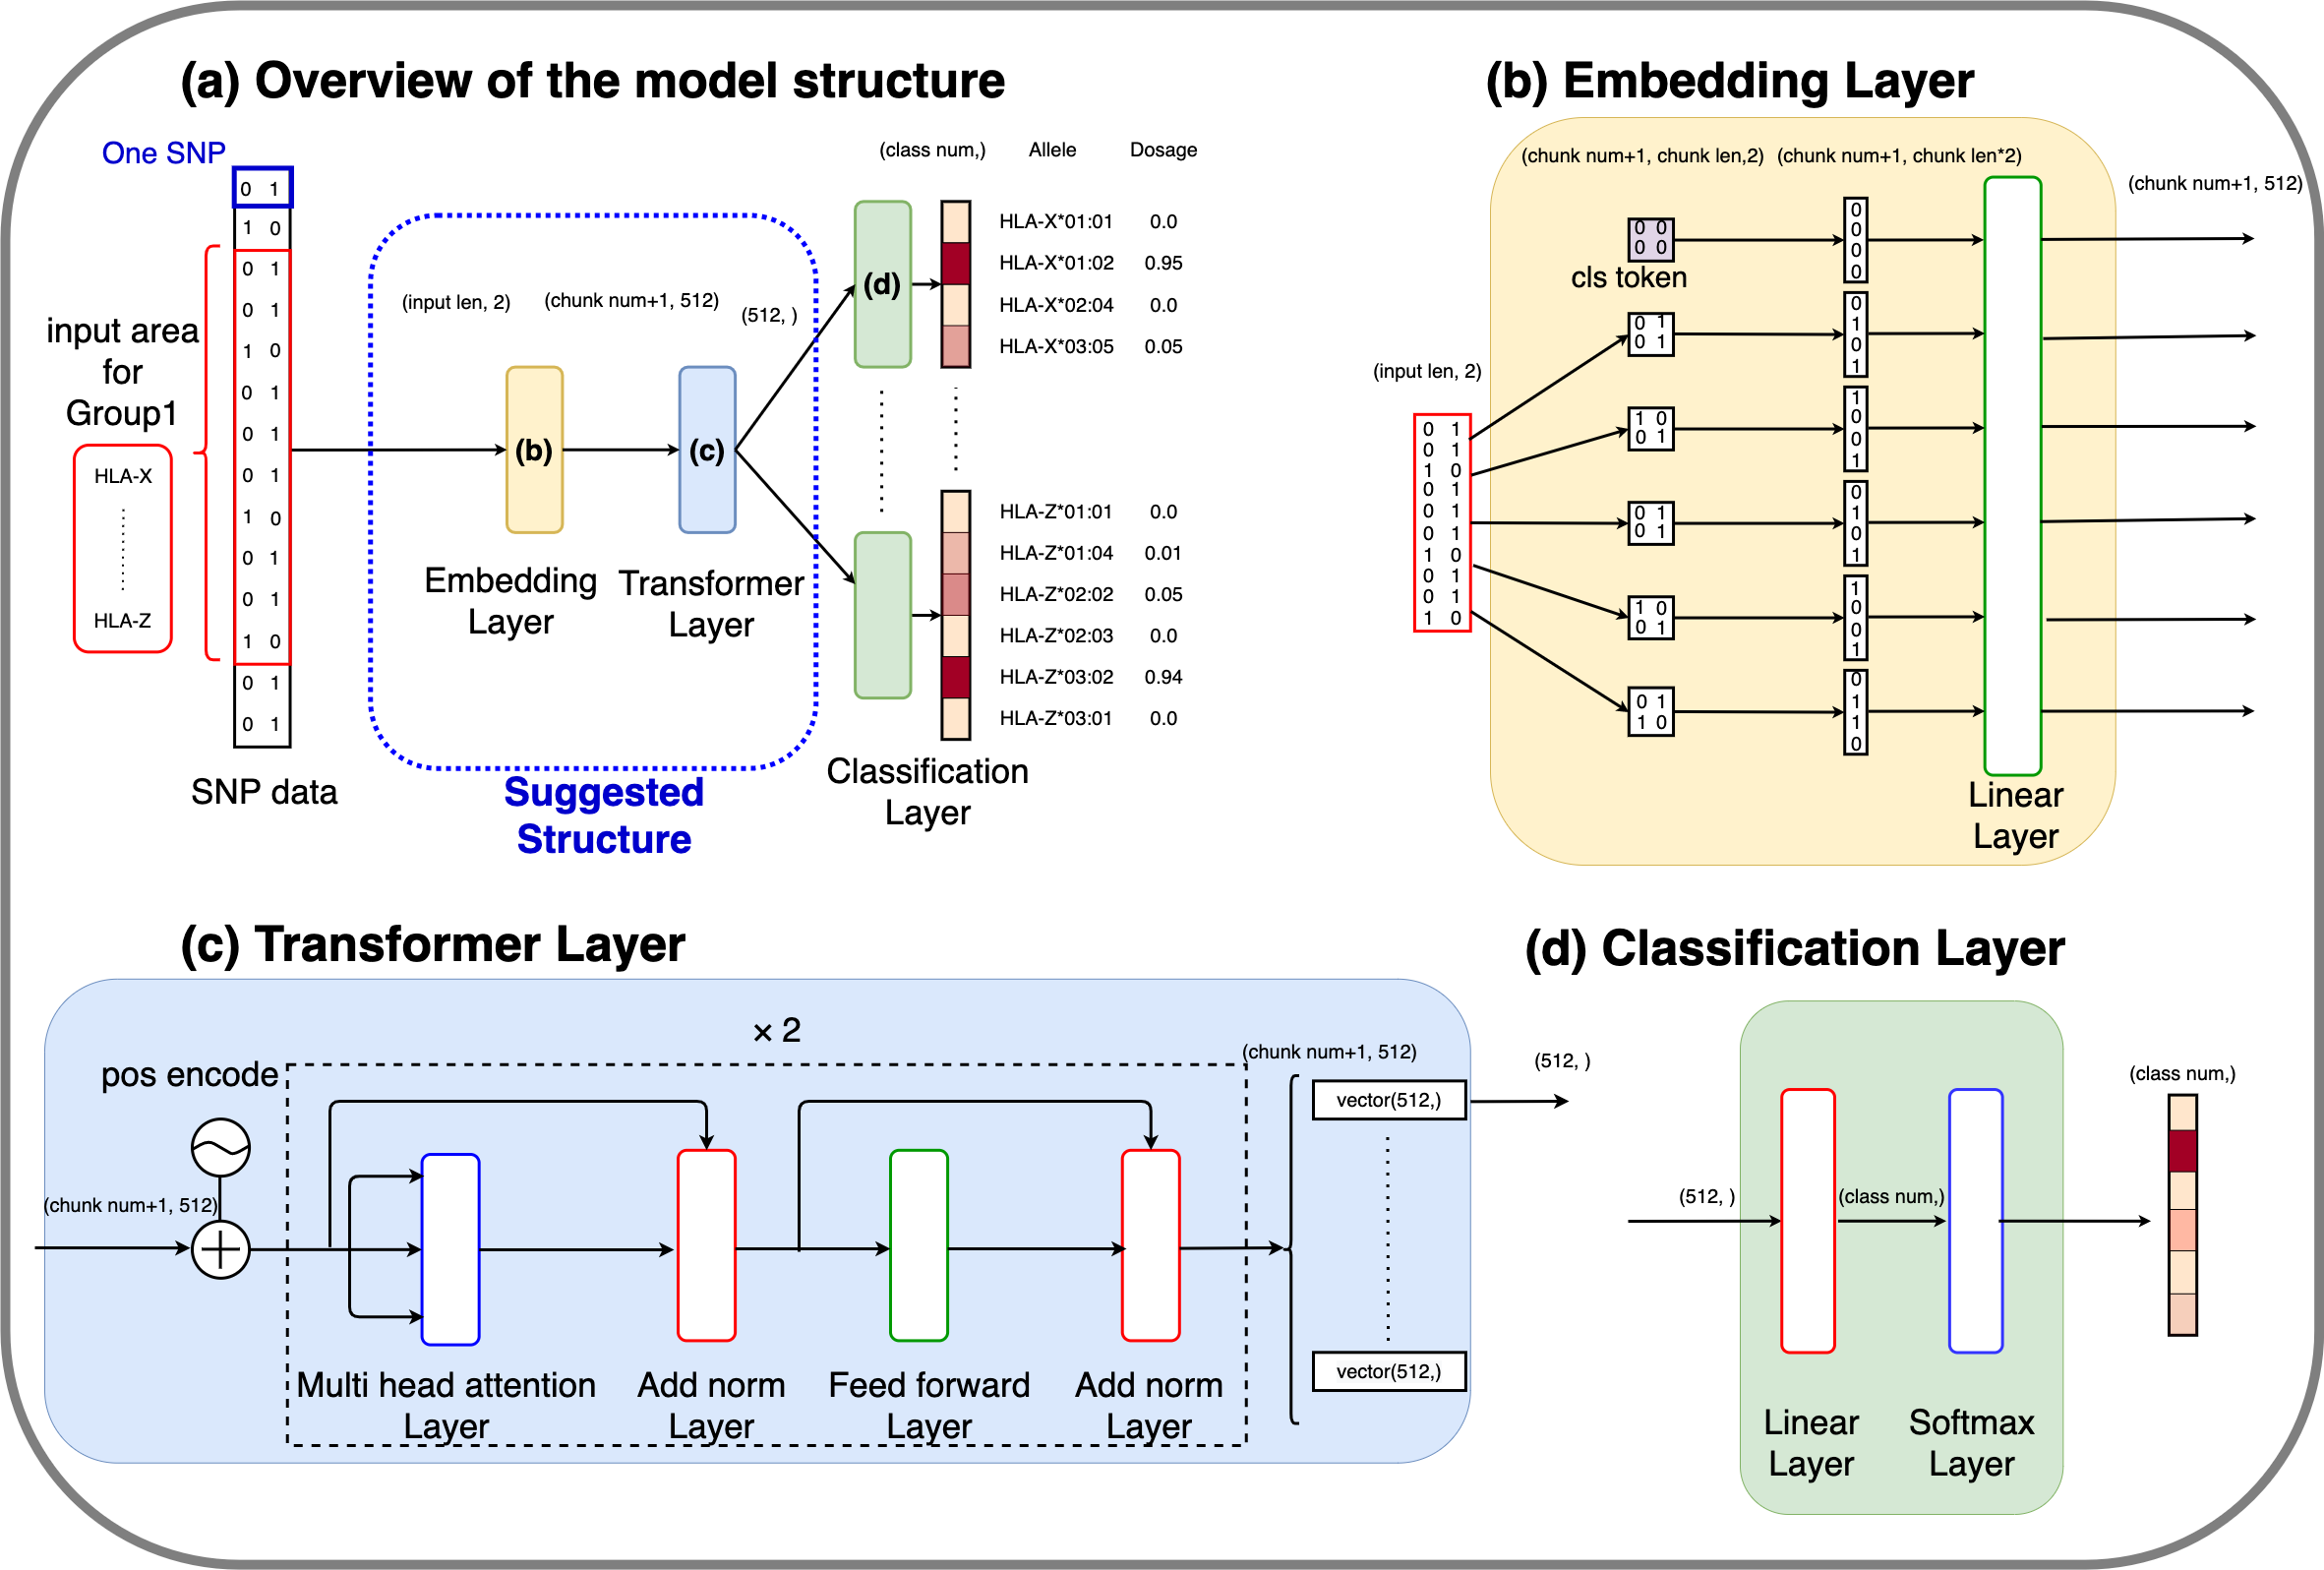
Architectures.
We modified the CNN part of DEEP*HLA into Transformer-based model (the blue dotted line in Figure 1, i.e., Embedding Layer and Transformer Layer). Specific parameters and their values are listed in Appendix I.
HLA genes are divided into groups according to LD structure and physical distance as in DEEP*HLA; (1)HLA-A, (2)HLA-C, HLA-B, (3)HLA-DRB1, HLA-DQA1, HLA-DQB1 and (4)HLA-DPA1, HLA-DPB1, and genes in each group are imputed simultaneously. Therefore, the hyperparameters of the models are the same except for the number of outputs, but the weights trained are different for each group. For each group, the model takes the input of each haplotype SNP genotype from pre-phased data, which are expressed by two-dimensional vectors. The SNPs are expressed by 01 or 10 based on whether each base is consistent with a reference or alternative one. The range of SNPs used for training in each group is the same as DEEP*HLA; 500kbps each.
Embedding Layer (Figure 1 (b)) consolidates the neighboring SNPs together to divide them into 50 chunks, and adds a classification (cls) token at the head of SNPs to learn the features. The cls token has the same shape as a single chunk, and its elements are all zeros. Then a common linear layer projects SNPs to the size of (51, 512).
Transformer Layer (Figure 1 (c)) applies positional encoding and the encoder portion of Transformer to the data, after which the feature vector of cls token is extracted.
Classification Layer (Figure 1 (d)), which is prepared for each HLA gene, is a combination of a linear layer and a softmax layer. Output dimension of the layer is the same as the number of alleles the HLA gene has. Output values are imputation dosages for the alleles, each of which takes a value from 0.0 to 1.0 that should be 1.0 when summed up.
Datasets.
We used Pan-Asian reference panel (Pillai et al., 2014; Okada et al., 2014) and Type 1 Diabetes Genetics Consortium (T1DGC) reference panel (Han et al., 2014). Both panels were genotyped using Illumina Immunochip and contain 4-digit resolution typing data of eight classical HLA genes based on SSO method; HLA-A, HLA-B, HLA-C, HLA-DRB1, HLA-DQA1, HLA-DQB1, HLA-DPA1, and HLA-DPB1. Both were distributed with Beagle format in a phased condition. Pan-Asian reference panel contains 530 unrelated individuals, i.e. 1060 haplotypes, of Asian ancestry. T1DGC reference panel contains 5225 unrelated individuals, i.e.10450 haplotypes, of European ancestry.
Training.
In the training, as with DEEP*HLA, we adopted hierarchical fine-tuning, in which the parameters for classifying 2-digit alleles were transferred to the model for 4-digit alleles. This allowed the model to take advantage of the hierarchical nature of HLA alleles. We only used SNP data for training and evaluation, and removed other information from the reference panel. We used Cross Entropy Loss as a loss function and Adam to optimize the loss. The Cross Entropy Loss is expressed by the following equation, where indicates correct output that should be 0 or 1, indicates the output of softmax layer, and indicates the number of classes.
We used 10 percent of the training data as validation data for early stopping and model updates during the training. The training flow is the same as in DEEP*HLA (Appendix G).
Evaluation.
In the experiments, we used 4 indices for the evaluations; , PPV, sensitivity, and probability, values of which were calculated for each allele.
represents Pearson’s product moment correlation coefficient between imputed and typed dosages and is expressed as follows;
![[Uncaptioned image]](/html/2211.06430/assets/r2fig.png)
where is the number of individuals (i.e. is the number of haplotypes), is the type of allele (eg. HLA-A*01:23), is the imputed dosage of allele for haplotype , which is obtained from the output of the softmax layer, and is the typed dosage of allele for haplotype , taking values 1 if haplotype has allele and otherwise 0.
Sensitivity() represents the percentage of haplotypes that were correctly imputed to have allele in all the haplotypes that have allele, and PPV() represents the percentage of haplotypes with allele in all the haplotypes predicted to have allele (Naito et al., 2021).
Probability() represents the imputed dosage of allele for each haplotype with allele, and is expressed as follows;
where represents the number of haplotypes with allele.
3 Results
3.1 Experiment 1
We first performed a five-part cross-validation for Pan-Asian reference panel, T1DGC reference panel, and the mixture of the two panels (2/Datasets).
When creating the mixed panel, we randomly selected the same number of individuals included in Pan-Asian reference panel from T1DGC counterpart.
Thus, the number of individuals included in the mixed panel became 1060. We divided the data into 5 parts for the cross-validation and used 10 percent of the non-test data as validation data during the training (2/Training).
Using HLARIMNT and DEEP*HLA, we performed imputations of 4-digit alleles for eight HLA genes (2/Datasets). Then, we calculated the accuracy for each allele as four indices; , PPV, sensitivity, and probability (2/Evaluation). Finally we compared the average of each indice between the two methods (2/Architectures).
HLARIMNT performed better in general.
| Dataset | Indices | DEEP*HLA | HLARIMNT |
|---|---|---|---|
| Pan-Asian | 0.795 | 0.850 | |
| PPV | 0.844 | 0.865 | |
| sensitivity | 0.773 | 0.820 | |
| probability | 0.771 | 0.784 | |
| T1DGC | 0.823 | 0.839 | |
| PPV | 0.897 | 0.881 | |
| sensitivity | 0.786 | 0.804 | |
| probability | 0.786 | 0.794 | |
| Mixed | 0.795 | 0.830 | |
| PPV | 0.862 | 0.870 | |
| sensitivity | 0.761 | 0.797 | |
| probability | 0.761 | 0.778 |
Table 1 shows the average imputation accuracy of all 4-digit alleles. Confidence intervals for the each test data are provided in Appendix E and the weighted average values by allele frequency are provided in Appendix D.
HLARIMNT achieved higher accuracy in the 4 indices on all the reference panels, although PPV in T1DGC reference panel was a little higher for DEEP*HLA.
Average imputation accuracy for 4-digit alleles in each HLA gene is showed in Figure 7 of Appendix H. HLARIMNT generally showed advantages for almost all of the genes in all of the three reference panels, with some exceptions depending on the combination of genes, reference panels, and indices.
HLARIMNT outperformed for infrequent alleles.
| Dataset | Indices | DEEP*HLA | HLARIMNT |
|---|---|---|---|
| Pan-Asian | 0.583 | 0.685 | |
| PPV | 0.740 | 0.725 | |
| sensitivity | 0.447 | 0.553 | |
| probability | 0.446 | 0.502 | |
| T1DGC | 0.715 | 0.740 | |
| PPV | 0.834 | 0.805 | |
| sensitivity | 0.649 | 0.678 | |
| probability | 0.649 | 0.665 | |
| Mixed | 0.628 | 0.681 | |
| PPV | 0.762 | 0.768 | |
| sensitivity | 0.531 | 0.600 | |
| probability | 0.530 | 0.577 |
Table 2 shows the average imputation accuracy for 4-digit alleles that have frequencies less than 0.01. Confidence intervals for each test data are provided in Appendix F and the weighted average values by allele frequency are listed in Appendix D. As for all alleles, HLARIMNT outperformed the accuracy of DEEP*HLA, except for PPV of Pan-Asian and T1DGC reference penel. Even more noteworthy is the magnitude of the difference in accuracy between the two methods. The superiority of HLARIMNT for infrequent alleles was greater than that of for all alleles.
Average imputation accuracy of 4-digit alleles for each allele frequency is showed in Figure 8 of Appendix H. The superiority of HLARIMNT was more noticeable for alleles with lower frequencies.
3.2 Experiment 2
We performed a five-part cross-validation for T1DGC reference panel, the training data of which consisted of various numbers of individuals; 530, 1300, 2600, and 4180. We randomly selected data of these numbers from T1DGC reference panel for training. The test data used for evaluation was the same regardless of the training data size. The data splitting for this experiment is described in detail in Appendix C. We used the same four indices as in Experiment 1 for the evaluation.
HLARIMNT generally performed better in any training data numbers.
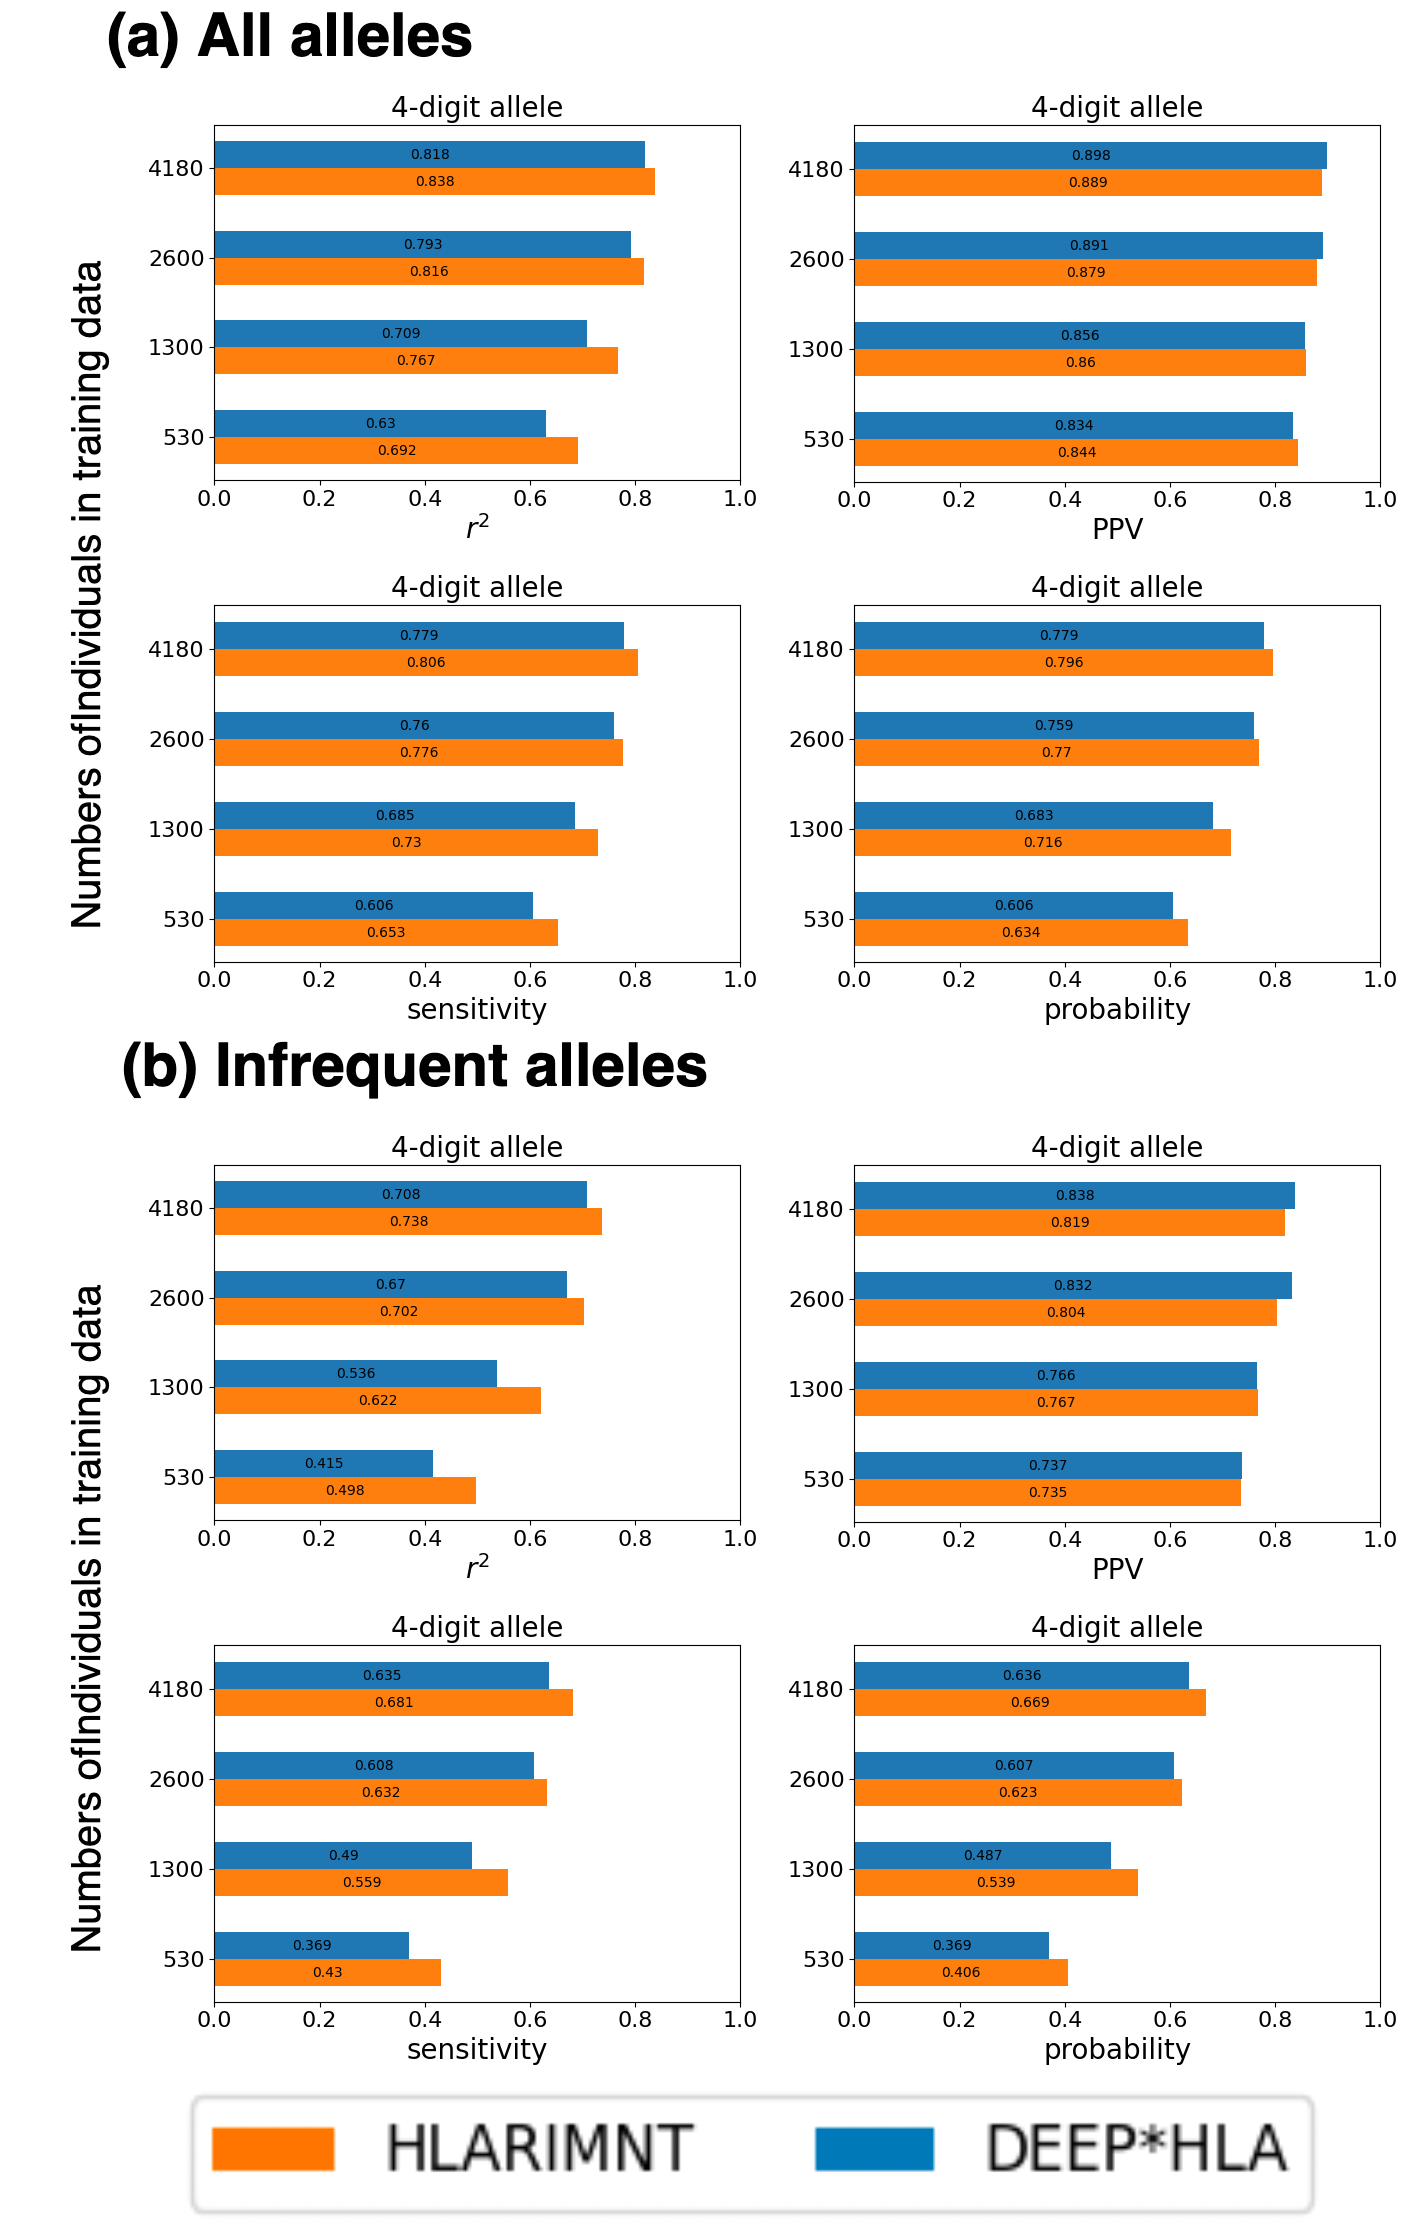
Figure 2 (a) shows the average accuracy for 4-digit alleles using various numbers of training data. The numbers in the bar graphs are the accuracy values that the graphs represent. The accuracy of HLARIMNT was higher than that of DEEP*HLA regardless of training data numbers, with the exception of PPV using relatively large sizes of training data. In addition, in all of the indices, the superiority of HLARIMNT to DEEP*HLA was more noticeable when the number of training data was smaller, although not completely in order. Even in PPV, HLARIMNT was superior to DEEP*HLA when the number of training data was relatively small.
HLARIMNT performed better for infrequent alleles in any training data numbers.
Figure 2 (b) shows the average accuracy for 4-digit alleles with frequencies less than 0.01. As with the previous results (3.2), HLARIMNT outperformed DEEP*HLA in all of the training data numbers, except for PPV. Also, there was the tendency that the advantage of HLARIMNT was more pronounced when the number of data for training was smaller.
4 Conclusion
As shown in Experiment 1 (3.1), HLARIMNT achieved higher accuracy than DEEP*HLA in all of the three reference panels, especially for infrequent alleles. In addition, as shown in Experiment 2 (3.2), HLARIMNT outperformed regardless of the size of data used for training.
The results of these two experiments suggest that HLARIMNT can perform HLA imputation efficiently, regardless of race and the size of available data. Further discussion is provided in Appendix J.
5 Data availability and ethical review
We used two HLA reference panels in this study. Both panels were distributed as a phased condition, and publicly available. Pan-Asian reference panel is downloadable with SNP2HLA software (http://software.broadinstitute.org/mpg/snp2hla/). T1DGC panel is available from the NIDDK Central Repository after the registration process (https://repository.niddk.nih.gov/studies/t1dgc/). Since all data used in this study have already been published and are publicly available, the ethics committees of our institute have waived an ethical review.
References
- Adiwardana et al. (2020) Daniel Adiwardana, Minh-Thang Luong, David R. So, Jamie Hall, Noah Fiedel, Romal Thoppilan, Zi Yang, Apoorv Kulshreshtha, Gaurav Nemade, Yifeng Lu, and Quoc V. Le. Towards a human-like open-domain chatbot. 1 2020. URL http://arxiv.org/abs/2001.09977.
- Brown et al. (2020) Tom B. Brown, Benjamin Mann, Nick Ryder, Melanie Subbiah, Jared Kaplan, Prafulla Dhariwal, Arvind Neelakantan, Pranav Shyam, Girish Sastry, Amanda Askell, Sandhini Agarwal, Ariel Herbert-Voss, Gretchen Krueger, Tom Henighan, Rewon Child, Aditya Ramesh, Daniel M. Ziegler, Jeffrey Wu, Clemens Winter, Christopher Hesse, Mark Chen, Eric Sigler, Mateusz Litwin, Scott Gray, Benjamin Chess, Jack Clark, Christopher Berner, Sam McCandlish, Alec Radford, Ilya Sutskever, and Dario Amodei. Language models are few-shot learners. 5 2020. URL http://arxiv.org/abs/2005.14165.
- Cho et al. (2014) Kyunghyun Cho, Bart van Merrienboer, Caglar Gulcehre, Dzmitry Bahdanau, Fethi Bougares, Holger Schwenk, and Yoshua Bengio. Learning phrase representations using rnn encoder-decoder for statistical machine translation. 6 2014. URL http://arxiv.org/abs/1406.1078.
- Chu et al. (2022) Yanyi Chu, Yan Zhang, Qiankun Wang, Lingfeng Zhang, Xuhong Wang, Yanjing Wang, Dennis Russell Salahub, Qin Xu, Jianmin Wang, Xue Jiang, Yi Xiong, and Dong Qing Wei. A transformer-based model to predict peptide–hla class i binding and optimize mutated peptides for vaccine design. Nature Machine Intelligence, 4:300–311, 3 2022. ISSN 25225839. 10.1038/s42256-022-00459-7.
- Cook et al. (2021) Seungho Cook, Wanson Choi, Hyunjoon Lim, Yang Luo, Kunhee Kim, Xiaoming Jia, Soumya Raychaudhuri, and Buhm Han. Accurate imputation of human leukocyte antigens with cookhla. Nature Communications, 12, 12 2021. ISSN 20411723. 10.1038/s41467-021-21541-5.
- Dendrou et al. (2018) Calliope A. Dendrou, Jan Petersen, Jamie Rossjohn, and Lars Fugger. Hla variation and disease, 5 2018. ISSN 14741741.
- Dilthey et al. (2013) Alexander Dilthey, Stephen Leslie, Loukas Moutsianas, Judong Shen, Charles Cox, Matthew R. Nelson, and Gil McVean. Multi-population classical hla type imputation. PLoS Computational Biology, 9, 2 2013. ISSN 1553734X. 10.1371/journal.pcbi.1002877.
- Dilthey et al. (2011) Alexander T. Dilthey, Loukas Moutsianas, Stephen Leslie, and Gil McVean. Hla*imp-an integrated framework for imputing classical hla alleles from snp genotypes. Bioinformatics, 27:968–972, 4 2011. ISSN 13674803. 10.1093/bioinformatics/btr061.
- Dosovitskiy et al. (2020) Alexey Dosovitskiy, Lucas Beyer, Alexander Kolesnikov, Dirk Weissenborn, Xiaohua Zhai, Thomas Unterthiner, Mostafa Dehghani, Matthias Minderer, Georg Heigold, Sylvain Gelly, Jakob Uszkoreit, and Neil Houlsby. An image is worth 16x16 words: Transformers for image recognition at scale. 10 2020. URL http://arxiv.org/abs/2010.11929.
- Egger et al. (2022) Jan Egger, Christina Gsaxner, Antonio Pepe, Kelsey L. Pomykala, Frederic Jonske, Manuel Kurz, Jianning Li, and Jens Kleesiek. Medical deep learning—a systematic meta-review. Computer Methods and Programs in Biomedicine, 221:106874, 6 2022. ISSN 01692607. 10.1016/j.cmpb.2022.106874.
- Erlich (2012) H. Erlich. Hla dna typing: Past, present, and future, 7 2012. ISSN 00012815.
- Gourraud et al. (2014) Pierre Antoine Gourraud, Pouya Khankhanian, Nezih Cereb, Soo Young Yang, Michael Feolo, Martin Maiers, John D. Rioux, Stephen Hauser, and Jorge Oksenberg. Hla diversity in the 1000 genomes dataset. PLoS ONE, 9, 7 2014. ISSN 19326203. 10.1371/journal.pone.0097282.
- Halevy et al. (2008) Sima Halevy, Pierre-Dominique Ghislain, Maja Mockenhaupt, Jean-Paul Fagot, Jan Nico Bouwes Bavinck, Alexis Sidoroff, Luigi Naldi, Ariane Dunant, Cecile Viboud, and Jean-Claude Roujeau. Allopurinol is the most common cause of stevens-johnson syndrome and toxic epidermal necrolysis in europe and israel. Journal of the American Academy of Dermatology, 58(1):25–32, 2008. ISSN 0190-9622. https://doi.org/10.1016/j.jaad.2007.08.036. URL https://www.sciencedirect.com/science/article/pii/S0190962207013217.
- Han et al. (2014) Buhm Han, Dorothée Diogo, Steve Eyre, Henrik Kallberg, Alexandra Zhernakova, John Bowes, Leonid Padyukov, Yukinori Okada, Miguel A. González-Gay, Solbritt Rantapää-Dahlqvist, Javier Martin, Tom W.J. Huizinga, Robert M. Plenge, Jane Worthington, Peter K. Gregersen, Lars Klareskog, Paul I.W. De Bakker, and Soumya Raychaudhuri. Fine mapping seronegative and seropositive rheumatoid arthritis to shared and distinct hla alleles by adjusting for the effects of heterogeneity. American Journal of Human Genetics, 94:522–532, 4 2014. ISSN 15376605. 10.1016/j.ajhg.2014.02.013.
- Hirata et al. (2019) Jun Hirata, Kazuyoshi Hosomichi, Saori Sakaue, Masahiro Kanai, Hirofumi Nakaoka, Kazuyoshi Ishigaki, Ken Suzuki, Masato Akiyama, Toshihiro Kishikawa, Kotaro Ogawa, Tatsuo Masuda, Kenichi Yamamoto, Makoto Hirata, Koichi Matsuda, Yukihide Momozawa, Ituro Inoue, Michiaki Kubo, Yoichiro Kamatani, and Yukinori Okada. Genetic and phenotypic landscape of the major histocompatibilty complex region in the japanese population. Nature Genetics, 51:470–480, 3 2019. ISSN 15461718. 10.1038/s41588-018-0336-0.
- Hu et al. (2015) Xinli Hu, Aaron J. Deutsch, Tobias L. Lenz, Suna Onengut-Gumuscu, Buhm Han, Wei Min Chen, Joanna M.M. Howson, John A. Todd, Paul I.W. De Bakker, Stephen S. Rich, and Soumya Raychaudhuri. Additive and interaction effects at three amino acid positions in hla-dq and hla-dr molecules drive type 1 diabetes risk. Nature Genetics, 47:898–905, 8 2015. ISSN 15461718. 10.1038/ng.3353.
- Huang et al. (2018) Cheng-Zhi Anna Huang, Ashish Vaswani, Jakob Uszkoreit, Noam Shazeer, Ian Simon, Curtis Hawthorne, Andrew M. Dai, Matthew D. Hoffman, Monica Dinculescu, and Douglas Eck. Music transformer. 9 2018. URL http://arxiv.org/abs/1809.04281.
- Jia et al. (2013) Xiaoming Jia, Buhm Han, Suna Onengut-Gumuscu, Wei Min Chen, Patrick J. Concannon, Stephen S. Rich, Soumya Raychaudhuri, and Paul I.W. de Bakker. Imputing amino acid polymorphisms in human leukocyte antigens. PLoS ONE, 8, 6 2013. ISSN 19326203. 10.1371/journal.pone.0064683.
- Jumper et al. (2021) John Jumper, Richard Evans, Alexander Pritzel, Tim Green, Michael Figurnov, Olaf Ronneberger, Kathryn Tunyasuvunakool, Russ Bates, Augustin Žídek, Anna Potapenko, Alex Bridgland, Clemens Meyer, Simon A.A. Kohl, Andrew J. Ballard, Andrew Cowie, Bernardino Romera-Paredes, Stanislav Nikolov, Rishub Jain, Jonas Adler, Trevor Back, Stig Petersen, David Reiman, Ellen Clancy, Michal Zielinski, Martin Steinegger, Michalina Pacholska, Tamas Berghammer, Sebastian Bodenstein, David Silver, Oriol Vinyals, Andrew W. Senior, Koray Kavukcuoglu, Pushmeet Kohli, and Demis Hassabis. Highly accurate protein structure prediction with alphafold. Nature, 596:583–589, 8 2021. ISSN 14764687. 10.1038/s41586-021-03819-2.
- Kawabata et al. (2009) Y. Kawabata, H. Ikegami, T. Awata, A. Imagawa, T. Maruyama, E. Kawasaki, S. Tanaka, A. Shimada, H. Osawa, T. Kobayashi, T. Hanafusa, K. Tokunaga, and H. Makino. Differential association of hla with three subtypes of type 1 diabetes: Fulminant, slowly progressive and acute-onset. Diabetologia, 52:2513–2521, 12 2009. ISSN 0012186X. 10.1007/s00125-009-1539-9.
- Ko et al. (2015) Tai Ming Ko, Chang Youh Tsai, Shih Yang Chen, Kuo Shu Chen, Kuang Hui Yu, Chih Sheng Chu, Chung Ming Huang, Chrong Reen Wang, Chia Tse Weng, Chia Li Yu, Song Chou Hsieh, Jer Chia Tsai, Wen Ter Lai, Wen Chan Tsai, Guang Dar Yin, Tsan Teng Ou, Kai Hung Cheng, Jeng Hsien Yen, Teh Ling Liou, Tsung Hsien Lin, Der Yuan Chen, Pi Jung Hsiao, Meng Yu Weng, Yi Ming Chen, Chen Hung Chen, Ming Fei Liu, Hsueh Wei Yen, Jia Jung Lee, Mei Chuan Kuo, Chen Ching Wu, Shih Yuan Hung, Shue Fen Luo, Ya Hui Yang, Hui Ping Chuang, Yi Chun Chou, Hung Ting Liao, Chia Wen Wang, Chun Lin Huang, Chia Shuo Chang, Ming Ta Michael Lee, Pei Chen, Chih Shung Wong, Chien Hsiun Chen, Jer Yuarn Wu, Yuan Tsong Chen, and Chen Yang Shen. Use of hla-b 58:01genotyping to prevent allopurinol induced severe cutaneous adverse reactions in taiwan: National prospective cohort study. BMJ (Online), 351, 9 2015. ISSN 17561833. 10.1136/bmj.h4848.
- Kojima et al. (2020) Kaname Kojima, Shu Tadaka, Fumiki Katsuoka, Gen Tamiya, Masayuki Yamamoto, and Kengo Kinoshita. A genotype imputation method for de-identified haplotype reference information by using recurrent neural network. PLoS Computational Biology, 16, 10 2020. ISSN 15537358. 10.1371/journal.pcbi.1008207.
- Leslie et al. (2008) Stephen Leslie, Peter Donnelly, and Gil McVean. A statistical method for predicting classical hla alleles from snp data. American Journal of Human Genetics, 82:48–56, 1 2008. ISSN 00029297. 10.1016/j.ajhg.2007.09.001.
- (24) Na Li and Matthew Stephens. Modeling linkage disequilibrium and identifying recombination hotspots using single-nucleotide polymorphism data tering of recombination events in the ancestry of the.
- Naito et al. (2021) Tatsuhiko Naito, Ken Suzuki, Jun Hirata, Yoichiro Kamatani, Koichi Matsuda, Tatsushi Toda, and Yukinori Okada. A deep learning method for hla imputation and trans-ethnic mhc fine-mapping of type 1 diabetes. Nature Communications, 12, 12 2021. ISSN 20411723. 10.1038/s41467-021-21975-x.
- Okada et al. (2014) Yukinori Okada, Kwangwoo Kim, Buhm Han, Nisha E. Pillai, Rick T.H. Ong, Woei Yuh Saw, Ma Luo, Lei Jiang, Jian Yin, So Young Bang, Hye Soon Lee, Matthew A. Brown, Sang Cheol Bae, Huji Xu, Yik Ying Teo, Paul I.W. de Bakker, and Soumya Raychaudhuri. Risk for acpa-positive rheumatoid arthritis is driven by shared hla amino acid polymorphisms in asian and european populations. Human molecular genetics, 23:6916–6926, 12 2014. ISSN 14602083. 10.1093/hmg/ddu387.
- Okada et al. (2015) Yukinori Okada, Yukihide Momozawa, Kyota Ashikawa, Masahiro Kanai, Koichi Matsuda, Yoichiro Kamatani, Atsushi Takahashi, and Michiaki Kubo. Construction of a population-specific hla imputation reference panel and its application to graves’ disease risk in japanese. Nature Genetics, 47:798–802, 6 2015. ISSN 15461718. 10.1038/ng.3310.
- Pereyra et al. (2010) Florencia Pereyra, Xiaoming Jia, Paul J. McLaren, Amalio Telenti, Paul I.W. de Bakker, Bruce D. Walker, Stephan Ripke, Chanson J. Brumme, Sara L. Pulit, Mary Carrington, Carl M. Kadie, Jonathan M. Carlson, David Heckerman, Robert R. Graham, Robert M. Plenge, Steven G. Deeks, Lauren Gianniny, Gabriel Crawford, Jordan Sullivan, Elena Gonzalez, Leela Davies, Amy Camargo, Jamie M. Moore, Nicole Beattie, Supriya Gupta, Andrew Crenshaw, Noël P. Burtt, Candace Guiducci, Namrata Gupta, Xiaojiang Gao, Ying Qi, Yuko Yuki, Alicja Piechocka-Trocha, Emily Cutrell, Rachel Rosenberg, Kristin L. Moss, Paul Lemay, Jessica O’leary, Todd Schaefer, Pranshu Verma, Ildiko Toth, Brian Block, Brett Baker, Alissa Rothchild, Jeffrey Lian, Jacqueline Proudfoot, Donna Marie L. Alvino, Seanna Vine, Marylyn M. Addo, Todd M. Allen, Marcus Altfeld, Matthew R. Henn, Sylvie Le Gall, Hendrik Streeck, David W. Haas, Daniel R. Kuritzkes, Gregory K. Robbins, Robert W. Shafer, Roy M. Gulick, Cecilia M. Shikuma, Richard Haubrich, Sharon Riddler, Paul E. Sax, Eric S. Daar, Heather J. Ribaudo, Brian Agan, Shanu Agarwal, Richard L. Ahern, Brady L. Allen, Sherly Altidor, Eric L. Altschuler, Sujata Ambardar, Kathryn Anastos, Ben Anderson, Val Anderson, Ushan Andrady, Diana Antoniskis, David Bangsberg, Daniel Barbaro, William Barrie, J. Bartczak, Simon Barton, Patricia Basden, Nesli Basgoz, Suzane Bazner, Nicholaos C. Bellos, Anne M. Benson, Judith Berger, Nicole F. Bernard, Annette M. Bernard, Christopher Birch, Stanley J. Bodner, Robert K. Bolan, Emilie T. Boudreaux, Meg Bradley, James F. Braun, Jon E. Brndjar, Stephen J. Brown, Katherine Brown, Sheldon T. Brown, Jedidiah Burack, Larry M. Bush, Virginia Cafaro, Omobolaji Campbell, John Campbell, Robert H. Carlson, J. Kevin Carmichael, Kathleen K. Casey, Chris Cavacuiti, Gregory Celestin, Steven T. Chambers, Nancy Chez, Lisa M. Chirch, Paul J. Cimoch, Daniel Cohen, Lillian E. Cohn, Brian Conway, David A. Cooper, Brian Cornelson, David T. Cox, Michael V. Cristofano, George Cuchural, Julie L. Czartoski, Joseph M. Dahman, Jennifer S. Daly, Benjamin T. Davis, Kristine Davis, Sheila M. Davod, Edwin Dejesus, Craig A. Dietz, Eleanor Dunham, Michael E. Dunn, Todd B. Ellerin, Joseph J. Eron, John J.W. Fangman, Claire E. Farel, Helen Ferlazzo, Sarah Fidler, Anita Fleenor-Ford, Renee Frankel, Kenneth A. Freedberg, Neel K. French, Jonathan D. Fuchs, Jon D. Fuller, Jonna Gaberman, Joel E. Gallant, Rajesh T. Gandhi, Efrain Garcia, Donald Garmon, Joseph C. Gathe, Cyril R. Gaultier, Wondwoosen Gebre, Frank D. Gilman, Ian Gilson, Paul A. Goepfert, Michael S. Gottlieb, Claudia Goulston, Richard K. Groger, T. Douglas Gurley, Stuart Haber, Robin Hardwicke, W. David Hardy, P. Richard Harrigan, Trevor N. Hawkins, Sonya Heath, Frederick M. Hecht, W. Keith Henry, Melissa Hladek, Robert P. Hoffman, James M. Horton, Ricky K. Hsu, Gregory D. Huhn, Peter Hunt, Mark J. Hupert, Mark L. Illeman, Hans Jaeger, Robert M. Jellinger, Mina John, Jennifer A. Johnson, Kristin L. Johnson, Heather Johnson, Kay Johnson, Jennifer Joly, Wilbert C. Jordan, Carol A. Kauffman, Homayoon Khanlou, Robert K. Killian, Arthur Y. Kim, David D. Kim, Clifford A. Kinder, Jeffrey T. Kirchner, Laura Kogelman, Erna Milunka Kojic, P. Todd Korthuis, Wayne Kurisu, Douglas S. Kwon, Melissa Lamar, Harry Lampiris, Massimiliano Lanzafame, Michael M. Lederman, David M. Lee, Jean M.L. Lee, Marah J. Lee, Edward T.Y. Lee, Janice Lemoine, Jay A. Levy, Josep M. Llibre, Michael A. Liguori, Susan J. Little, Anne Y. Liu, Alvaro J. Lopez, Mono R. Loutfy, Dawn Loy, Debbie Y. Mohammed, Alan Man, Michael K. Mansour, Vincent C. Marconi, Martin Markowitz, Rui Marques, Jeffrey N. Martin, Harold L. Martin, Kenneth Hugh Mayer, M. Juliana McElrath, Theresa A. McGhee, Barbara H. McGovern, Katherine McGowan, Dawn McIntyre, Gavin X. McLeod, Prema Menezes, Greg Mesa, Craig E. Metroka, Dirk Meyer-Olson, Andy O. Miller, Kate Montgomery, Karam C. Mounzer, Ellen H. Nagami, Iris Nagin, Ronald G. Nahass, Margret O. Nelson, Craig Nielsen, David L. Norene, David H. O’connor, Bisola O. Ojikutu, Jason Okulicz, Olakunle O. Oladehin, Edward C. Oldfield, Susan A. Olender, Mario Ostrowski, William F. Owen, Eunice Pae, Jeffrey Parsonnet, Andrew M. Pavlatos, Aaron M. Perlmutter, Michael N. Pierce, Jonathan M. Pincus, Leandro Pisani, Lawrence Jay Price, Laurie Proia, Richard C. Prokesch, Heather Calderon Pujet, Moti Ramgopal, Almas Rathod, Michael Rausch, J. Ravishankar, Frank S. Rhame, Constance Shamuyarira Richards, Douglas D. Richman, Berta Rodes, Milagros Rodriguez, Richard C. Rose, Eric S. Rosenberg, Daniel Rosenthal, Polly E. Ross, David S. Rubin, Elease Rumbaugh, Luis Saenz, Michelle R. Salvaggio, William C. Sanchez, Veeraf M. Sanjana, Steven Santiago, Wolfgang Schmidt, Hanneke Schuitemaker, Philip M. Sestak, Peter Shalit, William Shay, Vivian N. Shirvani, Vanessa I. Silebi, James M. Sizemore, Paul R. Skolnik, Marcia Sokol-Anderson, James M. Sosman, Paul Stabile, Jack T. Stapleton, Sheree Starrett, Francine Stein, Hans Jurgen Stellbrink, F. Lisa Sterman, Valerie E. Stone, David R. Stone, Giuseppe Tambussi, Randy A. Taplitz, Ellen M. Tedaldi, William Theisen, Richard Torres, Lorraine Tosiello, Cecile Tremblay, Marc A. Tribble, Phuong D. Trinh, Alice Tsao, Peggy Ueda, Anthony Vaccaro, Emilia Valadas, Thanes J. Vanig, Isabel Vecino, Vilma M. Vega, Wenoah Veikley, Barbara H. Wade, Charles Walworth, Chingchai Wanidworanun, Douglas J. Ward, Daniel A. Warner, Robert D. Weber, Duncan Webster, Steve Weis, David A. Wheeler, David J. White, Ed Wilkins, Alan Winston, Clifford G. Wlodaver, Angelique Van’T Wout, David P. Wright, Otto O. Yang, David L. Yurdin, Brandon W. Zabukovic, Kimon C. Zachary, Beth Zeeman, and Meng Zhao. The major genetic determinants of hiv-1 control affect hla class i peptide presentation. Science, 330:1551–1557, 12 2010. ISSN 10959203. 10.1126/science.1195271.
- Pillai et al. (2014) Nisha Esakimuthu Pillai, Yukinori Okada, Woei Yuh Saw, Rick Twee Hee Ong, Xu Wang, Erwin Tantoso, Wenting Xu, Trevor A. Peterson, Thomas Bielawny, Mohammad Ali, Koon Yong Tay, Wan Ting Poh, Linda Wei Lin Tan, Seok Hwee Koo, Wei Yen Lim, Richie Soong, Markus Wenk, Soumya Raychaudhuri, Peter Little, Francis A. Plummer, Edmund J.D. Lee, Kee Seng Chia, Ma Luo, Paul I.W. De Bakker, and Yik Ying Teo. Predicting hla alleles from high-resolution snp data in three southeast asian populations. Human Molecular Genetics, 23:4443–4451, 2014. ISSN 14602083. 10.1093/hmg/ddu149.
- Ramesh et al. (2022) Aditya Ramesh, Prafulla Dhariwal, Alex Nichol, Casey Chu, and Mark Chen. Hierarchical text-conditional image generation with clip latents. 4 2022. URL http://arxiv.org/abs/2204.06125.
- Raychaudhuri et al. (2012) Soumya Raychaudhuri, Cynthia Sandor, Eli A. Stahl, Jan Freudenberg, Hye Soon Lee, Xiaoming Jia, Lars Alfredsson, Leonid Padyukov, Lars Klareskog, Jane Worthington, Katherine A. Siminovitch, Sang Cheol Bae, Robert M. Plenge, Peter K. Gregersen, and Paul I.W. De Bakker. Five amino acids in three hla proteins explain most of the association between mhc and seropositive rheumatoid arthritis. Nature Genetics, 44:291–296, 3 2012. ISSN 10614036. 10.1038/ng.1076.
- Saharia et al. (2022) Chitwan Saharia, William Chan, Saurabh Saxena, Lala Li, Jay Whang, Emily Denton, Seyed Kamyar Seyed Ghasemipour, Burcu Karagol Ayan, S. Sara Mahdavi, Rapha Gontijo Lopes, Tim Salimans, Jonathan Ho, David J Fleet, and Mohammad Norouzi. Photorealistic text-to-image diffusion models with deep language understanding. 5 2022. URL http://arxiv.org/abs/2205.11487.
- Schuster and Paliwal (1997) Mike Schuster and Kuldip K Paliwal. Bidirectional recurrent neural networks, 1997.
- Todd and Beir (1987) John A Todd and John I Beir. Hla-dqp gene contributes to susceptibility and resistance to insulin-dependent diabetes mellitus, 1987.
- Vaswani et al. (2017) Ashish Vaswani, Noam Shazeer, Niki Parmar, Jakob Uszkoreit, Llion Jones, Aidan N. Gomez, Lukasz Kaiser, and Illia Polosukhin. Attention is all you need. 6 2017. URL http://arxiv.org/abs/1706.03762.
- Wang et al. (2021) Peiqi Wang, Ruizhi Liao, Daniel Moyer, Seth Berkowitz, Steven Horng, and Polina Golland. Image classification with consistent supporting evidence. 11 2021. URL http://arxiv.org/abs/2111.07048.
- Zheng et al. (2014) X. Zheng, J. Shen, C. Cox, J. C. Wakefield, M. G. Ehm, M. R. Nelson, and B. S. Weir. Hibag - hla genotype imputation with attribute bagging. Pharmacogenomics Journal, 14:192–200, 2014. ISSN 14731150. 10.1038/tpj.2013.18.
Appendix A Imputation using bidirectional RNN
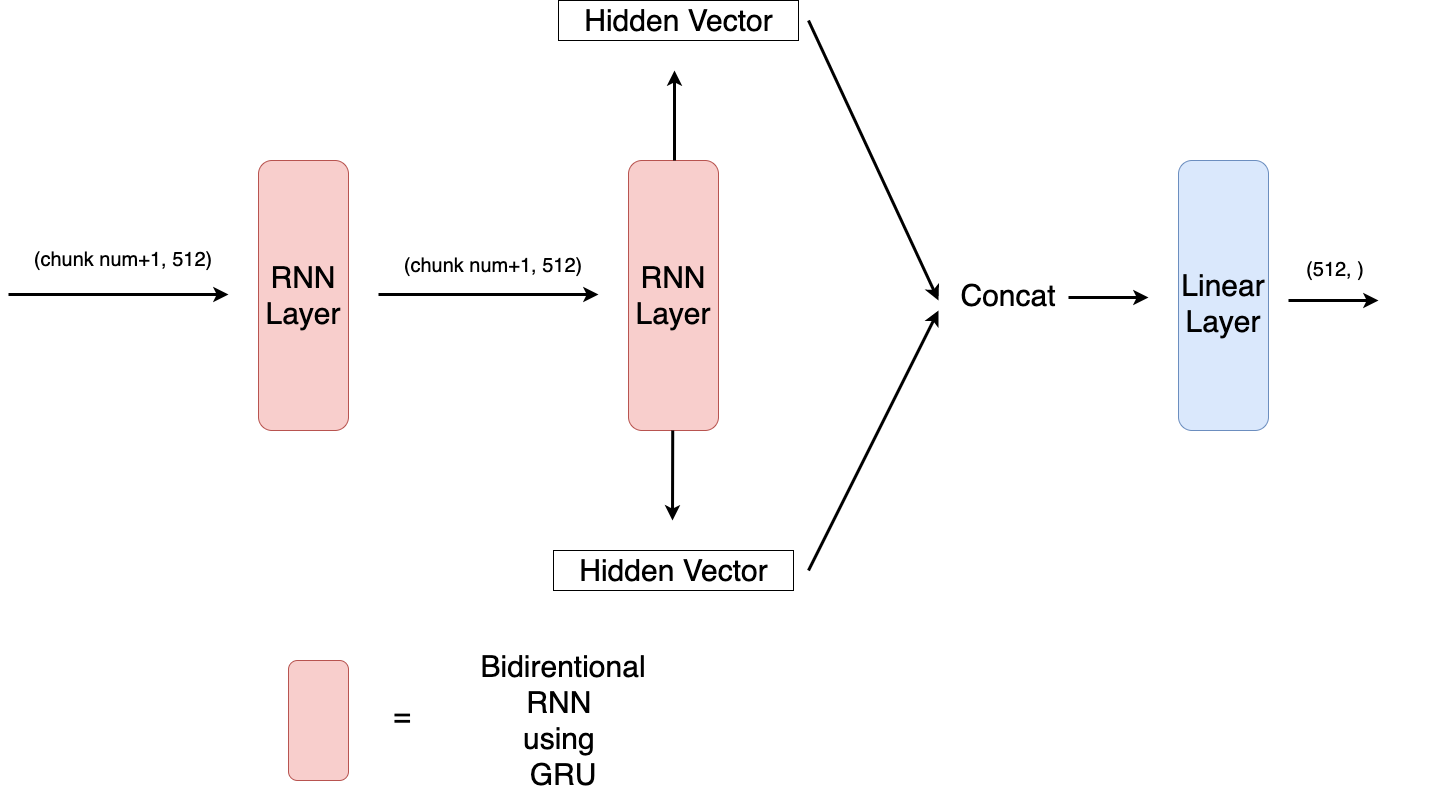
We also performed an imputation using a bidirectional RNN (Schuster and Paliwal, 1997) instead of Transformer. The structure was as shown in Figure 3; a modification of Figure 1 (c). In each of the bidirectional RNN layer, we used GRU for cells (Cho et al., 2014). We used Optuna to search the hyperparameters. We performed Experiment 1 (3.1) using Pan Asian reference panel, by the bidirectional RNN model. Figure 4 shows the results. The accuracy using the bidirectional RNN was not as good as either HLARIMNT or DEEP*HLA, regardless of allele frequency.
Appendix B Imputation using all SNPs in the reference panel
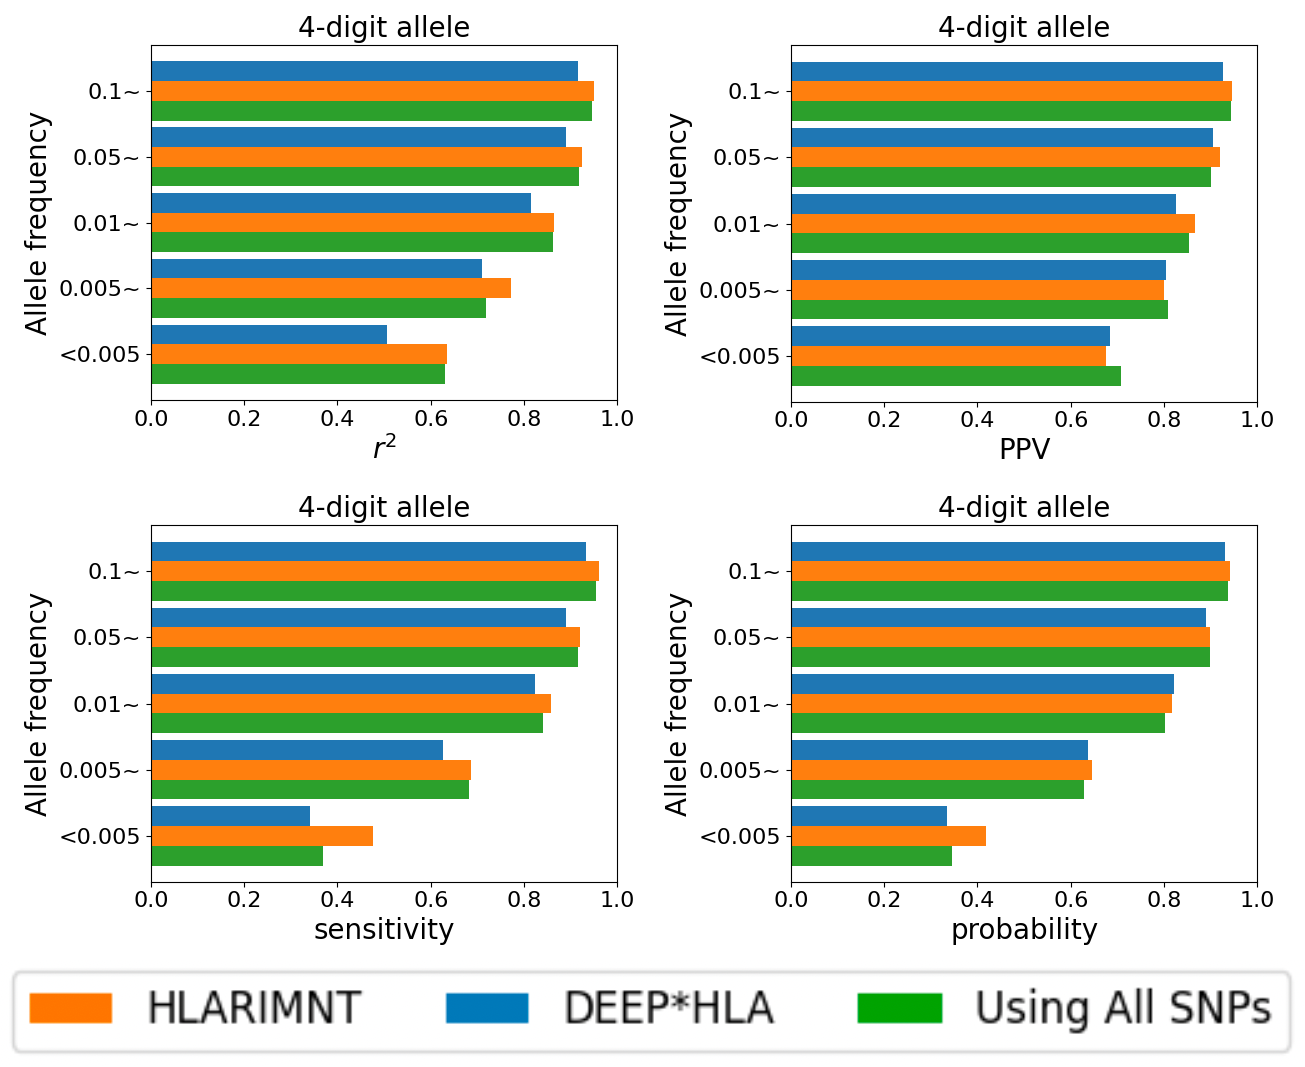
While the experiments in the main article used only some SNPs according to HLA genes, we also trained our model using all of the SNPs in Pan Asian reference panel. In this case, the number of SNPs used for training was about 5 to 6 times larger, depending on the gene. The result of Experiment 1 (3.1) under these conditions is shown in Figure 5. HLARIMNT trained using partial SNPs were generally more accurate than that of using all SNPs, although it varied by allele frequencies. However, PPV for infrequent alleles was higher in HLARIMNT using all SNPs, the accuracy of which was even higher than that of DEEP*HLA.
Appendix C Cross-validation in Experiment 2
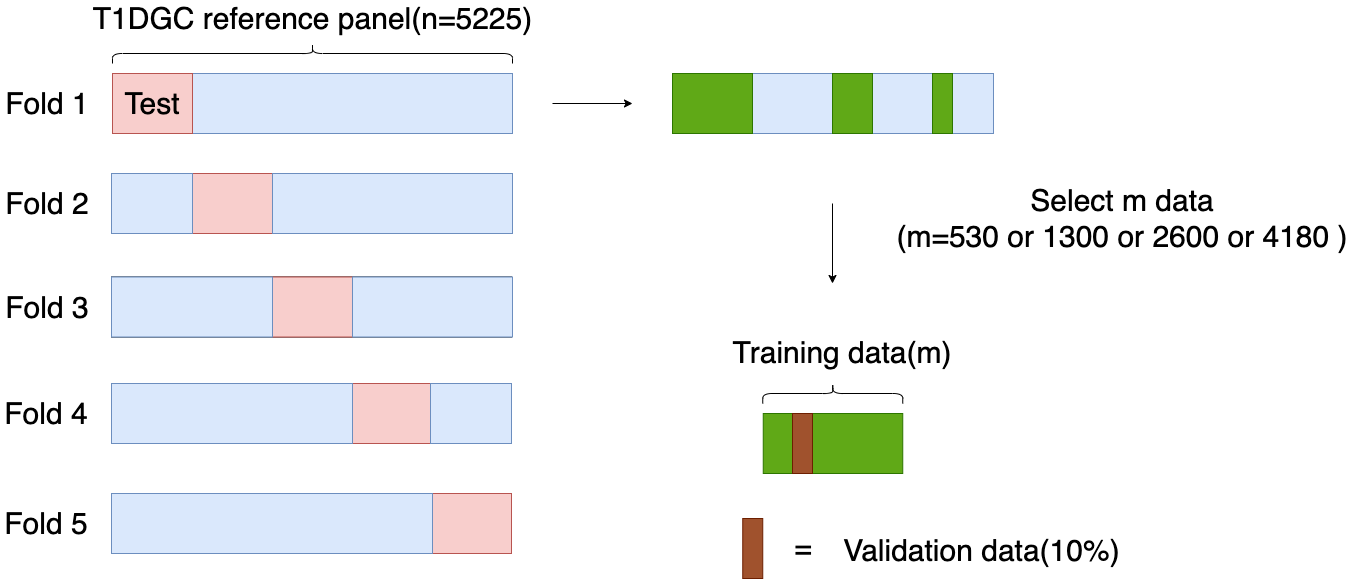
Here we describe the details of cross-validation performed in Experiment 2 of the main article (3.2). We first divided T1DGC reference panel into five parts. One partition was used as the test data for a single validation. From the remaining data, we randomly selected the data to be used for training. Here, we set the data used to train HLARIMNT and DEEP*HLA to be the same, which allowed a fair comparison of performance. We trained each model using the data selected for training, 10 percent of which was used for validation data for model updating and early stopping.
Appendix D The weighted average values by allele frequency in Experiment 1
D.1 For all alleles
In the main text we calculated a simple additive average for each allele, but here we post the weighted average values by allele frequency.
| DEEP*HLA | HLARIMNT | ||
|---|---|---|---|
| Pan-Asian | 0.886 | 0.925 | |
| PPV | 0.898 | 0.922 | |
| sensitivity | 0.897 | 0.927 | |
| probability | 0.896 | 0.903 | |
| T1DGC | 0.971 | 0.976 | |
| PPV | 0.976 | 0.975 | |
| sensitivity | 0.974 | 0.977 | |
| probability | 0.974 | 0.974 | |
| Mixed | 0.918 | 0.935 | |
| PPV | 0.927 | 0.935 | |
| sensitivity | 0.928 | 0.936 | |
| probability | 0.927 | 0.926 |
D.2 For infrequent alleles
| DEEP*HLA | HLARIMNT | ||
|---|---|---|---|
| Pan-Asian | 0.664 | 0.740 | |
| PPV | 0.781 | 0.759 | |
| sensitivity | 0.550 | 0.641 | |
| probability | 0.554 | 0.586 | |
| T1DGC | 0.852 | 0.866 | |
| PPV | 0.882 | 0.875 | |
| sensitivity | 0.840 | 0.842 | |
| probability | 0.838 | 0.831 | |
| Mixed | 0.736 | 0.777 | |
| PPV | 0.784 | 0.794 | |
| sensitivity | 0.698 | 0.733 | |
| probability | 0.696 | 0.706 |
Appendix E Confidence intervals for Experiment 1
Here we report 95% confidence intervals for each test data used in Experiment 1. The very wide confidence intervals are due to the fact that the accuracy varies extremely with the allele frequency, which makes the variance very large.
| DEEP*HLA | HLARIMNT | ||
|---|---|---|---|
| Pan-Asian | |||
| PPV | |||
| sensitivity | |||
| probability | |||
| T1DGC | |||
| PPV | |||
| sensitivity | |||
| probability | |||
| Mixed | |||
| PPV | |||
| sensitivity | |||
| probability |
| DEEP*HLA | HLARIMNT | ||
|---|---|---|---|
| Pan-Asian | |||
| PPV | |||
| sensitivity | |||
| probability | |||
| T1DGC | |||
| PPV | |||
| sensitivity | |||
| probability | |||
| Mixed | |||
| PPV | |||
| sensitivity | |||
| probability |
| DEEP*HLA | HLARIMNT | ||
|---|---|---|---|
| Pan-Asian | |||
| PPV | |||
| sensitivity | |||
| probability | |||
| T1DGC | |||
| PPV | |||
| sensitivity | |||
| probability | |||
| Mixed | |||
| PPV | |||
| sensitivity | |||
| probability |
| DEEP*HLA | HLARIMNT | ||
|---|---|---|---|
| Pan-Asian | |||
| PPV | |||
| sensitivity | |||
| probability | |||
| T1DGC | |||
| PPV | |||
| sensitivity | |||
| probability | |||
| Mixed | |||
| PPV | |||
| sensitivity | |||
| probability |
| DEEP*HLA | HLARIMNT | ||
|---|---|---|---|
| Pan-Asian | |||
| PPV | |||
| sensitivity | |||
| probability | |||
| T1DGC | |||
| PPV | |||
| sensitivity | |||
| probability | |||
| Mixed | |||
| PPV | |||
| sensitivity | |||
| probability |
Appendix F Confidence intervals of infrequent alleles for Experiment 1
Here we report 95% confidence intervals of accuracy for infrequent alleles, on each test data used in Experiment 1. The very wide confidence intervals are due to the fact that the accuracy varies extremely with the allele frequency, which makes the variance very large. Furthermore, the limited number of infrequent alleles is another reason for the wide confidence intervals.
| DEEP*HLA | HLARIMNT | ||
|---|---|---|---|
| Pan-Asian | |||
| PPV | |||
| sensitivity | |||
| probability | |||
| T1DGC | |||
| PPV | |||
| sensitivity | |||
| probability | |||
| Mixed | |||
| PPV | |||
| sensitivity | |||
| probability |
| DEEP*HLA | HLARIMNT | ||
|---|---|---|---|
| Pan-Asian | |||
| PPV | |||
| sensitivity | |||
| probability | |||
| T1DGC | |||
| PPV | |||
| sensitivity | |||
| probability | |||
| Mixed | |||
| PPV | |||
| sensitivity | |||
| probability |
| DEEP*HLA | HLARIMNT | ||
|---|---|---|---|
| Pan-Asian | |||
| PPV | |||
| sensitivity | |||
| probability | |||
| T1DGC | |||
| PPV | |||
| sensitivity | |||
| probability | |||
| Mixed | |||
| PPV | |||
| sensitivity | |||
| probability |
| DEEP*HLA | HLARIMNT | ||
|---|---|---|---|
| Pan-Asian | |||
| PPV | |||
| sensitivity | |||
| probability | |||
| T1DGC | |||
| PPV | |||
| sensitivity | |||
| probability | |||
| Mixed | |||
| PPV | |||
| sensitivity | |||
| probability |
| DEEP*HLA | HLARIMNT | ||
|---|---|---|---|
| Pan-Asian | |||
| PPV | |||
| sensitivity | |||
| probability | |||
| T1DGC | |||
| PPV | |||
| sensitivity | |||
| probability | |||
| Mixed | |||
| PPV | |||
| sensitivity | |||
| probability |
Appendix G Training Flow
First, a variant ’count’, which is an indicator used for early stopping, is initialized to 0. At the beginning of the epoch, the training data is batched and trained using back propagation. At the end of one epoch, the model’s correctness rate (the percentage of data that the model could impute correctly) in the validation data is calculated. If this value is greater than the value of the ‘best model’, the weights are overwritten and saved as the ‘best model’. If not, add 1 to the ‘count’, and when the value of the ‘count’ reaches specified number, the training is terminated. Also, at regular intervals, the learning rate is decreased. This process is repeated until the number of epochs exceeds specified number, at which point training is terminated. The ‘best model’ stored at the end of training is used to examine the accuracy for the test data.
Appendix H Experiment1 additional figures
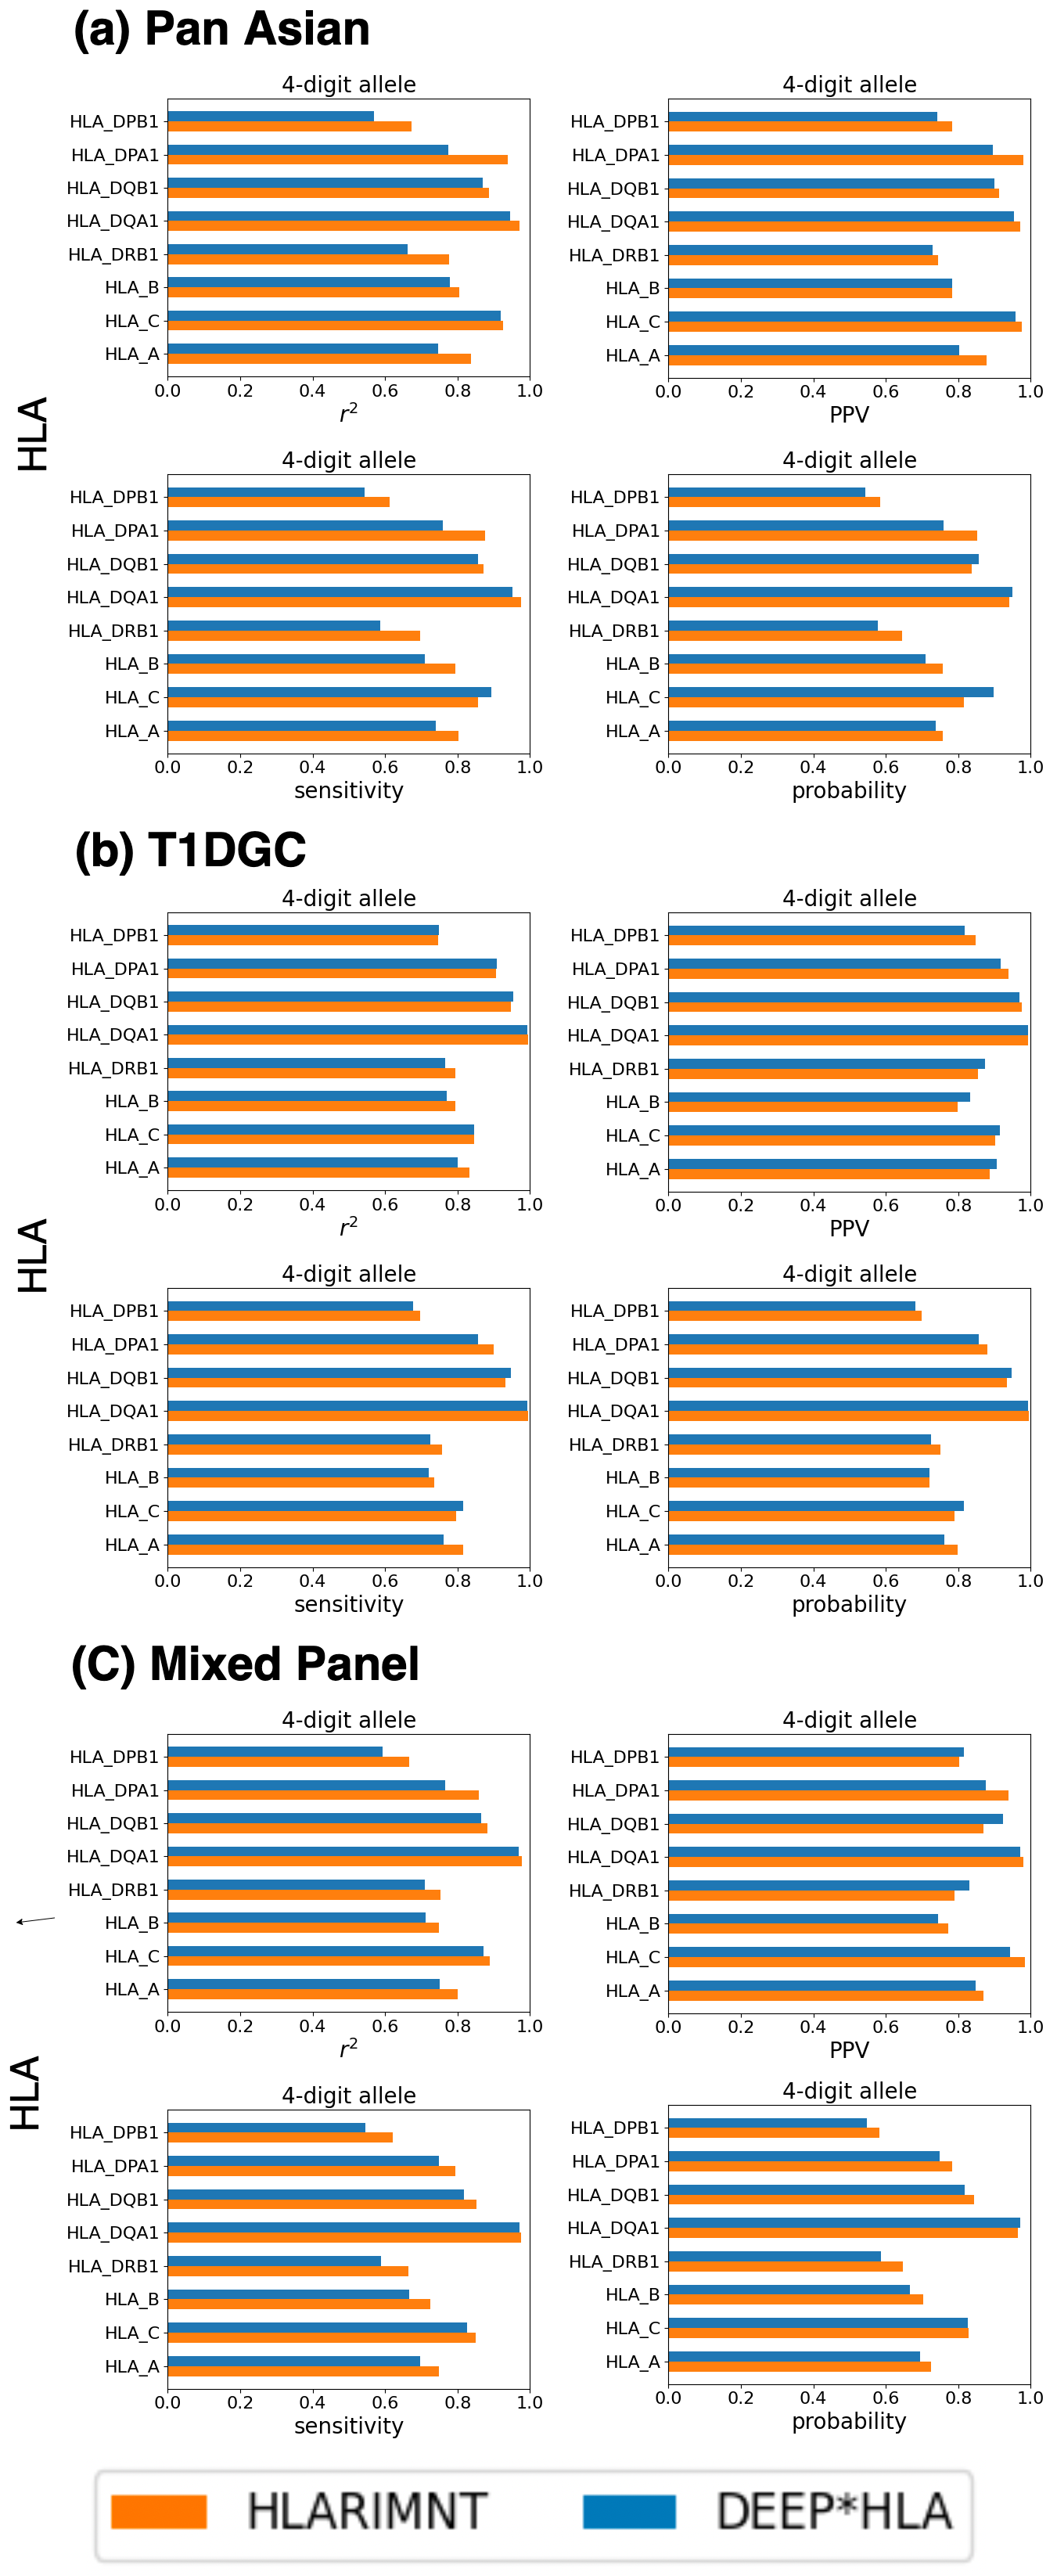
Average imputation accuracy for 4-digit alleles in each HLA gene is showed in Figure 7. HLARIMNT generally showed advantages for almost all of the genes in all of the three reference panels, with some exceptions depending on the combination of genes, reference panels, and indices.
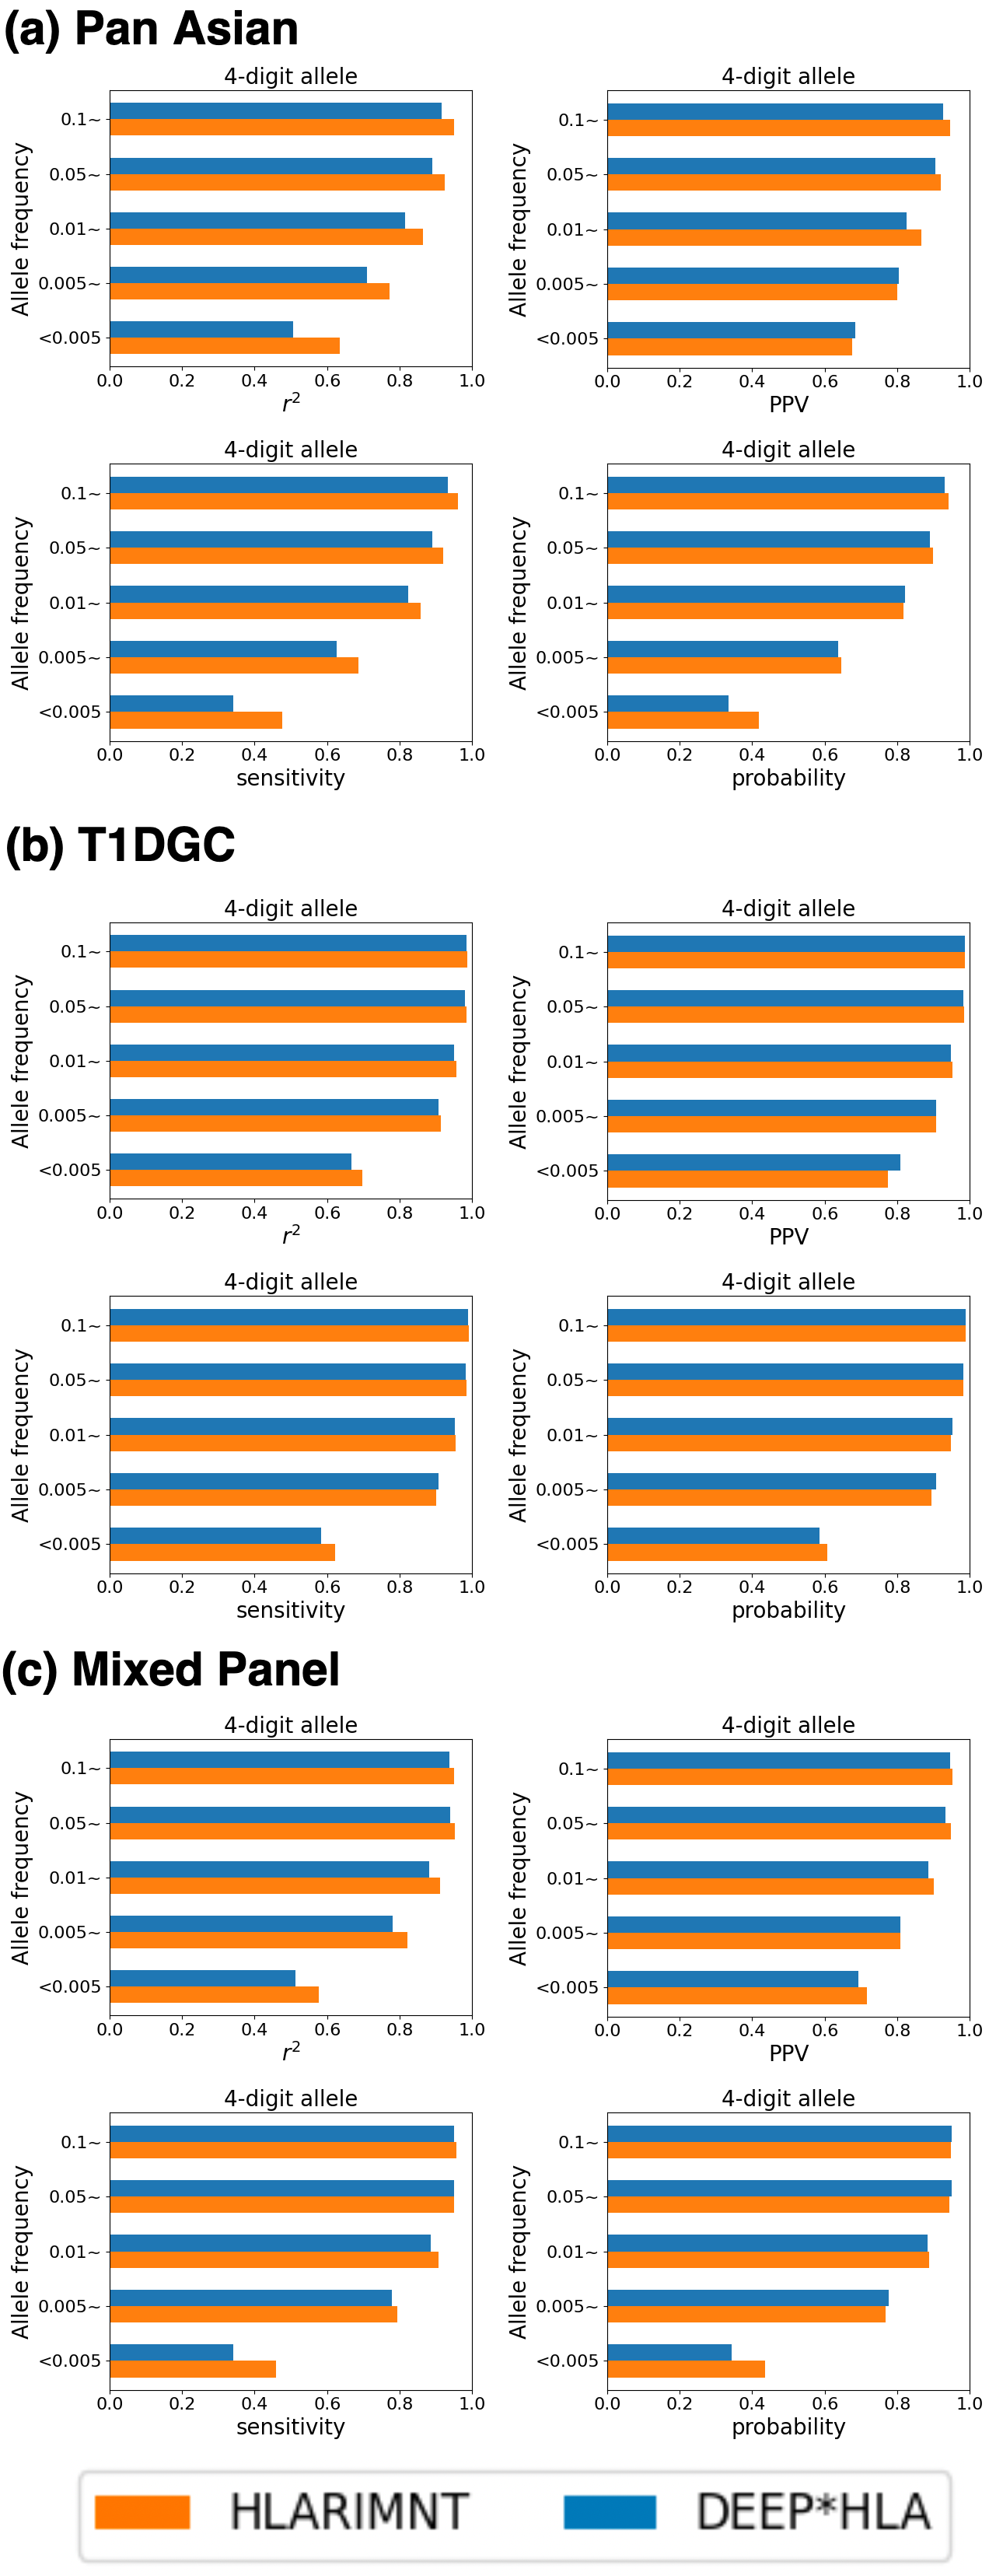
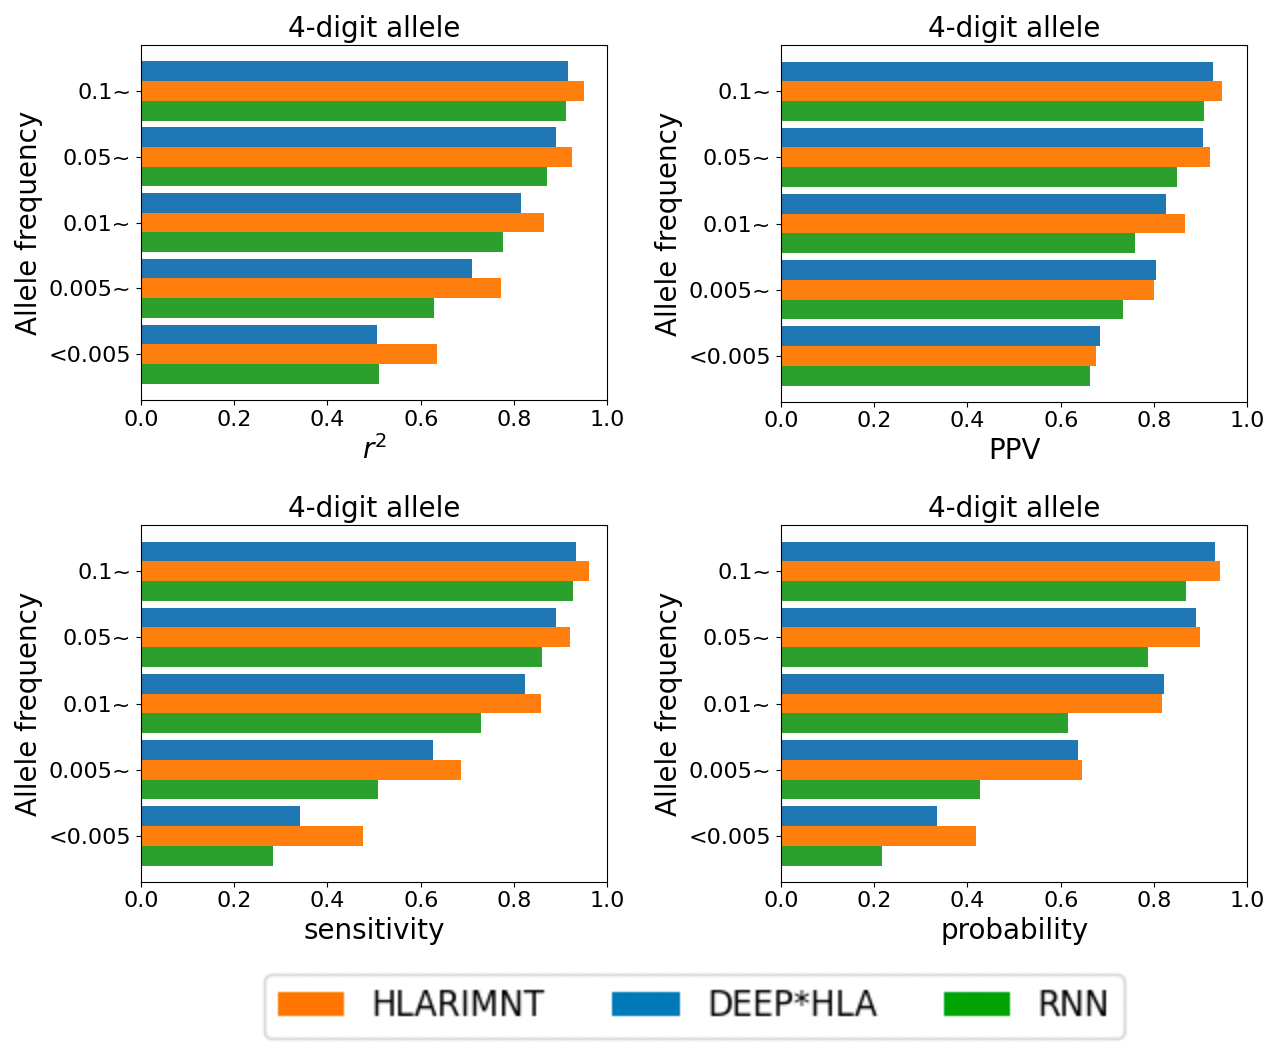
In Figure 8, for each metric, accuracy for 4-digit alleles with frequencies equal to or above the value on the vertical axis is shown on the horizontal axis (Notice that indicates a frequency of less than 0.005). When using Pan-Asian reference panel and the mixed counterpart, HLARIMNT performed with almost the same or better accuracy than DEEP*HLA regardless of allele frequencies. The superiority of HLARIMNT was more noticeable for alleles with lower frequencies. When using T1DGC reference panel, though there was no marked difference for frequent alleles, the accuracy for extremely rare alleles was apparently higher in HLARIMNT except for PPV.
Appendix I Hyperparameters
We used Optuna (https://github.com/optuna/optuna) to search hyperparameters. The searched parameters and the values are as follows; Number of Transformer heads: 64, Number of layers of Transformer encoder: 2, Dimension of feedforward in Transformer encoder: 64, Batch size: 64, Dimension of embedding in Embedding Layer: 512, Learning rate: 0.0005, Number of epochs for early stopping: 50.
Appendix J Further Discussion
Here is a more detailed discussion of the study and future perspectives.
What is noteworthy about Experiment 1 is that HLARIMNT outperformed in a mixed panel of two ethnic groups. This indicates that HLARIMNT captured features of the SNPs without over-fitting a particular ethnic group. This characteristic may be useful in practical HLA imputation; For an accurate HLA imputation, a large reference panel is required. In fact, in Experiment 2, both methods were more accurate with a larger number of training data. On the other hand, it is known that the distribution and and frequency of the HLA alleles are variable across different ethnic groups (Gourraud et al., 2014), which results in heterogeneity in HLA risk alleles across populations (Okada et al., 2014). This phenomenon is seen, for example, in the association between non-Asp57 in HLA-DQB1 and type1 diabetes (T1D) risk; in Europeans, there is a strong correlation between these two (Todd and Beir, 1987; Hu et al., 2015), but not in Japanese (Kawabata et al., 2009). Therefore, it is desirable to create large reference panels for each race. However, to create a large reference panel, it is necessary to analyze SNPs of many individuals at high density, which is very expensive. In this regard, if we can use the mixture of reference panels including various ethnic groups for training, it will be possible to perform an accurate HLA imputation without performing new SNP sequencing to make the reference panel larger. HLARIMNT has the potential to meet this requirement.
What should be mentioned about Experiment 2 is that the superiority of HLARIMNT was more pronounced with less training data, regardless of allele frequencies. Basically, while haplotypes vary by ethnicity, a reference panel needs to be created for each race. However, it is expensive to create a new reference panel for a specific race. HLARIMNT could solve this problem, by capturing the characteristics with less data more accurately.
For these reasons, HLARIMNT is expected to become a practical deep learning method for HLA imputation. As mentioned in section 1, research over the past few years has shown that Transformer is useful for sequential data. In addition, this study strongly suggests that Transformer may be more useful than conventional methods, like RNN (Appendix A) as well as CNN, in the modality of genomic information. This should be an opportunity to experiment more with Transformer in the field of genomics.
However, there are several points that should be discussed in this study. One is the small number of individuals (530 individuals; 1060 haplotypes) in Pan-Asian reference panel. In this case, alleles with frequencies of 0.005 or low are very few, thus accuracy for them may be unreliable, especially in indices such as probability. In addition, in both experiments, there were some situations in which HLARIMNT lacked pronounced priority or was inferior in PPV, especially for infrequent alleles. The combination of high sensitivity and low PPV in infrequent alleles means that HLARIMNT is finding characteristics of infrequent alleles in many other alleles. A more detailed analysis of this error may reveal how HLARIMNT is making the allele distinction, and it may allow us to make more accurate imputation models. Finally, while the advantage of HLARIMNT has already been amply demonstrated, it may be possible to evaluate its utility further by making test data of different ethnicity from training data, or by seeing if there is a difference in accuracy among each SNPs sequence. In this case, ethnic groups that are closely related will be selected for training and test data for appropriate validation, as there is a large difference in alleles among ethnicities as mentioned above.