Syntactic Structure Processing in the Brain while Listening
Abstract
Syntactic parsing is the task of assigning a syntactic structure to a sentence. There are two popular syntactic parsing methods: constituency and dependency parsing. Recent works have used syntactic embeddings based on constituency trees, incremental top-down parsing, and other word syntactic features for brain activity prediction given the text stimuli to study how the syntax structure is represented in the brain’s language network. However, the effectiveness of dependency parse trees or the relative predictive power of the various syntax parsers across brain areas, especially for the listening task, is yet unexplored. In this study, we investigate the predictive power of the brain encoding models in three settings: (i) individual performance of the constituency and dependency syntactic parsing based embedding methods, (ii) efficacy of these syntactic parsing based embedding methods when controlling for basic syntactic signals, (iii) relative effectiveness of each of the syntactic embedding methods when controlling for the other. Further, we explore the relative importance of syntactic information (from these syntactic embedding methods) versus semantic information using BERT embeddings. We find that constituency parsers help explain activations in the temporal lobe and middle-frontal gyrus, while dependency parsers better encode syntactic structure in the angular gyrus and posterior cingulate cortex. Although semantic signals from BERT are more effective compared to any of the syntactic features or embedding methods, syntactic embedding methods explain additional variance for a few brain regions. We make our code publicly available111https://tinyurl.com/BrainSyntax.
Syntactic Structure Processing in the Brain while Listening
Subba Reddy Oota1,2, Mounika Marreddy2, Manish Gupta2,3 and Bapi Raju Surampudi2 1INRIA, Bordeaux, France; 2IIIT Hyderabad, India; 3Microsoft, India subba-reddy.oota@inria.fr, mounika.marreddy@research.iiit.ac.in gmanish@microsoft.com, raju.bapi@iiit.ac.in
1 Introduction
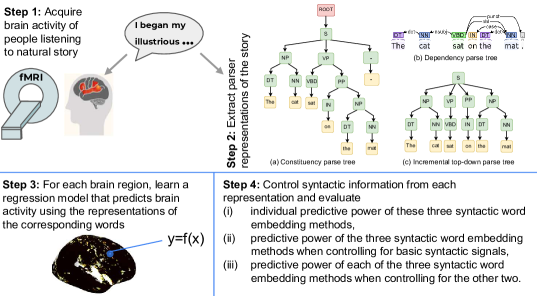
A key assumption in psycholinguistics is that sentence processing involves two operations: (i) the construction of a syntactic structure that represents the relation between its components and (ii) the retrieval of the meaning of single linguistic units from semantic memory. When presented with a sentence in a task, humans can understand word meaning effectively while reading and listening. Listeners and readers appear to extract a similar semantic meaning from narrative stories Rubin et al. (2000); Diakidoy et al. (2005), hence suggesting that the brain represents semantic information in an amodal form, i.e., independent of input modality. Further, earlier language-fMRI encoding studies have observed that sentence semantics alone cannot explain all the variance in brain activity; syntactic information can also be used to explain some of the variance Binder et al. (2016); Fedorenko and Thompson-Schill (2014).
Prior to different aspects of semantic interpretation, the brain performs syntactic structure analysis inherently Hirst (1984). The syntactic information helps to identify the structural constituents that have to be interpreted as nominal, ordinal, or noun phrases, e.g., we identify “Brazil”, “four”, “world cups”, and “2002” in a sentence: “Brazil won four world cups till 2002” before interpreting the semantics. Hence, investigating how the brain encodes syntactic word features is crucial for understanding language comprehension in the brain.
Two paradigms of syntactic parsing: Constituency and dependency are two different syntactic formalisms using different structural primitives (dependency relations and phrases). There has been some discussion in the field of theoretical linguistics with regard to whether they capture the same information or to what degree the structures they sanction are equivalent Hays (1964); Jung (1995). Discussing the linguistic information the two parsers capture, Rambow (2010) states from a theoretical linguistic point of view that they describe distinct syntactic entities; thus, they are not strictly equivalent. Dependencies capture direct relations between words, identical to thematic functions such as subject, object, modifier, etc. Constituent syntactic structure, on the other hand, is not so much about functional relations between words but about the recursive grouping of sentence constituents (words and phrases), such that at each level, each grouping acts as a syntactic unit Schneider (1998). Moreover, according to Jung (1995), only dependencies can express the syntactic word-to-word relations of a sentence, whereas constituency expresses the linear order of a sentence. On the other hand, an incremental top-down constituency parser processes input words from left to right, producing the possible parses in a top-down manner as future words are read. Therefore, Jung (1995) sees the two grammars as complementary but not equivalent. Following these last observations, we consider dependency and constituent structures as distinct and the type of information they capture as nonequivalent. The question we address in this study is whether different brain regions are associated with building different kinds of syntactic structures. We compare the predictive power of syntactic structural measures derived from these parsers with regard to modeling the brain activity in language processing areas recorded during naturalistic story listening.
Stimulus types for studying syntactic processing: Earlier psycholinguistic studies explored syntactic processing while subjects were involved in activities that required less versus more syntactic comprehension effort Friederici (2011) using carefully designed sentence/phrase stimuli. In the past decade, the study of syntactic processing has been extended to naturalistic settings that use narratives, such as reading Reddy and Wehbe (2021) or listening to stories Bhattasali et al. (2018); Zhang et al. (2022) generally in a task-free setting. Due to the complexity of extracting syntactic word embeddings from sentence parsers, investigation of the predictive power of sentence parsers for brain encoding, especially for the neuroimaging data from naturalistic listening paradigms, is still under-explored.
Brain Regions of Interest (ROIs) for syntactic processing: Several classical studies report the involvement of a language network of mostly left-lateralised cortical regions, including the left inferior frontal gyrus (IFG) with sub-regions (BA 44 and BA 45), the left posterior superior temporal gyrus (pSTG), and the left anterior temporal pole (ATP) Caramazza and Zurif (1976); Friederici et al. (2006); Friederici (2011); Pallier et al. (2011); Zaccarella and Friederici (2015). However, several other studies did not report activity in left IFG and left pSTG Humphries et al. (2006); Rogalsky and Hickok (2009); Bemis and Pylkkänen (2011), despite using paradigms similar to the studies mentioned above. A series of recent studies have used functional magnetic resonance imaging (fMRI) brain activity to find that those brain regions spanning both the left and right hemispheres are involved in language processing Fedorenko and Thompson-Schill (2014); Caucheteux et al. (2021a); Reddy and Wehbe (2021); Zhang et al. (2022); Oota et al. (2022b, c, a); Toneva et al. (2022); Aw and Toneva (2022); Oota et al. (2022d); Merlin and Toneva (2022). Further, these works conclude that syntax is distributed throughout the language system Blank et al. (2016); Fedorenko et al. (2012, 2020); Caucheteux et al. (2021a); Wang et al. (2020); Reddy and Wehbe (2021); Zhang et al. (2022); Oota et al. (2022b). However, whether different brain regions are sensitive to distinct sentence-parsing strategies remains unclear. Moreover, in a listening task, it is unclear how syntactic features are represented in the brain and whether the neural correlates of different syntactic parsing signals overlap or dissociate from one another.
Word stimulus representations for brain encoding: Several studies have used basic syntactic features such as part-of-speech, dependency relations, complexity metrics Caucheteux et al. (2021a); Reddy and Wehbe (2021), and semantic word embeddings Oota et al. (2018); Jain and Huth (2018); Hollenstein et al. (2019) to represent words for brain encoding with text stimulus. In this paper, to understand how the brain processes linguistic structure in sentences, we leverage three different text representations using syntax parsers, as shown in Fig. 1. We aim to understand the relative importance of these syntax parser embeddings and also their additional importance when compared with basic syntactic features or semantic embeddings like BERT.
Limitations of previous work: (i) Existing work has focused on either constituency parsing mainly including incremental top-down parsing Reddy and Wehbe (2021). No previous work has explored syntactic structure present in dependency trees. Reddy and Wehbe (2021) have only used one-hot vector for dependency tags as part of their complexity metrics. But we leverage dependency information more systematically by learning the dependency representations using graph convolutional networks. (ii) Existing work has mostly focused on reading tasks only, and that too on small number of subjects (e.g., 7 subjects in Reddy and Wehbe (2021)). There is evidence that several cortical regions are activated during listening Handjaras et al. (2016). But which brain areas and sub-regions of the language network are involved in syntactic processing is yet unexplored. (iii) Lastly, existing work does not perform pairwise predictive power comparison for different syntactic parse methods.
Overall, our main contributions are as follows. (1) We explore (a) basic syntactic features such as complexity metrics, part-of-speech (POS) tags, and dependency role (DT) tags, (b) embeddings obtained from three parse tree representations, and (c) semantic BERT embeddings for brain encoding. (2) Constituency and dependency tree-based embeddings are effective across different language regions for brain activity prediction, even after controlling for basic syntactic signals. (3) We find that prediction of the activation in regions such as the bilateral temporal areas (ATL, PTL) and middle-frontal gyrus (MFG) is significantly related to constituency parse representations. At the same time, brain activity in other language regions, such as the angular gyrus (AG) and posterior cingulate cortex (PCC) is significantly associated with dependency parse embeddings. (4) Lastly, in the inferior frontal gyrus (IFG), we identify that dependency parse embeddings encode syntactic information better in the sub-regions such as 44, 45, IFJa, and IFSp of the left hemisphere, whereas constituency parse tree and incremental top-down parse tree based embeddings are better aligned in the right hemisphere.
2 Feature Representations
We used four different features computed per word to simultaneously test different syntactic and semantic representations.
(1) Constituency Tree-based Embeddings: Similar to Reddy and Wehbe (2021), we build three types of constituency tree-based graph embeddings (ConTreGE): (i) ConTreGE Complete vectors (CC), (ii) ConTreGE Incomplete vectors (CI) and (iii) Incremental Top-Down Parser Embeddings (INC). A CC vector is generated for every word using the largest subtree completed by that word. A subtree is considered complete when all of its leaves are terminals. The largest subtree completed by a given word refers to the subtree with the largest height. A CI vector is generated for every word using the incomplete subtree that contains all of the Phrase Structure Grammar productions needed to derive the words seen till then, starting from the root of the sentence’s tree. Some examples for CC and CI are added in the Appendix (Figs. 6 and 7). Like Reddy and Wehbe (2021), we use Berkeley Neural Parser222https://spacy.io/universe/project/self-attentive-parser for constituency parsing (i.e., for both CI and CC).
In ConTreGE Complete tree (CC), the largest subtree completed by a given word refers to the subtree with the largest height that also satisfies the following conditions - the given word must be one of its leaves and all of its leaves must only contain words that have been seen till then.
In ConTreGE Incomplete tree (CI), the embeddings are constructed using incomplete subtrees that are constructed by retaining all the phrase structure grammar productions that are required to derive the words seen till then, starting from the root of the sentence’s tree. If incomplete subtrees are more representative of the brain’s processes, it would mean that the brain correctly predicts certain phrase structures even before the entire phrase or sentence is read.
The incremental top-down parser is a statistical syntactic parser that processes input strings from left to right, producing partial derivations in a top-down manner, using beam search as detailed in Roark (2001). Specifically, we use the implementation as described here333https://github.com/roarkbr/incremental-top-down-parser. The INC embeddings are obtained using exactly the same methods as described in Section 3 of Reddy and Wehbe (2021). The brain could be computing several possible top-down partial parses that can derive the words seen so far and modifying the list of possible parses as future words are read. The INC feature space is constructed to encode the different possible parse trees that can derive the words seen so far. When considering parse tree based representations, the embeddings may contain information about what is yet to be seen by the subject. However, this is not a problem since it mimics the human capability of guessing what is to come next. With this embedding space, we attempt to measure the ability of the brain to predict future constituents correctly.
(2) Dependency Tree-based Embeddings (DEP): Graph Convolutional Networks (GCNs) have been widely used to encode syntactic information from dependency parse trees Vashishth et al. (2019). Rather than using pretrained syntactic GCN word embeddings generated from Wikipedia Vashishth et al. (2019), we create DEP embeddings using GCNs on the “Narrative stories” dataset as follows. To generate syntactic word embeddings using GCN, we first extract the dependency parse tree =(, ) for every sentence in our dataset = (…), using the Stanford CoreNLP parser Manning et al. (2014). Here, = {, ,, } and denotes the labeled directed dependency edges of the form (, , ), where is the dependency relation of to . GCN computations iteratively utilize the context defined by a word’s neighbors in the graph to compute embedding for every word . Further, we also perform edge-wise gating to give importance to relevant edges and suppress noisy ones. We follow the architecture defined in (Vashishth et al., 2019) for training a GCN on our dataset leading to syntactically-rich DEP embeddings. Overall, GCN utilizes syntactic context to learn rich DEP embeddings.
(3) Basic Syntactic Features: Similar to (Wang et al., 2020; Reddy and Wehbe, 2021; Zhang et al., 2022), we use various multi-dimensional syntactic features such as Punctuation (PU), Complexity Metrics (CM), and Part-of-speech and dependency tags (PD), described briefly below.
Punctuation (PU) The role of punctuation is to resolve syntactic and semantic ambiguity in the lexical grammar and encode relational discourse links between text units in sentences Briscoe (1996). Punctuation-based features are encoded using a one-hot vector where the type of punctuation is presented along with a word (e.g. . or ,).
Complexity Metrics (CM) We use three features in the complexity metrics: Node Count (NC), Word Length (WL), and Word Frequency (WF). The node count for each word is the number of subtrees that are completed by incorporating each word into its sentence. Word length is the number of characters present in the word. Word frequency reports log base-10 of the number of occurrences per billion of a given word in a large text corpus.
Part-of-speech and Dependency tags (PD) We use the Spacy English dependency parser Honnibal and Montani (2017) to extract the Part-of-speech (POS) and dependency tags. Unlike DEP embeddings (which use GCNs), in PD, we generate a one-hot vector for each word and dependency tag. The final vector is called PD, a concatenation of both the POS tag and dependency vector. Note that DEP and PD features use different methods for dependency analysis – PD features are just one-hot encoded representations while DEP features are learned syntactic embeddings using GCNs.
(4) BERT Features Given an input sentence, the pretrained BERT Devlin et al. (2018) outputs token representations at each layer. Since BERT embeds a rich hierarchy of linguistic signals: surface information at the bottom, syntactic information in the middle, semantic information at the top Jawahar et al. (2019); hence, we use the #tokens 768D vector from the last hidden layer to obtain the semantic embeddings. For uniformity of feature dimensions, we used PCA to bring down the dimensions to 250.
3 Dataset Curation
Brain Imaging Dataset The “Narratives” collection aggregates a variety of fMRI datasets collected while human subjects listened to real spoken stories Nastase et al. (2021). We analyze data from 82 subjects listening to the story titled ‘PieMan’ with 282 TRs (repetition time – fMRI recorded every 1.5 sec.). We chose this story since it contains maximum number of subjects in the “Narratives” collection. The dataset is in English and contains 957 words across 67 sentences. The story duration is 07m:02s. We use the multi-modal parcellation of the human cerebral cortex (Glasser Atlas: consists of 180 ROIs in each hemisphere) to display the brain maps Glasser et al. (2016) since the Narratives dataset contains annotations tied to this atlas. The data covers eight language brain ROIs with the following subdivisions: (i) angular gyrus (AG: PFm, PGs, PGi, TPOJ2, and TPOJ3); (ii) anterior temporal lobe (ATL: STSda, STSva, STGa, TE1a, TE2a, TGv, and TGd); (iii) posterior temporal lobe (PTL: A5, STSdp, STSvp, PSL, STV, TPOJ1); (iv) inferior frontal gyrus (IFG: 44, 45, IFJa, IFSp); (v) middle frontal gyrus (MFG: 55b); (vi) inferior frontal gyrus orbital (IFGOrb: a47r, p47r, a9-46v), (vii) posterior cingulate cortex (PCC: 31pv, 31pd, PCV, 7m, 23, RSC); and (viii) dorsal medial prefrontal cortex (dmPFC: 9m, 10d, d32) Baker et al. (2018); Milton et al. (2021); Desai et al. (2022). The dataset has been made available freely without restrictions by Nastase et al. (2021).
Downsampling Since the rate of fMRI data acquisition (TR = 1.5sec) was lower than the rate at which the text stimulus was presented to the subjects, several words fall under the same TR in a single acquisition. Hence, we match the stimulus acquisition rate to fMRI data recording by downsampling the stimulus features using a 3-lobed Lanczos filter LeBel et al. (2021). After downsampling, we average the word-embeddings within each TR to obtain chunk-embedding for each TR.
TR Alignment To account for the slowness of the hemodynamic response, we model the hemodynamic response function using finite response filter (FIR) per voxel and for each subject separately with 8 temporal delays corresponding to 12 seconds.
4 Methodology
Encoding Model To explore how and where syntactic and semantic specific features are represented in the brain when listening to stories, we extract different features describing each stimulus sentence and use them in an encoding model to predict brain responses. If a feature is a good predictor of a specific brain region, information about that feature is likely encoded in that region.
The main goal of each fMRI encoder model is to predict brain responses associated with each brain voxel when given stimuli. We train a model per subject separately. Following the literature on brain encoding Wehbe et al. (2014); Toneva et al. (2020); Caucheteux et al. (2021b); Reddy and Wehbe (2021); Toneva et al. (2021); Zhang et al. (2022); Oota et al. (2022b, c), we choose to use a ridge regression model instead of more complicated models. We plan to explore more such models as part of future work. The ridge regression objective function for the example is . Here, are the learnable weight parameters, denotes the Frobenius norm, and is a tunable hyper-parameter representing the regularization weight. was tuned on a small disjoint validation set obtained from the training set.
Cross-Validation We follow 4-fold (K=4) cross-validation. All the data samples from K-1 folds were used for training, and the model was tested on samples of the left-out fold.
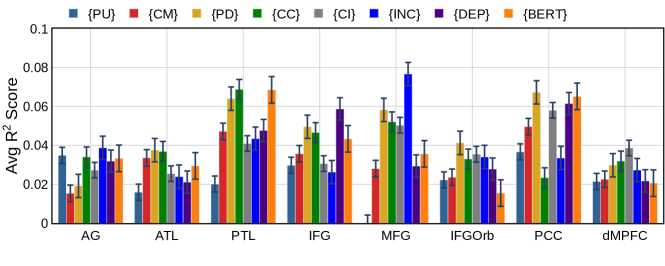
Evaluation Metric We evaluate our models using the popular brain encoding evaluation metric, . Let TR be the number of time repetitions. Let and denote the actual and predicted value vectors for a single voxel. Thus, and also . We use R metric to measure the coefficient of determination for every voxel. We average score over all voxels in a region to get region-level aggregated metric. Finally, they are further averaged across all subjects to obtain final region-level metrics, which are reported with mean and standard deviation.
Statistical Significance We run a permutation test to check if scores are significantly higher than chance. We permute blocks of contiguous fMRI TRs, instead of individual TRs, to account for the slowness of the underlying hemodynamic response. We choose a standard value of 10 TRs. The predictions are permuted within fold 5000 times, and the resulting scores are used as an empirical distribution of chance performance, from which the p-value of the unpermuted performance is estimated. We also run a bootstrap test, to test if a model has a higher score than another. In each iteration, we sample with replacement the predictions of both models for a block of TRs, compute the difference of their , and use the resulting distribution to estimate the p-value of the unpermuted difference. Finally, the Benjamni-Hochberg False Discovery Rate (FDR) correction Benjamini and Hochberg (1995) is used for all tests (appropriate because fMRI data is considered to have positive dependence Genovese (2000)). The correction is performed by grouping all the voxel-level p-values (i.e., across all subjects and feature groups) and choosing one threshold for all of our results. The correction is done this way as we test multiple prediction models across multiple voxels and subjects.

5 Experiments and Results
We discuss detailed hyper-parameter settings in Appendix A.
Which word representations are semantic versus syntactic? We first empirically show that syntactic embeddings do not encode a significant amount of semantic information. In particular, we train the RidgeCV regression model in a 10-fold cross-validation setting to predict the semantic GloVe Pennington et al. (2014) features (300 dimensions) using syntactic embeddings for all the representations, similar to earlier works Caucheteux et al. (2021a); Reddy and Wehbe (2021); Zhang et al. (2022).
Average scores are as follows: BERT (0.560), CC (0.052), CI (0.020), DEP (0.170), INC (0.040), PD (0.183), CM (0.027), and PU (0.005). These scores indicate that (a) overall, BERT has high semantic information compared to other embeddings, and (b) constituency parsers have low semantic information compared to DEP. Overall, all the syntactic embeddings consist of very low semantic information. Hence, it is reasonable to infer that any additional variance predicted by the syntactic parsing methods compared to the semantic feature space (BERT) is mainly due to their syntactic information.
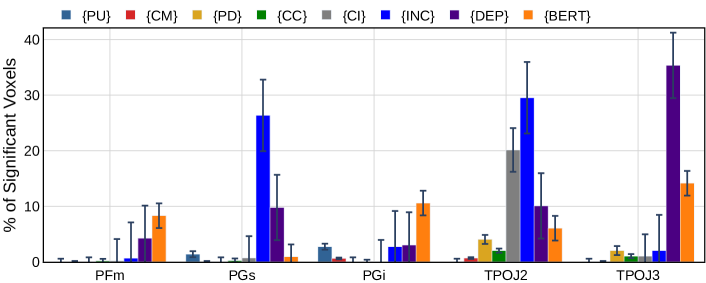
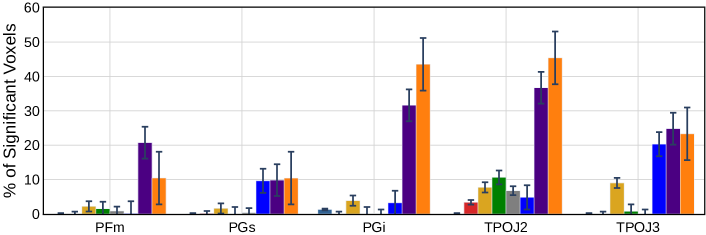
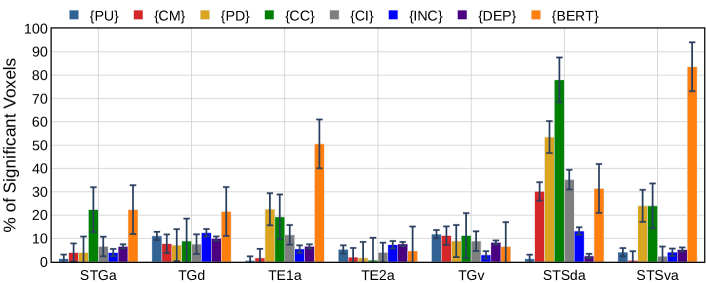
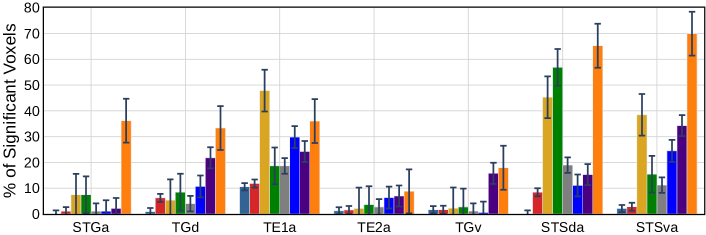
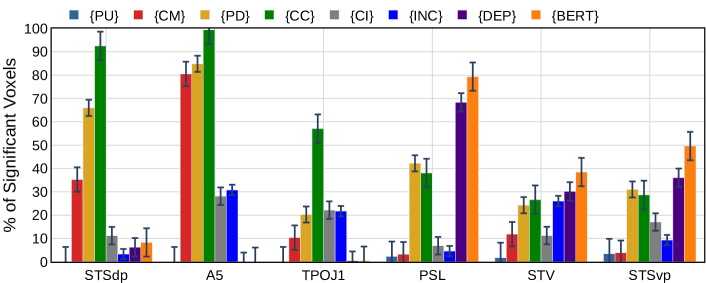
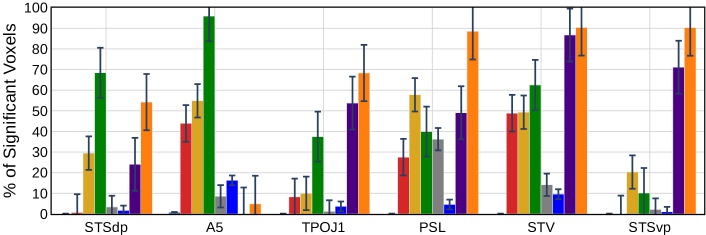
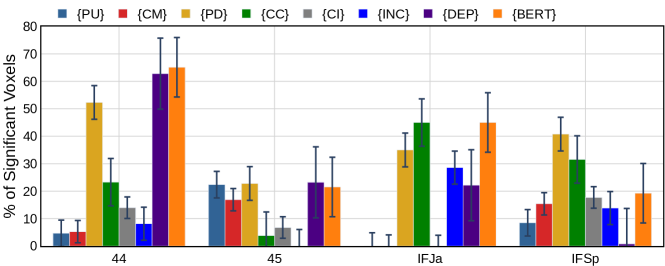
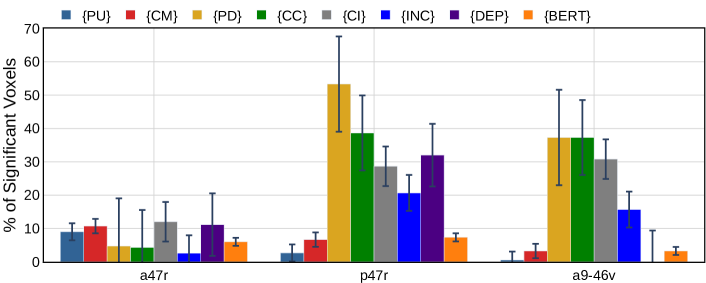
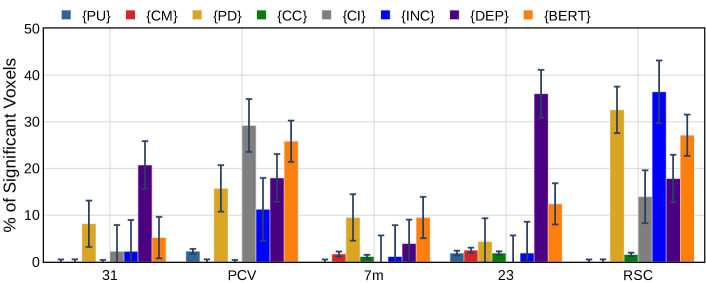
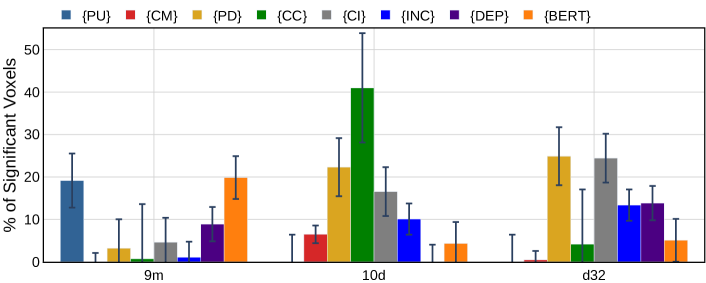
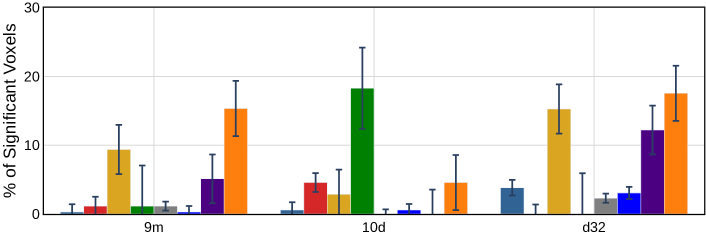
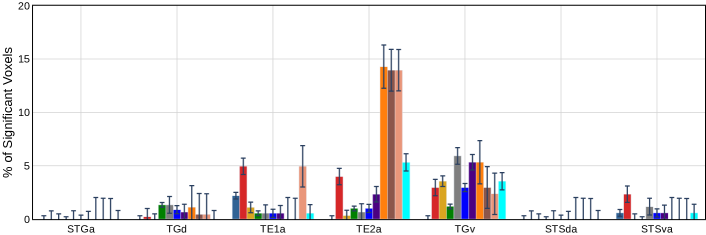
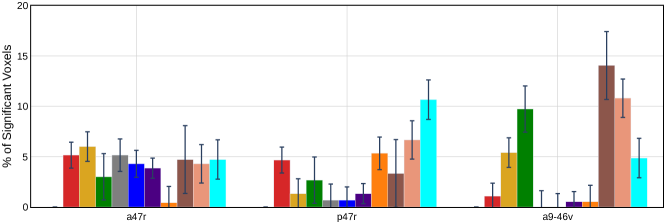
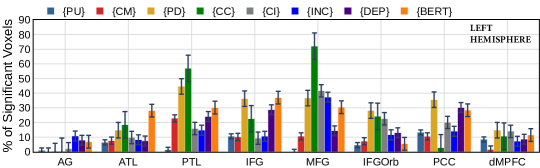
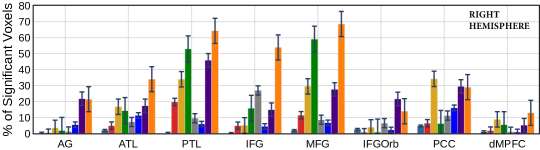
Performance of individual embedding methods: In order to assess the performance of the fMRI encoder models learned using the individual syntactic and semantic representations, we computed the scores between the predicted and true responses across various ROIs of the language network. Fig. 2 reports the % of ROI voxels with significant scores (based on a hypothesis test where the score for each voxel is greater than 0) across different representations for different language regions in the left and right hemispheres. We make the following observations from Fig. 2: (1) Among basic syntactic features, PD features perform best across most of the language regions, whereas CM yields the second-best result. (2) Among the syntactic embedding methods, CC encodes syntactic information better in the language regions such as temporal lobes (ATL and PTL) and MFG. (3) Among the syntactic embedding methods, DEP embeddings predict brain activity better in the language regions (PCC and IFG of left hemisphere, and AG, IFGorb, and PCC of right hemisphere). (4) Semantic embeddings using BERT are the best across all regions in the right hemisphere, but the effectiveness of BERT is rather mixed in the left hemisphere.
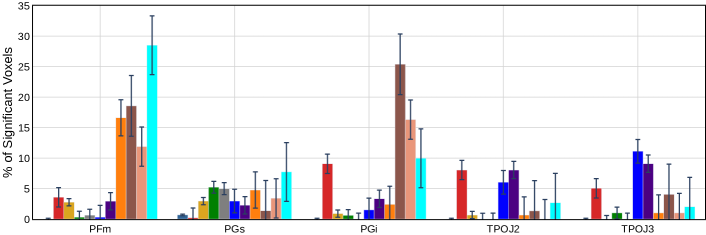
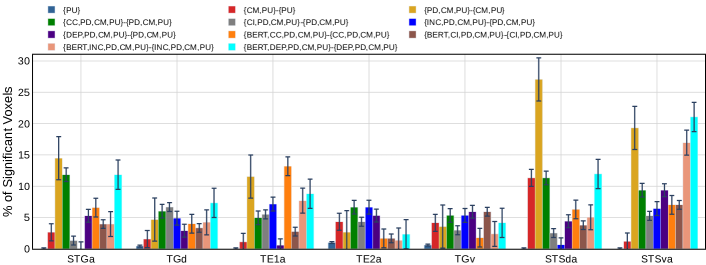
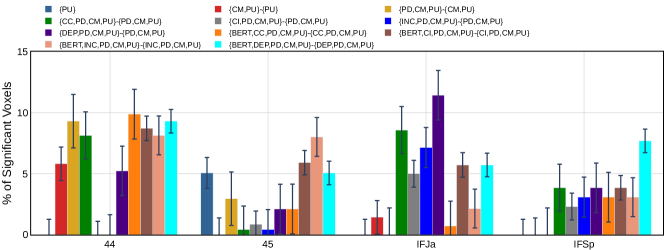
Further, we report the avg scores across all different language ROIs in the Appendix (Fig. 8). We further demonstrate the performance of embedding methods for various sub-regions of each language ROI in the Appendix Figs. 9 to 15. We observe the following from these figures: (1) In the ATL region (Fig. 10), CC better encodes in the superior temporal sulcus with dorsal attention (STSda). For STS in ventral attention (STSva), CC encodes better in the left hemisphere while DEP is better in the right. (2) In the PTL region (Fig. 11), CC is best for STSdp sub-region. (3) In the IFG region (Fig. 12), DEP is better aligned with 44 region whereas CC is better aligned with IFJa region. These results are in line with observations made in Pallier et al. (2011). Overall, a higher percentage of voxels with all the frontal and temporal regions, demonstrates that language comprehension may be associated more with both frontal and temporal regions Cohen et al. (2021).
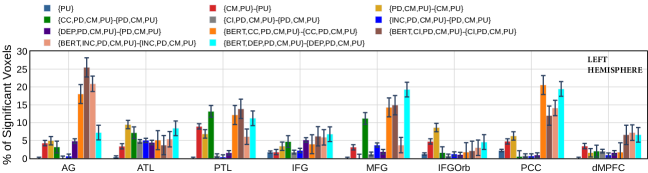
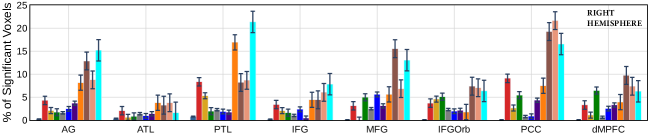
We also report brain maps with avg for all the representations in Fig. 3. From Figs. 2 and 3, we can infer that the different word representations, including all syntactic and semantic methods, are highly distributed across ROIs of language network. In particular, PTL and MFG have high overlap for both syntactic (CC, CI, DEP, INC), and semantic (BERT) features. Also, ROIs such as PTL, IFGOrb and PCC have higher overlap with PD. Most of these observations agree with previous findings on the brain networks of language processing Friederici (2011); Fedorenko and Thompson-Schill (2014); Caucheteux et al. (2021a); Reddy and Wehbe (2021); Zhang et al. (2022), supporting that both syntax and semantics are distributed across language ROIs. Lastly, similar to an earlier study Blank et al. (2016), basic syntactic features are much less associated with voxels in AG region.
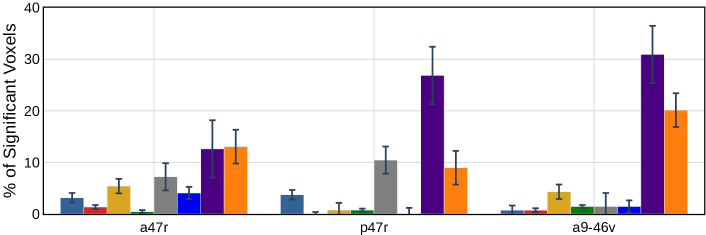
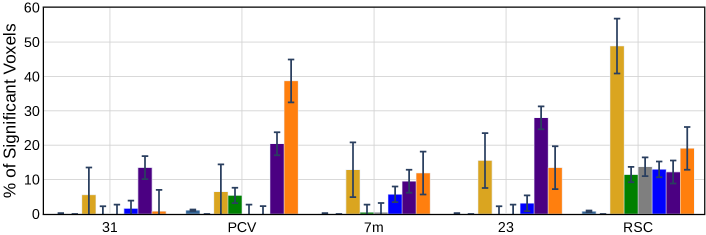
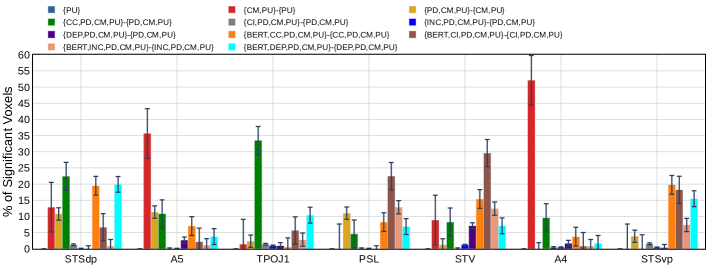
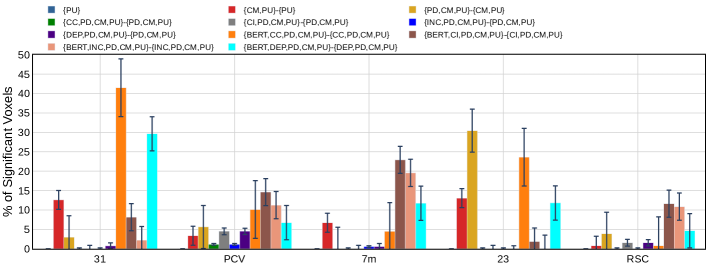
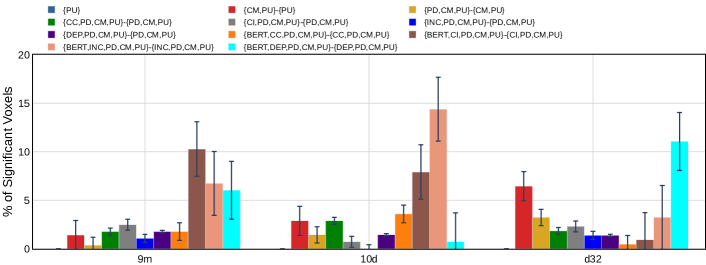
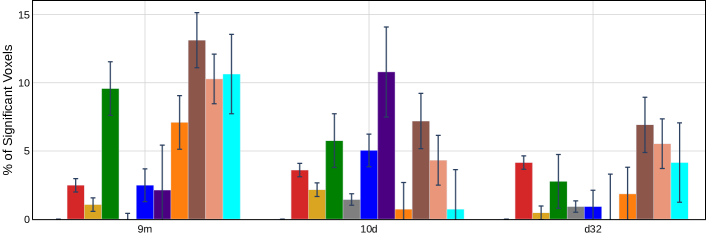
Additional predictive power of various representations Many feature spaces have overlapping information, e.g., PD (part-of-speech and dependency) tags include punctuation, BERT vectors have been shown to encode syntax Jawahar et al. (2019); Luoma and Pyysalo (2020), and DEP embeddings built from GCNs encode some POS tags information. Are various representations capturing very similar signals, i.e., redundant or capturing new information, which is additionally useful to predict brain activations? To answer this question, we first organize the feature groups in the increasing order of syntactic information. We build hierarchical feature groups in increasing order of syntactic information and test for significant differences in prediction performance between two consecutive groups. We start with the simple feature – punctuation (PU) and then add more complex features in this order: the complexity metrics (CM), POS and dependency tags (PD), {CC, CI, INC, DEP}, and lastly, BERT. Fig. 4 reports the % of ROI voxels with significant scores (hypothesis test where the difference in scores between the two feature groups is larger than 0) across feature groups for different ROIs in the left and right hemispheres, respectively.
We make the following observations from Fig. 4. (i) Unlike Reddy and Wehbe (2021), we find that punctuation features yield a lower predictive performance across language regions for listening in both the left and right hemispheres. This is intuitive since punctuation marks are not “visible” when listening. (ii) Amongst CC, CI, INC, and DEP, after controlling for basic syntactic features {PD, CM, PU}, CC displays a large % of significant voxels across multiple language sub-regions, largest in ATL, PTL, and MFG in left and in IFGOrb, PCC and dmPFC in the right hemispheres. This means there are voxels in these language sub-regions that capture hierarchical English grammar syntax beyond simple syntax signals captured by PD, CM, and PU. (iii) DEP parser explains addition variance after controlling for basic syntactic features for the AG region which is mainly a knowledge store of thematic relations between entities. Also, DEP yields a large % of significant voxels for the IFG region in the left hemisphere whereas PCC region in the right hemisphere. Although INC does not show any additional variance in the left hemisphere, it performs well for IFG and MFG in the right hemisphere. (iv) On top of these representations, BERT adds to the variance the most in the context of CC, CI, INC, and DEP features in both hemispheres.
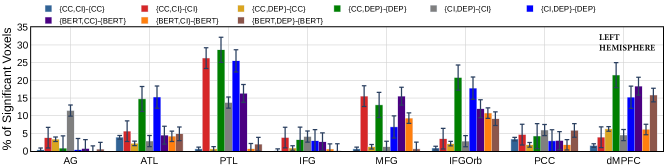
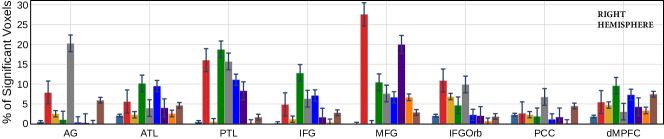
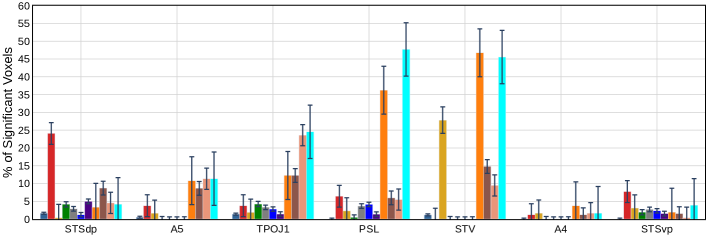
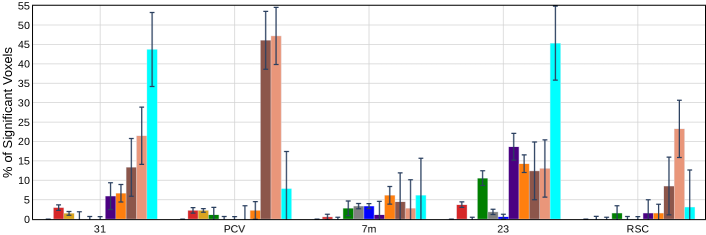
Pairwise predictive power comparison for syntactic parse methods and BERT To compare relative extra syntactic information in various parse-based representations, we compute the difference in between every pair of representations from {CC, CI, DEP}. For this analysis, we ignore INC since it performed worst, as shown in Fig. 2. Thus, we plot % of significant ROI voxels for {CC, DEP}-{CC} and other such feature-pairwise combinations in Fig. 5 for both hemispheres. We make the following observations from Fig. 5. (i) CC and CI show greater variance in brain predictivity (ATL and PTL for both hemispheres, MFG, IFGOrb and dmPFC of left hemisphere) even after controlling for either DEP. Also, CC and DEP show greater variance after controlling for CI. However, DEP or CI have negligible % of ROI voxels after controlling for CC, specifically for temporal lobe (ATL and PTL) and frontal regions (IFG and MFG). Thus, we can conclude that constituency trees, specifically CC, encode similar syntactic information as DEP in temporal lobe (ATL and PTL) and frontal regions (IFG and MFG). Also, DEP based on dependency trees does not have additional syntactic information compared to constituency trees, except for AG, IFGOrb, PCC and dmPFC regions. (ii) While BERT provides improvement over CC, CI and DEP in most brain areas (especially in MFG and dMPFC), surprisingly in AG and IFG, BERT does not provide much additive value.
6 Discussion
In this section, we correlate our empirical findings about syntactic parsing methods with previously proposed neuroscience theories.
From Fig. 4, we observe that activity in the left temporal lobe (ATL and PTL) seems to be predicted well using either CC or basic syntactic (PD) representations. These results are supported by theory of Matchin and Hickok (2020), who concluded that parts of the PTL are involved in hierarchical lexical-syntactic structure building, while the ATL is a knowledge store of entities. While activity in the left IFGOrb, left PCC, and left AG seems to be better modeled by basic syntactic feature (PD) representations, that in MFG seems to be related to CC representations. DEP embeddings seem to perform better for activity in the left AG, left ATL and left IFG. This supports the theory of Matchin and Hickok (2020), which reports that ATL is a knowledge store of entities and AG is a store of thematic relations between entities.
A sub-ROI in the left AG, namely parietal area G inferior (PGi) has significantly more number of voxels sensitive to dependency features when we control for all other syntactic features. On the other hand sub-ROIs in the right temporo-parieto-occipital junction (TPOJ) are more sensitive to incremental top-down syntactic features (Appendix Fig. 16). While it is known that AG is sensitive to stimuli that are connected through a narrative rather than unconnected words Baker et al. (2018), the current findings suggest that distinct sub-ROIs within AG are related to different syntactic features.
Further sub-regions in the prefrontal cortex such as Brodmann area (BA) 44 and the inferior frontal junction area (IFJa) also seem to be related to representations of dependency parser (Appendix Fig. 19). The results in the prefrontal cortex seem to concur with the observations of Grodzinsky and Friederici (2006) and Kaan and Swaab (2002) who have shown that Broca’s area (Brodmann areas 44 and 45) has higher brain activation while processing complex sentences. Since narrative listening also involves processing highly complex sentences, consistent activation found in Left Brodmann areas 44 and 45 may relate to parsing of sentences or to see if they had distinct meanings. The right hemisphere activation in the language network (AG, ATL, PTL, IFG, MFG, IFGOrb, PCC, and dMPFC) on the whole seems to be associated with basic syntactic features such as word length, word frequency, word count as embodied in CM representations. In linguistic studies, INC has been shown to be effective in checking if sentences with different syntax, have the same or different meaning. This in line with our observation that representations from INC parser seem to be more related to language regions (inferior frontal gyrus, IFG) in the right hemisphere as shown in Fig. 19.
Overall, Grodzinsky and Friederici (2006) concluded that syntax processing is not limited to specific regions (left IFG or Broca’s area). Along with IFG, other regions such as PTL, ATL, MFG, and IFGOrb are also involved in different stages of syntax processing. Our results (Fig. 2) also seem to support distributed representation of syntax across the language network. Moreover, our results clearly show the kind of syntax encoded by these individual ROIs.
7 Conclusion
We studied the relative importance of multiple constituency and dependency syntax parsing methods for fMRI prediction for the listening task. We find that (1) both CC and DEP are effective; CC is more important than CI, (2) CC is better in temporal cortex and MFG, while DEP is better in AG and PCC, (3) while BERT embeddings seem to be the most effective, syntactic embedding methods also explain additional variance for a few ROIs. In line with previous works, we find that syntax and semantic processing is spread across multiple brain areas.
8 Limitations
Although these experiments were performed on only one dataset, it is indeed large with data from 82 participants. That said, it will be nice to perform experiments with more listening datasets.
We experiment with a linear encoder – Ridge regression. We plan to experiment with more complex encoders as part of future work.
This work was done on data related to English stories only. Several other languages belong to the same language family as English Malik-Moraleda et al. (2022). While we can expect the insights and learnings to hold across languages in the same language family as English, empirical validation needs to be done. For languages in other language families, syntactic structure may be very different from English. Hence, more work needs to be done to check which of these insights hold for datasets in other language families.
This work was conducted on a dataset where the participants were involved in the listening task. However, the stimuli was represented in the text form. We believe that an audio form of the stimuli can lead to improved insights. Thus, more work needs to be done to design representations (like prosodic features) for auditory stimuli.
9 Ethical Statement
We did not create any new fMRI data as part of this work. We used Narratives-Pieman dataset which is publicly available without any restrictions. Narratives dataset can be dowloaded from https://datasets.datalad.org/?dir=/labs/hasson/narratives. Please read their terms of use444https://datasets.datalad.org/labs/hasson/narratives/stimuli/README for more details.
We do not foresee any harmful uses of this technology.
References
- Aw and Toneva (2022) Khai Loong Aw and Mariya Toneva. 2022. Training language models for deeper understanding improves brain alignment. arXiv preprint arXiv:2212.10898.
- Baker et al. (2018) Cordell M Baker, Joshua D Burks, Robert G Briggs, Andrew K Conner, Chad A Glenn, Kathleen N Taylor, Goksel Sali, Tressie M McCoy, James D Battiste, Daniel L O’Donoghue, et al. 2018. A connectomic atlas of the human cerebrum—chapter 7: the lateral parietal lobe. Operative Neurosurgery, 15(suppl_1):S295–S349.
- Bemis and Pylkkänen (2011) Douglas K Bemis and Liina Pylkkänen. 2011. Simple composition: A magnetoencephalography investigation into the comprehension of minimal linguistic phrases. Journal of Neuroscience, 31(8):2801–2814.
- Benjamini and Hochberg (1995) Yoav Benjamini and Yosef Hochberg. 1995. Controlling the false discovery rate: a practical and powerful approach to multiple testing. Journal of the Royal statistical society: series B (Methodological), 57(1):289–300.
- Bhattasali et al. (2018) Shohini Bhattasali, John Hale, Christophe Pallier, Jonathan Brennan, Wen-Ming Luh, and R Nathan Spreng. 2018. Differentiating phrase structure parsing and memory retrieval in the brain. Proceedings of the Society for Computation in Linguistics, 1(1):74–80.
- Binder et al. (2016) Jeffrey R Binder, Lisa L Conant, Colin J Humphries, Leonardo Fernandino, Stephen B Simons, Mario Aguilar, and Rutvik H Desai. 2016. Toward a brain-based componential semantic representation. Cognitive neuropsychology, 33(3-4):130–174.
- Blank et al. (2016) Idan Blank, Zuzanna Balewski, Kyle Mahowald, and Evelina Fedorenko. 2016. Syntactic processing is distributed across the language system. Neuroimage, 127:307–323.
- Briscoe (1996) Ted Briscoe. 1996. The syntax and semantics of punctuation and its use in interpretation. In Proceedings of the Association for Computational Linguistics Workshop on Punctuation, pages 1–7. Citeseer.
- Caramazza and Zurif (1976) Alfonso Caramazza and Edgar B Zurif. 1976. Dissociation of algorithmic and heuristic processes in language comprehension: Evidence from aphasia. Brain and language, 3(4):572–582.
- Caucheteux et al. (2021a) Charlotte Caucheteux, Alexandre Gramfort, and Jean-Remi King. 2021a. Disentangling syntax and semantics in the brain with deep networks. In International Conference on Machine Learning, pages 1336–1348. PMLR.
- Caucheteux et al. (2021b) Charlotte Caucheteux, Alexandre Gramfort, and Jean-Rémi King. 2021b. Model-based analysis of brain activity reveals the hierarchy of language in 305 subjects. arXiv preprint arXiv:2110.06078.
- Cohen et al. (2021) Laurent Cohen, Philippine Salondy, Christophe Pallier, and Stanislas Dehaene. 2021. How does inattention affect written and spoken language processing? cortex, 138:212–227.
- Desai et al. (2022) Rutvik Desai, Usha Tadimeti, and Nicholas Riccardi. 2022. Proper and common names in the semantic system.
- Devlin et al. (2018) Jacob Devlin, Ming-Wei Chang, Kenton Lee, and Kristina Toutanova. 2018. Bert: Pre-training of deep bidirectional transformers for language understanding. arXiv preprint arXiv:1810.04805.
- Diakidoy et al. (2005) Irene-Anna N Diakidoy, Polyxeni Stylianou, Christina Karefillidou, and Panayiota Papageorgiou. 2005. The relationship between listening and reading comprehension of different types of text at increasing grade levels. Reading psychology, 26(1):55–80.
- Fedorenko et al. (2020) Evelina Fedorenko, Idan Asher Blank, Matthew Siegelman, and Zachary Mineroff. 2020. Lack of selectivity for syntax relative to word meanings throughout the language network. Cognition, 203:104348.
- Fedorenko et al. (2012) Evelina Fedorenko, Alfonso Nieto-Castanon, and Nancy Kanwisher. 2012. Lexical and syntactic representations in the brain: an fmri investigation with multi-voxel pattern analyses. Neuropsychologia, 50(4):499–513.
- Fedorenko and Thompson-Schill (2014) Evelina Fedorenko and Sharon L Thompson-Schill. 2014. Reworking the language network. Trends in cognitive sciences, 18(3):120–126.
- Friederici (2011) Angela D Friederici. 2011. The brain basis of language processing: from structure to function. Physiological reviews, 91(4):1357–1392.
- Friederici et al. (2006) Angela D Friederici, Christian J Fiebach, Matthias Schlesewsky, Ina D Bornkessel, and D Yves Von Cramon. 2006. Processing linguistic complexity and grammaticality in the left frontal cortex. Cerebral Cortex, 16(12):1709–1717.
- Genovese (2000) Christopher R Genovese. 2000. A bayesian time-course model for functional magnetic resonance imaging data. Journal of the American Statistical Association, 95(451):691–703.
- Glasser et al. (2016) Matthew F Glasser, Timothy S Coalson, Emma C Robinson, Carl D Hacker, John Harwell, Essa Yacoub, Kamil Ugurbil, Jesper Andersson, Christian F Beckmann, Mark Jenkinson, et al. 2016. A multi-modal parcellation of human cerebral cortex. Nature, 536(7615):171–178.
- Grodzinsky and Friederici (2006) Yosef Grodzinsky and Angela D Friederici. 2006. Neuroimaging of syntax and syntactic processing. Current opinion in neurobiology, 16(2):240–246.
- Handjaras et al. (2016) Giacomo Handjaras, Emiliano Ricciardi, Andrea Leo, Alessandro Lenci, Luca Cecchetti, Mirco Cosottini, Giovanna Marotta, and Pietro Pietrini. 2016. How concepts are encoded in the human brain: a modality independent, category-based cortical organization of semantic knowledge. Neuroimage, 135:232–242.
- Hays (1964) David G Hays. 1964. Dependency theory: A formalism and some observations. Language, 40(4):511–525.
- Hirst (1984) Graeme Hirst. 1984. A semantic process for syntactic disambiguation. In AAAI, pages 148–152.
- Hollenstein et al. (2019) Nora Hollenstein, A de la Torre, Nicolas Langer, and Ce Zhang. 2019. Cognival: A framework for cognitive word embedding evaluation. In Proceedings of The SIGNLL Conference on Computational Natural Language Learning 2019.
- Honnibal and Montani (2017) Matthew Honnibal and Ines Montani. 2017. spaCy 2: Natural language understanding with Bloom embeddings, convolutional neural networks and incremental parsing. To appear.
- Humphries et al. (2006) Colin Humphries, Jeffrey R Binder, David A Medler, and Einat Liebenthal. 2006. Syntactic and semantic modulation of neural activity during auditory sentence comprehension. Journal of cognitive neuroscience, 18(4):665–679.
- Jain and Huth (2018) Shailee Jain and Alexander G Huth. 2018. Incorporating context into language encoding models for fmri. In Proceedings of the 32nd International Conference on Neural Information Processing Systems, pages 6629–6638.
- Jawahar et al. (2019) Ganesh Jawahar, Benoît Sagot, and Djamé Seddah. 2019. What does bert learn about the structure of language? In ACL 2019-57th Annual Meeting of the Association for Computational Linguistics.
- Jung (1995) Wha-Young Jung. 1995. Syntaktische Relationen im Rahmen der Dependenzgrammatik, volume 9. Buske Verlag.
- Kaan and Swaab (2002) Edith Kaan and Tamara Y Swaab. 2002. The brain circuitry of syntactic comprehension. Trends in cognitive sciences, 6(8):350–356.
- LeBel et al. (2021) Amanda LeBel, Shailee Jain, and Alexander G Huth. 2021. Voxelwise encoding models show that cerebellar language representations are highly conceptual. Journal of Neuroscience, 41(50):10341–10355.
- Luoma and Pyysalo (2020) Jouni Luoma and Sampo Pyysalo. 2020. Exploring cross-sentence contexts for named entity recognition with bert. In Proceedings of the 28th International Conference on Computational Linguistics, pages 904–914.
- Malik-Moraleda et al. (2022) Saima Malik-Moraleda, Dima Ayyash, Jeanne Gallée, Josef Affourtit, Malte Hoffmann, Zachary Mineroff, Olessia Jouravlev, and Evelina Fedorenko. 2022. An investigation across 45 languages and 12 language families reveals a universal language network. Nature Neuroscience, 25(8):1014–1019.
- Manning et al. (2014) Christopher D Manning, Mihai Surdeanu, John Bauer, Jenny Rose Finkel, Steven Bethard, and David McClosky. 2014. The stanford corenlp natural language processing toolkit. In Proceedings of 52nd annual meeting of the association for computational linguistics: system demonstrations, pages 55–60.
- Matchin and Hickok (2020) William Matchin and Gregory Hickok. 2020. The cortical organization of syntax. Cerebral Cortex, 30(3):1481–1498.
- Merlin and Toneva (2022) Gabriele Merlin and Mariya Toneva. 2022. Language models and brain alignment: beyond word-level semantics and prediction. arXiv preprint arXiv:2212.00596.
- Milton et al. (2021) Camille K Milton, Vukshitha Dhanaraj, Isabella M Young, Hugh M Taylor, Peter J Nicholas, Robert G Briggs, Michael Y Bai, Rannulu D Fonseka, Jorge Hormovas, Yueh-Hsin Lin, et al. 2021. Parcellation-based anatomic model of the semantic network. Brain and behavior, 11(4):e02065.
- Nastase et al. (2021) Samuel A Nastase, Yun-Fei Liu, Hanna Hillman, Asieh Zadbood, Liat Hasenfratz, Neggin Keshavarzian, Janice Chen, Christopher J Honey, Yaara Yeshurun, Mor Regev, et al. 2021. The “narratives” fmri dataset for evaluating models of naturalistic language comprehension. Scientific data, 8(1):1–22.
- Oota et al. (2022a) Subba Reddy Oota, Frederic Alexandre, and Xavier Hinaut. 2022a. Long-term plausibility of language models and neural dynamics during narrative listening. In Proceedings of the Annual Meeting of the Cognitive Science Society, volume 44.
- Oota et al. (2022b) Subba Reddy Oota, Jashn Arora, Veeral Agarwal, Mounika Marreddy, Manish Gupta, and Bapi Raju Surampudi. 2022b. Neural language taskonomy: Which nlp tasks are the most predictive of fmri brain activity? arXiv preprint arXiv:2205.01404.
- Oota et al. (2022c) Subba Reddy Oota, Jashn Arora, Vijay Rowtula, Manish Gupta, and Raju S Bapi. 2022c. Visio-linguistic brain encoding. arXiv preprint arXiv:2204.08261.
- Oota et al. (2022d) Subba Reddy Oota, Manish Gupta, and Mariya Toneva. 2022d. Joint processing of linguistic properties in brains and language models. arXiv preprint arXiv:2212.08094.
- Oota et al. (2018) Subba Reddy Oota, Naresh Manwani, and Raju S Bapi. 2018. fMRI Semantic Category Decoding Using Linguistic Encoding of Word Embeddings. In International Conference on Neural Information Processing, pages 3–15. Springer.
- Pallier et al. (2011) Christophe Pallier, Anne-Dominique Devauchelle, and Stanislas Dehaene. 2011. Cortical representation of the constituent structure of sentences. Proceedings of the National Academy of Sciences, 108(6):2522–2527.
- Pennington et al. (2014) Jeffrey Pennington, Richard Socher, and Christopher D Manning. 2014. Glove: Global vectors for word representation. In Proceedings of the 2014 conference on empirical methods in natural language processing (EMNLP), pages 1532–1543.
- Rambow (2010) Owen Rambow. 2010. The simple truth about dependency and phrase structure representations: An opinion piece. In Human language technologies: The 2010 annual conference of the North American Chapter of the Association for Computational Linguistics, pages 337–340.
- Reddy and Wehbe (2021) Aniketh Janardhan Reddy and Leila Wehbe. 2021. Can fmri reveal the representation of syntactic structure in the brain? Advances in Neural Information Processing Systems, 34.
- Roark (2001) Brian Roark. 2001. Probabilistic top-down parsing and language modeling. Computational linguistics, 27(2):249–276.
- Rogalsky and Hickok (2009) Corianne Rogalsky and Gregory Hickok. 2009. Selective attention to semantic and syntactic features modulates sentence processing networks in anterior temporal cortex. Cerebral Cortex, 19(4):786–796.
- Rubin et al. (2000) Donald L Rubin, Teresa Hafer, and Kevin Arata. 2000. Reading and listening to oral-based versus literate-based discourse. Communication Education, 49(2):121–133.
- Schneider (1998) Gerold Schneider. 1998. A linguistic comparison of constituency, dependency and link grammar. Ph.D. thesis, Master’s thesis, University of Zürich.
- Toneva et al. (2022) Mariya Toneva, Tom M Mitchell, and Leila Wehbe. 2022. Combining computational controls with natural text reveals aspects of meaning composition. Nature Computational Science, 2(11):745–757.
- Toneva et al. (2020) Mariya Toneva, Otilia Stretcu, Barnabás Póczos, Leila Wehbe, and Tom M Mitchell. 2020. Modeling task effects on meaning representation in the brain via zero-shot meg prediction. Advances in Neural Information Processing Systems, 33:5284–5295.
- Toneva et al. (2021) Mariya Toneva, Jennifer Williams, Anand Bollu, Christoph Dann, and Leila Wehbe. 2021. Same cause; different effects in the brain. In First Conference on Causal Learning and Reasoning.
- Vashishth et al. (2019) Shikhar Vashishth, Manik Bhandari, Prateek Yadav, Piyush Rai, Chiranjib Bhattacharyya, and Partha P Talukdar. 2019. Incorporating syntactic and semantic information in word embeddings using graph convolutional networks. In ACL (1).
- Wang et al. (2020) Shaonan Wang, Jiajun Zhang, Nan Lin, and Chengqing Zong. 2020. Probing brain activation patterns by dissociating semantics and syntax in sentences. In Proceedings of the AAAI Conference on Artificial Intelligence, volume 34, pages 9201–9208.
- Wehbe et al. (2014) Leila Wehbe, Brian Murphy, Partha Talukdar, Alona Fyshe, Aaditya Ramdas, and Tom Mitchell. 2014. Simultaneously uncovering the patterns of brain regions involved in different story reading subprocesses. PloS one, 9(11):e112575.
- Zaccarella and Friederici (2015) Emiliano Zaccarella and Angela D Friederici. 2015. Merge in the human brain: A sub-region based functional investigation in the left pars opercularis. Frontiers in psychology, 6:1818.
- Zhang et al. (2022) Xiaohan Zhang, Shaonan Wang, Nan Lin, Jiajun Zhang, and Chengqing Zong. 2022. Probing word syntactic representations in the brain by a feature elimination method. In AAAI.
Appendix A Hyper-parameter Settings
All experiments were conducted on a machine with 1 NVIDIA GEFORCE-GTX GPU with 16GB GPU RAM. We used banded ridge-regression with following parameters: MSE loss function, and L2-decay () varied from 10-1 to 10-3; best was chosen by tuning on validation data; number of cross-validation runs was 4.
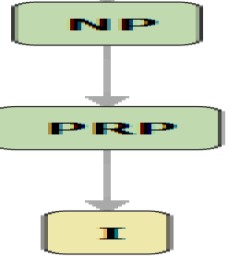
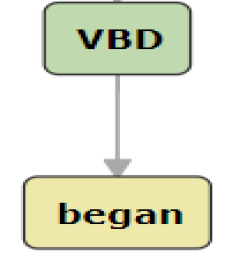
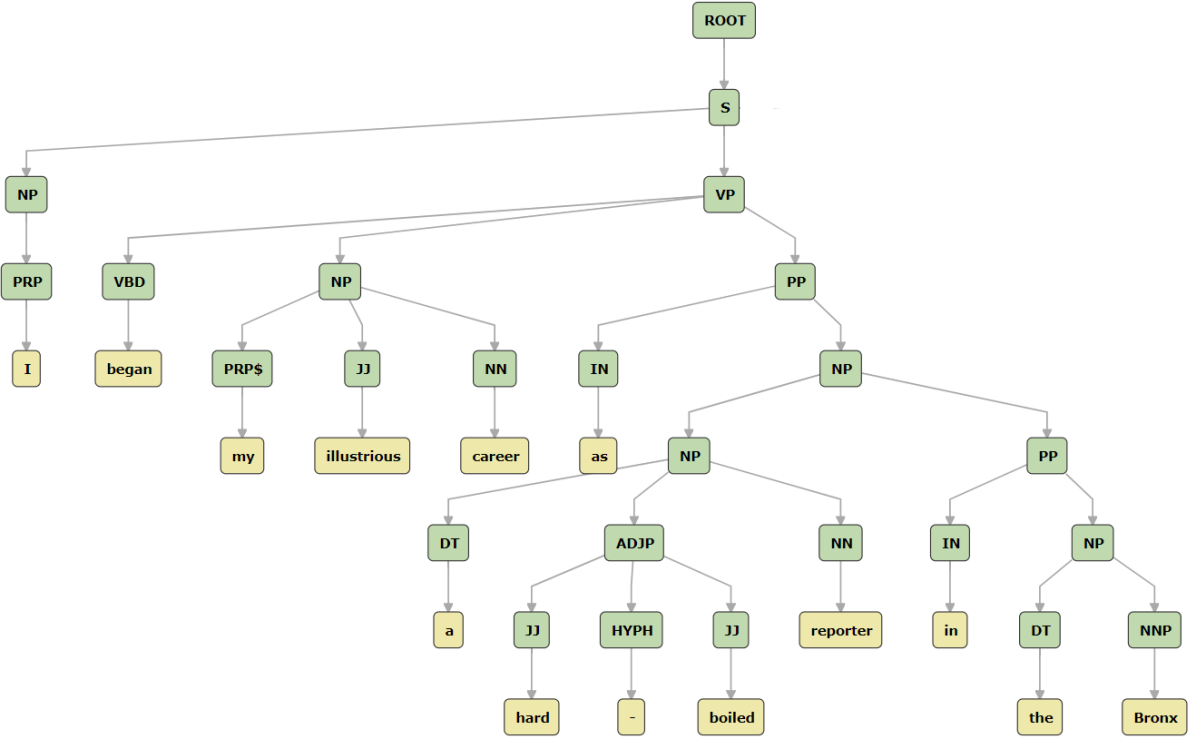
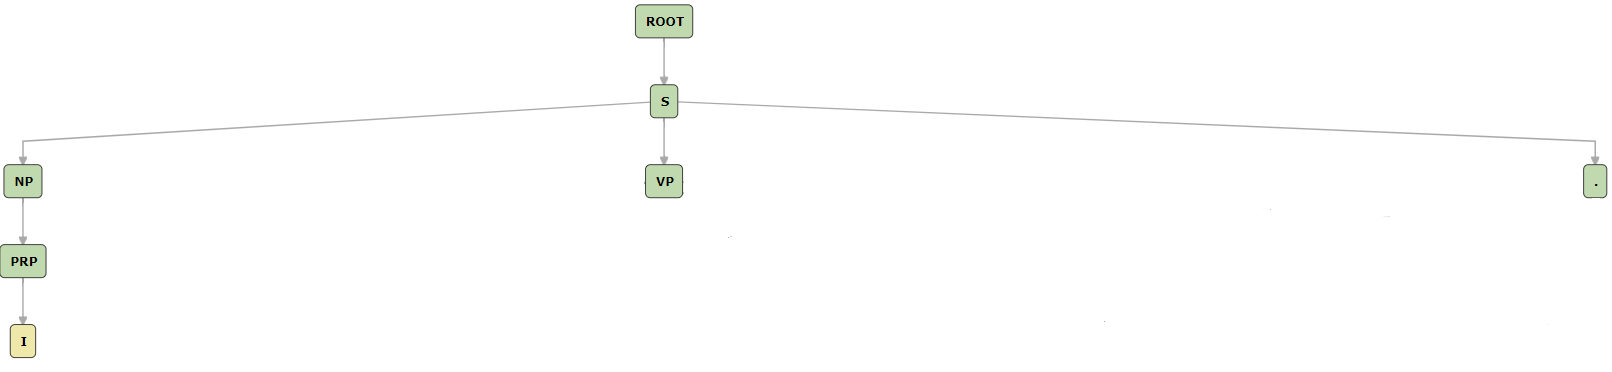
Appendix B Constituency Complete Trees
We now present the largest subtrees completed by a few of the words in the sentence: “I began my illustrious career as a hard-boiled reporter in the Bronx where I toiled for the Ram, uh, Fordham University’s student newspaper”.