The Family Tree Graph as a Predictor of the Family Members’ Satisfaction with One Another
Abstract
Individuals’ satisfaction with their nuclear and extended family plays a critical role in individuals everyday life. Thus, a better understanding of the features that determine one’s satisfaction with her family can open the door to the design of better sociological policies. To this end, this study examines the relationship between the family tree graph and family members’ satisfaction with their nuclear and extended family. We collected data from 486 families which included a family tree graph and family members’ satisfaction with each other. We obtain a model that is able to explain 75% of the family members’ satisfaction with one another. We found three indicators for more satisfied families. First, larger families, on average, have more satisfied members. Moreover, families with kids from the same parents - i.e., without step-siblings also express more satisfaction from both their siblings and parents when the children are already adults. Lastly, the average satisfaction of the family’s oldest alive generation has a positive linear and non-linear correlation with the satisfaction of the entire extended family.
Keywords: Family tree graph; Family satisfaction; sociometric; network analysis.
1 Introduction
Family is a fundamental social unit that plays a crucial role in our lives [1]. The relationships within a family can have a profound impact on the well-being and happiness of its members, as well as an indirect influence on their personal and professional development and even clinical state [2, 3, 4]. Recent studies have suggested that there are numerous personal benefits associated with high levels of life satisfaction [5, 6, 7]. While there has been considerable research on the factors that contribute to family satisfaction, such as good communication and similarity in worldview, the relationship between the family tree graph and family satisfaction is left mostly neglected [8, 9].
The family tree graph refers to the structure of a family that is constructed from a sequence of marriages, births, deaths, and divorces. As such, family trees vary widely between families due to multiple cultural, demographic, and economic factors [10]. The topology of a family tree may affect the dynamics and interactions within a family, which in turn, can impact family satisfaction [11, 12]. Unlike family tree graphs which can be formally defined and mathematically obtained, family satisfaction is subjective for each family member and can change often over time [13, 14]. Thus, it makes it challenging to precisely measure this quantity [15, 16, 17]. Nonetheless, self-declaration is still considered the best practice [18].
To the best of our knowledge, this is the first study to explore the relationship between the family tree graph and family members’ satisfaction with each other. we provide a novel approach for associating family trees and their impact on family satisfaction that first converts family tree graphs into representative feature vectors using a deep-learning-based method and then learns a regression model between the feature vector and an average family satisfaction score using an automatic machine-learning-based tool. Using this method, we change the deep learning component by manually defining features of the family tree based on several sociological theories to assess the relationship between nuclear and extended family size, sibling structure, and parental satisfaction on overall family satisfaction.
The rest of the paper is organized as follows. In Section 2, we describe our data collection procedures and provide details about the survey questions and the properties used to represent the family tree graph. Next, in Section 3, we present our findings including the effects of family size, sibling structure, and parental satisfaction. Afterward, in Section 4, we interpret our results in light of known sociological theories. Finally, in Section 5, we summarize our findings and their implications and provide recommendations for possible future work.
2 Methods and Materials
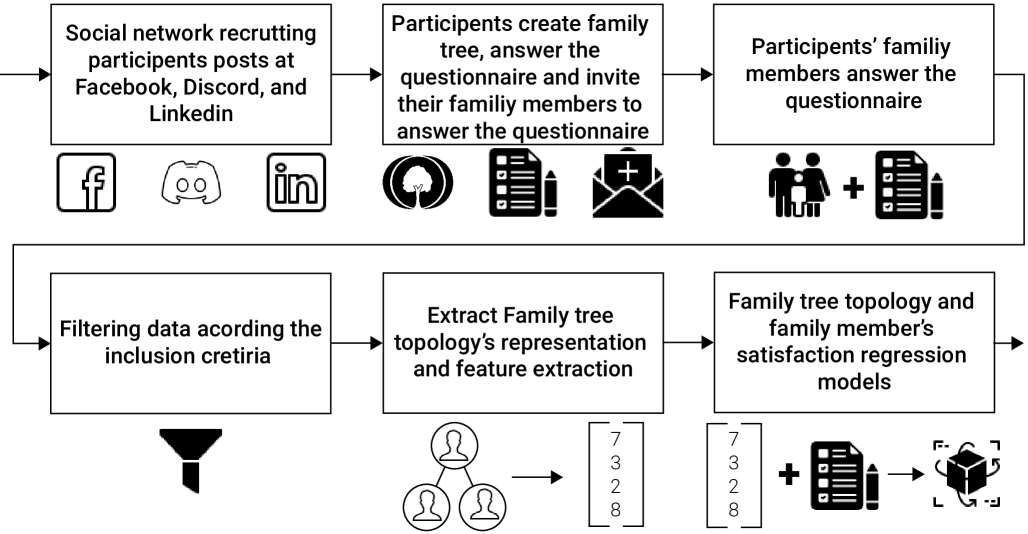
In order to learn the connection between a family tree graph and its’ members’ satisfaction from the family, we collected and analyzed two types of data from a large number of families. The study’s process can be divided into two phases: data curation and data analysis. Each one includes three steps. Next, as part of the data curation phase, we publish invention posts on several social networks including Facebook111https://www.facebook.com/, Discord222https://discord.com/, and LinkedIn333https://linkedin.com/, asking individuals to participate in this study. Participants that answer our call requested to provide their family tree with as much information as they could as well as to answer a questionnaire generated based on the family tree. Afterward, participants are requested to ask their family members, which have been included in the family tree, to also answer the questionnaire, to assess their satisfaction with their family members. Second, as part of the data analysis phase, we filter samples with enough data for analysis. Then, the family tree graph is represented using a set of features. Following that, these features are used to find a linear and non-linear connection between the family tree’s topology and the family members’ satisfaction with one another. Figure 1 presents a schematic view of the study’s flow.
2.1 Data curation
In order to minimize the possible bias of inviting participants from a specific social group such as one defined by a profession, association with some organization, or even country, we published in multiple and random groups on social media websites that focused on hobbies. For example, football fans, fantasy books lovers, and home carpentry enthusiasts. To be exact, we the same post on Facebook, Discord, and Linkedin multiple times so more potential viewers will be exposed to our posts and to reduce bias that can be associated with socio-demographic groups that are used on social media websites over others. The participants did not get any compensation for participating in our study. Each participant had to self-declare their consent for their data will be used as part of the study, they are legally considered adults in their country, and fluent in English. The post’s formalization is provided as supplementary material.
The participants of this study are divided into two: the main participants and their family members. The main participants are the ones who answered our call to participate in the study and requested to both generate the family tree as well as to answer the family member’s satisfaction questionnaire. In addition, they are responsible to request their family members to also answer the family member’s satisfaction questionnaire. In a complementary manner, the main participants’ family members are only asked to fulfill the family member’s satisfaction questionnaire.
Once a main participant is accepted the terms of the study, she is first requested to generate a family tree with at least two generations up the family tree (i.e., including one’s grandparents) and two generations wide (i.e., including one’s second-order cousins, if exists), treating themselves as the central node in the family tree. Technically, to do so, the participants are directed to the MyHeritage444https://myheritage.com website which provides a simple and visual tool to generate family trees and export them. Once the participants generated their family tree, they upload it to the experiment’s website which generated for each family a unique survey. For each survey, each family member had to score their personal satisfaction score, ranging between 1 and 10, from each family member where 1 is the lowest satisfaction score and 10 is the highest one. At the beginning of each survey, a family member is asked to state one’s full name so the scoring of each family member could later be associated with its node in the family tree. The main participant is then asked to first answer the survey herself and then share the survey’s unique URL (Uniform Resource Locator) with her family members.
2.2 Data analysis
To ensure the quality and completeness of our data, we restricted our sample to families with at least three generations and a minimum of ten members. In addition, we also excluded families with incomplete or missing data where the survey is answered by less than 80% of the family members.
Formally, for each family, we have a tuple where is the family tree graph such that is the graph’s nodes that represent the family members and is the set of connections between the family members and . In addition, is a matrix where is the satisfaction of family member with family member , ranging between 1 and 10. Importantly, the matrix is not necessarily symmetry as family members and do not have identical satisfaction from one another.
From the family members’ point of view, we define two levels of family satisfaction. First, the extended family satisfaction (EFS) of any member in the family () is defined to be the average satisfaction of all the family members with one another. Mathematically, we define EFS as follows:
| (1) |
Second, on the nuclear family satisfaction (NFS) of a member includes a subset of the family such that includes ’s children and spouse, denoted by . If the family member is not legally adult, the nuclear family is defined to be one’s parents and siblings. Formally, we define NFS as follows:
| (2) |
In order to use the family tree graph as a source for EFS or NFS, one should first represent the graph component () using a feature vector [19]. To this end, deep neural network-based models are currently considered the state-of-the-art for this task [20, 21]. Hence, we adopted the Variational Graph AutoEncoder (VGAE) model proposed by [22] since it is shown promising results while being trained on a relatively small dataset due to the relatively small number of parameters in the model, which is suitable for our case. The VGAE model encodes the family tree graph into a 16-dimensional feature vector. This vector is used as the source feature and the EFS score is used as the target feature as part of a regression task to learn the connection between the two. We solved this regression task, which generates a model denoted by , using the Tree-based Pipeline Optimization Tool (TPOT) [23] which finds an optimal machine learning pipeline using a genetic algorithm approach [24, 25, 26, 27]. For the training of the VGAE model, we used the entire dataset. However, for the model, we first randomly divide the dataset into training and testing cohorts such that these cohorts contain 80% and 20% of the data, respectively. In addition, during the training of the model, we used the k-fold cross-validation method on the training cohort [28]. The models’ hyperparamters and their values are summarized in Table 1. Figure 2 shows a schematic view of the model training process.
| Hyperparamter | Value |
|---|---|
| Number of epochs of the VGAE model | 100 |
| The VGAE model’s learning rate | 0.01 |
| The VGAE model’s decay rate | 0.001 |
| The VGAE model’s batch size | 8 |
| TPOT’s number of folds of the cross-validation () | 5 |
| TPOT’s number of generations | 100 |
| TPOT’s population size | 100 |
| TPOT’s mutation rate | 0.05 |

Since the VGAE model produces a feature vector that is not explainable, it does not allow us to investigate which and how much of the family tree properties are influencing the EFS and NFS metrics. Hence, we replace the VGAE model by manually defining five features of the family tree as follows: 1) average nuclear family size [29, 30, 31]; 2) male-to-female ratio [32, 33]; 3) generation age difference [34, 35]; 4) step-siblings and divorce [36]; 5) the oldest members’ average satisfaction [37]. Using these features, we train both a linear regression model [38] as well as a non-linear model obtained using TPOT. For each one of these models, we computed the relative influence of each feature on the target feature (i.e., either EFS or NFS).
3 Results
Our analysis consists of three parts: First, we report the main social characteristic of our sample, including details about the data-gathering process. Afterward, we analyze the ability of the model to predict the family members’ satisfaction from the family tree graph. Finally, we analyze the characteristics and linear and non-linear influence of the family tree graph features on the family members’ satisfaction with one another.
3.1 Social properties and descriptive statistics analysis
All responses were kept confidential and anonymous as clearly stated to the participants at the beginning of the questionnaire. The data was collected between January 2023 and May 2023. Overall, an estimated 93 thousand individuals were exposed to our initial invitation to participate in this study. A sample of 617 individuals was obtained ( response rate). All participants had to acknowledge that they are fluent in English and they are legally considered adults in their countries in order to avoid non-relevant samples and provided their informed consent. Based on the filtering criteria, we removed 28 families with less than three generations or 10 family members and additional 103 families where less than 80% of the family members (which are considered adults) fulfilled the questionnaire. Thus, 486 families are included in the analysis.
The families in our sample were found to be highly versatile. 91.77% (446) of the families included three generations around the main member while 5.14% (25) and 3.09% (15) included four and five generations, respectively. The number of family members ranged between 10 and 93 with average and standard divination of . For both the EFS and NFS the scores range between 3.62-8.45 and 2.49-8.92 with average and standard divination of and , respectively.
3.2 Prediction model performance
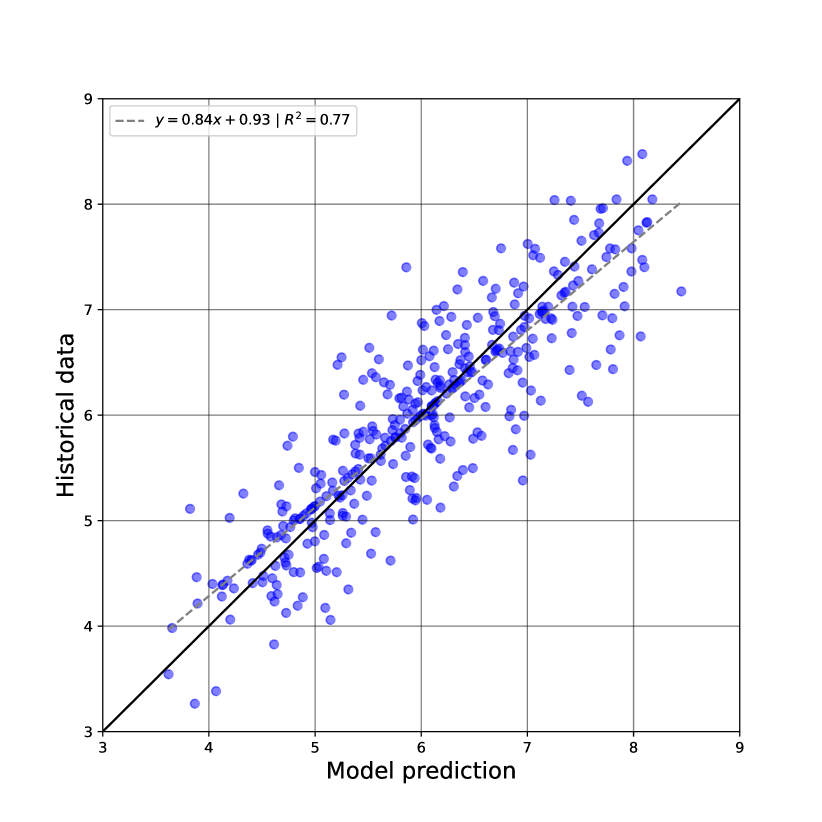
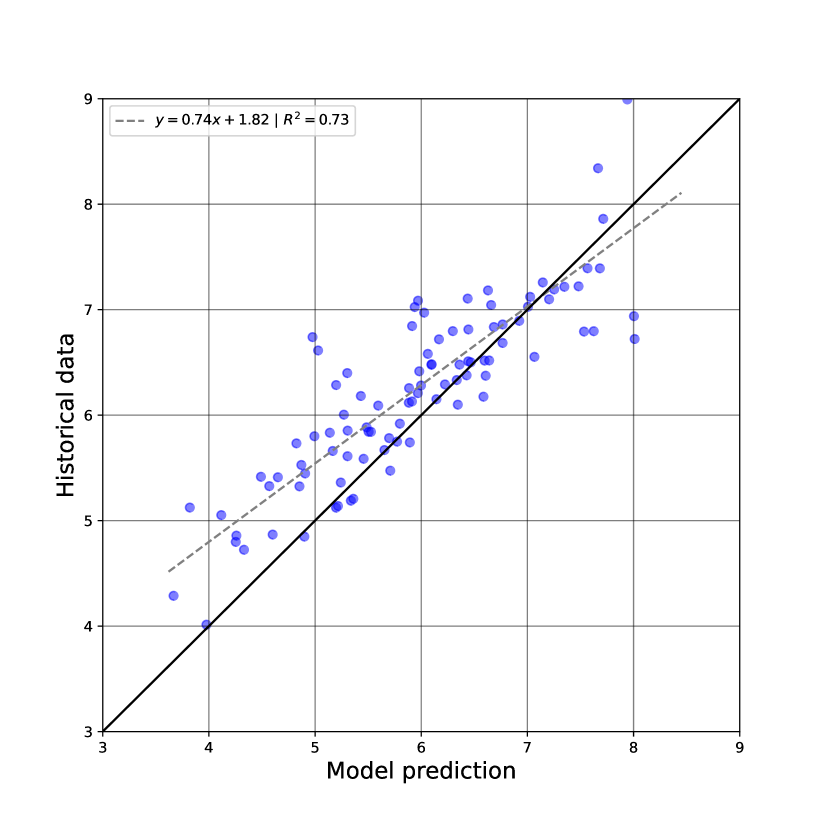
Fig. 3 shows the results of the model’s prediction on the training (389 samples) and testing (97 samples) cohorts. The x-axis indicates the model prediction and the y-axis indicates the historical data. The solid (black) line indicates the optimal fit and the gray (dashed) line indicates the linear regression fitting of the data. For the training cohort, the model obtained a mean absolute error (MAE) score of with a coefficient of determination of . In a similar manner, for the testing cohort, we obtain a MAE of with a coefficient of determination of . While the results for the testing cohort are slightly worse than the ones obtained for the training cohort, the model seems not to overfit and therefore captures a well-generalized relationship between the family tree graph and the family’s satisfaction.
3.3 Family tree features’ importance
Repeating the fitting of the model but with the manually defined feature vector, we produce both linear and non-linear models. Compared to the previous model, both the linear and non-linear models obtain worse results. Namely, the linear model obtained for the training and testing cohorts a MAE of 0.93 and 1.18, and a coefficient of determination () of 0.32 and 0.24, respectively. The non-linear model obtained for the training and testing cohorts a MAE of 0.67 and 0.85, and a coefficient of determination () of 0.65 and 0.61, respectively. The drop in the performance of the non-linear model is associated with the fact that the manually defined feature vector is computationally worse than the one obtained by the VGAE model.
Table 2 summarizes the relative contribution of each feature for both the linear and non-linear model. For the linear model, if an increase in the feature value results in an increase in the score, we marked it with the plus sign and we marked the opposite case with the minus sign. One can notice that all five feature preserve their sign in the linear model for both the EFS and NFS scores. This indicates that the two are similar but not identical as indicated by a two-tailed T-test conducted between the two, revealing . Moreover, the average nuclear family size and oldest members’ average satisfaction are positively correlated to the average family satisfaction score while the male to female ratio as well as the generation age difference and step-siblings count results in a decrease in the family satisfaction score. These outcomes can be found by the non-linear model. Taken jointly, it indicates the consistency of the relative importance of these features in predicting both the EFS and NFS scores.
| Property | Satisfaction measurement | Linear model | Non-linear model |
|---|---|---|---|
| Average nuclear family size | EFS | (+) | |
| NFS | (+) | ||
| Male to female ratio | EFS | (-) | |
| NFS | (-) | ||
| Generation age difference | EFS | (-) | |
| NFS | (-) | ||
| Step-siblings and divorce | EFS | (-) | |
| NFS | (-) | ||
| Oldest members’ average satisfaction | EFS | (+) | |
| NFS | (+) |
4 Discussion
In this study, we investigated the relationship between a family tree and its members’ satisfaction with one another. We collected data from 486 families with around eight thousand participants in total. In order to extract the complex data encoded in family trees and find their connection to the extended family satisfaction scores, we used a deep learning neural network to encode the family tree graph into a vector and then an automatic machine learning tool that produces a regression model.
Fig. 3 suggests that the family tree graph is able to estimate a family’s satisfaction. In particular, by comparing Fig. 3(a) and Fig. 3(b), one can see that the obtained model is able to generalize the results from the training data to families it does not see before which indicates the model is robust. Thus, we show that one can predict, to some extent, the family members’ satisfaction with one another, on average. Our results show that family members’ satisfaction is highly unsymmetrical and versatile inside the family and between families.
In addition, Table 2 shows that the average nuclear family size and the oldest members’ average satisfaction have a positive linear correlation to both the nuclear and extended family satisfaction while the number of step-siblings has a negative linear correlation. The male to female ratio and the generation age difference also has a negative linear correlation but it is much smaller compared to the other three features. Since these outcomes are preserved in the non-linear as well, we can conclude that the obtained relative importance distribution between them is robust. Hence, policymakers can define policies that take these findings into account to improve the satisfaction of individuals from their family members which would be reflected in their overall well-being [39].
There are several limitations to this study. First, the study relied on self-reported measures of family satisfaction, which may be subject to social desirability bias. Moreover, we included a relatively small sample size which can not be representative of the entire population. In addition, we focused on English-speaking families which might result in cultural bias in our sample. Finally, the study did not account for other factors that may influence family satisfaction, such as income, education, and cultural background. In a complementary manner, future work can include the usage of non-linear but explainable data-driven methods to better understand the connection found in this work, such as symbolic regression [40, 41, 42].
5 Conclusion
This study reveals that it is able to fairly estimate a family’s members’ satisfaction using the family’s tree. This connection seems to be highly complex and based on the data encoded in the family tree’s graph such as generation differences, gender dynamics, and size of groups to manage a complex relationship such as a family, all already established in various studies [29, 32, 34, 36, 37]. Formally, to reveal this connection, we use a graph autoencoder followed by an automatic machine learning tool to obtain a regression model. The potential applicative outcomes of this study are significant as understanding the factors that contribute to family satisfaction can inform interventions aimed at promoting family well-being and happiness. For example, policymakers could use this information to develop policies aimed at supporting families and promoting family well-being. However, it is important to note the limitations of this study, including its reliance on self-reported measures of family satisfaction and the use of a relatively small sample size.
References
- [1] G. Simmel. On the sociology of the family. Theory, Culture & Society, 15(3-4):283–293, 1998.
- [2] S. Mauno, U. Kinnunen, and M. Ruokolainen. Exploring work- and organization-based resources as moderators between work–family conflict, well-being, and job attitudes. Work & Stress, 20(3):210–233, 2006.
- [3] H. Prime, M. Wade, and D. T. Browne. Risk and resilience in family well-being during the covid-19 pandemic. American Psychologist, 75(5):631–643, 2020.
- [4] A. J. Cherlin. Going to extremes: Family structure, children’s well-being, and social science. Demography, 36:421–428, 1999.
- [5] S. M. Suldo and E. S. Huebner. Does life satisfaction moderate the effects of stressful life events on psychopathological behavior during adolescence? School Psychology Quarterly, 19:93–105, 2004.
- [6] R. Gilman and E. S. Huebner. Characteristics of adolescents who report very high life satisfaction. J Youth Adolescence, 35:293–301, 2006.
- [7] L. Becchetti and A. Pelloni. What are we learning from the life satisfaction literature? Int Rev Econ, 60:113–155, 2013.
- [8] M. A. T. Fitzpatrick. All in the family: Interpersonal communication in kin relationships relationships. Handbook of Interpersonal Communication, pages 687–736, 1985.
- [9] R. B. Nes, N. Czajkowski, and K. Tambs. Family matters: Happiness in nuclear families and twins. Behav Genet, 40:577–590, 2010.
- [10] J. Lambrecht and J. Lievens. Pruning the family tree: An unexplored path to family business continuity and family harmony. Family Business Review, 21(4):295–313, 2008.
- [11] S. L. Brown. Family structure and child well-being: The significance of parental cohabitation. Journal of Marriage and Family, 66:351–367, 2004.
- [12] P. M. Krueger, D. P. Jutte, L. Franzini, I. Elo, and M. D. Hayward. Family structure and multiple domains of child well-being in the united states: a cross-sectional study. Population Health Metrics, 13:6, 2015.
- [13] J. Schwarze and R. Winkelmann. Happiness and altruism within the extended family. J Popul Econ, 24:1033–1051, 2011.
- [14] R. Rego Lins Fumis, I. N. Nishimoto, and D. Deheinzelin. Measuring satisfaction in family members of critically ill cancer patients in brazil. Intensive Care Med, 32:124–128, 2006.
- [15] R. B. Zabriskie and P. J. Ward. Satisfaction with family life scale. Marriage & Family Review, 49(5):446–463, 2013.
- [16] L. J. Kristjanson. Validity and reliability testing of the famcare scale: Measuring family satisfaction with advanced cancer care. Social Science & Medicine, 36(5):693–701, 1993.
- [17] J. R. Agate, R. B. Zabriskie, S. T. Agate, and R. Poff. Family leisure satisfaction and satisfaction with family life. Journal of Leisure Research, 41(2):205–223, 2009.
- [18] S. A. Prince, L. Cardilli, J. L. Reed, T. J. Saunders, C. Kite, K. Douillette, K. Fournier, and J. P. Buckley. A comparison of self-reported and device measured sedentary behaviour in adults: a systematic review and meta-analysis. International Journal of Behavioral Nutrition and Physical Activity, 17:31, 2020.
- [19] H. Saigo, S. Nowozin, T. Kadowaki, T. Kudo, and K. Tsuda. gboost: a mathematical programming approach to graph classification and regression. Machine Learning, 75:69–89, 2009.
- [20] J. Zhou, G. Cui, S. Hu, Z. Zhang, C. Yang, Z. Liu, L. Wang, C. Li, and M. Sun. Graph neural networks: A review of methods and applications. AI Open, 1:57–81, 2020.
- [21] W. L. Hamilton, R. Ying, and J. Leskovec. Representation learning on graphs: Methods and applications. arXiv, 2017.
- [22] Thomas N Kipf and Max Welling. Variational graph auto-encoders. NIPS Workshop on Bayesian Deep Learning, 2016.
- [23] R. S. Olson and J. H. Moore. Tpot: A tree-based pipeline optimization tool for automating machine learning. In JMLR: Workshop and Conference Proceedings, volume 64, pages 66–74, 2016.
- [24] J. H. Holland. Genetic algorithms. Scientific American, 267(1):66–73, 1992.
- [25] L. Bo and L. Rein. Comparison of the luus–jaakola optimization procedure and the genetic algorithm. Engineering Optimization, 37(4):381–396, 2005.
- [26] A. Ghaheri, S. Shoar, M. Naderan, and S. S. Hoseini. The applications of genetic algorithms in medicine. Oman Med J., 30(6):406–416, 2005.
- [27] A. Alexi, T. Lazebnik, and L. Shami. Microfounded tax revenue forecast model with heterogeneous population and genetic algorithm approach. Computational Economics, pages 1–30, 2023.
- [28] R. Kohavi. A study of cross validation and bootstrap for accuracy estimation and model select. In International Joint Conference on Artificial Intelligence, 1995.
- [29] S. L. Hofferth. Long-term economic consequences for women of delayed childbearing and reduced family size. Demography, 32:141–155, 1984.
- [30] J. Caceres-Delpiano. The impacts of family size on investment in child quality. Journal of Human Resources, 4:738–754, 2006.
- [31] D. Popenoe. Beyond the nuclear family: A statistical portrait of the changing family in sweden. Journal of Marriage and Family, 49(1):173–183, 1987.
- [32] G. L. Fox, M. L. Benson, A. A. DeMaris, and J. Van Wyk. Economic distress and intimate violence: Testing family stress and resources theories. Journal of Marriage and Family, 64:793–807, 2002.
- [33] L. C. Chen, E. Huq, and S. D’Souza. Sex bias in the family allocation of food and health care in rural bangladesh. Population and Development Review, 7(1):55–70, 1981.
- [34] P. R. Amato. The impact of family formation change on the cognitive, social, and emotional well-being of the next generation. The Future of Children, 15(2):75–96, 2005.
- [35] J. S. Jackson, I. Forsythe-Brown, and I. O. Govia. Age cohort, ancestry, and immigrant generation influences in family relations and psychological well-being among black caribbean family members. Journal of Social Issues, 63:729–743, 2007.
- [36] L. A. JGennetian. One or two parents? half or step siblings? the effect of family structure on young children’s achievement. J Popul Econ, 18:415–436, 2005.
- [37] S. A. Ruiz and M. Silverstein. Relationships with grandparents and the emotional well-being of late adolescent and young adult grandchildren. Journal of Social Issues, 63:793–808, 2007.
- [38] T. L. Lai, H. Robbins, and C. Z. Wei. Strong consistency of least squares estimates in multiple regression ii. Journal of Multivariate Analysis, 9(3):343–361, 1979.
- [39] L. A. Newland. Family well‐being, parenting, and child well‐being: Pathways to healthy adjustment. Clinical Psychologist, 19(1):3–14, 2015.
- [40] P. A. K. Reinbold, L. M. Kageorge, M. F. Schatz, and R. O. Grigoriev. Robust learning from noisy, incomplete, high-dimensional experimental data via physically constrained symbolic regression. Nature Communications, 12(1):1–8, 2021.
- [41] L. S. Keren, A. Liberzon, and T. Lazebnik. A computational framework for physics-informed symbolic regression with straightforward integration of domain knowledge. Scientific Reports, 13(1):1249, 2023.
- [42] L. Kammerer, G. Kronberger, B. Burlacu, S. M. Winkler, M. Kommenda, and M. Affenzeller. Symbolic regression by exhaustive search: reducing the search space using syntactical constraints and efficient semantic structure deduplication. In Genetic Programming Theory and Practice XVII, pages 79–99. Springer, 2020.
Declarations
Funding
This research did not receive any specific grant from funding agencies in the public, commercial, or not-for-profit sectors.
Conflicts of interest/Competing interests
None.
Data availability
The data that has been used in this study is available by a formal request from the author.