Ophthalmic Biomarker Detection Using Ensembled Vision Transformers - Winning Solution to IEEE SPS VIP Cup 2023
Abstract
This report outlines our approach in the IEEE SPS VIP Cup 2023: Ophthalmic Biomarker Detection competition. Our primary objective in this competition was to identify biomarkers from Optical Coherence Tomography (OCT) images obtained from a diverse range of patients. Using robust augmentations and 5-fold cross-validation, we trained two vision transformer-based models: MaxViT and EVA-02, and ensembled them at inference time. We find MaxViT’s use of convolution layers followed by strided attention to be better suited for the detection of local features while EVA-02’s use of normal attention mechanism and knowledge distillation is better for detecting global features. Ours was the best-performing solution in the competition, achieving a patient-wise F1 score of 0.814 in the first phase and 0.8527 in the second and final phase of VIP Cup 2023, scoring 3.8% higher than the next-best solution.
1 Introduction
Accurate ophthalmic biomarker detection using Optical Coherence Tomography (OCT) images has received tremendous attention in contemporary research in ophthalmology, with significant implications in the diagnosis and treatment of eye conditions. In this context, the IEEE SPS VIP Cup 2023 presented a unique opportunity to explore innovative approaches in the field of ophthalmic biomarker detection. This paper outlines our approach to address this issue, focusing on utilizing vision transformer-based models to analyze OCT images.
On this backdrop, to solve this ophthalmic biomarker detection task, we employed two distinct models, the Multi-Axis Vision Transformer (MaxViT) [1] and EVA-02 [2], carefully selected following a systematic exploration, for their respective proficiency in identifying local and global features within the images. The intricate exploration and subsequent integration of these models were pivotal in formulating a solution that not only fulfilled the competition’s criteria but also advanced the state-of-the-art of ophthalmic biomarker detection in both understanding and methodology.
2 Methodology
2.1 Dataset
The competition provided a rich dataset, OLIVES [3], encompassing 9408 labeled image-biomarker pairs from 96 patients and an additional 78185 unlabeled OCT images, each accompanied by clinical labels. The competition was divided into two phases as follows. In Phase 1 (2), the test dataset consisted of 3871 (250) images from 40 different (167 new) patients.
Each OCT scan segment was labeled to denote the presence or absence of 6 biomarkers, namely Intraretinal Hyperreflective Foci (IRHRF), Partially Attached Vitreous Face (PAVF), Fully Attached Vitreous Face (FAVF), Intraretinal Fluid (IRF), Diffuse Retinal Thickening or Diabetic Macular Edema (DRT/DME) and Vitreous Debris (VD). Depending on the spatial extent, IRHRF and IRF can be loosely grouped as local features, meaning they could be detected by looking at just a subsection of the image. On the other hand, PAVF, FAVF, and VD are global features with DRT/DME falling somewhat in between. We elucidate the rationale behind the dataset partitioning in relation to model architecture in section 3.3.
2.2 Models Considered
We considered multiple variants of ResNet [4] models and Inception [5] models (collectively referred to as Convolution-based Models henceforth).
Inspired by [6], we added Convolutional Block Attention Modules (CBAM) [7] to InceptionResnetV2 (referred to as IRV2_CBAM for brevity). We added three such CBAMs after the Stem, Reduction A, and Reduction B modules of InceptionResnetV2. The improved performance of IRV2_CBAM (to be presented in Section 3) inspired us to move to vision transformer models, including ViT [8], MaxViT [1], and EVA-02 [2].
Our early tests indicated an important role for image dimensions when detecting biomarkers. This observation was corroborated through a consultation with an ophthalmologist, wherein the discussion came up that downsizing images to a resolution of 224x224 pixels might have made it harder to identify these biomarkers. As such, we focused on models pre-trained on larger images. ViT [8], MaxViT [1] and EVA-02 [2] support image resolutions of , and respectively. Notably, we could only use the base version of these models due to computational constraints.
2.3 Hyperparameters
We used AdamW[9] optimizer with default initialization and set the initial learning rate to . We used the Exponential Learning Rate Scheduler, with a weight decay of 0.9. For convolution-based models, we used 128 as the batch size and trained models for 35 epochs, with early stopping based on the best cross-validation F1 score. For transformer-based models, we used the largest possible batch size supported by our hardware, which was 1 for MaxViT and 2 for both EVA-02 and ViT. To account for the small batch size, we set the gradient accumulation steps to 8. We trained all vision transformer models for two epochs. We found all ViT models to be prone to overfitting the training data after 2 epochs.
2.4 Data Augmentation
In Phase 1, we used random greyscale transformation with , color jitter with , random resized crop with , random horizontal flip, and finally, normalization with a mean of 0.1706 and a standard deviation of 0.2112. We found 0.7 to be the optimal scale for random resized crop while keeping other augmentations constant. Other augmentation parameters were not optimally tuned.
For Phase 2, we add a random perspective shift augmentation with , , and to make the training data similar to the Phase 2 evaluation dataset. In both phases, we did not augment the test data beyond resizing and normalization.
2.5 5-fold Cross Validation
For both phases, we performed 5-fold cross-validation where we partitioned the data into 5 folds with 80% in the train set and 20% on the validation set. On these 5 different folds, we trained our models and ran inference on the test set after every epoch, and combined the confidence scores to obtain the final binary decision for each biomarker.
2.6 Ensembling MaxViT and EVA-02
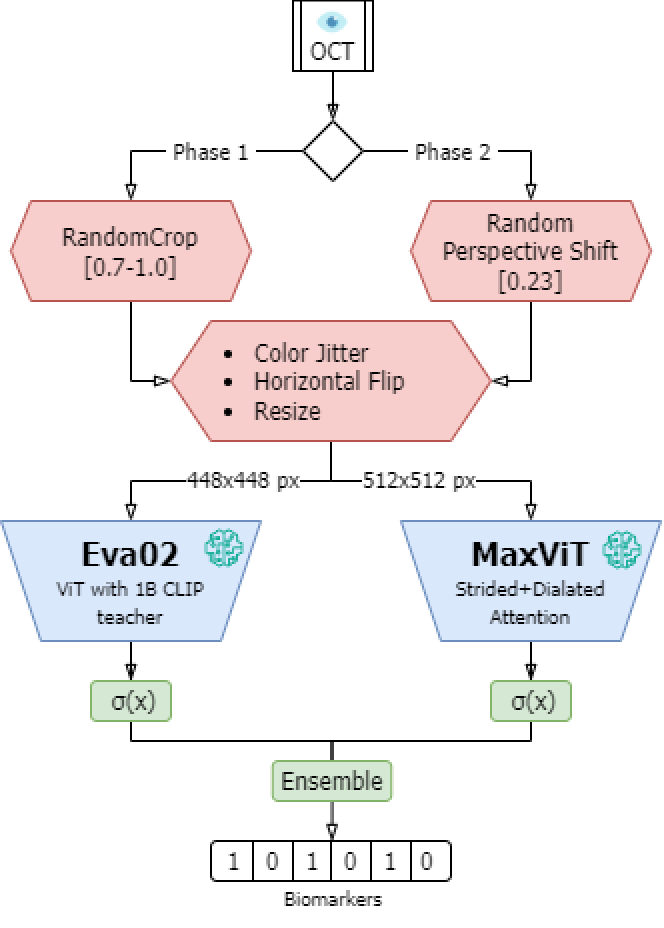
The complementary strengths of MaxViT and EVA-02 naturally imply that ensembling their outputs has the potential to improve upon their individual performance across all biomarkers. One straightforward way to implement this is by using MaxViT to detect local biomarkers and using EVA-02 for global biomarkers. In this scheme, MaxViT’s predictions for global biomarkers are entirely ignored (as well as EVA-02’s predictions for local ones). We also apply a finer-grained ensembling scheme, where we average both model’s output probabilities. Fig. 1 presents a schematic overview of our overall pipeline. We will refer to this (finer-grained) ensemble as MaxViT-EVA-02.
2.7 Evaluation Metrics
In the domain of medical imaging where severe class imbalance is the norm, the F1 score often is the metric of choice instead of accuracy. For Phase 1 of the competition, to test the generalization ability of solutions, the F1 score was calculated over all the images in the test set. For Phase 2, to measure personalization: how well a model performs on individual patients, patient-wise F1 scores were calculated over images from the same patient and these scores were averages over all patients in the test dataset. More details can be found on the competition website.
2.8 Hardware Specification and Environment Setup
For convolution-based models implemented in Tensorflow[10], we used Kaggle TPU VM v3-8 instances paired with 330GB RAM. Due to the limited support of state-of-the-art models on TPU, we mainly used this setup for pilot experiments. For transformer-based models (implemented in PyTorch 2.0.1[11] and ‘timm’ [12] library with the weights hosted on Hugging Face), we used Kaggle Nvidia P100 GPU instances with 16GB VRAM, 13GB RAM, and 19GB disk space. We used scikit-learn [13] libraries for other auxiliary needs. The runtime of our complete MaxViT pipeline, including training, validation, and inference, was approximately 11 hours, while that of our EVA-02 pipeline was approximately 7 hours.
3 RESULTS AND DISCUSSIONS
3.1 Model Selection Results
To establish a baseline, we trained multiple variants of ResNet [4] models and Inception [14] models. We find that model size or model performance on ImageNet dataset [15] are not reliable indicators of its suitability for the task at hand (Table 1). InceptionResnetV2[5] (55.84 M parameters) proved to be the most effective model with an F1 score of 0.686 and the much smaller InceptionV3 (23.83 M parameters) model performed comparably with an F1 score of 0.682 (Table 1).
| Model | Param(M) | ImageNet | Test F1 |
|---|---|---|---|
| ConvNextBase | 88.59 | 87.13 | 0.612 |
| Resnet50 | 25.57 | 75.30 | 0.634 |
| Resnet152 | 66.84 | 78.57 | 0.649 |
| Resnet101 | 44.57 | 78.25 | 0.657 |
| EfficientNetV2L | 118.52 | 86.80 | 0.662 |
| InceptionV3 | 23.83 | 78.95 | 0.682 |
| InceptionResnetV2 | 55.84 | 80.46 | 0.686 |
3.2 5-fold Cross Validation Results
5-fold cross-validation boosts out Phase-1 test scores substantially. Initial experiments revealed that our best-performing convolution-based model, InceptionResnetV2 consistently scored 0.66 when trained on random 80% splits of the train set. However, using cross-validation, InceptionResnetV2 consistently scored around 0.68. As such, we used cross-validation in all further experiments and in the final submission as well. Individually, MaxViT and EVA-02 models scored 0.68 while with cross-validation they scored 0.71.
3.3 Classification of Biomarkers according to Spatial Extent
Upon reviewing the images, we noticed that biomarkers B1 (IRHRF), B4 (IRF), and B5 (DRT/DME) were local, meaning they could be detected by looking at just a subsection of the image. This observation was confirmed by an ophthalmologist, who also mentioned that B5 is somewhat in between local and global.
3.4 Analysis Of Adding CBAM
Adding CBAM [7] to InceptionResnetV2 substantially boosted the F1 score from 0.686 to 0.696 (Table 2) for a negligible increase in the network complexity (i.e., parameter count increased by only 0̃.37%; not reported in the table). Notably, this boost in performance actually inspired us to move to vision transformer models.
To understand the reason for the improved F1 scores, we calculated the F1 score across biomarker types individually and discovered that CBAM improved the performance on certain biomarkers substantially while showing marginal improvement in others. It even registered a deterioration, albeit only slightly, in one case. Therefore, we hypothesize that the attention module improved the detection of local biomarkers.
| Biomarker | Type | IRV2 | IRV2_CBAM | VIT_BASE |
|---|---|---|---|---|
| IRHRF | L | 0.709 | 0.746 (+) | 0.773 (+) |
| PAVF | G | 0.610 | 0.609 | 0.662 (+) |
| FAVF | G | 0.837 | 0.841 | 0.869 (+) |
| IRF | L | 0.557 | 0.599 (+) | 0.552 |
| DRT/DME | L/G | 0.599 | 0.628 (+) | 0.594 |
| VD | G | 0.753 | 0.759 | 0.755 |
| Overall | 0.686 | 0.696 | 0.701 |
3.5 Comparison of Convolution-based and Transformer-based Models
Although adding an attention mechanism in the form of CBAM to InceptionResnet specifically improves the performance on local biomarkers, we find no such correlation when comparing convolution-based models and the purely attention-based ViT [8] architectures. This suggests the need for explicit convolution in addition to attention for optimal biomarker detection.
3.6 Effectiveness of Convolution and Attention
MaxViT[1] is a vision transformer model composed of multiple MaxViT blocks where each block performs convolution, strided/block attention, and dilated/grid attention. The addition of explicit convolution makes MaxViT ideal for biomarker detection. We achieved an F1 score of 0.718 (Table 3) using the base variant of the MaxViT model, which is a substantial improvement over IRV2_CBAM and ViT_BASE. However, MaxViT does not utilize true attention across all image tokens, which motivated us to test EVA-02 [2], a plain Vision Transformer model that improves upon the standard ViT [8] by using a 1B parameter EVA-CLIP model as its teacher. The parameter counts of MaxViT and EVA-02 are 119.88M and 87.12M respectively. Comparing MaxViT and EVA-02 across the 6 biomarkers, we see that EVA-02 performs noticeably better on global biomarkers despite being smaller between the two. we hypothesize that MaxViT’s sparse attention improves the detection of local biomarkers while EVA-02’s true attention excels at detecting global features.
3.7 Ensembling Results
While our simple ensembling does boost the test set F1 score to 0.720 (not shown in the table for brevity), the finer-grained ensembling scheme yields an even greater performance with an improved F1 score of 0.724.
| Biomarker | Type | MaxViT | EVA-02 | Ensemble |
|---|---|---|---|---|
| IRHRF | L | 0.774 | 0.731 | 0.779 |
| PAVF | G | 0.677 | 0.701 | 0.688 |
| FAVF | G | 0.868 | 0.874 | 0.879 |
| IRF | L | 0.611 | 0.575 | 0.600 |
| DRT/DME | L/G | 0.615 | 0.593 | 0.618 |
| VD | L | 0.764 | 0.779 | 0.782 |
| Overall | Overall | 0.718 | 0.709 | 0.724 |
3.8 Patient-wise F1 score and Leaderboard Position
Our MaxViT-EVA-02 ensemble pipeline achieved a patient-wise F1 score of 0.814 averaging over 40 patients and 3781 images in the first phase and 0.8527 in the second phase (167 patients and 250 images). Our second phase F1 score is 3.8% higher than the next best solution (0.8215) in the competition as per the competition website.
3.9 Leveraging Unlabelled Training Data
Several strategies were explored to enhance the model’s performance on the task using unlabelled data and the accompanying clinical labels. Initially, contrastive learning was applied following [16]; however, it did not yield any improvement, maintaining a score of 0.686. Although looked promising, we were not able to explore contrastive learning using ViT models due to computational constraints. Subsequently, pretraining the InceptionResnetV2 model was attempted, but this approach also failed to enhance the model’s performance, with the score remaining stagnant at 0.686. To exploit the availability of two additional clinical labels besides the six target biomarkers, the model was trained to predict all eight labels, anticipating a more refined gradient descent. Unfortunately, this modification did not lead to any improvement, with the score persisting at 0.686. Lastly, the implementation of pseudo-labeling was explored, but it significantly deteriorated the model’s performance, plummeting the score to 0.519.
3.10 Analysis of Outlying Patient-wise F1 Scores
In the analysis of cases where the model exhibited a low F1 score in detecting biomarkers from OCT scans, several patterns were observed. Patient 01-002 at week 40 and patient 02-044 at week 0 presented with severe spots, resulting in F1 scores of 0.64 and 0.55, respectively. Moderate spots were identified as the likely cause for the low F1 scores of 0.6 in patients 01-007 at week 100 and 01-049 at week 0. Additionally, patient 01-043 at week 100 exhibited a severe artifact, leading to the lowest F1 score of 0.37. Moderate artifacts were also noted in patients 01-049 and 02-044 at week 100, with F1 scores of 0.6 and 0.52, respectively. However, the likely cause for the low F1 scores observed in patients 01-019, 01-036, and 01-054 at week 100 (F1 scores of 0.51, 0.62, and 0.48) are not immediately evident to non-medical professionals. We leave a more thorough analysis and subsequent pipeline adjustments as future work.
4 CONCLUSION
In this work, we presented the methodology of our final submission to the second phase of IEEE SPS VIP Cup 2023: Ophthalmic Biomarker Detection. We also presented the underlying motivation for pipeline design decisions. We find that Vision Transformer (ViT) models have begun to consistently outperform their Convolutional Neural Network (CNN) counterparts. Furthermore, we find that k-fold cross-validation and model ensembling continue to be effective means to utilize the entire dataset and to improve the generalization of predictions.
5 ACKNOWLEDGEMENT
We would like to extend our sincere gratitude to Dr. S.M. Rezwan Hussain, a distinguished ophthalmologist at the Eye Department, Combined Military Hospital(CMH), Dhaka. Bangladesh, for his invaluable insights and expertise regarding biomarker classification according to their spatial extent.
References
- [1] Zhengzhong Tu, Hossein Talebi, Han Zhang, Feng Yang, Peyman Milanfar, Alan Bovik, and Yinxiao Li, “Maxvit: Multi-axis vision transformer,” ECCV, 2022.
- [2] Yuxin Fang, Quan Sun, Xinggang Wang, Tiejun Huang, Xinlong Wang, and Yue Cao, “Eva-02: A visual representation for neon genesis,” arXiv preprint arXiv:2303.11331, 2023.
- [3] Mohit Prabhushankar, Kiran Kokilepersaud, Yash-yee Logan, Stephanie Trejo Corona, Ghassan AlRegib, and Charles Wykoff, “Olives dataset: Ophthalmic labels for investigating visual eye semantics,” 2022.
- [4] Kaiming He, Xiangyu Zhang, Shaoqing Ren, and Jian Sun, “Deep residual learning for image recognition,” in Proceedings of the IEEE conference on computer vision and pattern recognition, 2016, pp. 770–778.
- [5] Christian Szegedy, Sergey Ioffe, Vincent Vanhoucke, and Alexander Alemi, “Inception-v4, inception-resnet and the impact of residual connections on learning,” in Proceedings of the AAAI conference on artificial intelligence, 2017, vol. 31.
- [6] Zhuang Ai, Xuan Huang, Jing Feng, Hui Wang, Yong Tao, Fanxin Zeng, and Yaping Lu, “Fn-oct: Disease detection algorithm for retinal optical coherence tomography based on a fusion network,” Frontiers in Neuroinformatics, vol. 16, 2022.
- [7] Sanghyun Woo, Jongchan Park, Joon-Young Lee, and In So Kweon, “Cbam: Convolutional block attention module,” in Proceedings of the European conference on computer vision (ECCV), 2018, pp. 3–19.
- [8] Alexey Dosovitskiy, Lucas Beyer, Alexander Kolesnikov, Dirk Weissenborn, Xiaohua Zhai, Thomas Unterthiner, Mostafa Dehghani, Matthias Minderer, Georg Heigold, Sylvain Gelly, et al., “An image is worth 16x16 words: Transformers for image recognition at scale,” arXiv preprint arXiv:2010.11929, 2020.
- [9] Ilya Loshchilov and Frank Hutter, “Decoupled weight decay regularization,” arXiv preprint arXiv:1711.05101, 2017.
- [10] Martín Abadi, Ashish Agarwal, Paul Barham, Eugene Brevdo, Zhifeng Chen, Craig Citro, Greg S. Corrado, Andy Davis, Jeffrey Dean, Matthieu Devin, Sanjay Ghemawat, Ian Goodfellow, Andrew Harp, Geoffrey Irving, Michael Isard, Yangqing Jia, Rafal Jozefowicz, Lukasz Kaiser, Manjunath Kudlur, Josh Levenberg, Dandelion Mané, Rajat Monga, Sherry Moore, Derek Murray, Chris Olah, Mike Schuster, Jonathon Shlens, Benoit Steiner, Ilya Sutskever, Kunal Talwar, Paul Tucker, Vincent Vanhoucke, Vijay Vasudevan, Fernanda Viégas, Oriol Vinyals, Pete Warden, Martin Wattenberg, Martin Wicke, Yuan Yu, and Xiaoqiang Zheng, “TensorFlow: Large-scale machine learning on heterogeneous systems,” 2015, Software available from tensorflow.org.
- [11] Adam Paszke, Sam Gross, Francisco Massa, Adam Lerer, James Bradbury, Gregory Chanan, Trevor Killeen, Zeming Lin, Natalia Gimelshein, Luca Antiga, Alban Desmaison, Andreas Kopf, Edward Yang, Zachary DeVito, Martin Raison, Alykhan Tejani, Sasank Chilamkurthy, Benoit Steiner, Lu Fang, Junjie Bai, and Soumith Chintala, “Pytorch: An imperative style, high-performance deep learning library,” in Advances in Neural Information Processing Systems 32, pp. 8024–8035. Curran Associates, Inc., 2019.
- [12] Ross Wightman, “Pytorch image models,” https://github.com/rwightman/pytorch-image-models, 2019.
- [13] Fabian Pedregosa, Gaël Varoquaux, Alexandre Gramfort, Vincent Michel, Bertrand Thirion, Olivier Grisel, Mathieu Blondel, Peter Prettenhofer, Ron Weiss, Vincent Dubourg, et al., “Scikit-learn: Machine learning in python,” Journal of machine learning research, vol. 12, no. Oct, pp. 2825–2830, 2011.
- [14] Christian Szegedy, Wei Liu, Yangqing Jia, Pierre Sermanet, Scott Reed, Dragomir Anguelov, Dumitru Erhan, Vincent Vanhoucke, and Andrew Rabinovich, “Going deeper with convolutions,” in Proceedings of the IEEE conference on computer vision and pattern recognition, 2015, pp. 1–9.
- [15] Jia Deng, Wei Dong, Richard Socher, Li-Jia Li, Kai Li, and Li Fei-Fei, “Imagenet: A large-scale hierarchical image database,” in 2009 IEEE conference on computer vision and pattern recognition. Ieee, 2009, pp. 248–255.
- [16] Kiran Kokilepersaud, Stephanie Trejo Corona, Mohit Prabhushankar, Ghassan AlRegib, and Charles Wykoff, “Clinically labeled contrastive learning for oct biomarker classification,” IEEE Journal of Biomedical and Health Informatics, 2023.