The Digitization of Photographic Spectra in the Dominion Astrophysical Observatory Plate Collection with Commercial Scanners: A Pilot Study
Abstract
Commercial flatbed scanners have the potential to deliver a quick and efficient means of capturing the scientific content of spectra recorded on photographic plates. We discuss the digitization of selected spectra in the Dominion Astrophysical Observatory (DAO) photographic plate collection with commercial scanners. In this pilot study, emphasis is placed on assessing if the information on the plates can be recovered using Epson V800 and 12000XL scanners; the more complicated issues associated with the shortcomings of photographic materials, such as correcting for nonlinearity, is deferred to a future study. Spectra of Vega ( Lyr) that were recorded over decades with the DAO 1.8 meter telescope are examined. These spectra sample a range of photographic emulsions, plate preparation techniques, calibration information, observing techniques, and spectrograph configuration. A scanning density of 2400 elements per inch recovers information in the spectra. Differences in the modulation transfer function (MTF) of the two scanners are found, with the Epson 12000XL having a superior MTF. Comparisons with a CCD spectrum of Vega confirm that moderately weak features are faithfully recovered in photographic spectra that have been digitized with the 12000XL scanner. The importance of scanning the full plate to cover the light profile of the target and calibration information is emphasized. Lessons learned from these experiments are also presented.
1 INTRODUCTION
The Dominion Astrophysical Observatory (DAO) hosts an extensive collection of photographic spectra that were recorded throughout much of the last century. The collection includes spectra that were obtained with the DAO 1.8 meter telescope (commissioned 1918), the DAO 1.2 meter telescope (commissioned 1962), and the 0.4 meter telescope at the Dominion Observatory (DO) in Ottawa (commissioned 1905). The spectra recorded at the latter facility date back to 1915, and so are the oldest in the collection.
The DAO collection contains spectra that were recorded over many decades, and so digitized versions of the plates are a potentially important resource for long-term studies of stellar properties. However, there are various complications associated with the digitization of these spectra. From a purely pragmatic perspective, digitizing the tens of thousands of plates in the DAO collection in an efficient manner that captures their full information content, including all calibration information, presents a formidable logistical challenge. Another challenge is the construction of an archive of digitized material that links all available ancillary material for each plate. Yet another challenge is providing data products given that the plates contain a diverse range of calibration information for calibrating the wavelength scale and assessing nonlinearity. An unfortunate related problem is that many members of the community who are familiar with photographic materials and their limitations are either aged or deceased. This paper deals with the digitization of the spectra, as the capture of information in a digital format is a fundamental first step for enabling further examination of these data.
An instrument that has been commonly employed in the past to digitize photographic spectra is the Photometric Data Systems (PDS) microdensitometer. While providing detailed control over parameters that are important for recovering scientific content, digitization with a PDS can be a slow process, and this has spurred the development of customized devices for the digitization of large format plates (e.g. Stobie, 1984). These devices typically require specialized environments, and so are not portable. Challenges that arise due to vibration, thermal stability, and warm-up time have been discussed by Teuber (1984). Still, efforts to digitize moderately large ensembles of photographic material using microdensitometers have been undertaken; arguably one of the most ambitious such endeavours was the scanning of the Palomar Observatory Sky Survey and the UK Schmidt survey to construct products such as the Guide Star Catalogue (e.g. Lasker et al., 1990).
There are many tens of thousands of plates in the DAO collection, and so it is important to identify an efficient means of scanning this material and recovering the information that they contain. This can not be accomplished simply by restricting the area on each plate to be scanned, as a typical photographic spectrum contains useful information over a large part of its area. For example, the seeing profile broadens the spectrum perpendicular to the dispersion direction, and the profile should be sampled in its entirety to enhance the signal-to-noise (S/N) ratio. There are calibration regions that can be used to determine the characteristic curve of the plate. The seemingly empty areas of each plate also contain information for assessing scattered light, fogging, and blemishes (e.g. fingerprints from incorrect handling of the unexposed plates, hair, dust etc); corrections for these are needed if the ultimate goal is to produce a digitized spectrum that can approach the quality of those recorded with a CCD. When considered together, these factors make scanning a large collection of photographic spectra with a device such as a PDS a daunting task.
The current generation of commercial scanners offer an intriguing alternative to PDSs. The potential benefits of scanners are obvious; they are easy to use and can be deployed on an office desk. They do not require specialized set-up and training for operation. Moreover, an entire plate is scanned in one pass, allowing the complete slit profile and the full range of calibration information to be sampled. Still, the ability of earlier generations of these devices to deliver science-caliber data has been questioned, due primarily to the limited resolution of the optics (e.g. Simcoe, 2009). However, there have since been successful applications in which recent models have been employed to digitize images (Yuldoshev et al., 2019; Cerny et al., 2021; Glusman et al., 2022).
In this study we adopt an empirical approach to assess if the current generation of desktop scanners can capture the core science content of photographic spectra. This is done by scanning a modest set of spectra with two off-the-shelf devices. The ultimate benchmark for assessing the results is a comparison with spectra recorded with a CCD detector. Such a comparison necessitates the use of a star with stable spectroscopic properties, and Vega is selected for the current work.
Vega has a long history of use as a reference star. It has stable H absorption (Charlton et al., 1985), although Bohm et al. (2012) conclude that it is a ‘quiet’ pulsator. Gray (2007) and Hill et al. (2010) discuss other issues that may affect its status as a standard star, although these will not affect the conclusions reached in this study. In addition to spectrophotometric stability, the spectrum of Vega contains a rich collection of features that are useful diagnostics for assessing the recovery of science content. The deep Balmer absorption lines in the spectra of Vega and other early A stars are important for assessing linearity and wavelength resolution, as these lines sample a broad range of intensities along the characteristic curve. Weak metallic absorption features in the Vega spectrum allow additional limits to be placed on scientific utility and linearity.
There are also purely pragmatic reasons for selecting Vega as a reference. It is one of the brightest stars in the northern sky, and it transits at midnight during the summer when the skies above the DAO tend to be clear. There are thus numerous high-quality photographic spectra of this star in the plate collection that span the entire period of time that plates were in use. There are also a number of spectra of Vega recorded with a CCD detector, and comparisons with these observations provide an important means of gauging the information contained in a digitized spectrum.
The scanning experiments discussed in this paper are restricted to spectra recorded with the 1.8 metre telescope, which constitute the largest part of the DAO plate collection. These spectra span a multi-decade timeline, and were recorded with a range of observing conditions, instrumental configurations, and plate preparation techniques. The oldest of the spectra have minimal or no linearity calibration information, but almost all have on-plate arc spectra for wavelength calibration. Many of the spectra were recorded for radial velocity studies, with emphasis on measuring the centroids of prominent lines, as opposed to quantitative measurements of line shape and strength. The influence of the radial velocity emphasis when extracting spectra for other purposes is discussed later in the paper.
There are a number of issues to be considered when dealing with spectra retrieved from photographic plates with the ultimate goal of creating a scientifically useful digital archive. Paramount among these is the identification of procedures that will allow the information on a plate to be captured in a digital format. The current paper focuses on this issue by examining a small number of photographic spectra with the goal of assessing the viability of digitization with a commercial scanner. We emphasize that this paper does not deal with other issues such as capturing metadata and the development of software that is required to extract detailed scientific information from the spectra, although calibration information is examined to estimate signal levels where the response is expected to be linear. As demonstrated later in this paper, the results are promising, thereby encouraging future digitization efforts with commercial scanners.
2 PLATE SELECTION
Glass is a fragile storage medium, requiring protection from hazards that might cause it to break or crack. The plates at DAO are stored in individual envelopes that are placed upright in metal filing cabinets. The cabinets are in a temperature-controlled environment, and are stored with a complete collection of observing logs. Envelopes are labeled with the target name, location on the sky, the date of acquisition, and other information, the nature of which depends mainly on when the data were recorded. There are an estimated spectra in the 1.8 metre plate collection. While not the subject of this work, there are also a large number of direct imaging plates that were recorded at the telescope’s Newtonian focus.
The main criteria for selecting plates to be used in this study were (1) a signal level that produced a visually prominent spectrum in which at least the deepest absorption lines are detected, and (2) a ‘good’ cosmetic quality, such that the areas of the plates that contain the stellar spectra and calibration information are not damaged or cracked. The assessment of signal level was done visually by searching for clear detections of Balmer lines. Selection with this criterion is a straightforward task given the depths of these lines in the Vega spectrum, coupled with the brightness of Vega, which means that there are few spectra of this source in the DAO collection in which lines are not detected. There are a large number of Vega spectra in the DAO collection, and no effort was made to identify the ’best’ spectrum at a given epoch. A cursory visual examination, such as that employed here, is the sort of procedure that a user might employ when conducting an initial search for spectra of potential interest in an undigitized plate collection.
The intent of the first criterion is to cull noisey spectra, and it also biases the sample toward spectra in which much of the signal samples the middle and upper portions of the characteristic curve. As demonstrated later in this paper, there is a compelling reason to select spectra where strong lines can be detected, as these are helpful to examine characteristics such as nonlinearity and the overall scientific utilty of a scanned spectrum. As for the second criterion, an effort has been made to identify plates with cosmetics that are typical of the collection in general. Plates that tend to show evidence of low-level fogging and/or modest cosmetic defects such as scratches and/or detritus embedded in the emulsion are the norm. All of the plates in the DAO collection contain writing that includes the plate number and source name. None of these artifacts overlapped with the spectrum and calibration information.
A final criterion was the central wavelength of the observations, which is important to enable plate-to-plate comparisons. A large fraction of the spectra recorded with the 1.8 metre telescope sample wavelengths between 0.38 and m. This wavelength interval was intentionally targeted in the early years of 1.8 meter operation to accommodate the radial velocity studies that were the motivation for building the telescope. This wavelength interval also contains a rich population of Balmer lines and numerous atomic transitions from metals in the Vega spectrum. Hence, spectra that are approximately centered near H were selected for this work.
The selection process described above is admittedly qualitative. However, the goal was not to identify the best spectra of Vega, but those that appear to be among the best at a given epoch in terms of line detection. In fact, later in the paper it is shown that the spectra sample a range of S/Ns and line depths, as is to be expected based on factors such as emulsion type, hyper-sensitivation methods (if any), and instrument throughput. Future users of undigitized plate archives may impose stricter quantitative requirements on spectra selected for use, based on the intended scientific purpose. In this regard, users might consider conducting an initial assessment of plates based on a significantly lower spatial digitization frequency and digitization format (e.g. 8 bit sampling) than that ultimately adopted for full scientific use, as spectra obtained with even comparatively low density scans provide hints to scientific potential (e.g. Figure 5). Such a time-saving approach to conduct an initial assessment of spectroscopic content might prove to be of great use when examining very large format plates, such as grism or grens surveys conducted at prime focus.
Plates containing spectra of Vega that were recorded over a four decade timeline were selected for digitization. These sample different emulsions, instrumentation, and plate preparation procedures. Details of the plates, including information taken from the nightly observing logs, are provided in Table 1. There are multiple spectra of Vega on the 1949 and 1963 plates, and these allow an examination of intraplate homogeneity and linearity that should be independent of emulsion type and hypersensitization procedure.
| Date | Plate # aaInternal numbering scheme for 1.8 meter plates. | SeeingbbInformation taken from the observing logs. | Plate Type/bbInformation taken from the observing logs. | Notes |
|---|---|---|---|---|
| (arcsec) | Emulsion | |||
| August 14, 1925 | 12101 | 1.5 | E-40 | Minimal linearity information |
| June 27, 1937 | 26881 | 4 | E-40 | No linearity calibration. |
| Recorded in twilight. | ||||
| October 20, 1949 | 40452 | 4 | Cr H.S.ccH.S. = hypersensitized | 3 spectra - 30/15/10 seconds; No arcs |
| July 5, 1963 | 59216 | 4 | IV-0 | 4 spectra |
The design of the original spectrograph is described by Plaskett (1918, 1924), and the instrument described in those papers was used to record the 1925 and 1937 plates. Major changes were made to the spectrograph in the mid 1940s to deliver higher spectral resolutions (Beales et al., 1946), and the 1949 and 1963 spectra were recorded with this configuration. While provisions were made to use gratings as part of this upgrade, prisms were used as dispersive elements up until at least the mid 1950s (Richardson & McKellar, 1956, e.g.). Informal discussions with staff suggest that minor modifications were made to the instrument throughout the time span of the observations discussed here, but these were done without archived documentation.
3 SCANNING
The spectra were digitized with Epson V800 and 12000XL scanners. Information about both devices can be found on the Epson corporate website 111https://files.support.epson.com/docid/cpd4/cpd41530.pdf and https://files.support.epson.com/docid/cpd5/cpd53120.pdf. The V800 is compact, light weight, relatively inexpensive, and is intended for home and office use. It has a mm scanning surface, and so multiple 1.8 meter photographic spectra can be scanned at once. A maximum resolution of 4800 dots per inch (DPI) over the entire scanner surface is advertised, with even higher scanning densities claimed over smaller areas. Still, Simcoe (2009) found that the modulation transfer function (MTF) of a similar Epson scanner (model V750) did not allow the advertised maximum resolution to be realized in practice. Evidence is presented later in this paper that the MTF of the V800 scanner produces fuzzier images than the 12000XL scanner when scanning at 2400 dpi.
When it was purchased by DAO in late 2022, the Epson 12000XL was the premier Epson scanner for high-quality artistic and commercial use. A working assumption for purchasing this device was that the MTF would be superior to that of its smaller, less expensive V800 cousin. The 12000XL has a mm scanning surface, and so there is a multiplex advantage when compared with the V800 scanner. Nevertheless, there is a trade-off between scanning density and area coverage, as internal memory limitations mean that full spatial coverage can not be realised when scanning at the highest sampling densities. While resolutions as high as 2400 dpi are advertised over the entire 12000XL scanning surface, this was found to hold only for lower contrast scanning modes, and so is not appropriate for the scanning of spectra. A maximum resolution of 4800 dpi is advertised for smaller areas, although such high resolutions may not be needed for photographic plates given the m resolution of photographic emulsions. A 12000XL scanner has been used to digitize photographic images in the Yerkes Observatory plate collection (Cerny et al., 2021; Glusman et al., 2022). Cerny et al. (2021) scanned a r’eseau screen with a 12000XL scanner, and conclude that features that are ‘significantly smaller than m’ can be resolved. For comparison, the 2400 dpi scanning density that is adopted for the current work corresponds to m sampling.
All plates were scanned with 16 bit sampling, and some were also recorded with 8 bit sampling. While 8 bit sampling obviously compromises contrast, it was considered as a possible initial diagnostic to assess the quality of spectra in an undigitized archive. The final spectra obtained with 8 bit sampling are similar to those recorded with 16 bit sampling, likely because spectra are extracted over a range of locations along the slit (see next section). When information from the different locations is combined then digitization effects are suppressed. Still, scanning for scientific use should be conducted with 16 bit sampling, which is the norm for raw CCD data produced by many observatories.
One side of each plate envelope contains pertinent information about the observations, and these were also scanned. Ideally, the envelope images would be coupled with each scanned spectrum in an archive. While not discussed here, a digital copy of observing logs that are not restricted to the date of observation would also be extremely useful to assist in the identification of comparison stars and information that may not be recorded on each page of the log, such as plate and emulsion type.
We have examined the uniformity of the illumination across the inch surface that abuts the upper and left hand edges of the scanning surface. A single plate was positioned at various points on this surface and then scanned. Light levels were then measured in the same parts of each extracted plate image. A comparison of the light levels reveals a dispersion in the measurements that is of the signal level. The largest deviations are associated with the left hand edge of the scanning surface, and the dispersion for plates that do not contact this edge is substantially lower, amounting to . These comparisons suggest that plates should be offset from the edges of the scanning surface.
An example of scanned spectra and their protective envelopes is shown in Figure 1. The spectra and calibration information occupy only a modest fraction of each plate. However, as discussed in the next section, information from a large part of the scanned plate is used during the initial stages of processing. Non-sky artifacts such as minor cosmetic defects and writing are also visible on the plates. Unfortunately, the information on the 1925 plate envelope is in pencil, and has faded with time. This highlights the need to digitize information from that era in a timely manner before it degrades further.
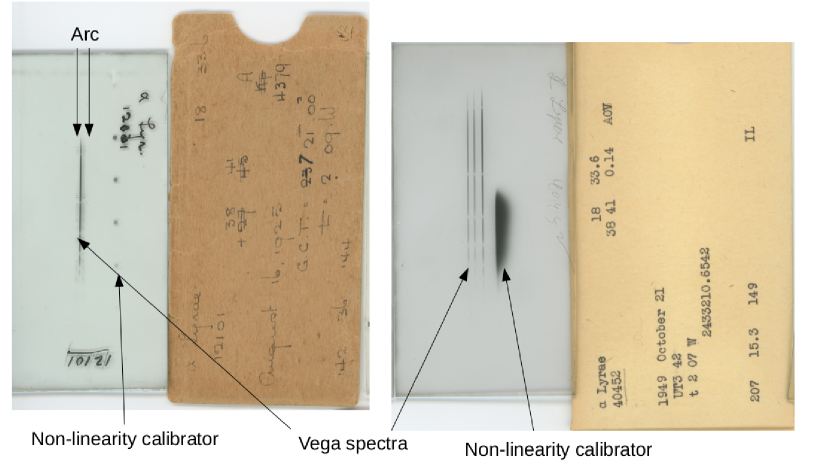
The spectra in Figure 1 show the range of calibration information in the 1.8 meter plate collection. The linearity calibration information for the 1925 spectrum consists of a series of dots with graduated intensity to the right of the stellar spectrum. In contrast, the 1949 plate contains three spectra of Vega and has a continuous staircase-like calibration region to assess response. As this can be traced along two dimensions then it should allow for the construction of a much better sampled characteristic curve than what could be extracted from the calibration dots in the 1925 spectrum, although saturation and scattered light in this part of the 1949 plate are complicating factors. The 1949 plate lacks the emission arc spectra that are required for an independent wavelength calibration.
All plates were scanned at 2400 dpi (i.e. roughly m spatial resolution), based on the results of experiments that are discussed in Section 5. Scanning an inch area at 2400 dpi resolution with the 12000XL scanner in greyscale mode took just under 10 minutes from the start of scanning to the writing of data to disk. The scanning time scales roughly with the square of the scanning density. Therefore, scanning at 1200 dpi will proceed faster than scanning at 2400 dpi.
4 PRODUCING A SPECTRUM
The scanned plates require processing to extract spectra and remove signatures introduced by the instrumentation, atmospheric conditions, and the scanning process. Basic processing steps are described below. These were done using tasks in the IRAF images and onedspec packages. These allow for an assessment of the scanned spectra while also demonstrating the information content of bright star spectra in the 1.8 meter plate collection. The processing does not include corrections for departures from linearity, and further processing will undoubtedly be required for more specific applications.
4.1 Initial Processing and Extraction
Scanned spectra were saved to disk in TIFF format. These were then converted into FITS files using the GNU Image Manipulation Program 111Copyright (C) 2000,2001,2002 Free Software Foundation, Inc. 59 Temple Place, Suite 330, Boston, MA 02111-1307 USA to permit subsequent processing with IRAF (Tody, 1986, 1993). The pixel format of the FITS files was either 8 bit or 16 bit, depending on the format selected for scanning (Section 3).
The next step was to extract an area from each plate that includes the stellar spectrum, arc lines, calibration regions for the characteristic curve, and the surrounding ‘empty’ areas. These latter regions are used to assess the signal produced by the scanning light source, and track low spatial-frequency variations in the background light level. Areas that include writing and other nonsky artifacts were avoided when possible.
There is a tendency for the scanned images to not align with the cardinal axes. This could result from the intrinsic shape of the plate, the placement of the plate in the cassette at the telescope, and/or the positioning of the plate on the scanning surface. The scanned image was adjusted for this by tracing the ridgeline of the spectrum and applying a rotation correction. The 1.8 meter spectra do not show signs of curvature, and so a single rotation correction was adequate. The digitized spectra were then inverted (i.e. multiplied by –1) to produce a positive image.
The blank area on each plate contains signal from the scanning light source. This background light level was measured in the area of each plate that is well separated from the stellar spectrum and the calibration information by fitting a linear relation to the signal on a row-by-row basis. These fits were made perpendicular to the dispersion axis, and the results were subtracted out. The fitting of a linear relation allowed low spatial frequency variations in the light level that might occur due to fogging or in scattered light to be tracked. The removal of the background signal in this manner produced a flatter background than that in the raw scanned plates.
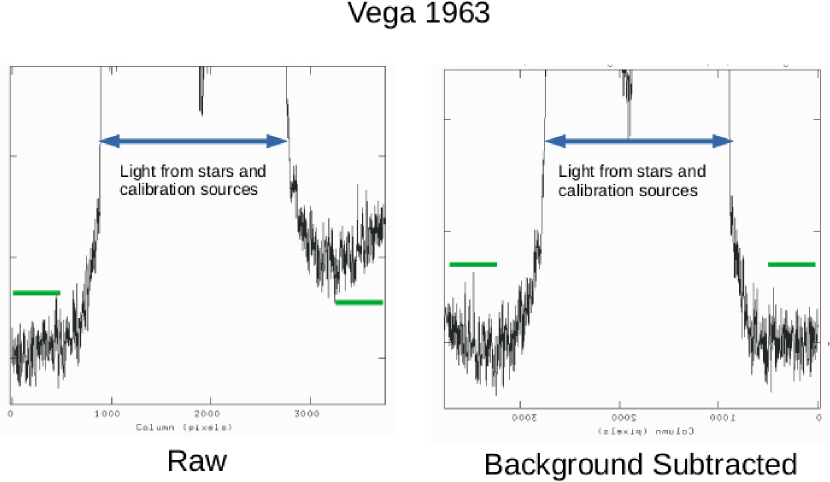
An example of background subtraction is shown in Figure 2, where a cut through the scanned 1963 Vega plate perpendicular to the dispersion axis before and after background subtraction is shown. The section shown in Figure 2 is at a wavelength that is close to H. As would be expected from Figure 1, the background light is markedly fainter than the light from the stellar spectra, the arcs, and the linearity calibration region. The removal of a linear trend based on the signal in the areas indicated with the green lines greatly suppresses systematic trends in the signal. Residual systematic variations remain near the left hand edge after background subtraction, indicating that a linear relation is only an approximation of large-scale trends. Scans done with the V800 and 12000XL scanners show similar results, suggesting that background trends like that shown in Figure 2 are intrinsic to the plate, and not an artifact of the scanning process or scanner.
Lines in the emission arc were then extracted. This was done by co-adding the signal across each of the arc spectra that bracket the stellar spectrum. These arcs were presumably recorded before and after the science exposure to account for instrument flexure. The arcs do not monitor the wavelength resolution of the stellar spectra as the arc light is not fed through the main slit. There is a m (i.e. 1 – 2 resolution elements with 2400 dpi scanning) offset between line locations in the two arcs perpendicular to the dispersion axis. Such small offsets are consistent with an expectation of minimal flexure given the short exposure times associated with observing a bright source like Vega, and also validate the rotation correction applied to the scanned images.
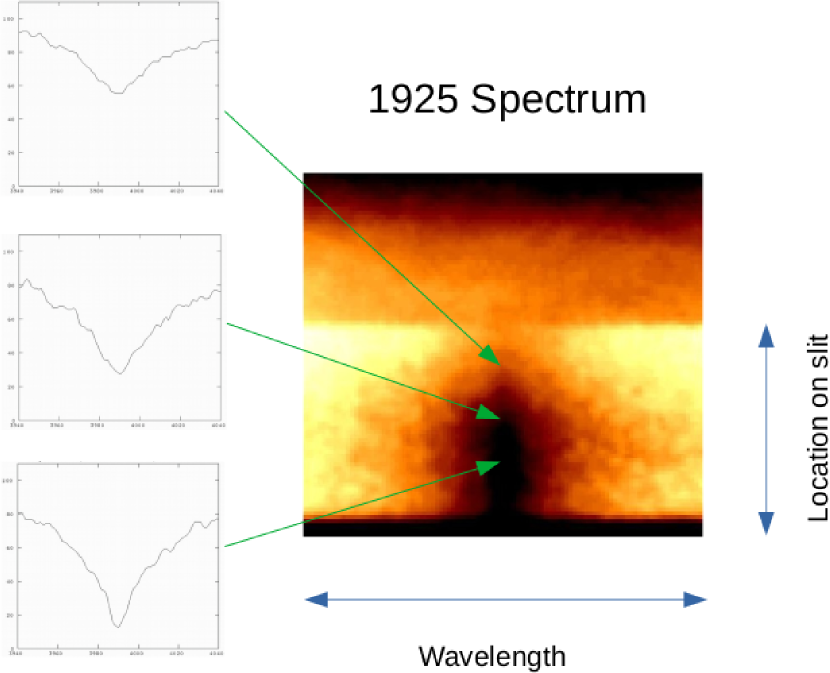
The extraction of a steller spectrum is more complicated than simply co-adding the signal along the slit. This is because the spectral resolution in these spectra varies in a systematic way with location along the slit. We suspect that this is because the star was not trailed along the slit given the short exposure time required for such a bright source. The difference in resolution is substantial, and this is demonstrated in Figure 3, where a section of the 1925 spectrum centered on H is shown. Spectra extracted from three locations along the slit are displayed, and there are obvious differences in the appearance of H. This behaviour is seen in all of the spectra examined here.
There are a number of options for extracting stellar spectra from these data, and the criteria adopted for any given study will depend on requirements placed on wavelength resolution, the wavelength interval to be sampled, S/N ratio, etc as defined by the science goals. The flexibility required when extracting spectra reinforces the need for the slit profile to be scanned in its entirety for archival purposes. For the current study, we have adopted what we consider to be generic extraction criteria. The extraction region was identified as a compromise between S/N, line sharpness, and linearity.
Spectra were extracted such that the continuum and weak lines near the peak in the wavelength response appear to fall along a linear part of the characteristic curve. To do this, spectra at various offsets from the central ridgeline were visually inspected and a spatial interval along the slit was identified where the signal is high and varies in a more-or-less linear manner from column to column along the slit profile to within a few percent near the continuum. This assessment was done at wavelengths bracketing H. Multiple spectra of Vega were recorded on the 1949 and 1963 plates, and individual spectra were extracted from these plates. This allows the comparison of spectra taken from the same plate but with different observing times (e.g. as in the case of the 1949 spectra – Table 1).
4.2 Comparing Partially Processed Spectra
The spectra discussed in this paper were recorded over a four decade time span, and during this time there were changes to the spectrograph, the properties of photographic materials, hypersensitization methods, and observing techniques. The spectra examined here thus are expected to show a diverse range of properties. The extracted spectra are compared in Figure 4, where the signal level is in uncalibrated digital units (hereafter ’DU’). The 1949 and 1963 spectra are the means of all spectra on those plates.
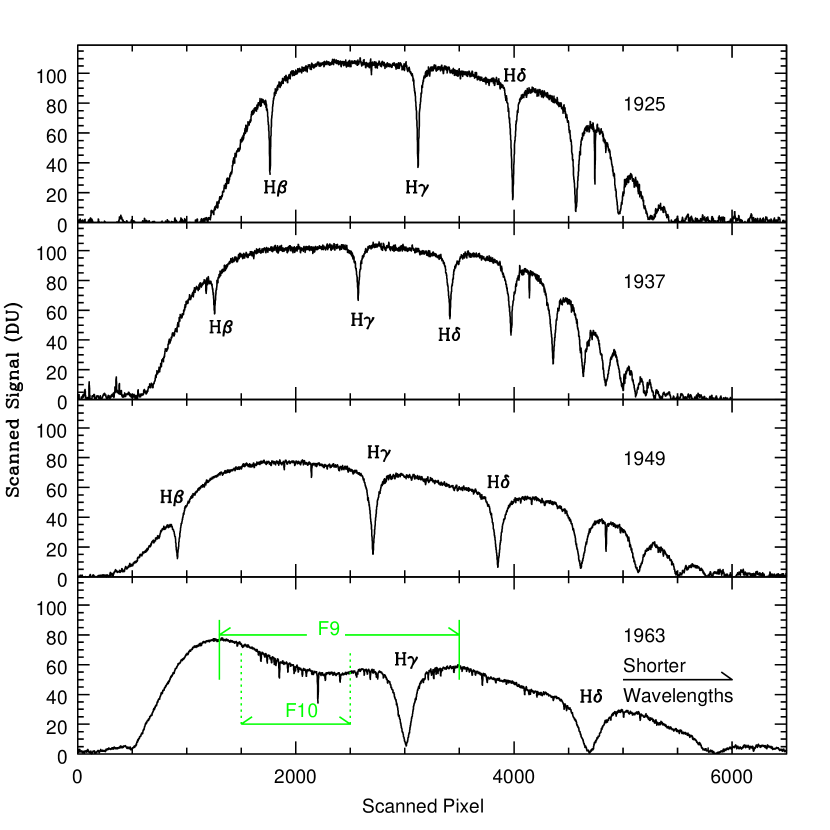
There are obvious differences in overall throughput and spectral resolution among the spectra. H and H tend to be the deepest features. While other Balmer lines are also present, in many cases these are in areas of low throughput. The wavelength coverage of the 1937 spectrum extends to the shortest wavelengths, although the throughput at wavelengths that sample the higher order Balmer lines is low. Another interesting aspect of the 1937 spectrum is that the Balmer lines are much weaker than in the other spectra. The cause of this discrepancy in line strength is a matter of speculation, although the 1937 spectrum was recorded at the end of night during twilight, and scattered light could affect line depths. Despite the discrepant depths of the Balmer lines, we include the 1937 spectrum to demonstrate the range of spectra that are in the DAO collection.
The 1925 and 1937 spectra have roughly the same wavelength dispersion, whereas the 1963 spectrum has the highest spectral resolution and S/N. This is likely why there is a rich population of moderately weak absorption features in the 1963 spectrum that are not clearly seen in the 1925 and 1937 spectra. Such weak lines are of interest as their shallow nature increases the chances that their entire profiles will sample linear portions of the characteristic curve, which may not be the case for deep lines.
4.3 Wavelength Calibration and Normalization
The arcs that bracket each spectrum were aligned based on the centroids of emission lines, and then averaged together to produce a final arc. The shifts applied to the arcs were of a size that did not significantly increase the intrinsic widths of the emission lines in the final arc. Arcs were not recorded for the 1949 spectra, and the wavelength calibration for those spectra is based on the centers of the Balmer lines.
Prominent Fe emission lines were identified in each mean arc spectrum and a polynomial fit was made to relate line location with wavelength. The resulting dispersion solution was then applied to the stellar spectrum. The final processing step was to normalize each spectrum to a pseudo-continuum. This was done by fitting a polynomial to parts of each spectrum that are free of deep absorption features, and then dividing by the result.
5 SCANNING EXPERIMENTS
5.1 Scan Density
The sharpness of lines in a digitized spectrum will progressively improve with increasing scan density until the intrinsic resolution limits imposed by the spectrograph optics and/or the MTF of the scanner are/is reached. While one approach might be to scan at the highest possible sampling density, this may prove to be inefficient as the time to digitize a plate depends on the scanning density; this might be a critical consideration if digitizing a large collection of plates. Moreover, the delivered scan density may be compromised by the MTF of the device – scanning at the highest possible density might produce no gain in quality at the expense of much longer digitization times. Tests were thus conducted to determine a preferred scanning density.
An initial series of tests were performed on the 1925 Vega spectrum with the Epson V800 scanner. Portions of the 1925 spectra centered on H were digitized at densities of 300, 1200, and 2400 dpi, and the results are compared in Figure 5. The spectra in this figure were extracted over the same spatial intervals along the slit. Each spectrum was wavelength calibrated using the arc obtained from the 2400 dpi scan. This required interpolation within the 300 dpi and 1200 dpi spectra to match the sampling of the 2400 dpi spectrum.
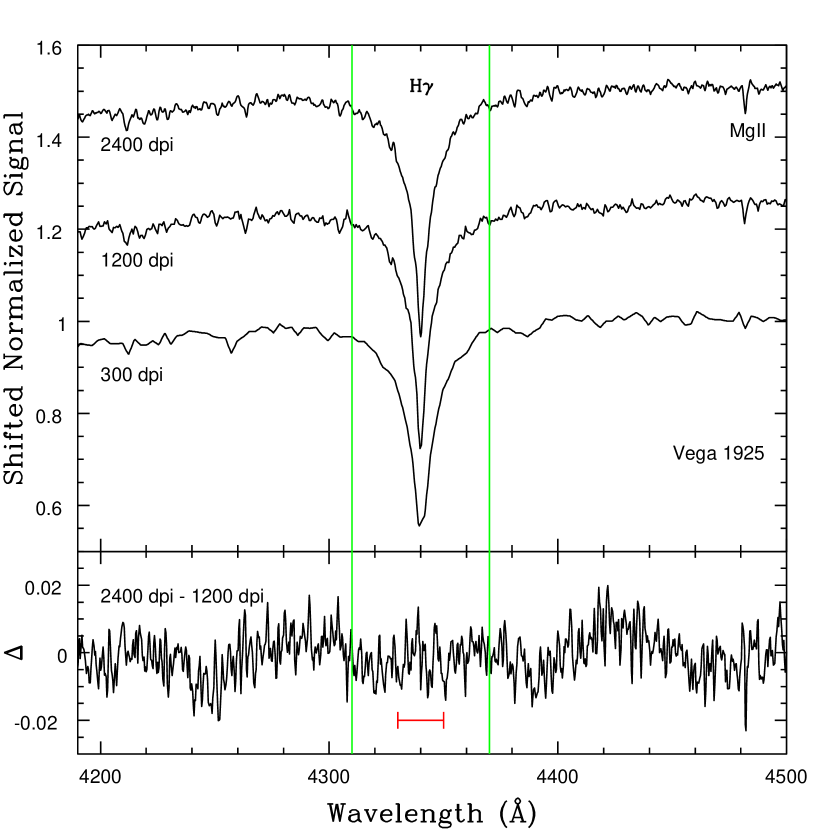
The depth and width of H changes noticeably between scan densities of 300 and 1200 dpi. However, the differences between the 1200 and 2400 dpi spectra are more subtle, and the difference between the 1200 dpi and 2400 dpi spectra is shown in the bottom panel of Figure 5. There are high frequency variations with a dispersion of , and the random nature of this component is suggestive of noise. There is also a low frequency component that has an amplitude of and a peak-to-peak wavelength of . We are uncertain as to the origin of this modulation, but note that it has a periodicity that is the width of H.
There is a poorly defined peak in the lower panel that is centered on H. This feature has an approximate width of and an amplitude of ; the location of this feature is indicated with the red line. This peak is in the sense that the core of H may be slightly sharper, but not deeper, in the 2400 dpi spectrum. The residuals in the lower panel indicate that MgII 4481 is deeper in the spectrum scanned at 2400 dpi.
The comparisons in Figure 5 indicate that while a scan density of 1200 dpi with the V800 appears to detect most features, there is possible improvement when scanning at 2400 dpi. These comparisons thus argue for a scanning density with the V800 scanner of at least 1200 dpi, with a preference for 2400 dpi. We note that sampling at 2400 dpi produces pixels with sizes near the lower end of the 10 – m resolution of photographic emulsions, and that are finer than the m pixels used in many CCDs.
Photographic emulsions evolved over the last century, and the grain sizes in the 1925 and 1937 plates are likely larger than those used in more recent plates. To assess if this affects the choice of scanning density, the 1963 plate was scanned at both 2400 dpi and 3600 dpi with the 12000XL scanner, and the results for one of the spectra on the 1963 plate are shown in Figure 6. As with the comparisons in Figure 5, the spectra in Figure 6 were extracted from the same spatial interval along the slit.

There are clear differences between the spectra in Figure 6. The spectrum scanned at 3600 dpi has noticeably more jitter than the 2400 dpi spectrum. Moreover, the core of H is also flatter at 3600 dpi, although there is a narrow downward-pointing spike at the line center. That the difference between the spectra in the lower panel is tilted at wavelengths near H suggests that the spectra have different profiles, and this is most evident in the line shoulder at shorter wavelengths. In Section 6.4 it is demonstrated that the symmetric line profile of the spectrum scanned at 2400 dpi is consistent with the shape of the line profile in CCD spectra.
We suspect that the ragged appearance of the 3600 dpi spectrum in Figure 6 is a consequence of sampling at too high of a density, such that noise is introduced into the scanned spectrum due to the lower signal per resolution element. The jagged appearance of the central regions of H when scanned at 3600 dpi is an obvious noise signature, and CCD spectra with similar wavelength resolutions show a smoothly varying profile near the line core (Section 6.4). Based on the comparisons in Figures 5 and 6, we adopt a scanning density for the 12000XL of 2400 dpi for the remainder of this study, as this sampling appears to resolve most features without contributing additional noise.
We close the discussion on scan density by noting that the V800 scanner offers a ‘full auto’ scanning mode, for which the scan density and gain are set automatically. The 1925 spectrum was scanned in this mode, and the results were poor: the brightest parts of the spectrum were saturated, while the delivered resolution appears to be dpi, which is much lower than that required to fully resolve information in the spectrum. Thus, we do not recommend this setting to digitize spectra.
5.2 Comparing Scanners
The V800 and 12000XL scanners have different optical components and – possibly – detectors 111We were unable to obtain specific information about the detectors in either device from EPSON support services.. Differences in the optics have the potential to affect the MTFs of the devices, such that one device might deliver better angular resolution than the other at higher scan densities. Differences in the MTF may also introduce subtle effects in light scattered from the illumination source in the scanner.
The spectra recorded in 1925 were digitized with both devices at a density of 2400 dpi, and the results are compared in Figure 7. The result of subtracting the 12000XL spectrum from the V800 spectrum is shown in the bottom panel, and clear differences are seen. When compared with the V800 spectrum, H is narrower and deeper in the spectrum digitized with the 12000XL scanner. Weak features are also sharper and better defined in the 12000XL spectrum. There is a dispersion in the difference on either side of H, and there is an absence of the low frequency trends seen in Figure 5. Both devices thus traced the continuum in a consistent manner to within .

The differences between the spectra in Figure 7 are likely due to the MTFs of the scanners, in the sense that the MTF of the 12000XL is superior to that of the V800 at 2400 dpi scanning densities. If, as suggested in Figure 7, the MTF of the V800 scanner blurs the signal at densities higher than 1200 dpi, then the comparison in Figure 5 is affected, as the modest differences between the 1200 and 2400 dpi spectra are then a consequence of the V800 MTF significantly smearing the signal at resolutions in excess of 1200 dpi. The differences between the 1200 dpi and 2400 dpi spectra would then be much larger if the MTF of the V800 were similar to that of the 12000XL. Given the evidence for a difference in the MTFs then we will focus exclusively on spectra digitized with the 12000XL at densities of 2400 dpi for the remainder of the paper.
6 COMPARING SPECTRA
6.1 Comparing the Processed Spectra
The scanned spectra in Figure 4 show a diverse range of characteristics. To further investigate any differences and similarities we examine processed versions of these spectra. We focus on the wavelength interval near H, as the spectra at all four epochs are more-or-less centered near this feature.
The processed spectra are compared in Figure 8. H in the 1963 spectrum differs from that in the other epochs, in that it is broader and deeper, and so has a larger equivalent width. In contrast, H and the other Balmer lines in the 1937 spectrum are systematically shallower than in the spectra at other epochs. H is the feature in Figure 8 that may be most susceptible to departures from linearity, given that it is deep, and so samples the widest range in signal.

H aside, the characteristics of the spectra from 1925 to 1963 differ in the sense that the absorption features between 4400 and 4600Å that are prominent in the 1963 spectrum are not seen in the 1925 and 1937 spectra. The 1949 spectrum is an intermediate case, in that weak features are apparent in that spectrum, but with a poorer S/N than in the 1963 spectrum. These features are also weaker in the 1949 spectrum than in the 1963 spectrum.
The MgII 4481 line is clearly detected in three of the spectra, and there is a weak feature at this wavelength in the 1937 spectrum. The relative depth of MgII with respect to H varies from spectrum-to-spectrum, and this may be due to differences in the characteristic curves of the plates. Early experiments with hypersensitization at the DAO were not entirely successful (e.g. Plaskett, 1921), leading us to suspect that the 1925 plate was not hypersensitized. There is also no mention of hypersensitization in the log entry for the 1937 plate. However, the 1949 plate (and presumably the 1963 plate) was hypersensitized. We also note that the 1925 and 1937 spectra have a lower dispersion than the 1963 spectrum (e.g. Figure 4), whereas the dispersion of the 1949 spectrum is lower than that of the 1963 spectrum, but higher than that of the 1925 and 1937 spectra. Therefore, the observed range in properties of the features between 4400 and 4600Å is also affected by wavelength resolution.
6.2 Intraplate Comparisons
Differences in spectra that are recorded over long time scales, like those discussed in Section 6.1, are to be expected. However, differences in line profiles can also occur among 1.8 meter slit spectra recorded on the same night. Comparisons of spectra recorded on the same plate are of particular interest as these have the same emulsion batch and spectrograph configuration. To the extent that scanning captures the features in a spectrum then differences between spectra recorded on the same plate might then be attributed to nonlinearity and/or variations in the seeing, both of which can affect the shape of line profiles in slit spectra. Comparisons of such spectra then illustrate the intrinsic level of uncertainty that might be expected in spectra like those recorded in the early days of the 1.8 meter telescope, and provide limits on what might be expected when making comparisons with spectra recorded with more modern techniques, such as via a fiber feed or an image slicer.
Two spectra from the 1949 plate were selected to examine the stability of line characteristics. The 1963 plate also hosts multiple spectra. However, the 1949 plate was selected as arcs were not recorded on that plate. While an obvious problem for wavelength calibration, the absence of arcs removes the potential for scattered light from the arc to skew any comparison – differences between the spectra on the 1949 plate are then likely intrinsic to the observing environment.
The spectra on the 1949 plate have signal levels that differ by roughly a factor of two. A comparison with Figure 4 shows that the three Balmer lines fall in parts of the 1949 spectrum that sample different system throughputs. H might be the most susceptible of these to nonlinearity effects, as it is an intrinsically deep feature that falls where the overall throughput is rapidly declining with wavelength. A 0.3 dex difference in signal level is not that large in the context of the characteristic curve unless it is near the saturation limit (Section 6.3), leading us to suspect that nonlinearity may not play a dominant role in differences in line properties.
Two of the normalized spectra extracted from the 1949 plate are compared in the top panel of Figure 9. The seeing profile of the 1949c spectrum is more compact than that of the 1949b spectrum, and seeing might be expected to influence line properties for a spectrograph with a bare slit entrance aperture. There are differences in the continuum at the level, while the Balmer lines in the 1949b spectrum in the top panel are deeper than those in the 1949c spectrum. The widths of the Balmer lines in the two spectra do not appear to be greatly different. The differences between the spectra are much more subdued than those evident among the spectra in Figure 4.
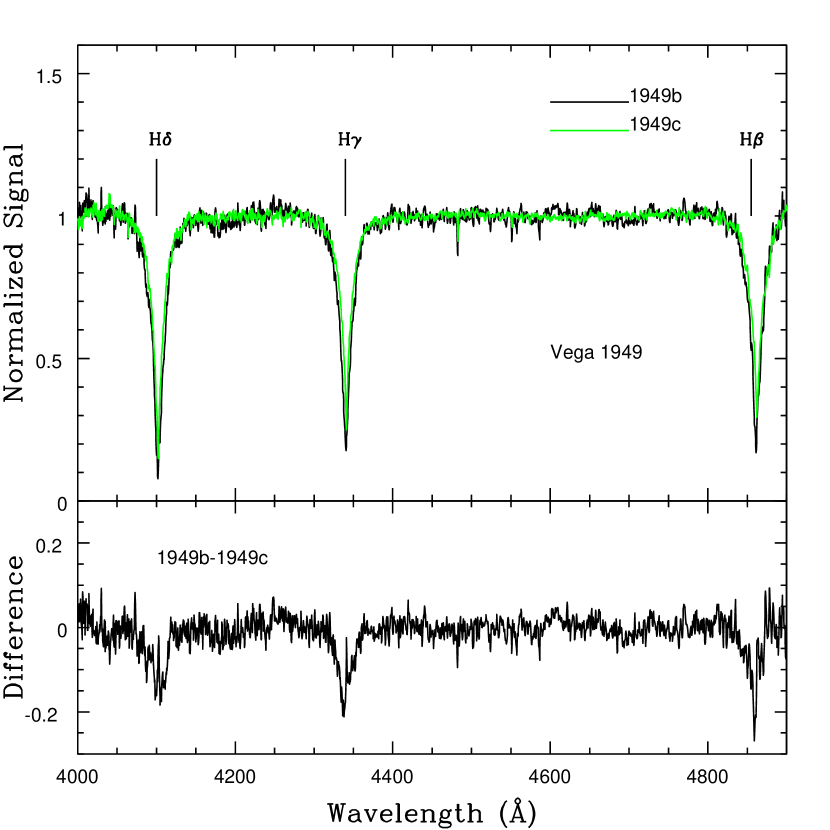
The difference between the normalized spectra is shown in the bottom panel of Figure 9. Differences in line depth between the two spectra are clearly evident, with the depths of the Balmer lines in the two spectra differing at the level. The residuals for H and H are comparable, and larger than the residuals near H.
We suspect that there is likely no single explanation for the differences seen in Figure 9. That the Balmer lines in the 1949b spectrum are consistently deeper than those in the 1949c spectrum is perhaps unexpected if nonlinearity is the source of any differences. Subtle changes in seeing might play a role, although the similarity in line shape that is evident in the upper panel of Figure 9 argues that seeing may not be the dominant factor. The range over which spectra are extracted along the slit may also introduce differences, given the manner with which the line profile can vary along the slit (e.g. Figure 3). That there are inherent limitations to the use of bare slit spectra in the study of line profiles is hardly a novel finding. Still, the differences in line depth in Figure 9 indicate that significant uncertainties remain among spectra extracted from plates in the DAO 1.8 meter collection even if they were recorded with similar instrumentation and during the same observing period.
6.3 Assessing Linearity using On-plate Information
A characteristic curve can be divided into three broad components: a shallow relation at low signals, a steeper linear relation at intermediate signal levels, and another shallow relation near saturation. Applying a comprehensive and robust correction for nonlinearity is beyond the scope of this study. In this section we set a more modest goal of identifying the range in signal in which the response appears to be linear. This opens the possibility of identifying parts of a spectrum in which line characteristics can be extracted after applying the basic processing steps described in Section 4.
While nonlinearity may not be a problem for measuring line positions, it affects efforts to assess line shapes and measure equivalent widths, especially in deep lines where the signal may span different parts of the characteristic curve. On the other hand, if there is a linear response over parts of the recorded signal at or near the level of the continuum, then shallow (weak) lines will be less susceptible to departures from linearity, as the difference in the light levels between the continuum and the line cores may be modest. If this is the case then shallow lines might be features that can be studied most robustly in photographic spectra.
Deviations from linearity can be assessed using calibration information that is recorded on most of the DAO plates. The mechanics of how the linearity calibration signal was originally fed to the slit environment on the 1.8 meter telescope was discussed by Plaskett (1923). As this calibration information is a key part of the scientific content on the plates, we examine here if the information in the calibration region can be recovered in a useable form from plates digitized with the 12000XL scanner. The 1963 plate was selected for this assessment as the extracted spectrum has the highest S/N and finest wavelength resolution of the datasets examined here. The 1963 spectrum is compared with a CCD spectrum in Section 6.4.
Information extracted from the characteristic curve calibration area on the 1963 spectra is shown in the top panel of Figure 10, where the mean signal in four different columns that run perpendicular to the dispersion axis is shown. Each of these columns has a width of 10.5 mm on the plate, and light levels in five steps are sampled. The curves in the figure are labeled C1 – C4. The signal in a large part of the calibration region is saturated, and the measurements in Figure 10 were extracted from parts of the calibration region where the signal is not saturated over the full range of five steps in each column, although the signal in Step 5 of C1 is close to saturation. The stepped nature of the calibration curves is blurred by scattered light and the Eberhard effect, in which edges between high contrast areas on the plate are accentuated if the developing solution is not smoothly mixed across the plate (Eberhard, 1926). This blurring, combined with scattered light, is a source of uncertainty when assessing linearity.
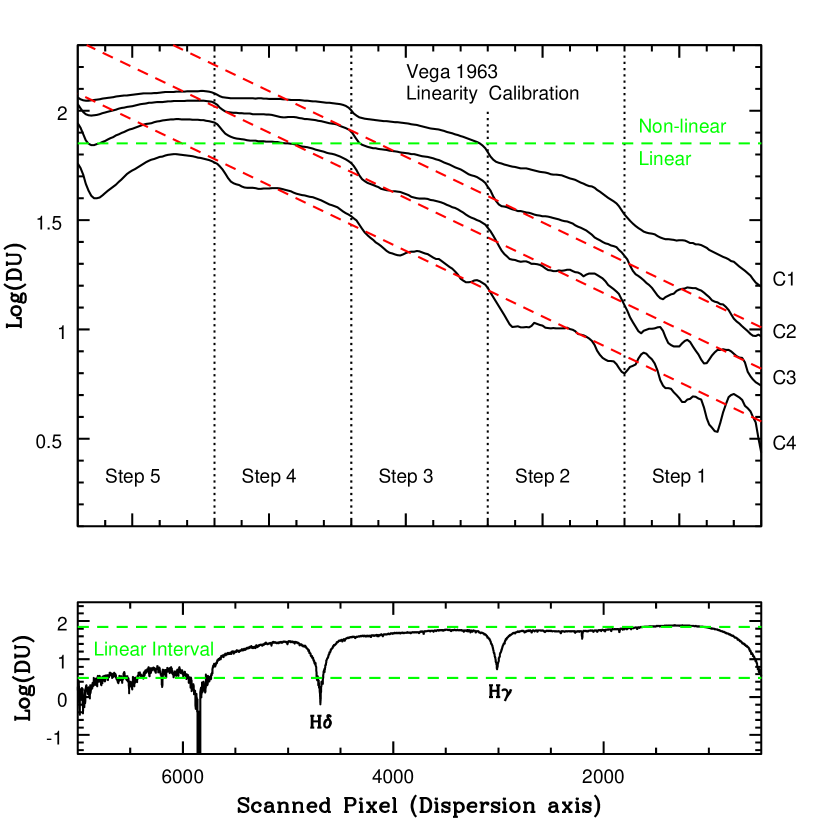
There is a factor of 2 (i.e. 0.3 dex) difference in signal between successive steps in the calibration region. Non-linearity is then evident if the difference in signal between successive steps departs from 0.3 dex. Evidence for nonlinearity at the bright end is clearly seen in Figure 10 as the signals in Steps 4 and 5 in C1 and C2 are similar. However, at lower signal levels C1 and C2 follow a relation that is closer to that expected for a linear response.
The red dashed lines in Figure 10 are linear fits to the signal measured in Steps 1 – 4 with the slope fixed at 0.3 dex/step; this relation was not fit to C1 as nonlinearity is clearly an issue near the highest signal levels in that curve. C3 and C4 follow the 0.3 dex/step relation between steps 1 and 4. The match with C2 is poorer, as the signal in step 4 departs markedly from the trend defined by steps 1 – 3. These comparisons suggest that the upper limit for linearity on this plate occurs near log(DU) , and this threshold is indicated by the green dashed line. As for the lower limit to the linearity interval, the linearity curves can not be traced reliably to light levels log(DU) . Hence, we identify log(DU) = 0.5 as a preliminary lower boundary for linearity.
The portions of the 1963 spectrum that fall within the estimated boundaries for a linear response are indicated in the bottom panel of Figure 10, where the mean 1963 spectrum from Figure 4 is shown with a logarithmic intensity scale. The four spectra on the 1963 plate have more-or-less similar signal levels, and so should have similar linearity boundaries. Much of the 1963 spectrum falls within the linear interval identified from the calibration information, with the upper limit for linearity falling close to the continuum redward of H. H falls entirely within the expected linearity interval.
The 1937 spectrum lacks calibration information for the characteristic curve, and this omission illustrates the incomplete nature of calibration information in the DAO collection. The absence of this calibration information is frustrating given that the Balmer lines in the 1937 spectrum have markedly different depths than those in the other spectra. Ohman (1940) and Furenlid (1973) describe a procedure to track response using information obtained directly from spectra. However, this procedure requires that the spectra have a constant dispersion along the slit, and this is not the case with the 1.8 meter spectra of Vega (Figure 3). An alternate means of correcting for nonlinearity might be to compare the photographic spectrum of a bright star that has a stable spectral energy distribution (like Vega) that was recorded on the same night as the science target with a CCD spectrum of that same star, processed to have the same wavelength resolution as the photographic spectrum. Such a comparison will yield a generic characteristic curve for the plates used on that night.
6.4 Comparisons with a CCD Spectrum
Comparisons with spectra of Vega that were recorded with CCDs are an important means of assessing the scanned spectra. A spectrum of Vega that was observed with the McKellar spectrograph on the DAO 1.2 metre telescope was selected as a reference for such a comparison. The spectrum and associated calibration data were recorded on the night of September 6, 2013 as part of program 2013C10 (PI: Soydugan). This particular observation was selected because (1) the wavelength coverage is centered near H, and (2) the spectral resolution () is comparable to that of the 1963 Vega spectrum.
The CCD spectrum was processed by following a standard sequence of steps that included bias subtraction, the suppression of cosmic rays, flat-fielding, the combination of signal in the image slicer elements, wavelength calibration, and normalization to a pseudo-continuum. The final processed CCD spectrum at wavelengths near H is shown in Figure 11, where it is compared with a spectrum that is the average of the four spectra extracted from the 1963 plate. The wavelength resolutions of the CCD and photographic spectra are similar, but not identical.

The H line profiles in the 1963 and CCD spectra are markedly different, and we suspect that this is due in part to the variation in spectral resolution with location along the slit in the photographic spectrum, as shown in Figure 3. Combining spectra with different wavelength resolutions will produce an effective illumination profile for the photographic spectrum that differs systematically from that generated by an imager slicer-fed slit, which was used for the CCD observations. This will affect all lines in the photographic spectrum, and it is shown below that the lines in the photographic spectrum are systematically deeper than those in the CCD spectrum. While a more conventional line profile could be obtained for the 1963 spectrum by sampling only one location along the slit, the S/N is then greatly reduced. Another approach might be to broaden the spectra extracted from different slit locations to a common resolution. In any event, the difference in H line profiles in Figure 11 is likely not due to the scanning process, but to properties that are intrinsic to the observations.
There are numerous features in the CCD and photographic spectra that have small or modest depths, and these are featured in Figure 12, where spectra between 4450 and 4600Å are shown. There is an excellent one-to-one correspondence between weak features in the two spectra, many of which have depths that depart from the continuum by only a few percent. The depths of the weakest features in the photographic spectrum appear to match those in the CCD spectrum, although we caution that differences between the depths of lines in the two spectra become progressively harder to detect by eye as line strength diminishes.
The discussion of on-plate calibration information in Section 6.3 suggests that the features in Figures 11 and 12 fall in the range of intensities where a linear response is expected. In the absence of blending, the relative strengths of atomic lines is one means of comparing the science content of spectra that is less sensitive to differences in slit illumination. A visual inspection of Figure 12 reveals that the ranked strengths of various lines in the 1963 and CCD spectra are similar. That is, the strongest lines in the 1963 spectrum are also the strongest lines in the CCD spectrum, and a similar situation holds for the weakest lines.

If the response of the photographic spectrum is linear at the wavelengths shown in Figures 11 and 12 then the relative depths of lines should be the same in the two spectra. The equivalent widths of H, MgII 4481, and FeII 4542 in both spectra are listed in Table 2. These equivalent widths were measured with the SPLOT task in IRAF using the ’e’ option, which computes equivalent widths by integrating the absorbed light between user defined continuum points without assuming a line shape. This approach was adopted as efforts to fit lines in both spectra with Gaussian, Vogt, and Lorentzian line profiles were not satisfactory.
| Spectrum | EWHγ aaEstimated Uncertainty . | EWMgII bbEstimated Uncertainty . | EWFeII bbEstimated Uncertainty . |
|---|---|---|---|
| (Å) | (Å) | (Å) | |
| Vega PG | 24.17 | 0.44 | 0.22 |
| Vega CCD | 16.61 | 0.30 | 0.17 |
| Ratio | 1.46 | 1.47 | 1.29 |
Uncertainties in the equivalent widths were estimated by varying the continuum points within a reasonable range based on the visual inspection of the spectra and then assessing the dispersion in the resulting equivalent widths. The similarity of the CCD and photographic spectra made it possible to place continuum points at similar locations in each spectrum, thereby reducing systematic errors that might arise if weak absorption features affect continuum placement in one spectrum but not the other. These experiments suggest an uncertainty in both spectra of for the H measurements, and for the MgII and FeII measurements.
The ratios of the two sets of equivalent widths are shown in the bottom row of Table 2. The ratios of all three lines agree to within their uncertainties, independent of line strength. This is consistent with the photographic spectrum at these wavelengths falling on the linear part of the characteristic curve, as predicted in Figure 10. The absolute difference between the strengths of individual features is reminiscent of what was seen in Section 6.2, where spectra extracted from the same plate were compared. These differences aside, the relative consistency between the strengths of features in the photographic and CCD spectra in Figures 11 and 12 is noteworthy given the differences in the manner with which the spectra were recorded and processed.
7 DISCUSSION & SUMMARY
The digitization of photographic spectra of Vega recorded with the 1.8 meter telescope in the DAO plate collection has been discussed, with the purpose of determining if commercial scanners can capture the scientific content of these spectra. The use of scanners to digitize photographic spectra opens the prospect of scanning historically important photographic material for scientific use in a straightforward, quick, and efficient manner. Investments in time, money, and space are modest with these devices. An additional benefit is ease of use once procedures and parameters such as scanning density have been established. Spectra were digitized with an Epson V800 device, which is a compact desktop scanner, and an Epson 12000XL, which is a physically larger top-of-the line scanner intended for artistic and commercial applications.
Spectra of Vega were selected for this study given (1) the relative stability of its spectral-energy distribution with time, which makes direct comparisons with CCD spectra possible, (2) the presence of absorption lines that span a range of intensities, and (3) the large number of high-quality spectra of this star in the plate collection. The plates digitized in the current study were recorded during the first four decades of the operation of the 1.8 meter telescope. During this time there were changes in photographic emulsions, hypersensitization techniques, and instrument optics. The spectra considered here thus have diverse properties, but are more-or-less representative of spectra that were recorded during the first half century of the operation of the facility.
Scattered light from the illuminating source in the scanner is a potential concern in the scanning process, as the grains in a photographic emulsion may scatter light. The possible impact of such scattering has been mitigated in this study through the subtraction of background light measured across the plate. Scattered light was removed in the processing. Another mitigation strategy is to extract spectra where the stellar signal is highest, although residual scattered light could still affect the cores of deep lines.
A complicating factor for assessing the scientific utility of the spectra is that many plates in the DAO collection were recorded with the sole purpose of measuring radial velocities, with an emphasis on the measurement of line locations, rather than line shape. The need to measure radial velocities drove many of the design decisions for the 1.8 meter telescope and the initial spectrograph configuration (Plaskett, 1918, e.g.), and these decisions have implications for extracting spectra for other purposes. For example, the emission line arcs are positioned close to the stellar spectra, presumably to facilitate reliable wavelength measurements with the technology available one hundred years ago. Scattered light from the arc overlaps the stellar spectra, and so will affect line depth measurements. Such contamination can be reduced (but not eliminated) by extracting spectra where the signal is highest. Complications such as this make it essential that 1.8 meter spectra that are scanned for archival purposes cover two dimensions.
There are numerous other complications when extracting scientific information from photographic spectra. Arguably the greatest of these is the non-linear response characteristics of photographic emulsions. The majority of the plates in the DAO collection contain at least some calibration information that allows a characteristic curve to be constructed, although the sampling may be coarse, such as in the 1925 spectrum (e.g. Figure 1). While no attempt is made to apply a correction for nonlinearity in this study, the on-plate calibration information has been used to identify the range of linear signal levels, with the 1963 spectrum serving as an example.
An important test of any digitization effort is consistency with CCD spectra, and the agreement between the 1963 spectrum digitized at 2400 dpi with the 12000XL scanner and that recorded with a CCD is noteworthy. The scanned 1963 spectrum contains information not only about the deepest and widest features, which are the Balmer lines, but also of much weaker lines, such as those of MgII 4481 and FeII 4542. That the digitized 1963 spectrum contains information on the same spatial scale as the pixels in the CCD spectrum indicates that the information content on that DAO 1.8 meter plate has been recovered. It is encouraging that the ranked depths of weak lines in the CCD and photographic spectra match, although the equivalent widths differ. Still, the ratio of the equivalent widths of the FeII, MgII, and H in the two spectra are similar, as expected if the response is linear in this part of the 1963 spectrum. This is consistent with measurements made from the linearity calibration region.
7.1 Lessons Learned and Future Work
In closing, this paper has explored the use of commercial flatbed scanners to digitize photographic spectra in the DAO collection. These scanners offer a potential alternative to devices that have traditionally been used to digitize spectra, such as PDS machines. Here, we summarize some of the lessons that have been learned.
-
1.
There are commercially available flatbed scanners that can recover the scientific information contained in a stellar spectrum on a photographic plate.
-
2.
A number of commercial flatbed scanners are available. A key characteristic when selecting a scanner to digitize plates is the MTF. We find that the MTF of the Epson 12000XL is superior to that of the Epson V800 at the scanning densities that are required to fully capture the scientific content on a 1.8 meter spectroscopic plate.
-
3.
A scanning density of 2400 dpi recovers the information on plates recorded with the Cassegrain spectrograph on the DAO 1.8 meter telescope. This corresponds to a spatial resolution of m, which is similar to the grain size of most photographic emulsions that were in use throughout the first years that the telescope was in use. A higher scanning density might be appropriate for photographic plates with finer emulsions. However, we caution that scanning at too high a density might introduce digitization noise.
-
4.
While not recommended for detailed scientific analysis, spectra scanned at lower spatial densities and with 8 bit sampling provide information that can be used to assess the scientific potential of a plate prior to more detailed analysis. This might prove useful for an initial assessment of information in large spectroscopic plate collections that have not yet been digitized.
-
5.
Plates should be scanned in their entirety to recover the light profile of the target source as well as calibration information. The seemingly blank regions on a plate also provide information needed to understand background uniformity.
-
6.
The linear part of the characteristic curve can be extracted from calibration information on the plate, although scattered light may blur the gradations. Large parts of this calibration region may also be saturated, so there is a need to be selective to determine where linearity information is to be extracted. The use of such on-plate information is an important check of possible plate-to-plate differences in the characteristic curve.
-
7.
Although recorded with the same instrumental configuration and photographic emulsion, the depth of H in the 1925 and 1937 spectra are very different. More subtle, but still significant, differences are also seen when comparing spectra that were recorded on the same plate. This demonstrates that spectra of the same source in the DAO collection may differ for reasons that are not intrinsic to the source.
-
8.
While promising, the comparisons in Figures 11 and 12 indicate that additional processing is required to match line strengths with those in CCD spectra. This highlights that there are other issues that must be addressed once plates are digitized. In addition to dealing with the inherent problems associated with the use of photographic materials, there is also the need to capture meta data and develop tools to facilitate the scientific analysis of photographic spectra.
There is much room for future work. The large content of the DAO plate library, of which spectra obtained with the 1.8 meter telescope is but one part, presents a formidable logistical challenge for digitization efforts, and strategies for digitizing the collection in an effective manner must be explored. In addition to spectra, there is also a collection of photographic images in the DAO collection that were recorded at the Newtonian focus of the 1.8 metre telescope over a number of decades, and these also contain a wealth of information. As demonstrated by Glusman et al. (2022) and Cerny et al. (2021), the digitization techniques discussed here could be applied with advantage to those images.
References
- Beales et al. (1946) Beales, C. S., Petrie, R. M., & McKellar, A. 1946, JRASC, 40, 349
- Bohm et al. (2012) Bohm, T., Lignieres, F., Wade, G. et al. 2012, A&A, 537, A90
- Cerny et al. (2021) Cerny, W., Chapman, A., Glusman, R. et al. 2021, PASP, 133, 044501
- Charlton et al. (1985) Charlton, J. C., & Meyer, B. S. 1985, PASP, 97, 60
- Eberhard (1926) Eberhard, G. 1926, POPot, No. 84, 26, 1
- Furenlid (1973) Furenlid, I. 1973, AASPB, 7, 15
- Glusman et al. (2022) Glusman, R., Boegen, L., Cerny, W. et al. 2022, PASP, 134, 094503
- Gray (2007) Gray, R. O. 2007, in ’The Future of Photometric, Spectrophotometric and Polarimetric Standardization’ ASP Conf. 364, C Streken ed., pp. 305
- Hill et al. (2010) Hill, G., Gulliver, A. F., & Adelman, S. J. 2010, ApJ, 712, 250
- Lasker et al. (1990) Lasker, B. M., Sturch, C. R., McLean, B. J., Russell, J. L., Jenkner, H., & Shara, M. M. 1990, AJ, 99, 2019
- Ohman (1940) Ohman, Y. 1940, StoAn, 13, 6
- Plaskett (1918) Plaskett, J. S. 1918, PDAO, 1, 1
- Plaskett (1921) Plaskett, J. S. 1921, PDAO, 1, 325
- Plaskett (1923) Plaskett, H. H. 1923, PDAO, 2, 213
- Plaskett (1924) Plaskett, J. S. 1924, ApJ, 59, 65
- Richardson & McKellar (1956) Richardson, E. H., & McKellar, A. 1956, PDAO, 10, 253
- Simcoe (2009) Simcoe, R. J. 2009, in ’Preserving Astronomy’s Photographic Legacy’, ASP Conf. 410, W. Osborn & L. Robbins eds, pp. 111
- Stobie (1984) Stobie, R. S. 1984, NASA Conf. Publ., NASA CP-2317, 209
- Teuber (1984) Teuber, D. 1984, NASA Conf. Publ., NASA CP-2317, 97
- Tody (1986) Tody, D. 1986, SPIEE, 627, 733
- Tody (1993) Tody, D. 1993, ASPC, 52, 173
- Yuldoshev et al. (2019) Yuldoshev, Q., Andruk, V., & Muminov, M. 2019, OAP, 32, 208