RADAR: Robust Two-stage Modality-incomplete Industrial Anomaly Detection
Abstract
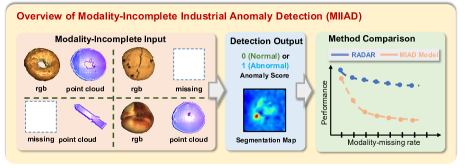
Multimodal Industrial Anomaly Detection (MIAD), utilizing 3D point clouds and 2D RGB images to identify the abnormal region of products, plays a crucial role in industrial quality inspection. However, the conventional MIAD setting presupposes that all 2D and 3D modalities are paired, overlooking the fact that multimodal data collected from the real world is often imperfect due to modality-missing. Consequently, MIAD models that demonstrate robustness against modality-incomplete data are highly desirable in practice. To address this challenge, we introduce a first-of-its-kind study that comprehensively investigates Modality-Incomplete Industrial Anomaly Detection (MIIAD), to consider the imperfect learning environment in which the multimodal information is incomplete. Not surprisingly, we discovered that most existing MIAD approaches are inadequate, leading to significant performance degradation on the MIIAD benchmark we developed. In this paper, we propose a novel two-stage Robust modAlity-aware fusing and Detecting frAmewoRk, abbreviated as RADAR. Our bootstrapping philosophy is to enhance two stages in MIIAD, improving the robustness of the Multimodal Transformer: i) In feature fusion, we first explore learning modality-incomplete instruction, guiding the pre-trained Multimodal Transformer to robustly adapt to various modality-incomplete scenarios, and implement adaptive parameter learning based on a HyperNetwork; ii) In anomaly detection, we construct a real-pseudo hybrid module to highlight the distinctiveness of modality combinations, further enhancing the robustness of the MIIAD model. Our experimental results demonstrate that the proposed RADAR significantly surpasses conventional MIAD methods in terms of effectiveness and robustness on our newly created MIIAD dataset, underscoring its practical application value.111Our project is available at https://anonymous.4open.science/r/RADAR-54F2.
Introduction
Industrial Anomaly Detection (IAD) is pivotal in industrial quality inspection, primarily focusing on identifying product defects. A significant challenge in this domain is the intrinsic population bias222In industrial settings, normal products vastly outnumber defective ones, making anomalies relatively rare. between normal and abnormal examples. Consequently, most current IAD approaches adopt an unsupervised learning framework, i.e., training models solely on anomaly-free examples and testing them on both normal and defective examples during inference. Moreover, most previous IAD methods relied heavily on 2D imagery (Gudovskiy, Ishizaka, and Kozuka 2022; Roth et al. 2022b; Defard et al. 2021a). However, recent studies (Wang et al. 2023b) highlight the importance of both 3D geometries and the color characteristics from 2D images in identifying defects, suggesting that developing systems that integrate 3D point clouds with 2D images represent a promising pathway toward achieving high-performance in IAD.
The advent of multimodal transformers has revolutionized multimodal learning across various fields, offering promising solutions for multimodal industrial anomaly detection. Nonetheless, these approaches often presume complete data availability (Ma et al. 2022a), an assumption rarely feasible in industrial contexts due to equipment limitations and privacy concerns, particularly with 3D data acquisition. The lack of data modalities, whether during training or testing, can detrimentally affect system performance. These observations underscore the urgent need for robust detection methods that effectively handle multimodal data and adapt to various conditions of modality incompleteness. Currently, there is a notable gap in advancing methods that can robustly operate under such modality-incomplete settings.
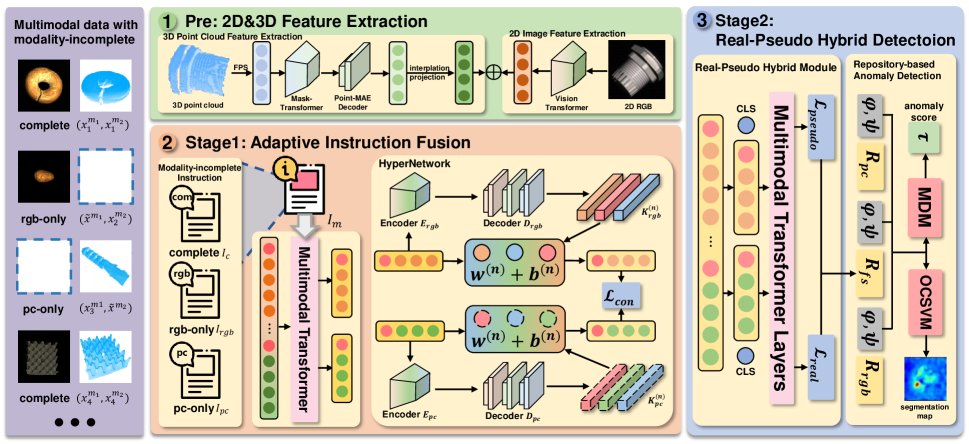
To bridge the gap, we introduce a novel and demanding task: Modality-Incomplete Industrial Anomaly Detection (MIIAD). Alongside this, we propose a comprehensive benchmark designed to simulate scenarios in which various missing-modality cases may occur in any data samples, such as accessing only 2D RGB images or 3D point clouds, during either the training or testing phases. To facilitate robust detection in such an imperfect environment, we propose a novel Robust modAlity-missing fusing and Detecting frAmewoRk, dubbed RADAR. RADAR enhances the model’s ability to handle incomplete modalities at the feature fusion stage, incorporating three main components: Pre: 2D&3D Feature Extraction: We utilize the MaskTransformer for extracting 3D point cloud features, and the Vision Transformer (ViT) for 2D RGB image features. Stage1: Adaptive Instruction Fusion: We construct mofdality-incomplete instruction to highlight multimodal transformers with missing modalities, allowing them to adapt robustly to various scenarios of modality-incomplete. We also employ HyperNetwork to derive an adaptive modality-aware fusion mechanism, whose parameters are dynamically generated depending on the 2D and 3D modality representation. Stage2: Real-Pseudo Hybrid Detection: We design a Real-Pseudo Hybrid Module to highlight the distinctiveness of modality combinations, further enhancing the robustness of the framework. Finally, we integrate the features stored in the three repositories and make decisions based on the Mahalanobis distance matrix (MDM) and One-Class Support Vector Machine (OCSVM).
Our contributions are three-fold:
-
•
We present a new challenging and practical task: Modality-incomplete Industrial Anomaly Detection (MIIAD), together with one newly designed benchmark.
-
•
We propose an end-to-end MIIAD learning framework, called RADAR, enhancing the robustness of the multimodal transformer in the absence of modalities.
-
•
Through extensive experiments, we show that our method improves all the prevalent multimodal industrial anomaly detection line-ups on MIIAD benchmarks.
Related Work
Industrial Anomaly Detection
2D Industrial Anomaly Detection can be categorized as follows. i) Feature Extraction Method: It’s typical approaches including the utilization of teacher-student architecture and one-class classification methods. The teacher-student architecture (Bergmann et al. 2020; Salehi et al. 2021; Wang et al. 2021a) leverages pre-trained models to impart knowledge from a teacher network to a student network, comparing their outputs during the inference stage to determine the anomalous data. One-class classification (OCC) (Zhang and Deng 2021; Hu, Chen, and Shao 2021) determines abnormality based on relative feature positions of the test sample’s features and the hypersphere, sometimes augmented by artificially created abnormal samples. ii) Reconstruction-based Method: It utilizes self-trained encoders and decoders to reconstruct images for anomaly detection, demonstrating strong performance in pixel-level anomaly identification. Existing reconstruction models include autoencoders (Bergmann et al. 2018; Dehaene and Eline 2020; Wang et al. 2020) , GANs (Song et al. 2021; Liang et al. 2023), transformer (Mishra et al. 2021; Jiang et al. 2022) and diffusion models (Wyatt et al. 2022).
3D Industrial Anomaly Detection offers advantages in capturing spatial information beyond what is available in RGB images. The release of the MVTec 3D-AD dataset (Bergmann et al. 2022a) has spurred several papers focusing on anomaly detection in 3D industrial images. Bergmann and Sattlegger (Bergmann and Sattlegger 2023a) introduced a teacher-student model for 3D anomaly detection, while Horwitz and Hoshen (Horwitz and Hoshen 2023)proposed a method that combines hand-crafted 3D representations with 2D features.
Modality-incomplete Learning
Traditional models often struggle when input data lacks one or more modalities, which is common in real-world scenarios due to constraints in data collection, privacy concerns, or technical limitations. Techniques such as variational auto-encoders (Chartsias et al. 2017; van Tulder and de Bruijne 2018) have been particularly popular for their ability to generate missing modalities in an unsupervised manner.
However, these approaches often neglect the nuanced distinctions between shared features and modality-specific features, which are crucial for optimizing model performance in multi-modal settings (Wang et al. 2023a). Robust-Mseg (Chen et al. 2019) addresses missing modalities by disentangling features into modality-specific appearance codes and modality-invariant content codes. SMIL (Ma et al. 2021a) leverages Bayesian meta-learning to achieve flexibility and efficiency in handling incomplete training and testing data. ShaSpec (Wang et al. 2023a) introduces a simpler yet potent architecture, focusing on the classification, segmentation, distribution alignment, and domain classification tasks. We followed the settings for modality-missing in these recognized works to ensure the generality of our method.
In contrast, these methods typically utilize a single feature fusion stage, whereas our approach incorporates two stages to enhance the framework’s robustness.
Methodology
This section introduces the Robust modAlity-imcomplete fusing and Detecting frAmewoRk (RADAR) for MIIAD. We will begin by outlining the task and the RADAR model. Following that, we will provide a detailed explanation of each module within the framework.
Overview
Task Formulation. We consider MIIAD which involves two modalities: 2D RGB image and 3D point cloud. Specifically, a MIIAD dataset, denoted as , can be divided into three subsets based on the modality missing situations: . Here, represents the modality-complete subset, comprises samples missing 3D point clouds, and includes samples lacking 2D RGB images. The task objective is to effectively perform IAD in various modality-incomplete settings.
Framework Overview. As illustrated in Fig. 2, the RADAR framework addresses the practical MIIAD challenge through three main components: Pre: 2D&3D Feature Extraction. We extract features from 2D RGB images and 3D point clouds utilizing the ViT and the MaskTransformer. Stage1: Adaptive Instruction Fusion. We employ the modality-incomplete instruction and HyperNetwork to facilitate adaptive learning of robust feature fusion. Stage2: Real-Pseudo Hybrid Detection. We design a Real-Pseudo Hybrid Module to highlight the distinctiveness of modality combinations for further robust fusion and connect features from three repositories to make decisions based on MDM and OCSVM.
Pre: 2D&3D Feature Extraction
2D Image Feature Extraction. We employ pretrained ViT (Dosovitskiy et al. 2021) from HuggingFace (Wolf et al. 2020) to extract 2D image features , consistent with previous research. Due to space constraints, further details will not be provided.
3D Point Cloud Feature Extraction. The input point cloud is an unordered sequence of point positions in three-dimensional space, containing points, which makes it challenging to extract meaningful features directly by feeding them into standard Transformer modules. We first divid the point cloud into groups using Farthest Point Sampling (FPS) (Qi et al. 2017). For each group , we further extract feature vector utilizing a pretrained MaskTransformer (Yu et al. 2022) and Point-MAE (Pang et al. 2022), i.e., each group has a single point feature . We take the output of the MaskTransformer as the initial point features . will be fed to Point-MAE to further improve the 3D point feature and take the decoder’s output as the extracted 3D point features , which can be denoted as .
Point Interpolation and Projection. To prevent the imbalanced feature density issue caused by FPS, we interpolate the features back into the original point cloud, which can be denoted as
| (1) |
where represents a point in the original point cloud data, denotes the point after interpolation, is the center point associated with the corresponding group , and is a fairly small constant. Subsequently, we apply average pooling and additional operations to derive 3D point cloud features .
Stage1: Adaptive Instruction Fusion
Modality-incomplete can result in a performance decrease in Multimodal Transformers or feature extraction models (Lee et al. 2023). In the first stage, inspired by prompt learning, we propose introducing modality-incomplete instruction into the Multimodal Transformer for feature fusion to preliminarily enhance robustness in MIIAD.
Modality-incomplete Instruction. We initially create specific modality-incomplete instructions for each modality-incomplete scenario. For IAD tasks involving two modalities, we configure instructions and prepend them into the input tokens based on the modality-incomplete condition. The input embedding feature of the -th MSA layer is denoted as with an input length and dimension of . Importantly, the insertion of instructions can also be extended in multiple layers, denoted as , where represents the input sequence linked to the -th layer in the Transformer. Function describing the process of adding these instructions can be denoted as
| (2) |
It enables the current layer to connect with that of the previous layer. Such interaction can effectively enhance the model’s robustness in addressing modality-incomplete.
Instruction Feature Fusion. Modality feature fusion is pivotal in multimodal tasks, and a model’s performance in such tasks heavily relies on the fusion degree of modality features (Zhao et al. 2023; Gong et al. 2023; Lee et al. 2023). We devised a concise Multimodal Transformer incorporating modality-incomplete instruction to adeptly guide the model in addressing IAD robustly.
Our Multimodal Transformer straightforwardly combines the concatenation results of and as input. Subsequently, it appends the modality-incomplete instruction to the -th layer. These instructions are then prepended to the feature embedding to produce the modified feature , which can be represented as
| (3) |
The feature has robustness against incomplete modalities, indicating the completion of preliminary feature fusion. Afterwards, this feature will divide into two new modality features based on the instruction length.
The features of the two modalities are mapped to feature , via Multi-Layer Perceptrons (MLP) and , along with fully connected layers. The ultimate feature fusion learning is conducted using patch-wise contrastive loss, specifically the InfoNCE Loss (van den Oord, Li, and Vinyals 2018), serving as the objective function, which can be formulated as
| (4) |
where is the batch size, and is the patch number.
HyperNetwork-based Adaptive Learning. We suggest utilizing the HyperNetwork (Ha, Dai, and Le 2017) to enable adaptive parameter learning for and . More precisely, the HyperNetwork treats the MLP parameters as a matrix , where and denote the number of input and output neurons in the -th layer of the MLP, respectively. The creation process of can be viewed as matrix factorization, illustrated as
| (5) |
where and are randomly initialized with parameter during the training process. The backpropagation of gradients is used to update and . Subsequently, a layer-specific encoder encodes as . And we employ HyperNetwork to transform the embedded into parameters; in other words, we feed into the following two MLP layers to generate adaptive parameters
| (6) |
where , , , and , are the weights and bias terms of the first and second MLP layers, respectively. Then the model will adaptively adjust parameters based on diverse inputs, thereby substantially bolstering robustness.
| Missing rate | Methods | MIIAD Dataset | ||||||||||
| Bagel | Cable Gland | Carrot | Cookie | Dowel | Foam | Peach | Potato | Rope | Tire | Mean | ||
| 30% | Voxel GAN (Bergmann et al. 2022b) | 0.542 | 0.576 | 0.534 | 0.577 | 0.522 | 0.565 | 0.498 | 0.569 | 0.594 | 0.516 | 0.547 |
| Voxel VM (Bergmann et al. 2022b) | 0.431 | 0.454 | 0.417 | 0.436 | 0.405 | 0.443 | 0.387 | 0.468 | 0.479 | 0.408 | 0.426 | |
| PatchCore+FPFH (Horwitz and Hoshen 2022) | 0.758 | 0.779 | 0.797 | 0.776 | 0.755 | 0.752 | 0.729 | 0.776 | 0.832 | 0.765 | 0.771 | |
| AST (Rudolph et al. 2023) | 0.742 | 0.766 | 0.788 | 0.773 | 0.729 | 0.731 | 0.714 | 0.753 | 0.819 | 0.747 | 0.758 | |
| M3DM (Wang et al. 2023b) | 0.754 | 0.782 | 0.795 | 0.783 | 0.747 | 0.755 | 0.731 | 0.777 | 0.835 | 0.763 | 0.772 | |
| RADAR (Ours) | 0.794 | 0.803 | 0.832 | 0.805 | 0.784 | 0.769 | 0.758 | 0.811 | 0.872 | 0.797 | 0.813 | |
| 50% | Voxel GAN (Bergmann et al. 2022b) | 0.456 | 0.432 | 0.467 | 0.516 | 0.489 | 0.466 | 0.417 | 0.515 | 0.524 | 0.429 | 0.458 |
| Voxel VM (Bergmann et al. 2022b) | 0.372 | 0.366 | 0.375 | 0.413 | 0.377 | 0.334 | 0.346 | 0.428 | 0.437 | 0.344 | 0.376 | |
| PatchCore+FPFH (Horwitz and Hoshen 2022) | 0.664 | 0.647 | 0.738 | 0.747 | 0.675 | 0.714 | 0.622 | 0.726 | 0.768 | 0.667 | 0.696 | |
| AST (Rudolph et al. 2023) | 0.643 | 0.631 | 0.729 | 0.724 | 0.667 | 0.696 | 0.604 | 0.713 | 0.742 | 0.648 | 0.668 | |
| M3DM (Wang et al. 2023b) | 0.659 | 0.650 | 0.739 | 0.745 | 0.681 | 0.714 | 0.617 | 0.728 | 0.767 | 0.671 | 0.693 | |
| RADAR (Ours) | 0.713 | 0.673 | 0.752 | 0.773 | 0.752 | 0.719 | 0.682 | 0.750 | 0.794 | 0.723 | 0.735 | |
| 70% | Voxel GAN (Bergmann et al. 2022b) | 0.397 | 0.385 | 0.422 | 0.465 | 0.443 | 0.427 | 0.356 | 0.478 | 0.469 | 0.387 | 0.395 |
| Voxel VM (Bergmann et al. 2022b) | 0.323 | 0.307 | 0.346 | 0.379 | 0.324 | 0.298 | 0.307 | 0.386 | 0.393 | 0.306 | 0.332 | |
| PatchCore+FPFH (Horwitz and Hoshen 2022) | 0.610 | 0.617 | 0.691 | 0.627 | 0.635 | 0.652 | 0.593 | 0.622 | 0.696 | 0.585 | 0.636 | |
| AST (Rudolph et al. 2023) | 0.595 | 0.601 | 0.677 | 0.614 | 0.615 | 0.635 | 0.581 | 0.607 | 0.683 | 0.566 | 0.613 | |
| M3DM (Wang et al. 2023b) | 0.613 | 0.620 | 0.689 | 0.634 | 0.636 | 0.647 | 0.594 | 0.629 | 0.702 | 0.578 | 0.639 | |
| RADAR (Ours) | 0.653 | 0.624 | 0.723 | 0.670 | 0.661 | 0.705 | 0.630 | 0.645 | 0.741 | 0.617 | 0.684 | |
| Method | Setting | MIIAD Dataset | ||||
| FE | AIF | RPHD | P-AUROC | AUPRO | I-AUROC | |
| Baseline | 0.639 | 0.303 | 0.842 | |||
| + FE | \faCheckCircle | 0.648 | 0.316 | 0.851 | ||
| + AIF | \faCheckCircle | 0.662 | 0.329 | 0.856 | ||
| + RPHD | \faCheckCircle | 0.658 | 0.335 | 0.857 | ||
| + FE & AIF | \faCheckCircle | \faCheckCircle | 0.669 | 0.344 | 0.863 | |
| + FE & RPHD | \faCheckCircle | \faCheckCircle | 0.671 | 0.339 | 0.864 | |
| + AIF & RPHD | \faCheckCircle | \faCheckCircle | 0.677 | 0.353 | 0.873 | |
| RADAR (Ours) | \faCheckCircle | \faCheckCircle | \faCheckCircle | 0.684 | 0.368 | 0.877 |
Stage2: Real-Pseudo Hybrid Detection
In the second stage, we believe that if a sample is frequently misclassified, it may indicate the presence of ambiguous information (Zhang, Doughty, and Snoek 2023). To further strengthen the robustness of the framework, we propose a Real-Pseudo Hybrid Module to highlight the distinctiveness of different modality combinations. Finally, based on the three repositories for storaging features, we utilize MDM and OCSVM for anomaly detection decision.
Real-Pseudo Hybrid Module. We divide the multimodal feature representation into two groups, denoted as and , and input them into a Multimodal Transformer layer. This allows the two groups of features to be trained under different supervision, enabling the learning of diverse semantic information. Considering practical utility, we eliminate the attention operation, thus the output attention is
| (7) |
where and represent the query and key, while and denote the -th and -th tokens in the query and key. represents the dimensionality of the key.
For data trained with real labels, we simply use the standard cross-entropy loss for classification and L2 loss for regression, denoted as . For data trained with pseudo-labels, we average the unimodal predictions across training epochs to obtain modality-specific pseudo-labels. We then use KL divergence loss for classification tasks and L2 loss for regression tasks, denoted as .
Repository-based Anomaly Detection. Subsequently, we opt to employ multiple repositories to house features, aligning with prevalent practices in advanced IAD methodologies in recent years. The 3D point cloud features, 2D RGB image features, and modality fusion features will be stored in repository , , and respectively. These repositories facilitate hybrid anomaly detection decisions, with each repository capable of generating predicted anomaly scores and segmentation maps. The initial hybrid results exported from the repositories can be depicted as
| (8) |
| (9) |
where is the score function introduced in PatchCore (Roth et al. 2022b), which can be formulated as
| (10) |
| (11) |
| (12) |
where and are re-weight parameters.
OCSVM is employed in our model for the ultimate decision-making regarding the segmentation map , a renowned anomaly detection algorithm. As noted in PaDim (Defard et al. 2021a), the Mahalanobis distance matrix (MDM) is adept at deriving anomaly scores, hence it is integrated into our model for predicting . These two results can be described separately as
| (13) |
| (14) |
Experiments
Experimental Setup
Dataset Construction. The MVTec-3D AD dataset (Bergmann et al. 2022b) is the inaugural multimodal industrial anomaly detection dataset released by MVTec. It encompasses training samples and test samples, spanning across 10 industrial entity categories. Alongside the 2D RGB image data of objects within the dataset, high-resolution industrial 3D sensors are employed for depth scanning of products, capturing position information in 3-channel tensors that denote x, y, and z coordinates.
To cater to our research on modality-incomplete in IAD, we restructured the MVTec-3D AD dataset into a modality-incomplete setting, denoted as MIIAD Dataset. In this dataset, modality incompleteness can manifest not only during training but also during testing, with varying degrees of absence for each modality. Employing a random sampler, we constructed our MIIAD Dataset to encompass three types of modality incompleteness: 3D point cloud modality-incomplete, 2D RGB image modality-incomplete, or both modalities-incomplete. For the first two scenarios, for instance, setting the missing rate of 3D point cloud data to implies the data comprises solely 2D RGB images of and complete data of . Conversely, when the missing rate of 2D RGB image data is , the situation is reversed. In cases where both modalities are incomplete with a missing rate of , it signifies the data includes 2D RGB image data, 3D point cloud data, and complete data composition. We followed the settings for modality-missing in recognized works (Wang et al. 2023a; Bao et al. 2022) to ensure the generality of our method.
Evaluation Metrics. All evaluation metrics employed in our experiment align with those provided in the MVTec-3D AD dataset (Bergmann et al. 2022b). To assess anomaly scores, we utilize the pixel-level (P-AUROC) and image-level (I-AUROC) area under the receiver operating curve to evaluate pixel-level and image-level anomaly detection performance. In evaluating the segmentation map, we employ the overlap per region (AUPRO) metric.
Implementation Details. Our model’s backbones consist of the following components: i) For 3D point cloud features, extraction is performed by MaskTransformer (Yu et al. 2022) and Point-MAE Decoder (Pang et al. 2022). ii) For 2D RGB image features, ViT (Dosovitskiy et al. 2021) is employed. Specifically, the pre-trained ViTB/8 model with DINO on ImageNet (Deng et al. 2009) serves as our backbone network. Additionally, we have frozen all parameters of the Multimodal Transformer backbone and solely focused on training the parameters associated with MIIAD.
Several learnable modules within RADAR include: i) Modality-incomplete Instruction, with a default length set to . The MSA layer index with the prepended instruction ranges from to . The optimizer utilized is AdamW, with the learning rate set to . ii) MLP in Instruction Feature Fusion comprises and , with AdamW as the optimizer, a learning rate of , and a batch size of . iii) The OCSVM in Real-Pseudo Hybrid detection is optimized using SGD, with a learning rate of . Further details are available in the appendix.
Overall Performance
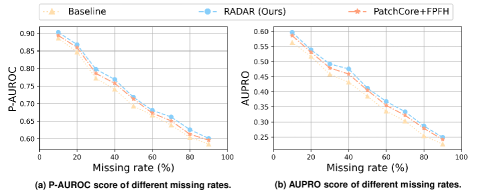
Our framework, RADAR, employs M3DM (Wang et al. 2023b) as the baseline. We conduct comparisons with recent state-of-the-art models on our self-constructed MIIAD Dataset. Tab. 1 presents the experimental outcomes of the P-AUROC metric, while the tables of I-AUROC and AUPRO score results are available in the appendix.
The experimental results demonstrate the effectiveness and robustness of our proposed framework in MIIAD. Firstly, in comparison to the baseline M3DM, our method has notably enhanced performance. For 3D point cloud modality missing rates of , , and , the average P-AUROC metric exhibited improvements of , , and , respectively. Secondly, when compared with other models, our method outperformed in all metrics. In contrast to PatchCore+FPFH model (Horwitz and Hoshen 2022), the P-AUROC values were , , and higher. The significant improvement of I-AUROC and AUPRO metrics is presented in the appendix.
| Methods | Mean (30% of pc) | Mean (50% of pc) | Mean (70% of pc) | |
| RGB | PADiM (Defard et al. 2021b) | 0.654 | 0.577 | 0.485 |
| PatchCore (Roth et al. 2022a) | 0.667 | 0.584 | 0.493 | |
| STFPM (Wang et al. 2021b) | 0.705 | 0.613 | 0.548 | |
| 3D | Depth GAN (Bergmann et al. 2022b) | 0.485 | 0.424 | 0.379 |
| Depth VM (Bergmann et al. 2022b) | 0.512 | 0.452 | 0.403 | |
| 3D-ST (Bergmann and Sattlegger 2023b) | 0.697 | 0.614 | 0.558 | |
| FPFH (Horwitz and Hoshen 2022) | 0.724 | 0.637 | 0.575 | |
| RGB+3D | AST (Rudolph et al. 2023) | 0.758 | 0.668 | 0.613 |
| PatchCore+FPFH (Horwitz and Hoshen 2022) | 0.771 | 0.696 | 0.636 | |
| M3DM (Wang et al. 2023b) | 0.772 | 0.693 | 0.639 | |
| RADAR (Ours) | 0.813 | 0.735 | 0.684 | |
| Missing type | Methods | MIIAD Dataset | ||||||||||
| Bagel | Cable Gland | Carrot | Cookie | Dowel | Foam | Peach | Potato | Rope | Tire | Mean | ||
| RGB Image: 30% 3D Point Cloud: 100% | Voxel GAN (Bergmann et al. 2022b) | 0.476 | 0.453 | 0.509 | 0.421 | 0.406 | 0.403 | 0.417 | 0.454 | 0.569 | 0.477 | 0.446 |
| Voxel VM (Bergmann et al. 2022b) | 0.388 | 0.376 | 0.425 | 0.315 | 0.327 | 0.313 | 0.330 | 0.329 | 0.426 | 0.402 | 0.341 | |
| PatchCore+FPFH (Horwitz and Hoshen 2022) | 0.745 | 0.701 | 0.767 | 0.702 | 0.699 | 0.705 | 0.701 | 0.732 | 0.841 | 0.716 | 0.725 | |
| AST (Rudolph et al. 2023) | 0.748 | 0.689 | 0.757 | 0.706 | 0.694 | 0.696 | 0.683 | 0.714 | 0.825 | 0.697 | 0.713 | |
| M3DM (Wang et al. 2023b) | 0.743 | 0.705 | 0.766 | 0.709 | 0.708 | 0.697 | 0.702 | 0.747 | 0.843 | 0.721 | 0.728 | |
| RADAR (Ours) | 0.780 | 0.741 | 0.858 | 0.749 | 0.728 | 0.745 | 0.746 | 0.781 | 0.901 | 0.752 | 0.775 | |
| RGB Image: 65% 3D Point Cloud: 65% | Voxel GAN (Bergmann et al. 2022b) | 0.411 | 0.388 | 0.365 | 0.424 | 0.403 | 0.467 | 0.422 | 0.387 | 0.491 | 0.415 | 0.395 |
| Voxel VM (Bergmann et al. 2022b) | 0.366 | 0.342 | 0.345 | 0.377 | 0.369 | 0.426 | 0.380 | 0.361 | 0.463 | 0.392 | 0.351 | |
| PatchCore+FPFH (Horwitz and Hoshen 2022) | 0.676 | 0.639 | 0.589 | 0.708 | 0.579 | 0.744 | 0.604 | 0.577 | 0.775 | 0.706 | 0.658 | |
| AST (Rudolph et al. 2023) | 0.652 | 0.621 | 0.567 | 0.675 | 0.542 | 0.726 | 0.587 | 0.560 | 0.755 | 0.679 | 0.632 | |
| M3DM (Wang et al. 2023b) | 0.682 | 0.638 | 0.601 | 0.709 | 0.579 | 0.755 | 0.601 | 0.576 | 0.784 | 0.704 | 0.663 | |
| RADAR (Ours) | 0.725 | 0.672 | 0.640 | 0.764 | 0.613 | 0.801 | 0.624 | 0.610 | 0.822 | 0.744 | 0.715 | |
| Metrics | M3DM (Baseline) | RADAR (Ours) |
| Mean(modality-complete) | 0.926 | 0.934 |
| Mean(30% of RGB) | 0.799 | 0.852 |
| Mean(50% of RGB) | 0.767 | 0.819 |
| Mean(70% of RGB) | 0.728 | 0.775 |
| Mean(30% of both) | 0.746 | 0.811 |
| Mean(50% of both) | 0.705 | 0.754 |
| Mean(70% of both) | 0.663 | 0.715 |
Fig. 3 shows a noticeable decline in the performance of multimodal models as the modality missing rate increases. However, our method consistently improves the baseline’s performance even as the missing rate rises.
Ablation Study
To evaluate the effectiveness of each module in RADAR, we conducted comprehensive ablation experiments focusing on three key modules: 2D&3D feature extraction (FE), Adaptive Instruction Fusion (AIF), and Real-Pseudo Hybrid Detection (RPHD). Comparing the data in Tab. 2, it is evident that each module we designed enhanced the performance of baseline. The three modules contributed to improvements in the P-AUROC metric by , , and , and in the AUPRO metric by , , and , respectively.
In-Depth Analysis
More comparisons with more RGB-only, 3D-only, and RGB+3D methods. We conducted comparative experiments with RGB-only IAD models, which use only 2D information, and 3D-only IAD models, which rely solely on depth information. From the Tab. 3, it can be seen that the performance of RGB-only and 3D-only models has shown a significant decline on our MIIAD dataset, with our method performing the best among them.
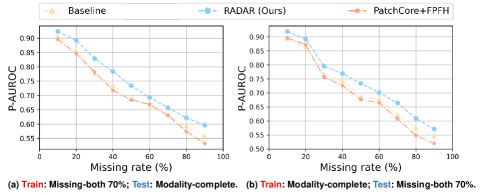
Robustness to missing-modality in different situations. To evaluate the robustness of our method in various modality-incomplete scenarios during training and testing, we conducted additional experiments.
The experimental outcomes, detailed in Tab. 4, showcase the superiority of our model when the missing rate of 2D RGB image modality or both modalities was set to 70%. Subsequently, we investigated the effects of modality-incomplete at various phases, including scenarios where modality incompleteness occurs during training and completeness during testing, and vice versa, as illustrated by the experimental outcomes in Fig. 4. We further conducted experiments with additional cases of modality missing, with some of the results presented in Tab. 5. These experimental results fully reflect the impressive performance of our framework in various modality-incomplete scenarios, significantly outperforming other methods.
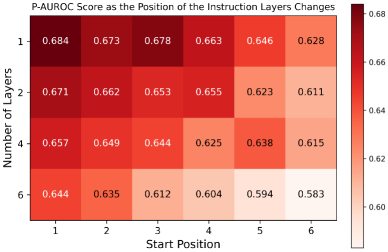
Effect of the position of instruction layers. To deeply analyze the effectiveness of instruction insertion, we visualize the effect of instruction insertion for different transformer layers in Fig. 5. The results indicate the effect of the change of instruction layer on the model performance. It can be observed that inserting modality-incomplete instruction at earlier layers and inserting fewer layers yields better results.
Comparison with modality-incomplete learning methods. To further study the superiority of proposed RADAR, We conducted comparative experiments (Tab. 6 in appendix) with other approaches aiming at addressing modality-missing issues, such as RMT (Ma et al. 2022b), VLMo (Bao et al. 2022), and ShaSpec (Wang et al. 2023a), Not surprisingly, we found that RADAR consistently outperforms existing modality-incomplete learning models by a large margin across all categories. Our intuition is that the one-stage-based methods hardly address the Modality-incomplete issue in industrial anomaly detection scenarios.
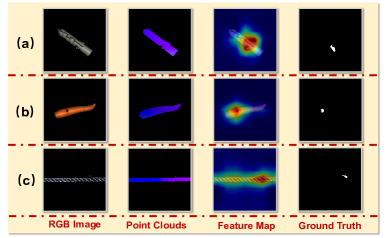
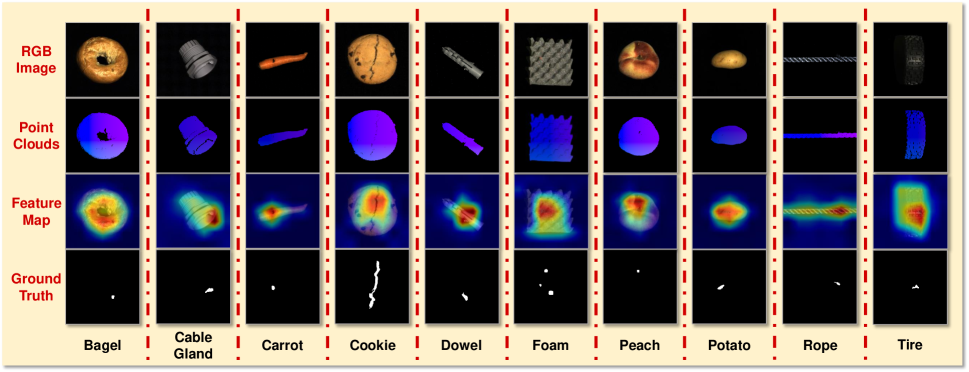
Visualization results of IAD. Fig. 6 illustrates our model’s capability in extracting multimodal features. The visualization clearly showcases our model’s aptitude for accurately identifying anomalies across diverse categories.
Conclusion
We propose the first-of-its-kind work to comprehensively investigate the Modality-Incomplete Industrial Anomaly Detection (MIIAD) and construct a novel Robust modAlity-aware fusing and Detecting frAmewoRk, abbreviated as RADAR. Extensive experiments indicated that our model outperforms other methods on the self-built MIIAD dataset. We believe that the proposed MIIAD task and RADAR serve as a complement to existing literature and provide new insights to the industrial anomaly detection community.
References
- Bao et al. (2022) Bao, H.; Wang, W.; Dong, L.; Liu, Q.; Mohammed, O. K.; Aggarwal, K.; Som, S.; Piao, S.; and Wei, F. 2022. VLMo: Unified Vision-Language Pre-Training with Mixture-of-Modality-Experts. In Advances in Neural Information Processing Systems.
- Bergmann et al. (2022a) Bergmann, P.; Batzner, K.; Fauser, M.; Sattlegger, D.; and Steger, C. 2022a. Beyond dents and scratches: Logical constraints in unsupervised anomaly detection and localization. International Journal of Computer Vision, 130(4): 947–969.
- Bergmann et al. (2020) Bergmann, P.; Fauser, M.; Sattlegger, D.; and Steger, C. 2020. Uninformed students: Student-teacher anomaly detection with discriminative latent embeddings. In Proceedings of the IEEE/CVF conference on computer vision and pattern recognition, 4183–4192.
- Bergmann et al. (2022b) Bergmann, P.; Jin, X.; Sattlegger, D.; and Steger, C. 2022b. The MVTec 3D-AD Dataset for Unsupervised 3D Anomaly Detection and Localization. In Proceedings of the 17th International Joint Conference on Computer Vision, 202–213.
- Bergmann et al. (2018) Bergmann, P.; Löwe, S.; Fauser, M.; Sattlegger, D.; and Steger, C. 2018. Improving unsupervised defect segmentation by applying structural similarity to autoencoders. arXiv preprint arXiv:1807.02011.
- Bergmann and Sattlegger (2023a) Bergmann, P.; and Sattlegger, D. 2023a. Anomaly detection in 3d point clouds using deep geometric descriptors. In Proceedings of the IEEE/CVF Winter Conference on Applications of Computer Vision, 2613–2623.
- Bergmann and Sattlegger (2023b) Bergmann, P.; and Sattlegger, D. 2023b. Anomaly Detection in 3D Point Clouds Using Deep Geometric Descriptors. In Proceedings of the IEEE/CVF Winter Conference on Applications of Computer Vision (WACV), 2613–2623.
- Bonfiglioli et al. (2022) Bonfiglioli, L.; Toschi, M.; Silvestri, D.; Fioraio, N.; and De Gregorio, D. 2022. The Eyecandies Dataset for Unsupervised Multimodal Anomaly Detection and Localization. In Proceedings of the Asian Conference on Computer Vision (ACCV), 3586–3602.
- Chartsias et al. (2017) Chartsias, A.; Joyce, T.; Giuffrida, M. V.; and Tsaftaris, S. A. 2017. Multimodal MR synthesis via modality-invariant latent representation. IEEE transactions on medical imaging, 37(3): 803–814.
- Chen et al. (2019) Chen, C.; Dou, Q.; Jin, Y.; Chen, H.; Qin, J.; and Heng, P.-A. 2019. Robust multimodal brain tumor segmentation via feature disentanglement and gated fusion. In Medical Image Computing and Computer Assisted Intervention–MICCAI 2019: 22nd International Conference, Shenzhen, China, October 13–17, 2019, Proceedings, Part III 22, 447–456. Springer.
- Defard et al. (2021a) Defard, T.; Setkov, A.; Loesch, A.; and Audigier, R. 2021a. PaDiM: A Patch Distribution Modeling Framework for Anomaly Detection and Localization. In ICPR 2021: Pattern Recognition. ICPR International Workshops and Challenges, volume 12664, 475–489.
- Defard et al. (2021b) Defard, T.; Setkov, A.; Loesch, A.; and Audigier, R. 2021b. PaDiM: A Patch Distribution Modeling Framework for Anomaly Detection and Localization. In Del Bimbo, A.; Cucchiara, R.; Sclaroff, S.; Farinella, G. M.; Mei, T.; Bertini, M.; Escalante, H. J.; and Vezzani, R., eds., Pattern Recognition. ICPR International Workshops and Challenges, 475–489. Cham: Springer International Publishing. ISBN 978-3-030-68799-1.
- Dehaene and Eline (2020) Dehaene, D.; and Eline, P. 2020. Anomaly localization by modeling perceptual features. arXiv preprint arXiv:2008.05369.
- Deng et al. (2009) Deng, J.; Dong, W.; Socher, R.; Li, L.-J.; Li, K.; and Fei-Fei, L. 2009. Imagenet: A large-scale hierarchical image database. In IEEE Conference on Computer Vision and Pattern Recognition (CVPR), 248–255.
- Dosovitskiy et al. (2021) Dosovitskiy, A.; Beyer, L.; Kolesnikov, A.; Weissenborn, D.; Zhai, X.; Unterthiner, T.; Dehghani, M.; Minderer, M.; Heigold, G.; Gelly, S.; Uszkoreit, J.; and Houlsby, N. 2021. An Image is Worth 16x16 Words: Transformers for Image Recognition at Scale. In Proceedings of the 9th International Conference on Learning Representations, ICLR 2021, 3–7.
- Fischler and Bolles (1981) Fischler, M. A.; and Bolles, R. C. 1981. Random sample consensus: a paradigm for model fitting with applications to image analysis and automated cartography. Communications of the ACM, 24(6): 381–395.
- Gong et al. (2023) Gong, X.; Mohan, S.; Dhingra, N.; Bazin, J.-C.; Li, Y.; Wang, Z.; and Ranjan, R. 2023. MMG-Ego4D: Multi-Modal Generalization in Egocentric Action Recognition. In 2023 IEEE/CVF Conference on Computer Vision and Pattern Recognition (CVPR), 6481–6491.
- Gudovskiy, Ishizaka, and Kozuka (2022) Gudovskiy, D.; Ishizaka, S.; and Kozuka, K. 2022. CFLOW-AD: Real-Time Unsupervised Anomaly Detection with Localization via Conditional Normalizing Flows. In 2022 IEEE/CVF Winter Conference on Applications of Computer Vision (WACV), 1819–1828.
- Ha, Dai, and Le (2017) Ha, D.; Dai, A. M.; and Le, Q. V. 2017. HyperNetworks. In 5th International Conference on Learning Representations, ICLR 2017.
- Horwitz and Hoshen (2022) Horwitz, E.; and Hoshen, Y. 2022. An Empirical Investigation of 3D Anomaly Detection and Segmentation. arXiv preprint arXiv:2203.05550.
- Horwitz and Hoshen (2023) Horwitz, E.; and Hoshen, Y. 2023. Back to the feature: classical 3d features are (almost) all you need for 3d anomaly detection. In Proceedings of the IEEE/CVF Conference on Computer Vision and Pattern Recognition, 2967–2976.
- Hu, Chen, and Shao (2021) Hu, C.; Chen, K.; and Shao, H. 2021. A semantic-enhanced method based on deep SVDD for pixel-wise anomaly detection. In 2021 IEEE International Conference on Multimedia and Expo (ICME), 1–6. IEEE.
- Jiang et al. (2022) Jiang, J.; Zhu, J.; Bilal, M.; Cui, Y.; Kumar, N.; Dou, R.; Su, F.; and Xu, X. 2022. Masked swin transformer unet for industrial anomaly detection. IEEE Transactions on Industrial Informatics, 19(2): 2200–2209.
- Karimi Mahabadi et al. (2021) Karimi Mahabadi, R.; Ruder, S.; Dehghani, M.; and Henderson, J. 2021. Parameter-efficient Multi-task Fine-tuning for Transformers via Shared Hypernetworks. In Zong, C.; Xia, F.; Li, W.; and Navigli, R., eds., Proceedings of the 59th Annual Meeting of the Association for Computational Linguistics and the 11th International Joint Conference on Natural Language Processing (Volume 1: Long Papers), 565–576. Online: Association for Computational Linguistics.
- Lee et al. (2023) Lee, Y.-L.; Tsai, Y.-H.; Chiu, W.-C.; and Lee, C.-Y. 2023. Multimodal Prompting with Missing Modalities for Visual Recognition. In IEEE Conference on Computer Vision and Pattern Recognition (CVPR).
- Liang et al. (2023) Liang, Y.; Zhang, J.; Zhao, S.; Wu, R.; Liu, Y.; and Pan, S. 2023. Omni-frequency channel-selection representations for unsupervised anomaly detection. IEEE Transactions on Image Processing.
- Ma et al. (2022a) Ma, M.; Ren, J.; Zhao, L.; Testuggine, D.; and Peng, X. 2022a. Are multimodal transformers robust to missing modality? In Proceedings of the IEEE/CVF Conference on Computer Vision and Pattern Recognition, 18177–18186.
- Ma et al. (2022b) Ma, M.; Ren, J.; Zhao, L.; Testuggine, D.; and Peng, X. 2022b. Multimodal Prompting with Missing Modalities for Visual Recognition. In IEEE Conference on Computer Vision and Pattern Recognition (CVPR).
- Ma et al. (2021a) Ma, M.; Ren, J.; Zhao, L.; Tulyakov, S.; Wu, C.; and Peng, X. 2021a. Smil: Multimodal learning with severely missing modality. In Proceedings of the AAAI Conference on Artificial Intelligence, volume 35, 2302–2310.
- Ma et al. (2021b) Ma, M.; Ren, J.; Zhao, L.; Tulyakov, S.; Wu, C.; and Peng, X. 2021b. SMIL: Multimodal Learning with Severely Missing Modality. In AAAI Conference on Artificial Intelligence (AAAI).
- Mishra et al. (2021) Mishra, P.; Verk, R.; Fornasier, D.; Piciarelli, C.; and Foresti, G. L. 2021. VT-ADL: A vision transformer network for image anomaly detection and localization. In 2021 IEEE 30th International Symposium on Industrial Electronics (ISIE), 01–06. IEEE.
- Pang et al. (2022) Pang, Y.; Wang, W.; Tay, F. E.; Liu, W.; Tian, Y.; and Yuan, L. 2022. Masked autoencoders for point cloud self-supervised learning. In Computer Vision–ECCV 2022: 17th European Conference, Tel Aviv, Israel, October 23–27, 2022, Proceedings, Part II, 604–621. Springer.
- Poklukar et al. (2022) Poklukar, P.; Vasco, M.; Yin, H.; Melo, F. S.; Paiva, A.; and Kragic, D. 2022. Geometric Multimodal Contrastive Representation Learning. arXiv preprint arXiv:2202.03390.
- Qi et al. (2017) Qi, C. R.; Yi, L.; Su, H.; and Guibas, L. J. 2017. PointNet++: Deep Hierarchical Feature Learning on Point Sets in a Metric Space. In Guyon, I.; Luxburg, U. V.; Bengio, S.; Wallach, H.; Fergus, R.; Vishwanathan, S.; and Garnett, R., eds., Advances in Neural Information Processing Systems, volume 30. Curran Associates, Inc.
- Roth et al. (2022a) Roth, K.; Pemula, L.; Zepeda, J.; Schölkopf, B.; Brox, T.; and Gehler, P. 2022a. Towards Total Recall in Industrial Anomaly Detection. In Proceedings of the IEEE/CVF Conference on Computer Vision and Pattern Recognition (CVPR), 14318–14328.
- Roth et al. (2022b) Roth, K.; Pemula, L.; Zepeda, J.; Schölkopf, B.; Brox, T.; and Gehler, P. 2022b. Towards Total Recall in Industrial Anomaly Detection. In IEEE Conference on Computer Vision and Pattern Recognition (CVPR), 14318–14328.
- Rudolph et al. (2023) Rudolph, M.; Wehrbein, T.; Rosenhahn, B.; and Wandt, B. 2023. Asymmetric Student-Teacher Networks for Industrial Anomaly Detection. In Proceedings of the IEEE/CVF Winter Conference on Applications of Computer Vision (WACV), 2592–2602.
- Salehi et al. (2021) Salehi, M.; Sadjadi, N.; Baselizadeh, S.; Rohban, M. H.; and Rabiee, H. R. 2021. Multiresolution knowledge distillation for anomaly detection. In Proceedings of the IEEE/CVF conference on computer vision and pattern recognition, 14902–14912.
- Song et al. (2021) Song, J.; Kong, K.; Park, Y.-I.; Kim, S.-G.; and Kang, S.-J. 2021. AnoSeg: Anomaly segmentation network using self-supervised learning. arXiv preprint arXiv:2110.03396.
- van den Oord, Li, and Vinyals (2018) van den Oord, A.; Li, Y.; and Vinyals, O. 2018. Representation Learning with Contrastive Predictive Coding. ArXiv, abs/1807.03748.
- van Tulder and de Bruijne (2018) van Tulder, G.; and de Bruijne, M. 2018. Learning cross-modality representations from multi-modal images. IEEE transactions on medical imaging, 38(2): 638–648.
- Wang et al. (2021a) Wang, G.; Han, S.; Ding, E.; and Huang, D. 2021a. Student-teacher feature pyramid matching for anomaly detection. arXiv preprint arXiv:2103.04257.
- Wang et al. (2021b) Wang, G.; Han, S.; Ding, E.; and Huang, D. 2021b. Student-Teacher Feature Pyramid Matching for Anomaly Detection. In British Machine Vision Conference.
- Wang et al. (2023a) Wang, H.; Chen, Y.; Ma, C.; Avery, J.; Hull, L.; and Carneiro, G. 2023a. Multi-modal learning with missing modality via shared-specific feature modelling. In Proceedings of the IEEE/CVF Conference on Computer Vision and Pattern Recognition, 15878–15887.
- Wang et al. (2020) Wang, L.; Zhang, D.; Guo, J.; and Han, Y. 2020. Image anomaly detection using normal data only by latent space resampling. Applied Sciences, 10(23): 8660.
- Wang et al. (2023b) Wang, Y.; Peng, J.; Zhang, J.; Yi, R.; Wang, Y.; and Wang, C. 2023b. Multimodal industrial anomaly detection via hybrid fusion. In Proceedings of the IEEE/CVF Conference on Computer Vision and Pattern Recognition, 8032–8041.
- Wolf et al. (2020) Wolf, T.; Debut, L.; Sanh, V.; Chaumond, J.; Delangue, C.; Moi, A.; Cistac, P.; Rault, T.; Louf, R.; Funtowicz, M.; Davison, J.; Shleifer, S.; von Platen, P.; Ma, C.; Jernite, Y.; Plu, J.; Xu, C.; Scao, T. L.; Gugger, S.; Drame, M.; Lhoest, Q.; and Rush, A. M. 2020. Transformers: State-of-the-Art Natural Language Processing. In Proceedings of the 2020 Conference on Empirical Methods in Natural Language Processing: System Demonstrations, 38–45. Online: Association for Computational Linguistics.
- Wyatt et al. (2022) Wyatt, J.; Leach, A.; Schmon, S. M.; and Willcocks, C. G. 2022. Anoddpm: Anomaly detection with denoising diffusion probabilistic models using simplex noise. In Proceedings of the IEEE/CVF Conference on Computer Vision and Pattern Recognition, 650–656.
- Yu et al. (2022) Yu, X.; Tang, L.; Rao, Y.; Huang, T.; Zhou, J.; and Lu, J. 2022. Point-BERT: Pre-Training 3D Point Cloud Transformers with Masked Point Modeling. In Proceedings of the IEEE Conference on Computer Vision and Pattern Recognition (CVPR).
- Zhang, Doughty, and Snoek (2023) Zhang, Y.; Doughty, H.; and Snoek, C. 2023. Learning Unseen Modality Interaction. In Oh, A.; Naumann, T.; Globerson, A.; Saenko, K.; Hardt, M.; and Levine, S., eds., Advances in Neural Information Processing Systems, volume 36, 54716–54726. Curran Associates, Inc.
- Zhang and Deng (2021) Zhang, Z.; and Deng, X. 2021. Anomaly detection using improved deep SVDD model with data structure preservation. Pattern Recognition Letters, 148: 1–6.
- Zhao et al. (2023) Zhao, Z.; Bai, H.; Zhang, J.; Zhang, Y.; Xu, S.; Lin, Z.; Timofte, R.; and Van Gool, L. 2023. CDDFuse: Correlation-Driven Dual-Branch Feature Decomposition for Multi-Modality Image Fusion. In Proceedings of the IEEE/CVF Conference on Computer Vision and Pattern Recognition (CVPR), 5906–5916.
This is the Appendix for paper “RADAR: Robust Two-stage Modality-incomplete Industrial Anomaly Detection”. Tab. 6 shows the abbreviations and the symbols used in the main paper.
| Abbreviation / Symbol | Meaning |
| Abbreviation | |
| RADAR | Robust modality-imcomplete fusing and detecting framework |
| MIIAD | Modality-Incomplete Industrial Anomaly Detection |
| MII | Modality-incomplete Instruction |
| AIF | Adaptive Instruction Fusion |
| MLP | Multi-layer perceptron |
| Symbol in Algorithm | |
| Modality-complete subset data | |
| 3D point cloud modality-incomplete subset data | |
| 2D RGB image modality-incomplete subset data | |
| MII for 3D point cloud modality-missing | |
| MII for 2D RGB image modality-missing | |
| Features of 3D point clouds | |
| Features of 2D RGB images | |
| Concatenation | |
| Modality-incomplete instruction function | |
| HyperNetwork-based Adaptive Learning | |
| One-Class Support Vector Machine | |
| Mahalanobis distance matrix |
| Category | RGB iamges in # Train | Point clouds in # Train | RGB iamges in # Test | Point clouds in # Test | Anomaly types | Image size (width × height) |
| bagel | 244 | 74 | 110 | 33 | 4 | 800 × 800 |
| cable gland | 223 | 67 | 108 | 33 | 4 | 400 × 400 |
| carrot | 286 | 86 | 159 | 48 | 5 | 800 × 800 |
| cookie | 210 | 63 | 131 | 40 | 4 | 500 × 500 |
| dowel | 288 | 87 | 130 | 39 | 4 | 400 × 400 |
| foam | 236 | 71 | 100 | 30 | 4 | 900 × 900 |
| peach | 361 | 109 | 132 | 40 | 5 | 600 × 600 |
| potato | 300 | 90 | 114 | 35 | 4 | 800 × 800 |
| rope | 298 | 90 | 101 | 31 | 3 | 900 × 400 |
| tire | 210 | 63 | 112 | 34 | 4 | 600 × 800 |
| total | 2656 | 800 | 1197 | 363 | 41 |
This appendix is organized as follows:
-
•
Section 1 introduces the details of the novel benchmark MIIAD Dataset that we have created.
-
•
Section 2 demonstrates the enhanced efficiency of our RADAR’s parameters following the integration of MII and HyperNetwork.
-
•
Section 3 provides detailed information on the RADAR model construction and training processes not covered in the main paper.
-
•
Section 4 details the AUPRO scores and I-AUROC scores for our RADAR compared to other methods on the MIIAD Dataset, under various 3D point cloud modality missing scenarios.
-
•
Section 5 compares the effectiveness of our modality-incomplete instruction against alternative strategies in addressing modality-missing issue.
-
•
Section 6 presents more detailed results comparing our RADAR with other RGB only, 3D only, and RGB+3D methods.
-
•
Section 7 displays the experimental results of our framework on the Eyecandies dataset (Bonfiglioli et al. 2022).
-
•
Section 8 showcases our model’s visual industrial anomaly detection performance across different categorical objects within the MIIAD Dataset.
| Methods | # Trained params | Relative proportion | MIIAD Dataset | ||||||||||
| Bagel | Cable Gland | Carrot | Cookie | Dowel | Foam | Peach | Potato | Rope | Tire | Mean | |||
| M3DM (Baseline) (Wang et al. 2023b) | 510,603K | 100% | 0.613 | 0.620 | 0.689 | 0.634 | 0.636 | 0.647 | 0.594 | 0.629 | 0.702 | 0.578 | 0.639 |
| RADAR (Ours) | 6,842K | 1.34% | 0.653 | 0.624 | 0.723 | 0.670 | 0.661 | 0.705 | 0.630 | 0.645 | 0.741 | 0.617 | 0.684 |
Details of MIIAD Dataset
We have developed a novel benchmark called MIIAD Dataset for modality-incomplete industrial anomaly detection task, reconstructed from MVTec-3D AD dataset (Bergmann et al. 2022b). The dataset contains a total of 10 categories of industrial entities, each consisting of 2D RGB images and 3D point clouds collected using high-resolution industrial 3D sensors.
For each category, there are samples in good condition, as well as abnormal samples aligned with actual industrial testing conditions, such as abrasion, pollution, holes, scratches, etc. In fact, in order to meet the needs of different modality incomplete scenarios, we have established sub-datasets with different degrees of modality missing. Tab. 7 displays more statistical information for datasets with missing rates of 70% for 3D point cloud modality.
Efficiency on Parameters
We have integrated HyperNetwork (Ha, Dai, and Le 2017) to dynamically cater to tasks with fewer parameters, aiming for enhanced performance (Karimi Mahabadi et al. 2021). During the training of our modality-incomplete instruction, we leveraged prompt learning by freezing all parameters of the simple Multimodal Transformer, retaining only the MLP and fully connected layer for downstream task processing. Consequently, the number of parameters that our model RADAR requires to train is significantly reduced. As illustrated in the Tab. 8, in contrast to the 510M parameter count in the Unsupervised Feature Fusion (UFF) module of the Baseline model M3DM (Wang et al. 2023b), our model only necessitates training 6,842K parameter counts, representing merely . Nonetheless, our model’s performance significantly exceeds that of the Baseline.
Implementation Details
The pseudocode of the process of our model RADAR can be represented by Algorithm 1.
Input: Multimodal data samples from MIIAD Dataset;
During the data reading phase, for instances with incomplete 3D point cloud modality where point cloud information is encapsulated in TIFF format, we generate a tensor filled with ones, matching the size of the read data, to serve as a pseudo input (i.e. ). For cases with incomplete 2D RGB image modality, we employ images where all pixel values are set to one to act as pseudo inputs (i.e. ). We apply RANSAC (Fischler and Bolles 1981) for estimating the background plane in 3D point cloud data, eliminating points within a 0.005 distance threshold, and subsequently resizing both the position tensor and the 2D RGB image to a patch. We employ a hybrid of MaskTransformer (Yu et al. 2022) and Point-MAE Decoder (Pang et al. 2022) to extract features from 3D point clouds. In reference to (Wang et al. 2023b), the outputs from the layers are converted into x, y, and z coordinates to represent three-dimensional features, respectively.
| Missing rate | Methods | MIIAD Dataset | ||||||||||
| Bagel | Cable Gland | Carrot | Cookie | Dowel | Foam | Peach | Potato | Rope | Tire | Mean | ||
| 30% | Voxel GAN (Bergmann et al. 2022b) | 0.324 | 0.386 | 0.434 | 0.392 | 0.335 | 0.314 | 0.307 | 0.391 | 0.384 | 0.368 | 0.357 |
| Voxel VM (Bergmann et al. 2022b) | 0.289 | 0.343 | 0.377 | 0.346 | 0.302 | 0.278 | 0.283 | 0.336 | 0.342 | 0.315 | 0.316 | |
| PatchCore+FPFH (Horwitz and Hoshen 2022) | 0.402 | 0.490 | 0.545 | 0.526 | 0.443 | 0.407 | 0.394 | 0.467 | 0.452 | 0.448 | 0.454 | |
| AST (Rudolph et al. 2023) | 0.398 | 0.479 | 0.542 | 0.515 | 0.447 | 0.405 | 0.386 | 0.460 | 0.447 | 0.443 | 0.449 | |
| M3DM (Wang et al. 2023b) | 0.394 | 0.491 | 0.544 | 0.517 | 0.450 | 0.424 | 0.389 | 0.456 | 0.463 | 0.451 | 0.458 | |
| RADAR (Ours) | 0.462 | 0.532 | 0.580 | 0.552 | 0.541 | 0.464 | 0.456 | 0.553 | 0.542 | 0.475 | 0.518 | |
| 50% | Voxel GAN (Bergmann et al. 2022b) | 0.276 | 0.254 | 0.397 | 0.379 | 0.332 | 0.345 | 0.267 | 0.313 | 0.388 | 0.265 | 0.296 |
| Voxel VM (Bergmann et al. 2022b) | 0.243 | 0.231 | 0.346 | 0.328 | 0.289 | 0.311 | 0.224 | 0.287 | 0.360 | 0.221 | 0.258 | |
| PatchCore+FPFH (Horwitz and Hoshen 2022) | 0.365 | 0.318 | 0.470 | 0.449 | 0.407 | 0.419 | 0.323 | 0.365 | 0.423 | 0.314 | 0.387 | |
| AST (Rudolph et al. 2023) | 0.352 | 0.296 | 0.453 | 0.438 | 0.399 | 0.410 | 0.312 | 0.347 | 0.406 | 0.293 | 0.363 | |
| M3DM (Wang et al. 2023b) | 0.366 | 0.317 | 0.466 | 0.458 | 0.411 | 0.415 | 0.322 | 0.369 | 0.412 | 0.317 | 0.385 | |
| RADAR (Ours) | 0.398 | 0.372 | 0.528 | 0.490 | 0.454 | 0.457 | 0.357 | 0.451 | 0.482 | 0.347 | 0.439 | |
| 70% | Voxel GAN (Bergmann et al. 2022b) | 0.203 | 0.276 | 0.344 | 0.265 | 0.277 | 0.303 | 0.201 | 0.312 | 0.268 | 0.227 | 0.256 |
| Voxel VM (Bergmann et al. 2022b) | 0.176 | 0.243 | 0.301 | 0.216 | 0.243 | 0.276 | 0.166 | 0.278 | 0.230 | 0.198 | 0.227 | |
| PatchCore+FPFH (Horwitz and Hoshen 2022) | 0.257 | 0.312 | 0.374 | 0.318 | 0.317 | 0.336 | 0.249 | 0.338 | 0.297 | 0.254 | 0.302 | |
| AST (Rudolph et al. 2023) | 0.226 | 0.297 | 0.361 | 0.298 | 0.301 | 0.315 | 0.222 | 0.316 | 0.259 | 0.223 | 0.279 | |
| M3DM (Wang et al. 2023b) | 0.253 | 0.316 | 0.374 | 0.307 | 0.325 | 0.330 | 0.247 | 0.341 | 0.302 | 0.259 | 0.303 | |
| RADAR (Ours) | 0.304 | 0.350 | 0.428 | 0.356 | 0.354 | 0.365 | 0.304 | 0.390 | 0.342 | 0.343 | 0.368 | |
| Missing rate | Methods | MIIAD Dataset | ||||||||||
| Bagel | Cable Gland | Carrot | Cookie | Dowel | Foam | Peach | Potato | Rope | Tire | Mean | ||
| 30% | Voxel GAN (Bergmann et al. 2022b) | 0.716 | 0.687 | 0.713 | 0.667 | 0.698 | 0.570 | 0.646 | 0.588 | 0.748 | 0.574 | 0.676 |
| Voxel VM (Bergmann et al. 2022b) | 0.593 | 0.578 | 0.602 | 0.586 | 0.643 | 0.484 | 0.573 | 0.506 | 0.655 | 0.467 | 0.557 | |
| PatchCore+FPFH (Horwitz and Hoshen 2022) | 0.924 | 0.854 | 0.858 | 0.844 | 0.863 | 0.797 | 0.837 | 0.726 | 0.893 | 0.740 | 0.834 | |
| AST (Rudolph et al. 2023) | 0.916 | 0.838 | 0.860 | 0.815 | 0.832 | 0.792 | 0.816 | 0.704 | 0.885 | 0.719 | 0.818 | |
| M3DM (Wang et al. 2023b) | 0.932 | 0.857 | 0.871 | 0.835 | 0.848 | 0.814 | 0.843 | 0.725 | 0.906 | 0.732 | 0.842 | |
| RADAR (Ours) | 0.954 | 0.887 | 0.903 | 0.859 | 0.891 | 0.843 | 0.878 | 0.747 | 0.933 | 0.763 | 0.877 | |
| 50% | Voxel GAN (Bergmann et al. 2022b) | 0.667 | 0.586 | 0.631 | 0.596 | 0.643 | 0.556 | 0.625 | 0.498 | 0.690 | 0.503 | 0.595 |
| Voxel VM (Bergmann et al. 2022b) | 0.587 | 0.495 | 0.554 | 0.521 | 0.574 | 0.425 | 0.518 | 0.412 | 0.608 | 0.442 | 0.512 | |
| PatchCore+FPFH (Horwitz and Hoshen 2022) | 0.893 | 0.746 | 0.860 | 0.722 | 0.803 | 0.776 | 0.808 | 0.646 | 0.886 | 0.683 | 0.768 | |
| AST (Rudolph et al. 2023) | 0.862 | 0.752 | 0.831 | 0.716 | 0.788 | 0.759 | 0.784 | 0.627 | 0.859 | 0.669 | 0.744 | |
| M3DM (Wang et al. 2023b) | 0.887 | 0.761 | 0.847 | 0.747 | 0.815 | 0.778 | 0.807 | 0.654 | 0.877 | 0.694 | 0.783 | |
| RADAR (Ours) | 0.918 | 0.792 | 0.882 | 0.783 | 0.852 | 0.812 | 0.838 | 0.683 | 0.905 | 0.727 | 0.831 | |
| 70% | Voxel GAN (Bergmann et al. 2022b) | 0.612 | 0.443 | 0.657 | 0.478 | 0.605 | 0.560 | 0.562 | 0.452 | 0.646 | 0.449 | 0.523 |
| Voxel VM (Bergmann et al. 2022b) | 0.506 | 0.368 | 0.576 | 0.398 | 0.497 | 0.495 | 0.482 | 0.334 | 0.527 | 0.366 | 0.415 | |
| PatchCore+FPFH (Horwitz and Hoshen 2022) | 0.830 | 0.662 | 0.798 | 0.627 | 0.795 | 0.732 | 0.768 | 0.609 | 0.855 | 0.651 | 0.708 | |
| AST (Rudolph et al. 2023) | 0.812 | 0.638 | 0.784 | 0.619 | 0.776 | 0.735 | 0.755 | 0.572 | 0.832 | 0.636 | 0.592 | |
| M3DM (Wang et al. 2023b) | 0.843 | 0.654 | 0.804 | 0.643 | 0.786 | 0.748 | 0.776 | 0.598 | 0.849 | 0.667 | 0.719 | |
| RADAR (Ours) | 0.879 | 0.677 | 0.836 | 0.701 | 0.824 | 0.774 | 0.805 | 0.663 | 0.871 | 0.695 | 0.757 | |
AUPRO and I-AUROC scores for MIIAD
In addition to the P-AUROC score mentioned in the main paper, Tab. 9 and Tab. 10 display the experimental results for the AUPRO metric and I-AUROC metric on the MIIAD Dataset under conditions of 3D point cloud modality absence to show more details of our experiments.
Specifically, the AUPRO scores of our framework exceed those of the second-best method, by , , and at 3D point cloud modality missing rates of , , and , correspondingly. And the I-AUROC scores exceed the second-best method by , , and . These results demonstrate our strategy’s robustness and effectiveness, surpassing competing approaches.
| Missing rate | Methods | MIIAD Dataset | ||||||||||
| Bagel | Cable Gland | Carrot | Cookie | Dowel | Foam | Peach | Potato | Rope | Tire | Mean | ||
| 30% | SMIL (Ma et al. 2021b) | 0.731 | 0.733 | 0.758 | 0.756 | 0.724 | 0.735 | 0.702 | 0.726 | 0.810 | 0.731 | 0.733 |
| GMC (Poklukar et al. 2022) | 0.742 | 0.759 | 0.786 | 0.772 | 0.751 | 0.743 | 0.724 | 0.757 | 0.821 | 0.758 | 0.760 | |
| RMT (Ma et al. 2022b) | 0.738 | 0.765 | 0.784 | 0.776 | 0.748 | 0.752 | 0.729 | 0.768 | 0.829 | 0.762 | 0.763 | |
| VLMo (Bao et al. 2022) | 0.751 | 0.783 | 0.780 | 0.769 | 0.752 | 0.738 | 0.718 | 0.766 | 0.836 | 0.765 | 0.769 | |
| ShaSpec (Wang et al. 2023a) | 0.756 | 0.779 | 0.794 | 0.776 | 0.750 | 0.749 | 0.736 | 0.773 | 0.838 | 0.774 | 0.776 | |
| RADAR (Ours) | 0.794 | 0.803 | 0.832 | 0.805 | 0.784 | 0.769 | 0.758 | 0.811 | 0.872 | 0.797 | 0.813 | |
| 50% | SMIL (Ma et al. 2021b) | 0.645 | 0.613 | 0.712 | 0.708 | 0.626 | 0.692 | 0.621 | 0.654 | 0.744 | 0.629 | 0.653 |
| GMC (Poklukar et al. 2022) | 0.652 | 0.631 | 0.729 | 0.737 | 0.654 | 0.703 | 0.626 | 0.709 | 0.763 | 0.657 | 0.678 | |
| RMT (Ma et al. 2022b) | 0.648 | 0.635 | 0.736 | 0.733 | 0.667 | 0.709 | 0.630 | 0.718 | 0.759 | 0.665 | 0.686 | |
| VLMo (Bao et al. 2022) | 0.662 | 0.644 | 0.739 | 0.741 | 0.663 | 0.707 | 0.637 | 0.724 | 0.769 | 0.683 | 0.694 | |
| ShaSpec (Wang et al. 2023a) | 0.667 | 0.653 | 0.742 | 0.737 | 0.678 | 0.706 | 0.645 | 0.720 | 0.766 | 0.688 | 0.702 | |
| RADAR (Ours) | 0.713 | 0.673 | 0.752 | 0.773 | 0.752 | 0.719 | 0.682 | 0.750 | 0.794 | 0.723 | 0.735 | |
| 70% | SMIL (Ma et al. 2021b) | 0.553 | 0.584 | 0.674 | 0.633 | 0.589 | 0.616 | 0.577 | 0.592 | 0.678 | 0.537 | 0.602 |
| GMC (Poklukar et al. 2022) | 0.598 | 0.604 | 0.682 | 0.643 | 0.621 | 0.627 | 0.601 | 0.606 | 0.694 | 0.558 | 0.628 | |
| RMT (Ma et al. 2022b) | 0.597 | 0.615 | 0.680 | 0.641 | 0.632 | 0.635 | 0.598 | 0.617 | 0.703 | 0.565 | 0.632 | |
| VLMo (Bao et al. 2022) | 0.614 | 0.608 | 0.696 | 0.637 | 0.638 | 0.656 | 0.604 | 0.623 | 0.716 | 0.582 | 0.639 | |
| ShaSpec (Wang et al. 2023a) | 0.618 | 0.613 | 0.692 | 0.647 | 0.642 | 0.648 | 0.609 | 0.625 | 0.713 | 0.589 | 0.643 | |
| RADAR (Ours) | 0.653 | 0.624 | 0.723 | 0.670 | 0.661 | 0.705 | 0.630 | 0.645 | 0.741 | 0.617 | 0.684 | |
| Missing rate | Methods | MIIAD Dataset | |||||||||||
| Bagel | Cable Gland | Carrot | Cookie | Dowel | Foam | Peach | Potato | Rope | Tire | Mean | |||
| 30% | RGB | PADiM (Defard et al. 2021b) | 0.657 | 0.662 | 0.684 | 0.631 | 0.674 | 0.627 | 0.632 | 0.692 | 0.725 | 0.682 | 0.654 |
| PatchCore (Roth et al. 2022a) | 0.645 | 0.681 | 0.685 | 0.642 | 0.681 | 0.645 | 0.621 | 0.689 | 0.722 | 0.668 | 0.667 | ||
| STFPM (Wang et al. 2021b) | 0.678 | 0.701 | 0.726 | 0.687 | 0.707 | 0.677 | 0.653 | 0.714 | 0.743 | 0.695 | 0.705 | ||
| 3D | Depth GAN (Bergmann et al. 2022b) | 0.492 | 0.495 | 0.531 | 0.515 | 0.478 | 0.465 | 0.498 | 0.466 | 0.587 | 0.467 | 0.485 | |
| 3D-ST (Bergmann and Sattlegger 2023b) | 0.687 | 0.687 | 0.705 | 0.694 | 0.688 | 0.672 | 0.650 | 0.699 | 0.752 | 0.687 | 0.697 | ||
| FPFH (Horwitz and Hoshen 2022) | 0.703 | 0.726 | 0.749 | 0.712 | 0.723 | 0.697 | 0.677 | 0.726 | 0.776 | 0.714 | 0.724 | ||
| RGB+3D | PatchCore+FPFH (Horwitz and Hoshen 2022) | 0.758 | 0.779 | 0.797 | 0.776 | 0.755 | 0.752 | 0.729 | 0.776 | 0.832 | 0.765 | 0.771 | |
| M3DM (Wang et al. 2023b) | 0.754 | 0.782 | 0.795 | 0.783 | 0.747 | 0.755 | 0.731 | 0.777 | 0.835 | 0.763 | 0.772 | ||
| RADAR (Ours) | 0.794 | 0.803 | 0.832 | 0.805 | 0.784 | 0.769 | 0.758 | 0.811 | 0.872 | 0.797 | 0.813 | ||
| 70% | RGB | PADiM (Defard et al. 2021b) | 0.485 | 0.477 | 0.580 | 0.510 | 0.541 | 0.556 | 0.478 | 0.502 | 0.543 | 0.397 | 0.485 |
| PatchCore (Roth et al. 2022a) | 0.477 | 0.483 | 0.579 | 0.521 | 0.534 | 0.549 | 0.501 | 0.509 | 0.552 | 0.416 | 0.493 | ||
| STFPM (Wang et al. 2021b) | 0.527 | 0.538 | 0.615 | 0.557 | 0.551 | 0.572 | 0.514 | 0.553 | 0.610 | 0.478 | 0.548 | ||
| 3D | Depth GAN (Bergmann et al. 2022b) | 0.379 | 0.384 | 0.415 | 0.405 | 0.398 | 0.430 | 0.351 | 0.380 | 0.487 | 0.387 | 0.379 | |
| 3D-ST (Bergmann and Sattlegger 2023b) | 0.554 | 0.558 | 0.658 | 0.587 | 0.553 | 0.591 | 0.532 | 0.558 | 0.637 | 0.502 | 0.558 | ||
| FPFH (Horwitz and Hoshen 2022) | 0.568 | 0.565 | 0.642 | 0.588 | 0.574 | 0.604 | 0.544 | 0.574 | 0.641 | 0.519 | 0.575 | ||
| RGB+3D | PatchCore+FPFH (Horwitz and Hoshen 2022) | 0.610 | 0.617 | 0.691 | 0.627 | 0.635 | 0.652 | 0.593 | 0.622 | 0.696 | 0.585 | 0.636 | |
| M3DM (Wang et al. 2023b) | 0.613 | 0.620 | 0.689 | 0.634 | 0.636 | 0.647 | 0.594 | 0.629 | 0.702 | 0.578 | 0.639 | ||
| RADAR (Ours) | 0.653 | 0.624 | 0.723 | 0.670 | 0.661 | 0.705 | 0.630 | 0.645 | 0.741 | 0.617 | 0.684 | ||
| Missing rate | Methods | Eyecandies dataset | ||||||||||
| Candy Cane | Chocolate Cookie | Chocolate Praline | Confetto | Gummy Bear | Hazelnut Truffle | Licorice Sandwich | Lollipop | Marsh -mallow | Papermint Candy | Mean | ||
| 30% | PatchCore+FPFH (Horwitz and Hoshen 2022) | 0.773 | 0.797 | 0.676 | 0.836 | 0.738 | 0.589 | 0.782 | 0.743 | 0.843 | 0.817 | 0.748 |
| AST (Rudolph et al. 2023) | 0.752 | 0.794 | 0.641 | 0.832 | 0.707 | 0.561 | 0.746 | 0.730 | 0.819 | 0.796 | 0.724 | |
| M3DM (Wang et al. 2023b) | 0.787 | 0.812 | 0.687 | 0.857 | 0.743 | 0.578 | 0.776 | 0.762 | 0.857 | 0.823 | 0.754 | |
| RADAR (Ours) | 0.832 | 0.841 | 0.735 | 0.891 | 0.774 | 0.624 | 0.812 | 0.810 | 0.894 | 0.876 | 0.805 | |
| 50% | PatchCore+FPFH (Horwitz and Hoshen 2022) | 0.719 | 0.758 | 0.654 | 0.732 | 0.664 | 0.503 | 0.694 | 0.703 | 0.809 | 0.741 | 0.661 |
| AST (Rudolph et al. 2023) | 0.695 | 0.716 | 0.626 | 0.743 | 0.645 | 0.482 | 0.677 | 0.681 | 0.765 | 0.726 | 0.636 | |
| M3DM (Wang et al. 2023b) | 0.724 | 0.747 | 0.651 | 0.760 | 0.672 | 0.501 | 0.706 | 0.717 | 0.805 | 0.759 | 0.668 | |
| RADAR (Ours) | 0.768 | 0.779 | 0.682 | 0.816 | 0.703 | 0.568 | 0.745 | 0.749 | 0.836 | 0.815 | 0.732 | |
| 70% | PatchCore+FPFH (Horwitz and Hoshen 2022) | 0.653 | 0.662 | 0.587 | 0.672 | 0.571 | 0.456 | 0.656 | 0.607 | 0.701 | 0.687 | 0.603 |
| AST (Rudolph et al. 2023) | 0.638 | 0.612 | 0.576 | 0.643 | 0.554 | 0.409 | 0.627 | 0.573 | 0.687 | 0.683 | 0.578 | |
| M3DM (Wang et al. 2023b) | 0.652 | 0.649 | 0.592 | 0.697 | 0.583 | 0.449 | 0.653 | 0.599 | 0.726 | 0.701 | 0.611 | |
| RADAR (Ours) | 0.716 | 0.725 | 0.635 | 0.754 | 0.638 | 0.504 | 0.702 | 0.668 | 0.778 | 0.762 | 0.676 | |
Comparison with other methods tackleing modality-incomplete issue
In the main paper, we primarily focused on comparing the performance of our method against the current leading industrial anomaly detection models in the MIIAD task. To highlight the advanced nature of our approach to handling modality-incomplete instruction, we conducted comparative experiments with other methods designed to tackle the issue of modality-missing. The methods compared are as follows:
SMIL (Ma et al. 2021b) incorporates Bayesian meta-learning to explore the potential feature space, aiming to align the features of an incomplete mode with those of a complete mode.
GMC (Poklukar et al. 2022) has devised a geometric multimodal contrastive learning approach to tackle the challenge of inherent heterogeneity in multimodal learning.
RMT (Ma et al. 2022b) addresses various modality-missing scenarios through automatic search and incorporates task tokens to optimize cross-modal.
VLMo (Bao et al. 2022) introduces a hybrid multimodal expert model that leverages both the Dual Encoder for image retrieval tasks and the Fusion Encoder for multimodal encoding.
ShaSpec (Wang et al. 2023a) has devised a ”Shared Specific Feature Modeling” method focused on learning shared and specific features across multimodal data to address missing modality representations.
Tab. 11 displays the experimental results, highlighting that our modality-incomplete instruction significantly outshines recent methods designed to tackle modality-missing issues. Taking our top-performing input-level instruction as an example, it boasts an average P-AUROC metric that is , , and higher than the runner-up, ShaSpec (Wang et al. 2023a), at 3D point cloud modality missing rates of , , and , respectively. This underscores the superiority and robustness of our approach.
Detailed comparisons with more RGB-only, 3D-only, and RGB+3D methods
We conducted comparative experiments with RGB-only IAD models, which use only 2D information, and 3D-only IAD models, which rely solely on depth information. Tab. 12 showcases more detailed results. It can be seen that the performance of RGB-only and 3D-only models has shown a significant decline on our MIIAD dataset, with our method performing the best among them.
Modality-incomplete industrial anomaly detection results on Eyecandies dataset
To demonstrate the broad applicability of our method, we also conducted experiments on the Eyecandies dataset (Bonfiglioli et al. 2022). The experimental results are shown in the Tab. 13. As can be seen from the table, our method still performs competitively on the Eyecandies dataset with more complex cases, outperforming other models.
Additional Visualization Results
As depicted in Fig. 7, we present additional industrial anomaly results for all categories within the MIIAD Dataset. As can be seen from the figure, for each category of the dataset, our model can identify abnormal industrial entities while accurately locating the position of anomalies.