Exploring the Influence of Residential Electric Vehicle Charging on Distribution System Hosting Capacity - A Case-Study in Arizona
Abstract
The installation of high-capacity fast chargers for electric vehicles (EVs) is posing a significant risk to the distribution grid as the increased demand from widespread residential EV charging could exceed the technical limits of the distribution system. Addressing this issue is critical, given that current infrastructure upgrades to enhance EV hosting capacity are both costly and time-consuming. Moreover, the inherent uncertainties associated with EV charging parameters make it challenging for power utilities to accurately assess the impact of EVs added to specific locations. To address these knowledge gaps, this study (a) introduces an algorithm to coordinate residential EV charging, and (b) proposes a comprehensive framework that evaluates all transformers within a feeder. The proposed method is applied to a real-world feeder, which includes 120 transformers of varying capacities. The results demonstrate that this approach effectively manages a substantial number of EVs without overloading any of the transformers, while also pinpointing locations that must be prioritized for future upgrades. This framework can serve as a valuable reference for utilities when conducting distribution system evaluations for supporting the growing EV penetration.
keywords:
Charging coordination , Electric vehicle , EV Charging , Hosting capacity , Residential charging[inst1]organization=School of Electrical, Computer, and Energy Engineering, addressline=Arizona State University, city=Tempe, postcode=85281, state=AZ, country=USA
[inst2]organization=Salt River Project (SRP), addressline=6504 East Thomas Road, city=Scottsdale, postcode=85251, state=AZ, country=USA
Introduced a framework to assess EV hosting capacity on distribution feeders, utilizing real AMI data for accurate system behavior analysis.
The coordination model optimizes EV charging schedules by considering charger types, availability, and peak demand, to reduce customer costs and preventing transformer overloads.
The study enables utilities to determine the maximum number of EVs each transformer can support, including a confidence rate to account for the problem’s stochastic nature, enhancing understanding of system reliability and grid flexibility.
1 Introduction
The global rise in Electric Vehicle (EV) adoption is primarily motivated by the urgent need to mitigate the greenhouse gas effects and reduce air pollution [1]. Traditional internal combustion engine (ICE) vehicles are considered as one of the major contributors to these environmental issues due to their emissions of greenhouse gasses and pollutants [2]. As such, the transition to EVs offers a promising solution for reducing the environmental footprint of transportation [3].
1.1 Motivation
The expected rise in EV adoption is prompting power utilities to prepare for a significant uptick in EV ownership. For instance, Salt River Project (SRP), a power utility in Arizona, anticipates supporting approximately one EV for every two households by 2035. In addition to environmental consciousness, this surge is being fueled by declining battery prices and various incentives, which has resulted in nearly a doubling of the number of personal EVs in recent years [4]. However, since 84% of EV owners in the United States (U.S.) charge their vehicles at home [5], this trend is underscoring the importance of managing residential charging in the EV ecosystem.
1.2 Related Works
Several studies have been conducted to examine the impact of EVs on distribution systems and to propose solutions to manage the associated increase in load. Uncoordinated charging of EVs, such as charging at 16A, has been shown to escalate loading levels of distribution feeders and transformers, cause voltage deviations in residential networks, and necessitate infrastructure upgrades [6, 7, 8]. To address these challenges, [9] proposed a demand response mechanism based on transformer thermal loading to mitigate the negative effects without expanding the existing grid. Refs. [10, 11, 12] focused on transformer-side technical limits under high EV penetration and developed an optimization model for chargeable regions to maximize EV hosting capacity of distribution networks without causing technical issues. Similarly, studies in [13, 14, 15, 16, 17, 18, 19] address the specific challenge of integrating EV loads into distribution systems, with a mutual goal of assessing and enhancing hosting capacity. A key takeaway from these studies is that uncoordinated high-rate charging, particularly at 32A or higher, when adopted on a large scale in residential areas, would significantly worsen the identified issues. This highlights the need for conducting comprehensive investigations by distribution planners to quantify the impact of EV penetration and residential charging practices on the distribution system.
Although each study has addressed important aspects of EV charging challenges, a reasonable model that thoroughly evaluates a feeder and quantifies its hosting capacity is still missing. Furthermore, the absence of methods that incorporate a wide range of influencing factors, such as EV owner behavioral patterns, is notable. This is more so because understanding these behavioral patterns is critical for accurately determining charging requirements. For example, studies that evaluate the impact of different charging power assuming uniform driving patterns for all EV owners may not reflect reality where owners have individual charging preferences, schedules, and commuting habits.
In [20], the authors emphasized the importance of accounting for behavioral patterns in developing realistic EV load profiles and discussed the consequences of neglecting this factor. However, they assumed outdated chargers with fixed low charging power, whereas modern home chargers offer much higher power. This flexibility introduces a degree of freedom into the evaluation process that they did not consider. Additionally, factors such as the state-of-charge (SOC), play significant roles, further complicating the evaluation of charging impacts on the distribution transformer and eventually, the whole feeder. Treating these parameters independently, without considering their interactions, may not provide system planners with a comprehensive understanding of actual system conditions. Therefore, a holistic end-to-end approach is necessary to confidently assess the system, determine required upgrades, and prioritize locations to avoid potential overloading conditions.
1.3 Contributions of This Article
This paper seeks to address the limitations identified in previous studies by proposing a comprehensive framework that allows utilities to effectively evaluate feeders and determine their maximum hosting capacity for EVs. The framework integrates real-world data and models through a novel formulation to provide accurate and reliable insights.
One of the key strengths of this framework is its use of actual advanced metering infrastructure (AMI) data provided by SRP, rather than relying on synthetic data. By incorporating actual consumption patterns, the simulations deliver realistic insights into the grid’s capacity to handle the additional load from EVs. Furthermore, the framework leverages actual commuting data from U.S. drivers to accurately model EV owners’ behavioral patterns. This captures the realistic availability and unavailability of EVs for charging, which significantly influences the hosting capacity.
In addition to using actual data, the framework also accounts for key influencing factors, including charger types and peak demand patterns. This allows the optimization model to create efficient charging schedules that significantly reduce grid stress. As a result, the proposed framework can mitigate the need for costly infrastructure upgrades, while delivering the required power without overloading the transformers.
The proposed coordination model also identifies the optimal number of EVs that can be supported by each transformer. Given the stochastic nature of charging behaviors and grid conditions, the model associates the optimal number with a confidence rate, providing utilities with a reliable measure of system robustness. This approach not only considers individual factors, as previous studies have done, but also addresses the combined effects of multiple interacting variables, giving a more comprehensive understanding of EV integration into the grid.
The holistic framework offers utilities practical insights into the EV hosting capacity of the distribution system. It facilitates the integration of a large number of EVs without requiring significant infrastructure upgrades, while also identifying critical locations where transformer replacements may be necessary due to concentrated charging demands. The key contributions of this work are as follows:
-
1.
A framework is introduced to comprehensively evaluate the hosting capacity of distribution feeders, offering a practical solution for utilities.
-
2.
The framework relies on real AMI data, ensuring accurate assessments of system behavior under various scenarios, as opposed to relying on statistical models.
-
3.
The coordination model takes into account key factors such as EV availability, charger types, and peak demand. It optimizes charging schedules to minimize costs for customers while preventing overloading of the associated transformer.
-
4.
The study provides utilities with a method to determine the maximum number of EVs that each transformer can reliably support, along with a confidence rate to account for the stochastic nature of the problem, giving a clearer understanding of system reliability and grid flexibility.
By addressing these crucial areas, this work offers utilities a scalable and robust framework for assessing and managing EV hosting capacity in real-world distribution systems.
1.4 Organization of This Article
The remainder of this paper is organized as follows: Section 2 discusses the parameters that are critical to modeling an EV load profile. Section 3 gives a detailed description of the developed optimization models. Section 4 presents the proposed end-to-end algorithm for assessing all transformers within a given distribution system. Section 5 showcases the effectiveness of the proposed method and discusses insights derived from the results. The conclusions are provided in Section 6.
2 Problem Background
2.1 Type of Chargers
The rapid growth in EV adoption has brought about a critical need to understand the various types of available EV chargers, especially at the residential level. Level 1 chargers are the most basic type of EV chargers, and use a standard 120-volt AC outlet [21]. These chargers typically deliver between 1.4 kW and 1.9 kW of power, making them suitable for overnight charging. Due to their very slow charging speed, such types of chargers do not provide much flexibility in EV charging coordination.
Level 2 chargers operate on a 240-volt AC outlet, similar to what is used for large household appliances [22]. These chargers are capable of delivering from 2.5 kW to 19.2 kW of power, significantly reducing the time required to charge an EV compared to Level 1 chargers. Level 2 chargers are the most common choice for residential charging due to their balance of cost, installation requirements, and charging speed. These chargers typically come in slow (3.6 kW) and fast (7.2 kW) varieties. Slow chargers are more suitable for plug-in EVs, while fast chargers are more suitable for fully electric cars.
The efforts to further facilitate Level 2 charging at residential complexes has led to the introduction of a home charger called the Wall Connector by Tesla, which offers a range of charging powers from 2.8 kW to 11.5 kW [23]. This charger allows users to tailor charging speeds to their specific needs and electrical capabilities. Additionally, the Wall Connector is compatible with other types of EVs. The flexibility provided by devices such as the Wall Connector is critical because the impact of EV chargers on the distribution system is heavily influenced by the charging power.
2.2 Commuter Departure and Return Patterns
The travel behaviors of EV users and the precision of the probability distribution models that describe these behaviors are pivotal in forecasting the charging demands placed on the power grid. Traditional optimization-based coordination models for EV charging, as discussed in [18, 24, 25, 26], often fail to adequately consider the real-world connection and disconnection times that reflect the convenience preferences of EV owners. This gap can result in scenarios where EV owners are unable to charge their vehicles at the suggested times or opt to charge during peak demand hours due to personal energy needs. Such misalignments introduce uncertainties regarding the effectiveness of coordination schemes in preventing grid overloads as EV adoption increases.
To enhance the accuracy of the proposed scheme, real-world travel pattern data is incorporated from the National Household Travel Survey (NHTS) [27]. The NHTS provides detailed travel data for each vehicle, including trip start and end times, driving duration, distance, and parking duration. Additionally, it offers demographic information about the vehicle owners, such as age, gender, education, and income, enabling a nuanced analysis of travel behaviors across different user profiles. Prior research has already demonstrated that demographic factors such as age, education, and income significantly influence daily travel and energy consumption patterns [20]. Therefore, use of the NHTS dataset is critical in ensuring the realism of the study.
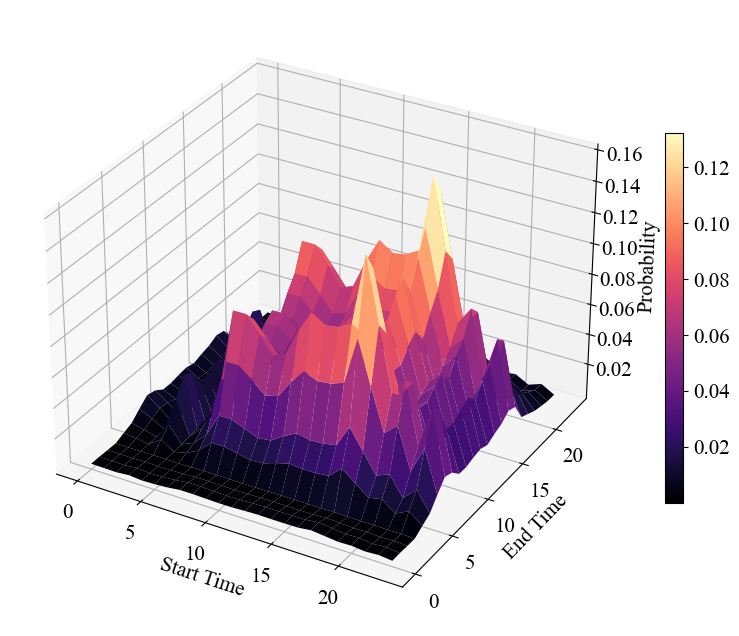
Let’s consider age as a representative demographic factor for EV owners. Then, using data on trip start and end times from the NHTS database, a joint probability mass function (PMF) can be developed, as depicted in Fig. 1. The developed PMF indicates that travel patterns vary significantly and are distributed throughout the day, and not confined to specific time intervals. By incorporating these insights, the goal is to create more effective and reliable EV charging coordination models that better align with the actual usage patterns of EV owners.
2.3 Type of EV
Given the different types of EVs, their battery capacity plays a significant role in assessing the impacts on the power grid. Fully electric cars typically have larger battery capacities to ensure a longer electric driving range, ranging from 30 kWh to over 100 kWh. These vehicles are designed to operate solely on electric power, relying entirely on their battery packs for propulsion. For instance, the Tesla Model 3 Long Range has a battery capacity of around 75 kWh [28], the Tesla Model S Long Range can have up to 100 kWh [29], while the Nissan Leaf offers battery capacities ranging from around 40 kWh to 62 kWh [30]. In contrast, plug-in hybrid EVs (PHEVs) generally have smaller battery capacities, ranging from 8 kWh to 20 kWh. For example, the Toyota Prius Prime has a battery capacity of about 13.6 kWh, while the RAV4 Prime has a battery capacity of around 18.1 kWh [31].
The proportion of each type of EV significantly impacts the assessment of a transformer’s load, as the required power to recharge an EV can vary greatly. At the same time, adoption rates and market shares highlight the competitive landscape and consumer preferences. As of October 2023, Tesla dominated the U.S. market with a 56% share, followed by Chevrolet and Ford with 5.9% and 5.8%, respectively [32]. However, determining the exact types of EVs connected to a specific transformer can be challenging when assessing an entire feeder. Following the power system principle of planning for the most realistic worst-case scenario, it is assumed for the case-study that all EVs are Tesla Model S vehicles with a battery capacity of 100 kWh. Considering this scenario ensures that the conclusions drawn from the analysis will hold under practical circumstances.
2.4 State of Charge (SOC)
The SOC is another critical component in modeling the charging behavior of EVs. It represents the current level of charge in the vehicle’s battery as a percentage of its total capacity. It directly affects the EV users’ charging requirements as lower SOC levels often necessitate longer charging sessions and higher power demands, which can significantly influence the total load on the power distribution system. At the same time, charging up to 100% is typically reserved only for occasions when maximum range is needed for longer trips, and not for daily commute.
Since all EVs in this study are assumed to be Tesla Model S, according to Tesla’s maintenance guidelines, it is advisable to recharge the battery before it falls below 20% [33]. These practices are based on the operational characteristics of Lithium-ion batteries, where extreme charge levels can stress the cells. Therefore, in this study which focuses on regular use, the goal is set to maintain battery SOC between 20% and 80%. Two different distributions are employed in this study to model SOC.
-
1.
Initial SOC: A uniform distribution is assumed, ranging between 20% and 30%, representing the typical SOC when EV owners begin charging. With the Tesla Model S’s energy consumption, including charging losses, estimated at 122 MPGe (or about 276 watt-hours per mile, equivalent to 3.6 miles per kWh), this range corresponds to the energy required for a commute of 72 to 108 miles—well above the average daily commute distance.
-
2.
Final SOC: A Chi-Squared distribution is used, peaking near 80% and tapering off towards 100%, reflecting the SOC levels typically set by EV owners after charging.
By using these distributions, the charging power for each EV is modeled realistically while also aligning with best practices for battery maintenance.
2.5 Pricing Plan
Power utilities have implemented various pricing strategies to manage increased load, especially during peak hours. One of the most popular strategies is the time-of-use (TOU) plan in which the price of electricity varies depending on the time-of-the-day. For example, SRP’s TOU plan (shown in Table 1 below) [34] divides the day into peak and off-peak periods and encourages its customers to operate heavy-load appliances during off-peak hours. In essence, the TOU plan accommodates higher residential demands while promoting energy conservation and cost efficiency.
| Season | Months | Time Period | Prices per kWh |
| Winter | Nov. through Apr. | 5 AM - 9 AM | 11.45¢ |
| 9 AM - 5 PM | 8.85¢ | ||
| 5 PM - 9 PM | 11.45¢ | ||
| 9 PM - 5 AM | 8.85¢ | ||
| Summer | May / June / Sept. / Oct. | 2 PM - 8 PM | 22.70¢ |
| 8 PM - 2 PM | 9.03¢ | ||
| Summer Peak | July / Aug. | 2 PM - 8 PM | 25.85¢ |
| 8 PM - 2 PM | 9.06¢ |
It can be observed from the table that SRP’s pricing plan varies significantly between the winter and peak-summer months which reflects the seasonal energy demand dynamics of Arizona. From November to April, rates are structured into three segments: a peak rate of 11.45 ¢ per kWh from 5 AM to 9 AM and 5 PM to 9 PM, while 8.85 ¢ per kWh is charged for the other hours. Conversely, during the peak summer months (July and August), when energy consumption typically spike due to very high air conditioning usage, a more aggressive rate structure is implemented. This includes rates of 9.06 ¢ per kWh from before 2 PM to after 8 PM, and a very high peak rate of 25.85 ¢ per kWh from 2 PM to 8 PM.
3 Proposed Formulation
In this section, an optimization model is designed to establish an effective charging schedule for EVs that minimizes costs while adhering to specific safety limitations and requirements. The primary concern is the potential strain on transformer capacity in residential areas, which is highly likely to be exceeded when multiple EVs are connected simultaneously for charging. Additionally, the cost of charging is a critical factor from the consumer’s perspective. Therefore, the proposed model aims to coordinate the charging process to minimize charging expenses of EV owners based on available pricing plans while ensuring none of the transformers get overloaded. The constrained optimization problem is outlined below:
| (1) |
subject to:
| (2) |
| (3) | |||
| (4) | |||
| (5) |
| (6) |
| (7) | |||
| (8) | |||
| (9) |
| (10) |
| (11) |
The objective function (1) minimizes the total charging cost for all EVs connected to a specified transformer. The parameter represents the given charging power, and is a binary variable indicating whether the EV is connected to the grid at time . The price of energy at time is denoted by (see Section 2.5), and determines the specific intervals during which each EV should be connected.
The constraints that must be met are outlined in (2)-(11). Here, represents a set of EVs, and is a set of time intervals, each with a duration of 15 minutes which results in a total of 96 intervals per day. The parameter is fixed at 96, indicating the index of the last interval, while specifies the minimum number of consecutive time slots an EV must remain connected, set at 4, which is equivalent to one hour. Constraint ensures that the combined load of household appliances and EV chargers does not exceed the transformer’s maximum capacity , with representing the aggregated household load at time .
Equations (3)-(5) aim to extend the battery life of EVs by regulating the frequency of changes in the charging status. In these equations, the binary variable tracks the number of switchings that occur between the two modes (namely, connected or disconnected) of the charging schedules. This regulation of the charging frequency plays a key role in managing the power drawn from the transformer, which affects the available capacity to integrate additional EV charger loads. As a result, the available capacity often necessitates connecting or disconnecting EVs from the grid to prevent overloading the transformer. Lastly, the parameters and are two arbitrary positive constants that satisfy (3) and (4). Simply put, if , then the binary decision variable must be set to 1. If not, should be applied to uphold these constraints.
Equations to ensure that there is no change in the charging status if the connection duration is less than one hour. Specifically, requires that each connection lasts for more than four time slots, while manages specific boundary conditions to prevent switching or initiating a new charging session if the remaining time slots are fewer than intervals. Constraint restricts the total number of switches so that it does not exceed a specified limit, . In this model, is assumed to be 4.
Equation is critical in the proposed model as it incorporates the daily commute patterns of EV owners into the proposed formulation. In (10), represents the time slots when an EV, specified by subscript , is not available at home and thus, cannot be connected for charging. By including this equation in the constraints, one ensures that there are no scheduling conflicts with the owner’s commuting times, leading to a seamless charging schedule. The final constraint, , is designed to ensure that all EVs meet their required final SOC by the end of the charging session. Here, represents the demand for each EV, identified by subscript .
The proposed formulation effectively integrates various practical considerations, such as transformer capacity limits, cost, and the daily routines of EV owners, to optimize the residential charging schedule.
4 Implementation Procedure
4.1 Feeder Evaluation
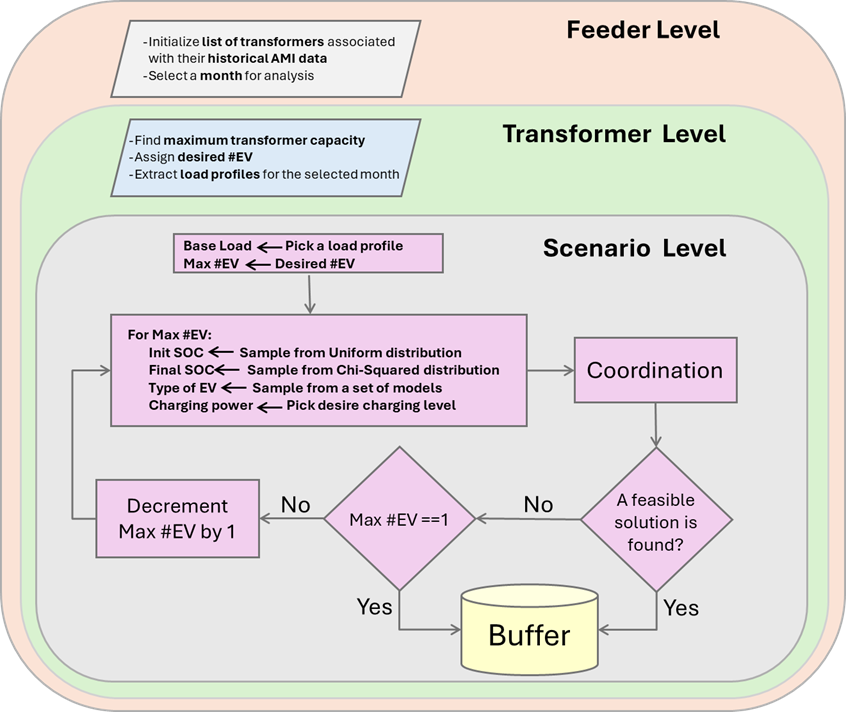
This subsection outlines the methodology (depicted pictorially in Fig. 2) that is used to evaluate a distribution feeder’s EV hosting capacity. The procedure is segmented into three distinct levels: Feeder, Transformer, and Scenario, with each representing a progressive stage in the evaluation process. The evaluation begins at the Feeder Level, where each transformer within the feeder is initialized with its corresponding historical AMI data. A specific month is selected for the evaluation to account for the variability in consumption levels across different days. This stage sets the foundation for more detailed analyses in the subsequent levels.
At the Transformer Level, the focus narrows down to the individual transformer. For each transformer, essential attributes such as its rated capacity and the maximum number of EVs it should support are determined. Additionally, daily load profiles for the designated month are extracted. This process is repeated for every transformer in the feeder.
The Scenario Level involves detailed exploration of specific load profiles, which begins by assigning a base load and estimating the maximum feasible number of EVs (Max #EV). For each potential scenario, the initial and final SOC are sampled (as detailed in Section 2.4), and a type of EV is selected from a predefined set (Tesla Model S for this case-study). While the algorithm can handle various charging powers, this case study focuses on two specific (charging power) levels: 7.2 kW and 11.5 kW. Subsequently, the coordination mechanism outlined in Section 3 is implemented to obtain the optimal EV charging schedule.
If a feasible solution is found, the number of EVs that can be accommodated is recorded. If not, the Max #EV is decremented by one, and the process is repeated to explore the feasibility of integrating a reduced number of EVs. This iterative process continues until it is determined whether even a single EV can be added without violating the system constraints. This structured approach allows for the detailed analysis and determination of the maximum hosting capacity for EVs at each transformer, providing valuable insights into the feeder’s overall capability to support EV charging demands.
4.2 Coordination in Practice
This subsection delves into the practical application of the proposed coordination mechanism which serves as a crucial component not only in feeder evaluation but also in the proactive management of transformer loads by utilities to prevent overloads. The first step involves obtaining specific information from EV owners. These include time for charging, current initial SOC, desired final SOC, and EV battery capacity. If such data are unavailable, appropriate values for them can be obtained from historical data, as explained in Section 2. The second step involves integrating this information with the day-ahead load forecasts to create likely loading scenarios. In the third and final step, the proposed optimization formulation is solved to produce the charging schedule. This schedule determines if and when an EV should be charged such that no transformer gets overloaded.
It is evident that deploying this coordination requires some infrastructural changes (e.g., sending timely emails/text messages to customers). However, these modifications are generally more cost-effective than the alternative of upgrading multiple transformers in a feeder. The proposed strategic approach not only optimizes existing infrastructure but also enhances overall efficiency and reliability of power distribution in the face of growing EV usage.
5 Simulation Results
5.1 Case-Study and Data Preparation
This case-study evaluates the hosting capacity of a distribution feeder managed by SRP, which consists of 120 transformers. As outlined in Section 2, several parameters significantly influence hosting capacity. To model the worst-case scenario, specific values for these parameters are identified. Modern chargers, such as the Tesla Wall Connectors, which provide higher charging powers of 7.2 kW and 11.5 kW, are considered in this analysis. For modeling infeasible time intervals, the joint PMF developed in Section 2.2 was utilized. All EVs in this analysis were assumed to be Tesla Model S vehicles with a battery capacity of 100 kWh, as described in Section 2.3. The initial and final SOC were modeled using uniform and chi-squared distributions, respectively, as discussed in Section 2.4. Lastly, this study employed SRP’s TOU pricing plan, with further details regarding this plan provided in Section 2.5.
5.2 Findings from AMI Data Analysis
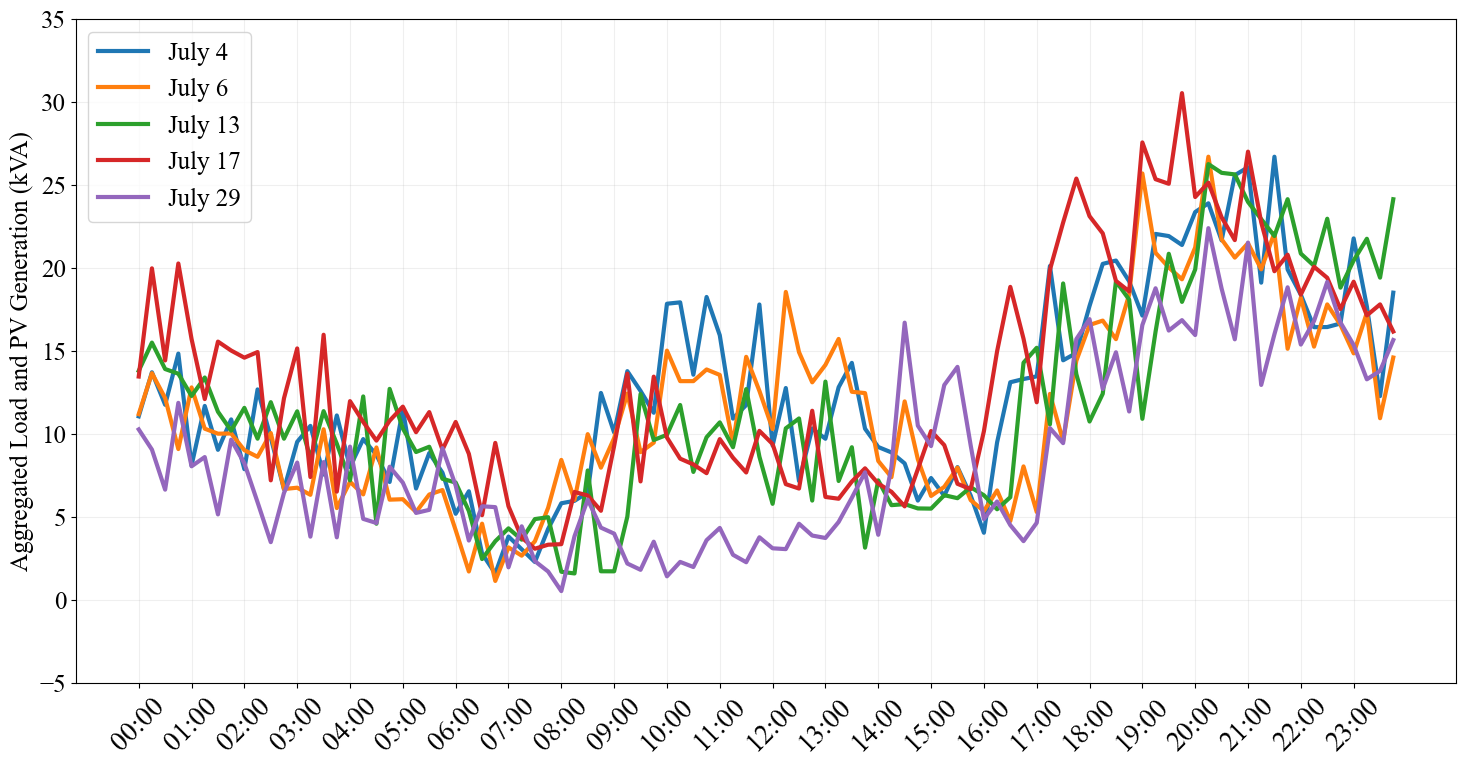
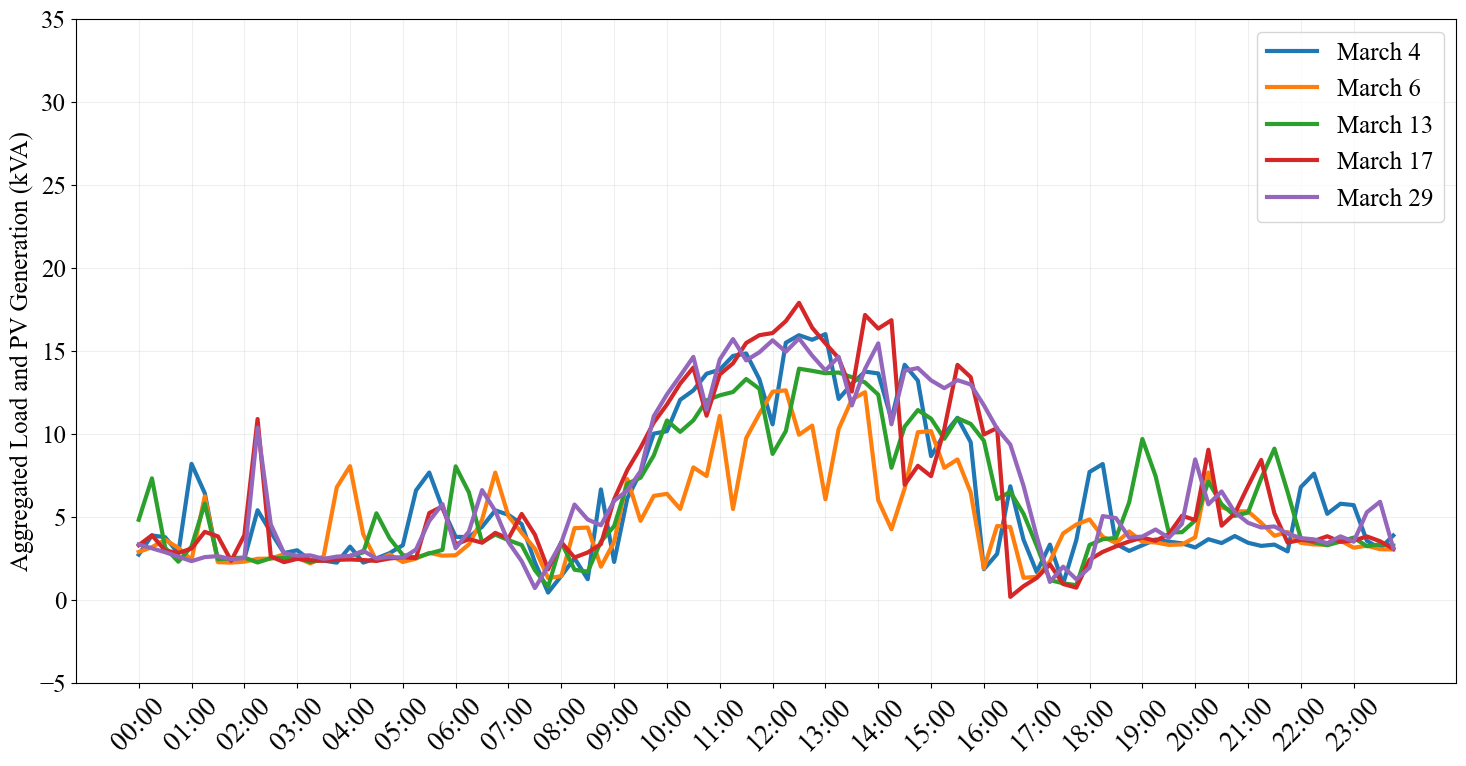
To thoroughly assess the impact of integrating EVs into the feeder, each month was analyzed individually. The results indicated that July had the highest electricity consumption, while March recorded the lowest. The latter was due to considerable duration of reverse power flows occurring in the feeder-under-analysis in that month because of the dominating presence of roof-top solar photovoltaic resources. Since the load profiles for other months fell between these two extremes, the focus of the study was placed on exploring the load profiles from July and March.
Figs. 3 and 4 display a few load profiles recorded in July and March, respectively. Each curve in these figures represents the total daily power drawn from a selected transformer highlighting peak usage periods. These visualizations also reveal significant fluctuations throughout the day which introduce uncertainty in evaluating the effectiveness of the coordination strategies. The recorded data shows a general trend of increasing load during the course of the day, with a peak in the afternoon or early evening—typical for residential and mixed-use areas due to higher activity during those hours. These consumption patterns further justify why minimizing charging costs is the primary objective of the proposed coordination formulation (see Section 3). By doing so, not only additional strain on the grid during peak hours is avoided, which is beneficial for utilities, but also it helps prevent higher costs, as owners are likely to shift EV demands to off-peak periods when electricity rates are lower.
5.3 Coordination Performance under Different Charging Power
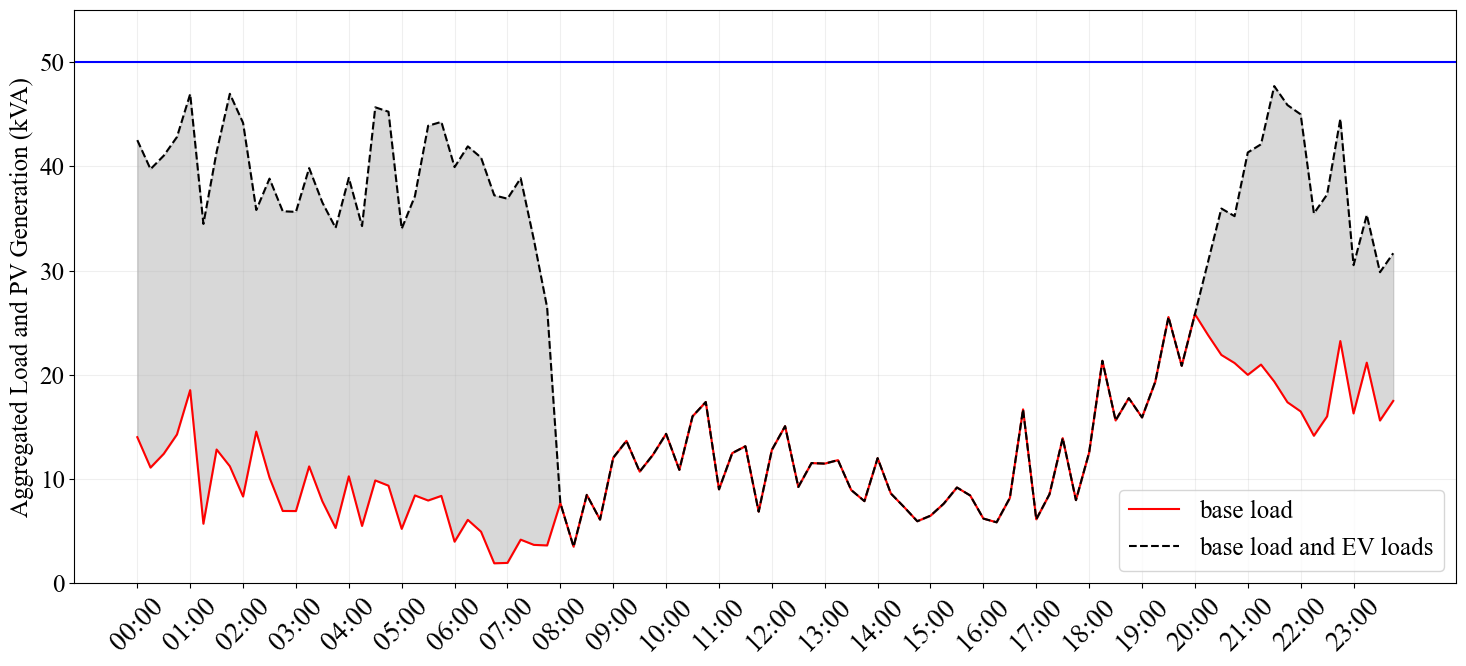
This section showcases the functionality of the proposed coordination method for a given scenario under different levels of charging power; the results are depicted in Figs. 5, 6, 7, and 8. The results correspond to a load profile from July for a transformer with a 50 kVA capacity. The primary objective was to determine the maximum number of EVs that could be supported under two different charging levels: 7.2 kW and 11.5 kW, while all other parameters were fixed. Particularly, it was assumed that the EVs could not be charged between 8 AM and 4 PM.
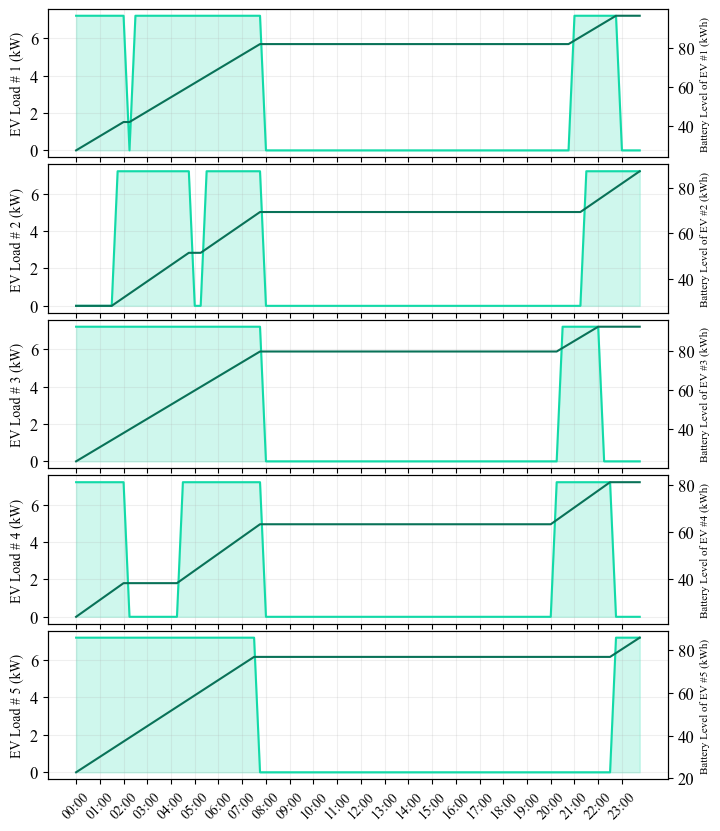
The simulation results, as illustrated in Fig. 5, analyze the power demand profile by combining the transformer load with the generated charging schedules for five EVs obtained using the coordination scheme. The associated charging sessions are displayed in Fig. 6, where five distinct step-shaped curves, labeled EV1 through EV5, illustrate the charging activities at 7.2 kW. Each curve denotes periods of active charging, marked by spikes, and disconnection periods, represented by flat lines at zero level, notably during assumed infeasible time intervals when no charging occurs. A dashed black line in Fig. 5 refers to the aggregate total demand from both the base load and the EV charger loads. Additionally, the dark green curves in each segment of Fig. 6 indicate the battery levels for each corresponding EV, providing a visual representation of battery consumption and recharge cycles. It is evident from Figs. 5 and 6 that the coordinated charging strategy not only effectively keeps the overall demand below the transformer’s maximum capacity, denoted by a solid blue line at 50 kVA, but also delivers the required energy to bring the battery levels to the assigned final SOC.
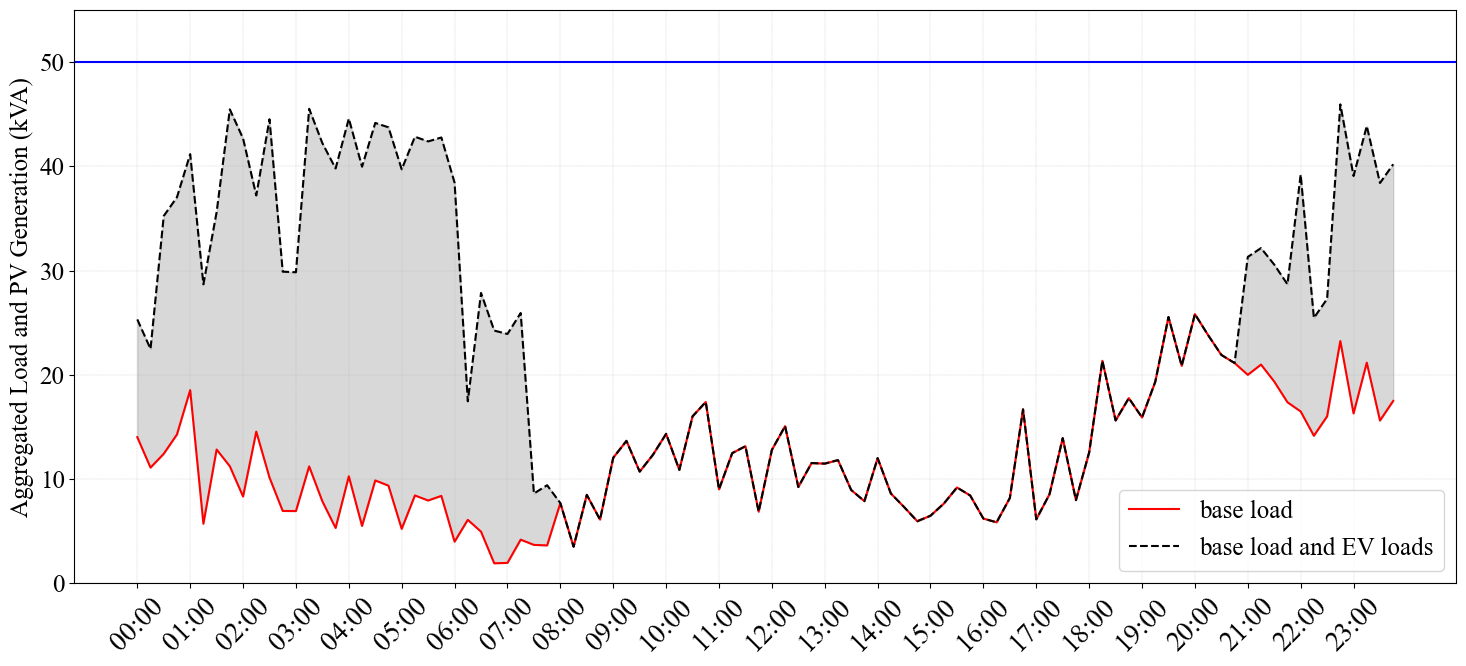
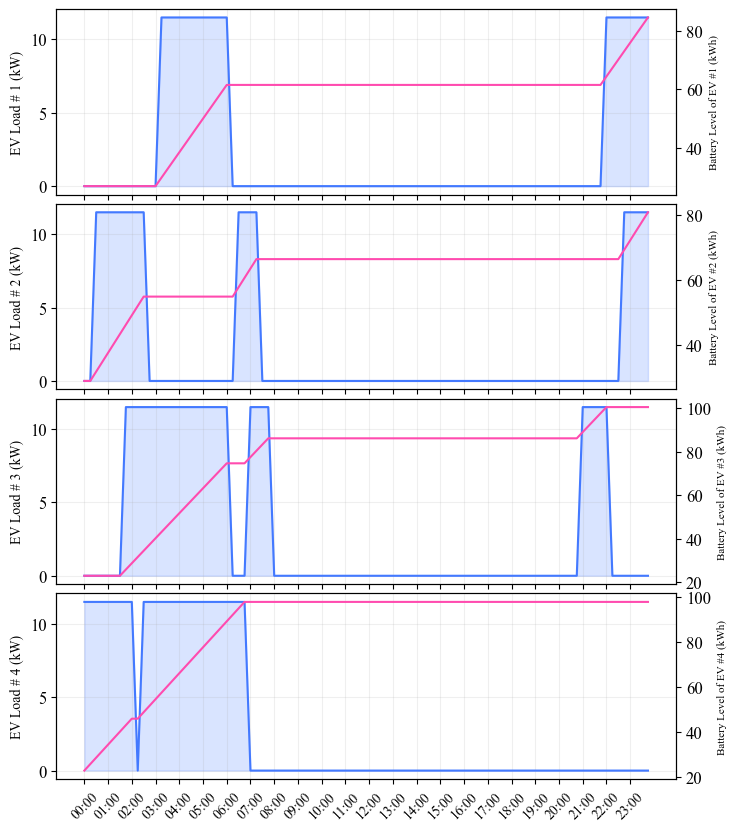
For the 11.5 kW charging power scenario, similar patterns and outcomes were observed, and they are depicted in Figs. 7 and 8. In Fig. 8, the charging sessions for each of the four EVs are characterized by more compressed charging windows due to the increased (charging) power.
The comparison between the two charging scenarios –7.2 kW and 11.5 kW – reveals a clear relationship between the charging power and the number of EVs that can be accommodated. At the lower power level of 7.2 kW, it is possible to support a higher number of EVs compared to the higher power level of 11.5 kW.. It is also observed that although a lower charging power allows for more EVs to be connected simultaneously, it also necessitates longer charging duration. Furthermore, the analysis indicates that the assumed unavailability of vehicles from 8 AM to 4 PM influences the results. If the non-availability period were shorter, the outcomes could differ markedly. This aspect is explored in the next section where actual commuting patterns are incorporated into the coordination model.
5.4 Feeder-level Evaluation
In this sub-section, a comprehensive overview of the impact of integrating a substantial number of EV chargers into the distribution system is provided. A total of 120 transformers with different capacity within the feeder were evaluated. To effectively summarize the extensive simulation data, the transformers were classified into two main capacity groups: 50 kVA and 75 kVA. However, as transformers within each group supply varying numbers of customers, another challenge arises in selecting among transformers with the same capacity and customer base. To address this issue and to capture the range of possible outcomes, transformers that exhibited the best and worst results within each capacity group were selected for detailed analysis.
For each selected transformer, 1,500 distinct scenarios were simulated for each month and charging power which amounts to a total of 3,000 simulations per transformer. These scenarios encompassed a variety of household energy consumption patterns, EV charging demands, and other influencing factors as detailed in Section 2. This approach not only considers the impact of each parameter but also models the interactive effects among them. Additionally, the desired number of EVs for each transformer was set to half the number of households it serves which aligns with SRP’s projection of one EV for every two houses by 2035.
The simulation results are summarized in Tables 2 and 3 for July, and Tables 4 and 5 for March. Each table presents the outcomes categorized into three columns for each charging power:
-
1.
Infeasibility: the percentage of scenarios where no valid coordination strategy was found to charge even one EV.
-
2.
Less #EV: the percentage of scenarios where the transformer could supply some EV charging demands but not the desired number of EVs.
-
3.
Desired #EV: the percentage of scenarios where the transformer successfully hosted the desired number of EVs.
| Trans Code | # Cust | # EV | Charging 7.2 kW (%) | Charging 11.5 kW (%) | ||||
| Infeasibility (%) | Less #EV | Desire #EV | Infeasibility | Less #EV | Desire #EV | |||
| 6 | 3 | 0 | 6.27 | 93.73 | 0 | 1.33 | 98.67 | |
| 7 | 4 | 0 | 100 | 0 | 0 | 100 | 0 | |
| 7 | 4 | 0 | 100 | 0 | 0 | 100 | 0 | |
| 8 | 4 | 0 | 10 | 90 | 0 | 1.4 | 98.6 | |
| 5 | 3 | 0 | 6.93 | 93.07 | 0 | 0.8 | 99.2 | |
| 6 | 3 | 0.13 | 6.87 | 93.13 | 0 | 0.5 | 99.4 | |
| 9 | 5 | 0.13 | 99.87 | 0 | 0 | 100 | 0 | |
| 10 | 5 | 53.33 | 46.67 | 0 | 53.33 | 46.67 | 0 | |
| 8 | 4 | 0 | 10.4 | 89.6 | 0 | 1.93 | 98.07 | |
| 5 | 3 | 0.07 | 7.6 | 92.33 | 0 | 2 | 98 | |
| Trans Code | # Cust | # EV | Charging 7.2 kW (%) | Charging 11.5 kW (%) | ||||
| Infeasibility (%) | Less #EV | Desire #EV | Infeasibility | Less #EV | Desire #EV | |||
| 9 | 5 | 0 | 11.33 | 88.67 | 0 | 1.27 | 98.73 | |
| 8 | 4 | 0 | 10.8 | 89.2 | 0 | 1.53 | 98.47 | |
| 11 | 6 | 0 | 13.6 | 86.4 | 0 | 3 | 97 | |
| 13 | 7 | 0.07 | 99.93 | 0 | 0 | 100 | 0 | |
| 15 | 8 | 0 | 23.33 | 76.67 | 0 | 23.33 | 76.67 | |
| 9 | 5 | 0 | 11.93 | 88.07 | 0 | 1.8 | 98.2 | |
| 10 | 5 | 0 | 13.67 | 86.33 | 0 | 1.67 | 98.33 | |
| 10 | 5 | 0 | 100 | 0 | 0 | 100 | 0 | |
| 14 | 7 | 0 | 15.6 | 84.4 | 0 | 2 | 97.93 | |
| 12 | 6 | 0 | 15.87 | 84.13 | 0 | 1.27 | 98.73 | |
| 13 | 7 | 0 | 100 | 0 | 0 | 100 | 0 | |
| 11 | 6 | 0 | 14.67 | 85.33 | 0 | 2.33 | 97.67 | |
| 12 | 6 | 0 | 100 | 0 | 0 | 100 | 0 | |
| 8 | 4 | 0 | 9.93 | 90.07 | 0 | 1.2 | 98.8 | |
| 15 | 8 | 26.67 | 73.33 | 0 | 26.67 | 73.33 | 0 | |
| 15 | 8 | 16.67 | 83.33 | 0 | 16.67 | 83.33 | 0 | |
| Trans Code | # Cust | # EV | Charging 7.2 kW (%) | Charging 11.5 kW (%) | ||||
| Infeasibility (%) | Less #EV | Desire #EV | Infeasibility | Less #EV | Desire #EV | |||
| 6 | 3 | 0 | 8.27 | 91.73 | 0 | 0.73 | 99.27 | |
| 7 | 4 | 0 | 11.53 | 88.47 | 0 | 1.27 | 98.73 | |
| 7 | 4 | 0 | 8.6 | 91.4 | 0 | 1.93 | 98.07 | |
| 8 | 4 | 0 | 7.8 | 92.2 | 0 | 1.27 | 98.73 | |
| 5 | 3 | 0 | 7.33 | 92.67 | 0 | 0.87 | 99.13 | |
| 6 | 3 | 0 | 6.07 | 93.93 | 0 | 1.13 | 98.87 | |
| 9 | 5 | 0 | 11.67 | 88.33 | 0 | 1.93 | 98.07 | |
| 10 | 5 | 0 | 11.73 | 88.27 | 0 | 1.53 | 98.47 | |
| 8 | 4 | 0 | 12.4 | 87.6 | 0 | 1.53 | 98.47 | |
| 5 | 3 | 0.07 | 7.26 | 92.67 | 0 | 1.2 | 98.8 | |
| Trans Code | # Cust | # EV | Charging 7.2 kW (%) | Charging 11.5 kW (%) | ||||
| Infeasibility (%) | Less #EV | Desire #EV | Infeasibility | Less #EV | Desire #EV | |||
| 9 | 5 | 0 | 11.47 | 88.53 | 1.53 | 0 | 98.47 | |
| 8 | 4 | 0 | 10.93 | 89.07 | 1.47 | 0 | 98.53 | |
| 11 | 6 | 0 | 12.47 | 87.53 | 2 | 0 | 98 | |
| 13 | 7 | 0 | 15.87 | 84.13 | 2.27 | 0 | 97.73 | |
| 15 | 8 | 0 | 19.73 | 80.27 | 2.73 | 0 | 97.27 | |
| 9 | 5 | 0 | 12 | 88 | 2.4 | 0 | 97.6 | |
| 10 | 5 | 0 | 11.07 | 88.93 | 1.53 | 0 | 98.47 | |
| 10 | 5 | 0 | 12.13 | 87.87 | 0 | 2.53 | 97.47 | |
| 14 | 7 | 0 | 17.67 | 82.33 | 0 | 2.53 | 97.47 | |
| 12 | 6 | 0 | 11.4 | 88.6 | 0 | 1.93 | 98.07 | |
| 13 | 7 | 0 | 16.73 | 83.27 | 0 | 2.33 | 97.67 | |
| 11 | 6 | 0 | 15.33 | 84.67 | 0 | 2.13 | 97.87 | |
| 12 | 6 | 0 | 15.47 | 84.53 | 0 | 1.8 | 98.2 | |
| 8 | 4 | 0 | 9.8 | 90.2 | 0 | 1.33 | 98.67 | |
| 15 | 8 | 0 | 19.4 | 80.6 | 0 | 3.2 | 96.8 | |
| 15 | 8 | 0 | 18.2 | 81.8 | 0 | 2.73 | 97.27 | |
Consider the row labeled in Table 2 for an example of how the data is presented. This transformer serves 6 households implying that the desired number of supported EVs is 3. Under the 7.2 kW charging scenario, the table lists no instances of infeasibility (0%), indicating that all households could potentially charge one EV. However, in 6.27% of scenarios, fewer than the desired three EVs could be charged, while in 93.73% of the cases, the model successfully generated viable charging schedules that accommodated all 3 EVs. This suggests that for most scenarios under this charging power, the transformer can handle the load of three EVs without any issues.
5.5 General Observations and Comparative Analysis
In this subsection, the key insights and observations derived from the simulation results (Tables 2-5) are discussed, focusing on the impact of EV charging across different months and transformers.
5.5.1 Seasonal Variations in EV Hosting Capacity
One notable trend is the greater success rate for accommodating a higher number of EVs in March compared to July. This pattern is particularly evident when comparing transformers and in Tables 3 and 5. The improved performance in March can be linked to a lower overall transformer load, as shown by the historical AMI data in Figs. 3 and 4. Conversely, the higher loads experienced in July frequently compromise the system’s ability to meet the desired EV hosting capacity, highlighting the impact of increased seasonal demand.
5.5.2 Transformer Performance Variability
Transformer performance varies notably, particularly evident in transformers and from Table 3, which show lower success rates. This discrepancy is mainly due to the large numbers of customers these two transformers serve which significantly impacts their potential EV hosting capacity. The difference in performance between and which have the same capacities and customer numbers highlights the need for individual evaluations.
Additionally, the infeasibility ratios for and in Table 2 show significant differences, even though the only variable is that serves one additional household compared to . Such observations highlight the importance of considering unique historical usage data and customer patterns, which may differ across various zip codes, to optimize each transformer’s performance. Given these observations, it is recommended that transformers , , and should be prioritized for upgrades to enhance their EV hosting capacity.
5.5.3 Impact of Different Charging Power: 7.2 kW vs. 11.5 kW
A detailed analysis of different charging levels reveals an interesting pattern: the hosting capacity at the higher charging level of 11.5 kW is generally better than at 7.2 kW. This is contrary to the initial observation outlined in Section 5.3, which suggests that lower charging power could better accommodate more EVs due to reduced strain on transformers. For instance, in Table 5 exhibits a success rate of 97.27% for the desired number of EVs at 11.5 kW, which drops significantly to 80.27% at 7.2 kW. This discrepancy stems from a more realistic modeling of commuting patterns, moving away from the static assumptions such as EV unavailability during typical work hours (8 AM to 4 PM). The subsequent case-studies considered personalized commuting behaviors by using the developed joint PMF (see Fig. 1). The distributions in that figure showed varied vehicle availability that do not necessarily coincide with peak electricity demand hours. This results in shorter, more sporadic charging windows. Consequently, the higher charging power of 11.5 kW proves more effective, enabling faster charging during these limited windows.
However, this comes with a challenge: while higher charging power enhances hosting capacity, it simultaneously pushes transformers closer to their operational limits, potentially leading to long-term wear. Therefore, trade-off lies in balancing the maximization of hosting capacity with the minimization of strain on the electrical infrastructure. These insights underscore the complexity of integrating EV charging into residential settings and emphasize the underlying importance of incorporating dynamic user behavior and realistic commuting patterns into effective grid planning and optimization strategies.
6 Conclusion
The study has illuminated critical insights into the EV hosting capacity of residential power grids under varying operating conditions. The effectiveness of the proposed coordination algorithm was evident since it was able to manage substantial EV integration without requiring immediate transformer upgrades, while also pinpointing units that should be given priority (for upgrading) in the future. Seasonal dynamics were also found to play a pivotal role, with March demonstrating superior EV load accommodation compared to July. This observation reflects the impact that broader consumption patterns and environmental factors have on EV hosting capacity. Moreover, in contrast to expectations, higher charging power (11.5 kW) notably enhanced hosting capacity over lower charging levels (7.2 kW), aligning closely with the current trend of developing higher-power chargers. Lastly, the variability in transformer performance across simulations highlighted the intricate interplay of transformer capacity, customer density, and load characteristics, advocating for individualized transformer assessments.
In summary, the proposed coordination mechanism offers a systematic approach for utilities to manage EV loads dynamically, ensuring transformer health and system reliability while accommodating the future growth of EV usage. The findings of this case-study underscore the necessity of behavioral modeling and targeted infrastructure upgrades to sustainably support increasing EV adoption.
References
- [1] T. Yuvaraj, K. Devabalaji, J. A. Kumar, S. B. Thanikanti, N. Nwulu, A comprehensive review and analysis of the allocation of electric vehicle charging stations in distribution networks, IEEE Access (2024).
- [2] I. Veza, M. Z. Asy’ari, M. Idris, V. Epin, I. R. Fattah, M. Spraggon, Electric vehicle (ev) and driving towards sustainability: Comparison between ev, hev, phev, and ice vehicles to achieve net zero emissions by 2050 from ev, Alexandria Engineering Journal 82 (2023) 459–467.
- [3] D. Mehlig, I. Staffell, M. Stettler, H. ApSimon, Accelerating electric vehicle uptake favours greenhouse gas over air pollutant emissions, Transportation Research Part D: Transport and Environment 124 (2023) 103954.
-
[4]
International Energy Agency, Electric Vehicles (2022).
URL https://www.iea.org/reports/electric-vehicles -
[5]
J. D. Power, Electric vehicle owners have higher satisfaction with “next level” home chargers (2022).
URL https://www.jdpower.com/electric-vehicles - [6] M. Muratori, Impact of uncoordinated plug-in electric vehicle charging on residential power demand, Nature Energy 3 (3) (2018) 193–201.
- [7] S. Tirunagari, M. Gu, L. Meegahapola, Reaping the benefits of smart electric vehicle charging and vehicle-to-grid technologies: Regulatory, policy and technical aspects, IEEE Access 10 (2022) 114657–114672.
- [8] A. Srivastava, M. Manas, R. K. Dubey, Integration of power systems with electric vehicles: A comprehensive review of impact on power quality and relevant enhancements, Electric Power Systems Research 234 (2024) 110572.
- [9] P. Pradhan, I. Ahmad, D. Habibi, G. Kothapalli, M. A. Masoum, Reducing the impacts of electric vehicle charging on power distribution transformers, IEEE Access 8 (2020) 210183–210193.
- [10] K. Qian, C. Zhou, Y. Yuan, Impacts of high penetration level of fully electric vehicles charging loads on the thermal ageing of power transformers, International Journal of Electrical Power & Energy Systems 65 (2015) 102–112.
- [11] J. Zhao, J. Wang, Z. Xu, C. Wang, C. Wan, C. Chen, Distribution network electric vehicle hosting capacity maximization: A chargeable region optimization model, IEEE Transactions on Power Systems 32 (5) (2017) 4119–4130.
- [12] T. Aljohani, M. A. Mohamed, O. Mohammed, Tri-level hierarchical coordinated control of large-scale evs charging based on multi-layer optimization framework, Electric Power Systems Research 226 (2024) 109923.
- [13] Z. Liu, Z. Qin, Real-time coordination for grid-friendly community-level electric vehicle charging based on discrete state by enhanced hysteresis model incorporating electricity price, Electric Power Systems Research 220 (2023) 109269.
- [14] M. J. Rana, F. Zaman, T. Ray, R. Sarker, Ev hosting capacity enhancement in a community microgrid through dynamic price optimization-based demand response, IEEE Transactions on Cybernetics (2022).
- [15] M. S. H. Nizami, M. Hossain, K. Mahmud, A coordinated electric vehicle management system for grid-support services in residential networks, IEEE Systems Journal 15 (2) (2020) 2066–2077.
- [16] W. Dai, C. Wang, H. H. Goh, J. Zhao, J. Jian, Hosting capacity evaluation method for power distribution networks integrated with electric vehicles, Journal of Modern Power Systems and Clean Energy 11 (5) (2023) 1564–1575.
- [17] J. Then, A. P. Agalgaonkar, K. M. M. Muttaqi, Hosting capacity of an australian low-voltage distribution network for electric vehicle adoption, IEEE Transactions on Industry Applications (2023).
- [18] C. Domínguez, A. Doña, A. Navarro-Espinosa, Is single-phase residential ev fast-charging a good idea? evidence from optimal charging plans based on realistic data, International Journal of Electrical Power & Energy Systems 152 (2023) 109231.
- [19] H. Yu, X. Lei, S. Niu, Z. Shao, L. Jian, Enhancing electric vehicle penetration and grid operation performance in old residential communities through hybrid ac/dc microgrid reconstruction, Applied Energy 347 (2023) 121459.
- [20] J. Zhang, J. Yan, Y. Liu, H. Zhang, G. Lv, Daily electric vehicle charging load profiles considering demographics of vehicle users, Applied Energy 274 (2020) 115063.
- [21] M. Z. Zeb, K. Imran, A. Khattak, A. K. Janjua, A. Pal, M. Nadeem, J. Zhang, S. Khan, Optimal placement of electric vehicle charging stations in the active distribution network, IEEE Access 8 (2020) 68124–68134.
- [22] S. S. Sayed, A. M. Massoud, Review on state-of-the-art unidirectional non-isolated power factor correction converters for short-/long-distance electric vehicles, IEEE Access 10 (2022) 11308–11340.
-
[23]
Tesla, Wall Connector Introduction (2024).
URL https://www.tesla.com/support/charging/wall-connector - [24] S. Nazari, F. Borrelli, A. Stefanopoulou, Electric vehicles for smart buildings: A survey on applications, energy management methods, and battery degradation, Proceedings of the IEEE 109 (6) (2020) 1128–1144.
- [25] J. Quirós-Tortós, L. F. Ochoa, S. W. Alnaser, T. Butler, Control of ev charging points for thermal and voltage management of lv networks, IEEE Transactions on Power Systems 31 (4) (2015) 3028–3039.
- [26] Z. Xu, W. Su, Z. Hu, Y. Song, H. Zhang, A hierarchical framework for coordinated charging of plug-in electric vehicles in china, IEEE Transactions on Smart Grid 7 (1) (2015) 428–438.
-
[27]
U.S. Department of Transportation, Federal Highway Adminstration, National Household Travel Survey (2022).
URL https://nhts.ornl.gov -
[28]
Tesla, Tesla Model Y (2024).
URL https://ev-database.org/car/1183/Tesla-Model-Y-Performance -
[29]
Tesla, Tesla Model S (2024).
URL https://ev-database.org/car/1404/Tesla-Model-S-Dual-Motor -
[30]
Nissan, 2025 Nissan Leaf Features (2024).
URL https://bit.ly/3SizXoQ -
[31]
Toyota, Toyota PHEVs (2024).
URL https://www.toyota.com -
[32]
Market Watch, Electric Vehicle Statistics 2024 (2024).
URL https://www.marketwatch.com/guides/insurance-services/electric-vehicle-statistics-2024/ -
[33]
Tesla, Range Tips (2024).
URL https://www.tesla.com/support/range -
[34]
SRP, SRP Time-of-Use Price Plan (2024).
URL https://www.srpnet.com/price-plans/residential-electric/time-of-use